- Advanced Microscopy Facility Vienna Biocenter Core Facilties (VBCF), Vienna Bicenter, Vienna, Austria
Brillouin Light Scattering (BLS) spectroscopy allows for the all-optical measurement of the hypersonic velocities in a sample, from which one can extract high-frequency elastic moduli. Recent advances in high resolution optical imaging spectrometers have made it conducive to studying live biological samples and further its implementation as an imaging modality for the life sciences. One major challenge in this context is the relatively weak BLS signal together with the subtle BLS spectral variations observed in many biological samples. Here we show that using spectral phasor analysis one can more easily distinguish variations in noisy spectra compared to standard least-squares (LS) fitting. There is no fitting in phasor analysis, and it is both robust in regards to unaccounted for functional variations in the spectra, and orders of magnitude faster than LS-fitting. As such it can prove particularly useful for increasing contrast in Brillouin imaging as well as for high-throughput BLS applications such as cell-sorting and medical diagnostics especially for statistically compromised or noisy data.
Introduction
Brillouin Light Scattering (BLS) is the inelastic scattering of light from acoustic phonons in a material [1, 2]. In BLS spectroscopy the dynamics of these phonons can be measured from their inelastic scattering peaks which occur at small frequency shifts ω = ω B ~ 5 − 15 GHz relative to the probing laser frequency. For a given scattering vector the peaks may to the lowest order be assumed to be Lorentzian or a simple harmonic oscillator, with a Full Width at Half Maximum (FWHM) ΔωB, dictated by the respective phonon dispersion relation in the material. In particular the acoustic (phonon) velocity and attenuation can be calculated from a given spectra via [3]:
were Vi is the longitudinal or transverse phonon velocity, n is the refractive index, λ0 is the free-space wavelength, α is the acoustic attenuation coefficient, and θ is the scattering angle relative to the probing angle. In the commonly used back scattering geometry (θ ~ 180o), light will only couple to longitudinal phonons giving rise to a single set of BLS peaks on either side of the elastic scattering peak (the so-called Brillouin doublet) as shown in Figure 1A. In this geometry one can extract the complex longitudinal modulus M = M′ + M″i via M′ = V2ρ and , where ρ is the mass density.
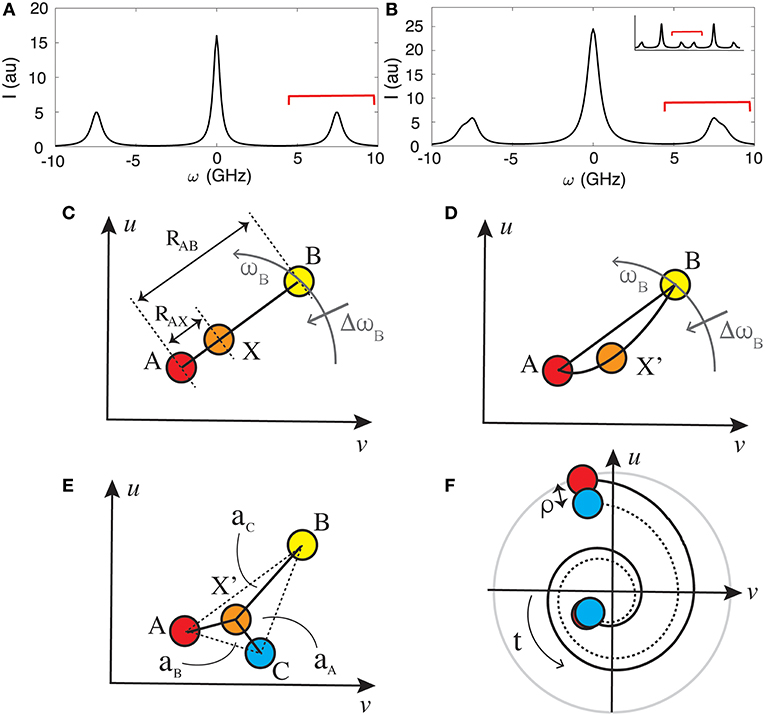
Figure 1. Stokes and anti-Stokes BLS peaks on either side of elastic scattering peak (at ω = 0) for (A) a single effective mechanical component (probed acoustic phonon velocity) in the scattering volume, and (B) a mixture consisting of two components in the scattering volume. Red bars indicate spectral regions that may be considered for spectral phasor analysis. (C) An example phasor plot showing the phasors that would be obtained for two single component samples (A and B) and a mixture (X) consisting of both components when the resulting spectra is a linear combination of the constitutive components. The phasor X will trace a line between A and B, with the ratio RAX/RAB equal to the relative fraction of A. (D) Same as (C) but for the case when the effective acoustic velocity in the mixture X' are not a linear combination of the constitutive components. (E) Phasor plot for a 3-component mixture X' when the BLS spectra is a linear combination of three components. The relative concentrations of each can be calculated if one knows the phasor of the individual components as described in main text. (F) Evolution of a phasor subject to a perturbation (e.g., temperature) can reveal variations between BLS spectra of complex mixtures not observable from LS fitting which assume a given functional dependence of the spectral profile.
Over the last decade there has been a renewed interest in BLS microspectroscopy/microscopy for studying biological systems and medical diagnostics [4–9]. This has to an extent been driven by advancements in spectrometer design [4, 5] which can allow for faster spatial mapping, together with mounting evidence of the import role that mechanical properties play in various biological processes [10] and the onset of pathological conditions [11]. With the desire to maximally reduce acquisition times (e.g., for fast Brillouin imaging of dynamic biological samples) and laser exposure (to minimize phototoxicity/damage in the sample), one is often working with statistically compromised spectra, the fitting of which can be very sensitive to initial parameters and assumed fitting function. This is compounded by the observation that BLS peak variations within biological samples are often very subtle.
In practice the position and shape of the BLS peaks may be perturbed in complex biological samples, setting limitations on functional fitting analysis methods. For examples, due to the steep dispersion curve of acoustic phonons, the frequency shift has a significant angular (wavevector) dependence (Equation 1), which would result in asymmetric broadening of the peak for high numerical aperture (high spatial resolution) measurements. The exact functional form of the broadening can become non-trivial especially in mechanically anisotropic materials where the dispersion is dependent on the vector direction of the probed phonons. Additional broadening resulting from multiple-scattering events can also be expected to become significant in non-transparent biological samples [12, 13]. Finally, when the probing volume contains more than one distinct structure that is larger than the characteristic phonon length scale, the measured spectrum will consist of a superposition of BLS peaks, which can prove challenging to fit if they are closely spaced or the number of components unclear (an example of a spectra from such a two-component material is shown in Figure 1B).
Here we investigate the merits of Spectral Phasor Analysis (SPA) as compared to Least Squares (LS) fitting for analyzing simulated BLS data. In particular, we focus on the ability of SPA to differentiate several BLS spectra in the presence of different types and amounts of noise, as well as the statistical certainty with which two closely spaced spectra can be distinguished as a function of increasing noise. We conclude that SPA offers a powerful tool for analyzing noisy BLS spectra, that may prove particularly beneficial for applications such as cell sorting [14, 15], diagnostics [7, 8], as well as being able to provide an additional contrast scheme for e.g., segmentation of regions of interest in Brillouin Microscopy maps [4–6, 8, 9].
Phasor Analysis
Phasor analysis is a common tool in physics and electrical engineering [16]. It is an analytic representation of a spectrum in terms of its amplitude and Fourier (phase) components, and is particularly useful for analyzing complex signals that are a convolution of several components (which become a product in Fourier space) and where the functional dependence is either unknown or complex. The results of a phasor analysis are typically presented in the form of a phasor plot with a data set reduced to a point in a 2-dimensional plot. Phasor analysis was first introduced into optics for time-domain fluorescence lifetime analysis [17], where it has become a powerful tool for studying variations in complex multi-exponential (or non-exponential) fluorescence decays. It has also been used for the analysis of hyperspectral data including multi-channel fluorescence [18, 19] and Raman spectroscopy [20], where it can provide a useful approach for extracting constituent components and segmentation in sample mapping. It is particularly well-suited for analyzing and differentiating subtle variations in noisy or complex multi-component spectra for which the exact functional dependence is unknown, and where conventional fitting can either not capture subtle changes or yield erroneous results due to poor fitting accuracy. Since there is no fitting in phasor analysis it is thus very powerful in exploring novel behavior not included in pre-assumed models. Unlike Principle Component Analysis (PCA) it is by construction linear, such that the phasor for a mixture consisting of two (independent) component spectra will be the sum of the phasors for of the two components weighted according to their relative abundance. When one can assume such a linear superposition, the phasor of a mixture will fall on a line between the phasor of the two constituent components when plotted on a phasor plot. Deviations from this can be used to identify interactions such as resonant energy transfer in phasor lifetime analysis [17] or the abundance of different molecular species in spectral phasor analysis [18–20]. Also, unlike PCA, it is an analytic representation, and therefore each phasor can be mapped to a single measured spectrum.
In the case of BLS spectra—which is based on a collective molecular phenomena—the BLS spectrum measured for a mixture will in general not be the linear superposition of that of its constituent components. The exception where this would be the case is if the constituent components form discrete structures larger than the characteristic acoustic length scales in the probed direction, and the measured interaction distance in the direction of the probed phonons contains several different such structures. In this scenario a similar interpretation as with spectral phasor analysis of fluorescence or Raman spectra may be assumed, and the position of the measured phasor along the line connecting two constitutive components can in principle yield information on the relative volume fractions occupied by these components, assuming a priori knowledge of the spectra of the constituent components. This is illustrated in Figure 1C where the volume fraction of component A in a mixture X consisting of A and B will be given by RAX/RAB. For the case of mixtures with constituent components smaller than the characteristic acoustic length scales in the probed direction, deviations from the straight line connecting the two pure components may provide a quick visual assessment into the nature of the transition (i.e., to what extent it is governed by changes in relative component concentrations). This is illustrated in Figure 1D. The described linearity property of phasors can readily be extended to more than two basis spectra, in which case the fractional composition of the mixture is determined by the area of the enclosed polygon opposite to the vertex of the basis spectra, as shown in Figure 1E for the case of a three component system.
In addition to providing insight into what extent the BLS spectra is dependent on its constituent components, SPA can also prove powerful in differentiating dynamic behavior of complex multi-component spectra (such as during structural or composition changes) when the number of contributing components and functional form of the BLS peak is unclear or changing. An example of the evolution of two initially similar spectra is shown in Figure 1F, where the trajectory of the traced line and distance between the phasors as a function of time can be used to identify and gain further understanding on the nature of the transition. An analysis using conventional single or multi-peak fitting in such cases would prove particularly challenging or impossible if one is for example measuring the superposition of multiple closely spaced spectra and the number of components is ill defined.
Simulation Results
To calculate the phasors for a given measured BLS spectra we assume a discrete spectral signal Ijmeasured at frequencies ωj, where 1 ≤ j ≤ N. The exact starting and ending frequency for the spectra considered in SPA is not critical provided it is consistently defined for a set of measurements to be compared and spans all relevant spectral features of interest. Typically, it makes sense to define the smallest spectral range which will contain all the relevant information (examples are shown as red bars in Figures 1A,B). The horizontal and vertical coordinates of the phasor may then be calculated via:
where m is the order of the phasor. We will constrain ourselves to the lowest order (m = 1), although higher orders may be desirable to discern subtle differences in high resolution spectra. We simulate BLS spectra characteristic to that which might be obtained in a typical BLS microspectroscopy experiment, using a visible (532 nm wavelength) excitation laser and measured using an imaging-spectrometer, such as in Refs. [6–8]. For analysis we consider the frequency interval ω = 5 → 15 GHz, as would be relevant for many biological samples, and for simplicity we assume a constant step size of |ωj+1 − ωj| = 150 MHz for our spectra.
In Figure 2 we show a phasor plot for a range of different simulated BLS spectra, in each case assuming a Lorentzian peak shape for the spectrum. The squares correspond to phasors with increasing Brillouin frequency shift from ωB = 5.5 − 14.5 GHz and line widths ΔωB = 0.2 − 4.0 GHz. With increasing ωB the position on the phasor space migrates counter-clockwise around the origin (u = v = 0), whereas with increasing peak width it extends further from the origin, guaranteeing that any spectra will occupy a unique position on the phasor plot. Shown also are the phasors for several “standard control” samples (water, methanol, PMMA, and BK7 glass) as well as those typical for some subcellular structures of biological interest. We note it is possible to use this plot as a palette to assign a discrete or a spectrum of colors to different regions of the phasor plot in a BLS microscopy spatial map, to provide a more revealing alternative contrast scale that considers both peak position and peak shape. This can provide a powerful means of segmentation in BLS microscopy, since significant variations in the peak width and shape as well as peak position are often observed in biological samples—e.g. [21].
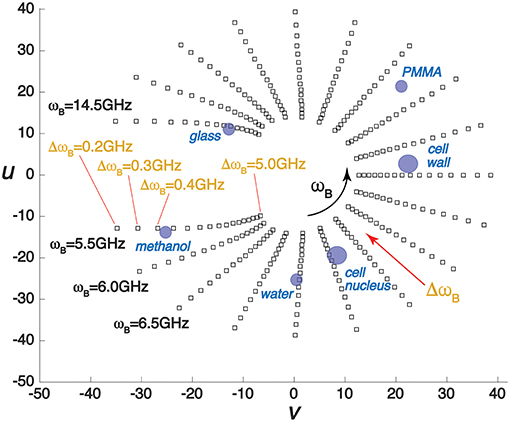
Figure 2. Example phasor plot of BLS spectra with different frequency (ωB) shifts and line widths (ΔωB). Also shown on the plot are phasors for several different samples and structures.
For the case when the spectra has a known or a priori assumed functional two-parameter functional dependence it is possible to unambiguously recover these parameters from the phasor (u, v). This can be demonstrated by taking for example a (normalized) Lorentzian measured spectra as typically measured in BLS, which in a discrete form would be given by:
Where Δω are the frequency intervals measured, and ωB and ΓB are the peak position and Full Width at Half Maximum (FWHM)—corresponding to the Brillouin shift and Brillouin peak width. Rewriting the phasor equations (Equations 2a and 2b) in the general form (for the mth order):
then inserting Equation (3) and taking the Fourier transform one obtains:
From this it immediately follows (by considering the real and imaginary components) that the peak position and FWHM can be calculated from the phasor (um, vm), via:
Equation's (6) also holds some clues on the optimum choice of order (m) to use in the phasor analysis to most accurately extract either peak position (vm ≫ um) or peak width (maximization of ).
For the case of spectra consisting of multiple peaks or peaks with complex or unknown functional forms of more parameters the one to one correspondence between the phasor and the fitting parameters no longer is possible. In certain BLS applications though one may have the (linear) superposition of multiple peaks of known functional dependence and is interested in the relative contribution (amplitude in Intensity spectra) of these. This is readily obtained directly from phasor plots (see above, and Figure 1), and can be directly calculated from the phasor as follows. For the case of two components (indexed 1 and 2) the phasor may be expressed in the form:
where α is the fractional contribution of component-1, and f(x) is the (discrete) Fourier Transform of the xth component. For the case of Lorentzian functions the latter would be given by . It follows from Equation (7) that the relative contribution (α) can be obtained from either um or vmvia:
Where () are the real and imaginary part of the Fourier transform f(x). For the case of Lorentzians these would be: and .
For the case of three contributing components Equation (7) becomes:
from which it follows that:
Where, we have for conciseness defined f(xy) = f(x) − f(y). It follows that phasor analysis can be used to definitively distinguish the relative contributions also of three known spectra—which would have applications also in potential BLS sorting applications—and Equation's (10) may be used to optimize the phasor order for maximizing the accuracy with which the relative contributions are calculated.
To assess the potential advantages of SPA as compared to a functional fitting approach, we take a look at the effect of reduced signal integrity and noise on the ability of the two approaches to distinguish several closely spaced single component BLS spectra that may typically be encountered in BLS microscopy. There are a number of different sources and types of noise that will perturb the BLS spectra I (ω), depending on the nature of the measurement/instrument and sample. We separately consider three different types of noise, weighted by a factor W = aN(σ), where a is parameter defining the amount (strength) of the noise, and N(σ) a vector the size of the spectra I (ω) constituted of random numbers distributed normally with width σ = 1GHz. Specifically, we consider the followin three scenarios:
(1) photon (shot) noise limited :
(2) detector noise + shot noise :
(3) 1/f (fluctuation) noise + shot noise:
For illustrative purposes we look at three sample spectra: that of water Iw(ω) with ωB = 7.45 GHz and ΔωB = 0.80 GHz; a typical value for the cytoplasm of a cell Ic(ω) with ωB = 7.70 GHz and ΔωB = 1.00 GHz; and a typical value for the nucleus of a cell In(ω) with ωB = 8.10 GHz and ΔωB = 1.10 GHz (e.g., [5–7]). We simulate 100 spectra with different levels of noise for each of the three cases (assuming a Lorentzian distribution for the peak), and then perform both a non-linear Least Squares (LS) fit and a phasor analysis to compare how well the methods can differentiate the three spectra from each other. In each case LS fitting was performed in Matlab (Mathworks) using the Peakfit function1 with the initial parameter guess for ωB and ΔωB corresponding to the “true” value for the respective spectra, and including a polynomial background correction. For both the LS and SPA the spectral range from 4 to 15 GHz was included to assure that the accuracy would not be significantly compromised by clipping of the Lorentzian tails, and to justify direct comparison between the two approaches. For the phasor calculation no other a priori information was assumed. In Figures 3, 4 we display for different noise scenarios in each case, a characteristic “noisy” spectra assumed for each of the three sample types (top), a 2D contour plot showing the cumulative distribution of values of ωB vs. ΔωB obtained from LS fitting (middle), and finally a phasor plot showing the cumulative distributions for u vs. v (bottom). Figures 3A,B show the case for noise free spectra and shot-noise limited spectra, respectively. For the former, both approaches are able to unambiguously differentiate the three sample types as expected. For the latter the LS fitting can no longer unambiguously distinguish the three sample types, whereas the phasor approach still clearly separates them in phasor space. As one increases the detector noise (while still including the shot noise) to <W> = 0.4, 1.0, and 1.5, the ability of both the LS and the SPA to differentiate the three components decreases rapidly as shown in Figures 3C–E, respectively. By the time one reaches <W> = 1.5 (Figure 3E) it is no longer possible to discern 3 components from the LS fitting, while SPA still suggests the presence of three distinct components. For the case of 1/f or fluctuation noise, which may originate both from the sample as well as the detection optics and electronics [22], we observe a similar trend. By increasing the noise parameter <W> from 0.4, 1.0, 2.5, 5.0, and 10.0, as shown in Figures 4A–E, respectively, it is however apparent that SPA again allows for a clearer identification of three independent components with increasing 1/f noise.
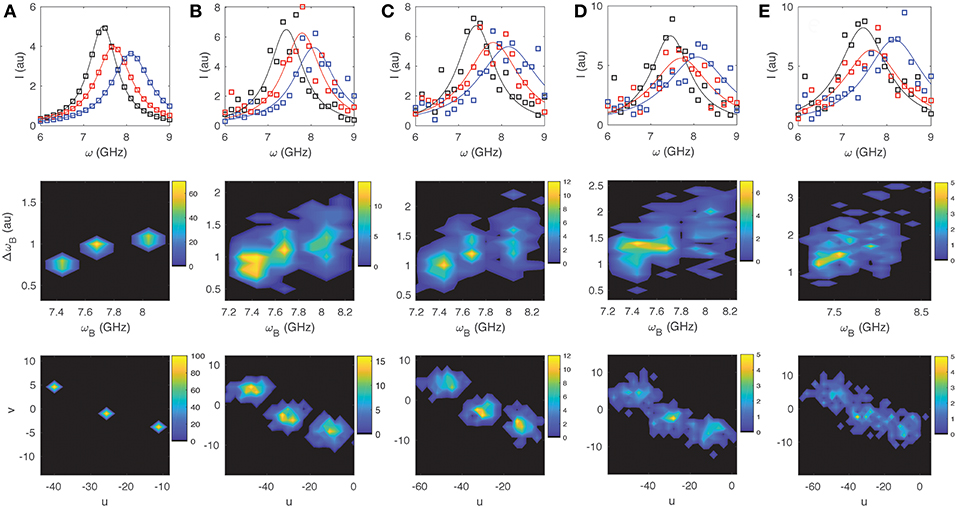
Figure 3. LS and Phasor Analysis of 100 simulated BLS spectra. Example spectra for three different samples [ωB,ΔωB] = [7.45,0.80], [7.70,1.00], and [8.10,1.10] GHz (top), results for ωB and ΔωB obtained from LS fitting (middle), and results obtained from spectral analysis (bottom). Shown are scenarios with (A) no noise (B) shot noise limited (C) shot noise + detector noise (W = 0.4), (D) shot noise + detector noise (W = 1.0), (E) shot noise + detector noise (W = 1.5).
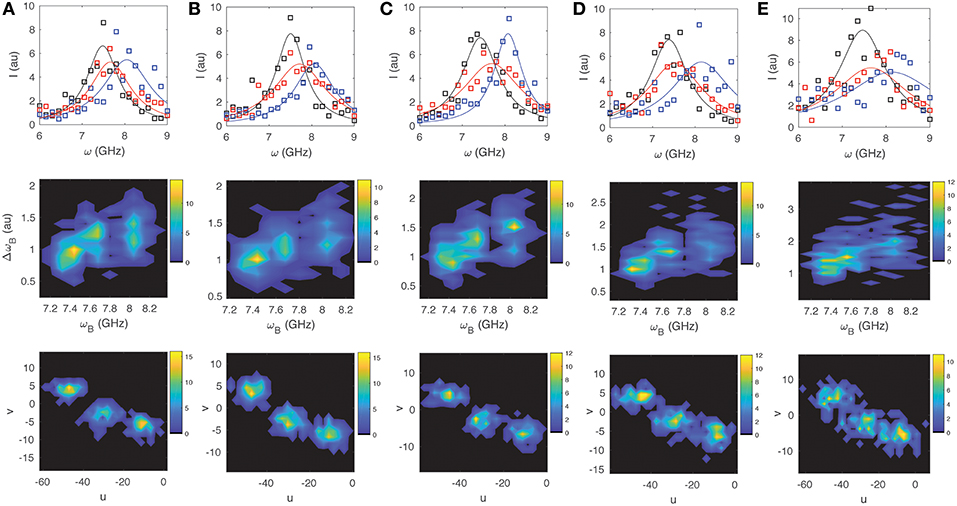
Figure 4. Same as Figure 3 for the case of shot noise and different amounts of 1/f-noise with noise strength (A) W = 0.4, (B) W = 1.0, (C) W = 2.5, (D) W = 5, (E) W = 10.
To quantify the ability of SPA to distinguish noisy spectra we consider the case of two very closely spaced spectra with [ωB, ΔωB] = [7.8, 0.9]GHz and [ωB, ΔωB] = [7.9, 1.0]GHz, and separately simulate 250 spectra of each under different amounts and types of noise. We then test for each noise scenario the significance of the difference between the two data sets based on their separation in both [ωB, ΔωB]-space (as obtained via LS fitting) and in [u, v]-space (as obtained via SPA analysis). For this analysis we express the statistical significance of the spectra from the two data sets being distinct in the form of an effective p-value as opposed to other statistical significance tests, based on its prevalent usage for assessing the significance of differences between assumed normally distributed data sets in the life-sciences. The effect on the p-value obtained from the LS-fitting and SPA results of the two data sets is shown in Figures 5A,B for the case of increasing the detector noise [scenario (2)] and 1/f-noise [scenario (1)] respectively. In each case, the noise level is set by the above described <W>-parameter. As can be seen that, while SPA proves advantageous to LS-fitting in both cases, the advantage is more pronounced for the case of detector noise (Figure 5A). It is also evident that, the advantages of SPA over LS-fitting is most significant for shot-noise limited measurements, as was qualitatively evident also from Figure 3B. This suggests that phasor analysis may prove particularly powerful for Brillouin microscopy using imaging-spectrometers where owing to the short acquisition times and modern detector arrays one is often shot-noise limited.
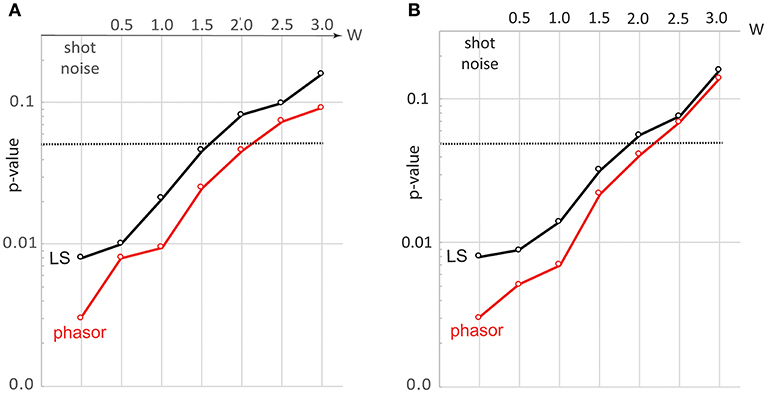
Figure 5. Evolution of p-value for differentiating two closely spaced spectra subject to increasing (A) detector noise (B) 1/f-noise. Black and red lines show the case for LS-fitting and SPA, respectively. The two BLS spectra taken were Lorentzian functions with [ωB, ΔωB] = [7.8, 0.9]GHz and [ωB, ΔωB] = [7.9, 1.0]GHz, and for each case a sample size of 250 simulated BLS spectra were used.
Conclusion and Discussion
Together the above results suggest that SPA can be well-suited for BLS microspectroscopy and aid in distinguishing noisy and complex multi-component spectra which fitting approaches are not able to. The Fourier transform needed to calculate phasors (Equations 2a and 2b), unlike least-squares fitting, are a very fast computational calculation that can be performed “on the fly” during imaging, and even if not implemented in end analysis may serve as a useful real-time contrasting method [e.g., by assigning a color palette to the (u, v)-space]. For high throughput applications such as cell sorting [14] or distinguishing two or more characteristic samples or sample regions with different spectra for which extracting biophysical/material parameters is not essential, one may directly use the un-scaled spectral projection in an imaging spectrometer (i.e., the direct camera read out) for calculating the phasors, provided that it remains un-changed during the measurement of the samples of interest and control samples. Alternatively and depending on the application, it may be desirable to use a refractive index or refractive index and density corrected spectra—i.e., I(ω) → I(ω /n) or I(ω) → I(ω2ρ /n2)—for the SPA which will scale directly with the acoustic velocity and elastic modulus, respectively (Equation 1).
There are also several additional desirable aspects of SPA, such as that any background signal (which corresponds to an infinite or very large spectral width signal) would by construction accumulate in the center of the phasor plot and thus can easily be identified. The spectral response of a detector/spectrometer—an important consideration in BLS—can also be easily accounted for in SPA, since the Fourier transform of a convolution is the product of the individual Fourier transforms: one thus only needs to divide the phasor of the measured signal by the Fourier transform of the instrument and spectral response.
Despite its desirable traits, SPA will however not be suitable for all applications. In particular for cases when the functional form of the spectra is of explicit interest and either not well-defined or complex. Furthermore, other more elaborate non-linear methods (e.g., [23]) may in cases also prove desirable for segmentation. However, based on its relative simplicity it is likely to serve as a powerful tool for quickly presenting BLS spectral maps in complex biological samples, as well as the ability to visualize and discern subtle and functional variations in the spectra otherwise not possible.
Data Availability
All datasets generated for this study are included in the manuscript and/or the supplementary files or can readily be generated from the provided equations.
Author Contributions
The author confirms being the sole contributor of this work and has approved it for publication.
Funding
Support from the City of Vienna, the Austrian Ministry of Science (Vision 2020), Interreg V-A AT-CZ, project RIAT-CZ (No ATCZ40), and COST Action CA 16124 is acknowledged.
Conflict of Interest Statement
The author declares that the research was conducted in the absence of any commercial or financial relationships that could be construed as a potential conflict of interest.
Footnotes
References
1. Brillouin L. Diffusion de la lumière et des rayons X par un corps transparent homogène. Ann Phys. (1922) 17:88–122. doi: 10.1051/anphys/192209170088
3. Berne BJ, Pecora R. Dynamic Light Scattering, With Applications to Chemistry, Biology, and Physics. New York, NY: Dover Publications (2000).
4. Scarcelli G, Yun SH. Confocal Brillouin microscopy for three-dimensional mechanical imaging. Nat. Phot. (2007) 2:39–43. doi: 10.1038/nphoton.2007.250
5. Scarcelli G, Polacheck WJ, Nia HT, Patel J, Grodzinsky AJ, Kamm RD, et al. Noncontact three-dimensional mapping of intercellular hydromechanical properties by Brillouin microscopy. Nat Methods. (2015) 12:1132–4. doi: 10.1038/nmeth.3616
6. Elsayad K, Werner S, Gallemí M, Kong J, Sánchez Guajardo ER, Zhang L, et al. Mapping the subcellular mechanical properties of live cells in tissues with fluorescence emission–Brillouin imaging. Sci Signal. (2016) 9:rs5. doi: 10.1126/scisignal.aaf6326
7. Mattana S, Caponi S, Tamagnini F, Fioretto D, Palombo F. Viscoelasticity of amyloid plaques in transgenic mouse brain studied by Brillouin microspectroscopy and correlative Raman analysis. J Innov Opt Health Sci. (2017) 10:1742001. doi: 10.1142/S1793545817420019
8. Antonacci G, Pedrigi RM, Kondiboyina A, Mehta VV, de Silva R, Paterson C, et al. Quantification of plaque stiffness by Brillouin microscopy in experimental thin cap fibroatheroma. J R Soc Interface. (2015) 12:0843. doi: 10.1098/rsif.2015.0843
9. Meng Z, Traverso AJ, Ballmann CW, Troyanova-Wood MA, Yakovlev VV. Seeing cells in a new light: a renaissance of Brillouin spectroscopy. Adv Opt Phot. (2016) 8:300–27. doi: 10.1364/AOP.8.000300
10. Wu PH, Aroush DR, Asnacios A, Chen WC, Dokukin ME, Doss BL, et al. A comparison of methods to assess cell mechanical properties. Nat Methods. (2018) 15:491–8. doi: 10.1038/s41592-018-0015-1
11. Jain RK, Martin JD, Stylianopoulos T, Jain RK, Martin JD, Stylianopoulos T. The role of mechanical forces in tumor growth and therapy. Annu Rev Biomed Eng. (2014) 16:321–46. doi: 10.1146/annurev-bioeng-071813-105259
12. Bottani CE, Fioretto D. Brillouin scattering of phonons in complex materials. Adv Phys. (2018) 3:1. doi: 10.1080/23746149.2018.1467281
13. Pochylski M, Gapinski J. Simple way to analyze Brillouin spectra from turbid liquids. Opt Lett. (2015) 40:1456–9. doi: 10.1364/OL.40.001456
14. Zhang J, Nou XA, Kim H, Scarcelli G. Brillouin flow cytometry for label-free mechanical phenotyping of the nucleus. Lab Chip. (2017) 17:663–70. doi: 10.1039/c6lc01443g
15. Meng Z, Petrov GI, Yakovlev VV. Flow cytometry using Brillouin imaging and sensing via time-resolved optical (BISTRO) measurements. Analyst. (2015) 140:7160–4. doi: 10.1039/C5AN01700A
17. Digman MA, Caiolfa VR, Zamai M, Gratton E. The phasor approach to fluorescence lifetime imaging analysis. Biophys J. (2008) 94:L14–16. doi: 10.1529/biophysj.107.120154
18. Fereidouni F, Bader AN, Gerritsen HC. Spectral phasor analysis allows rapid and reliable unmixing of fluorescence microscopy spectral images. Opt Expess. (2012) 20:12729–41. doi: 10.1364/OE.20.012729
19. Cutrale F, Trivedi V, Trinh LA, Chiu CL, Choi JM, Artiga MS, et al. Hyperspectral phasor analysis enables multiplexed 5D in vivo imaging. Nat Methods. (2017) 14:149–52. doi: 10.1038/nmeth.4134
20. Fu D, Xie XS. Reliable cell segmentation based on spectral phasor analysis of hyperspectral stimulated Raman scattering imaging data. Anal Chem. (2014) 86:4115–9. doi: 10.1021/ac500014b
21. Margueritat J, Virgone-Carlotta A, Monnier S, Delanoë-Ayari H, Mertan HC, berthelot A, et al. High-frequency mechanical properties of tumors measured by Brillouin Light scattering. Phys Rev Lett. (2019) 122:018101. doi: 10.1103/PhysRevLett.122.018101
Keywords: Brillouin Light Scattering spectroscopy, Brillouin microscopy, optical microscopy, optical spectroscopy, phasor analysis
Citation: Elsayad K (2019) Spectral Phasor Analysis for Brillouin Microspectroscopy. Front. Phys. 7:62. doi: 10.3389/fphy.2019.00062
Received: 06 March 2019; Accepted: 08 April 2019;
Published: 26 April 2019.
Edited by:
Stefan G. Stanciu, Politehnica University of Bucharest, RomaniaReviewed by:
Zhaokai Meng, CytoChip Inc., California, United StatesJitao Zhang, University of Maryland, College Park, United States
Copyright © 2019 Elsayad. This is an open-access article distributed under the terms of the Creative Commons Attribution License (CC BY). The use, distribution or reproduction in other forums is permitted, provided the original author(s) and the copyright owner(s) are credited and that the original publication in this journal is cited, in accordance with accepted academic practice. No use, distribution or reproduction is permitted which does not comply with these terms.
*Correspondence: Kareem Elsayad, a2FyZWVtLmVsc2F5YWRAdmJjZi5hYy5hdA==
 Kareem Elsayad