- 1Department of Physics, Portland State University, Portland, OR, United States
- 2Jet Propulsion Laboratory, California Institute of Technology, Pasadena, CA, United States
Multiwavelength digital holographic microscopy (DHM) has been used to improve phase reconstructions of digital holograms by reducing 2π phase ambiguities. However, most samples used as test images have been solid or adhered to a surface, making it easy to determine focal planes and correct for chromatic aberration. In this study we apply 3-wavelength off-axis DHM to swimming protozoa containing distinct spectral features such as chlorophyll and carotenoids. We reconstruct the holograms into amplitude and phase images using the angular spectrum method. Methods for noise subtraction, chromatic aberration correction, and image registration are presented for both amplitude and phase. Approaches to phase unwrapping are evaluated and compared to expected results from simulated holograms. The algorithms used are implemented in plug-ins using the open source Fiji platform and are available for use, significantly expanding the open-source software available for DHM.
Introduction
Digital holographic microscopy (DHM) is an emerging technique for 3-dimensional imaging and tracking of microorganisms [1–5] and for in vitro analysis of cellular and subcellular processes such as ion channel function [6] and apoptosis [7, 8]. Digital holograms measure the interference of a light wave that has been diffracted through a sample and combined with a coherent, non-diffracted reference wave. The intensity of the fringe pattern is captured by a digital camera; the measured intensity is the sum of the zero-order or DC terms, the virtual image, and the real image, respectively given by:
where | |2 indicates the absolute square and * indicates the complex conjugate. Interference may be obtained using transmissive or reflective geometries; the most common type of transmissive interferometer is the Mach-Zehnder configuration, where the object and reference beams are at some angle θ to each other [9, 10].
Because both intensity and phase of the wave are recorded, separate images corresponding to intensity changes and phase shifts resulting from interaction with the sample may be reconstructed from the real or virtual image. Either the real or virtual image is selected by applying a mask in Fourier space, and the selected frequencies are reconstructed into amplitude and phase images by a chosen reconstruction algorithm. Reconstruction methods include the Fresnel transform, the convolution method, and the angular spectrum method, and have been well reviewed [11].
In this paper we exclusively use angular spectrum. In this method, the Fourier frequencies are considered as plane waves traveling in z away. The field at any z point can be calculated by adding the weighted contributions of these plane waves accounting for phase shifts during propagation. In the hologram plane, the angular spectrum of an object (h• ) is given as a function of spatial frequencies by the Fourier transform 𝔍:
Where ξ, η are spatial variables and kξ, kη are corresponding frequency variables. After propagating a distance z, each plane wave component is shifted in phase, so that the reconstructed phase at arbitrary z is given by:
The function Γ is known as the “propagator” and is related to intensity I and phase φ by:
In digital holographic microscopy, a microscope objective lens is inserted into the optical train to provide magnification of objects otherwise too small to resolve. The presence of the lens causes a magnification of the object according to the rules of geometric optics, with a resulting quadratic phase aberration. Removal of this aberration, and others such as astigmatism, may be done by a variety of methods; the literature is extensive, with recent reviews [11, 12]. One of the most easily performed, if the data permit, is to define a “reference hologram” that is subtracted from the rest of the holograms in the data set prior to reconstruction. The reference hologram may be a blank area of the sample or, in samples without abrupt edges, the low-frequency elements of the image itself; the latter approach is called “self-reference.” For long acquisitions, reference holograms may be averages of several time points; new reference holograms may be defined at different time points if aberrations change during the course of the recording.
The intensity image is equivalent to brightfield microscopy and poses few difficulties in interpretation. The sources of aberrations that affect the phase images do not appear in intensity; thus the use of a reference hologram for intensity reconstructions is not needed. However, in DHM, speckle and aberration noise often obscure the color information of amplitude images. Noise subtraction is essential to obtain useful images. For samples containing moving objects, such as living protozoa, this may be done using median subtraction on each z plane after intensity reconstruction. Averages are taken over time and may be the average over the entire time series or a selected subset. For stationary objects, moving the sample using a micrometer stage can permit noise subtraction.
The phase image is more challenging both to reconstruct and interpret than the intensity. The field of quantitative phase imaging (QPI) [13, 14] is a rapidly growing area of interest that aims to extract quantitative information from phase images by relating the observed phase difference Δφ to the optical path length (OPL) of the sample, defined as the product of the sample thickness t and index of refraction difference with the medium Δn:
The difficulties with QPI arise because of two principal factors: (1) the phase shift is exquisitely sensitive to optical aberrations, including tilt, astigmatism, chromatic aberrations, and other errors; (2) the phase shift is modulo 2π, so when phase shifts more than 2π, its absolute value is ambiguous.
Dual- or triple-wavelength DHM has been described numerous times as a method for reducing 2π ambiguities in phase imaging [15–17]. If a hologram is recorded at two wavelengths, λ1 and λ2, then two independent phase maps are obtained according to Equation (4). If the phase images are subtracted, the resulting image is the equivalent of recording the phase using a “synthetic” or “beat” wavelength Λ:
This is potentially extremely useful for biological experiments, since it can eliminate phase wrapping in many samples. For example, if λ1 = 520 nm and λ2 = 638 nm, Λ = 2.8 μm, larger than the majority of bacteria in any dimension.
However, in practice, phase maps using DHM are plagued with noise and ambiguities, and so far the usefulness of the beat wavelength approach has not been demonstrated in complex biological samples. The phase noise is amplified in the multiwavelength images, so that de-noising [18] becomes essential before interpretation. Most importantly, objects captured at different wavelengths are usually offset in x, y, and z. For rapidly moving objects such as bacteria or protozoa, the two (or more) microscope illumination sources must be spatially offset so that they may be captured simultaneously and then filtered separately in Fourier space. Different spatial tilt results in linear offsets in the Fourier plane, so that the real and virtual images at each wavelength do not overlap. In the reconstruction, there is a resulting xy offset of the images, which must be corrected; there is also a small difference in magnification. Unless achromatic lenses are used, chromatic aberration leads to significant z offset between different wavelengths. For objects that absorb much more strongly in one wavelength than another, determining the corresponding focal planes can be difficult. Thus, accurate registration of the different color channels in x, y, and z is required.
Because of the rapid expansion of super-resolution techniques in fluorescence microscopy, multiple algorithms for chromatic aberration correction, and registration are now available. Registration of each object has been shown to be superior to calculating a “global” correction and applying it throughout the sample. This is because dispersion in the medium and irregular substrates mean that the registration parameters are different at different points in x, y, and z throughout the sample [19].
In this paper we use a 3-wavelength spatially multiplexed DHM to capture images of protozoa: Euglena gracilis, which contains both green and red features, and bleached E. gracilis, from which the chlorophyll has been removed by drug exposure. Simulated holograms representing objects of similar shape and size are used to illustrate the reconstruction and amplitude and phase overlay procedures in the absence of noise. Methods of noise removal in both amplitude and phase are shown, and the results of amplitude and phase reconstructions of living Euglena are presented. These steps represent standard approaches used in the literature, but not previously collected into an open-source software package. All of the processing steps used in the workflow here are developed as Fiji plugins, and available for use and development. Alternative algorithms for reconstruction and unwrapping are included in the package in order to facilitate choosing the best approach for different types of DHM data.
Materials and Methods
Chemicals and Cultures
Euglena gracilis was obtained from Carolina Biological Supply (Burlington, NC) (Catalog # 152800). Acridine orange was obtained from Sigma Aldrich® LLC (St. Louis, MO) (Catalog # A6014). Streptomycin (Catalog #BP91050), ProLong™ Gold Antifade (Catalog #P10144), and ProLong™ Diamond Antifade (Catalog #P36965), were obtained from Thermo Fisher Scientific™ Inc., (Rockford, IL). Ingredients for Euglena propagation were obtained from local supermarkets; large wheat berries were a product of Bob's Red Mill (Portland, OR).
Euglena Propagation and Preparation
Euglena gracilis cultures were maintained on a medium with the following components: 12 wheat berries, 15 grains of rice, 1 tablespoon of powdered milk, and 500 mL of distilled water. The broth was autoclaved (20 min at 121°C) and inoculated with ~5 mL of the previous stock. The inoculated solution was left to incubate in natural light (through a window in Portland, OR) at room temperature.
Euglena were bleached (removed of chlorophyll) by two methods: exposure to the DNA intercalating dye acridine orange (4, 8, 12, and 16 μM) [20] or exposure to streptomycin (172 μM) [21]. The prepared concentrations were wrapped in tinfoil and checked for bleaching under a brightfield microscope. Bleached and unbleached Euglena were imaged by brightfield and digital holographic microscopy.
Brightfield Microscopy and Spectroscopy
Brightfield imaging was performed on a Zeiss Primo Star microscope using a 60x/NA 0.60 Plan Apo and images were captured on an Axiocam RGB camera.
Spectra were collected on a CLARIOstar plate reader (BMG Labtech). For spectroscopy, 500 μL of undiluted Euglena gracilis culture were pelleted in a 1.5 mL Eppendorf tube using a tabletop microcentrifuge in 5 min intervals at 14,000 rpm. The medium was pipetted out and the pellets were re-suspended in methanol, then vortexed using the maximum setting on a vortex mixer until a homogenous mixture was achieved. Wide spectrum absorbance, 220–800 nm, was performed on 200 μL aliquots of both samples in a 96 well F-bottom clear plate (Fisher Catalog #12-565-501). Samples were transferred to a 96-well black plate (Fisher Catalog #06-443-2) for fluorescence measurements with excitation at 400 nm and emission 420–740 nm.
3-Wavelength Digital Holographic Microscope
The instrument used was a modification of a common-path Mach Zehnder DHM described elsewhere [22, 23] (Figure 1A). Lasers of 3 wavelengths (B = 405, G = 520, and R = 638 or 685 nm) (Thorlabs 4-channel fiber-coupled laser source, Catalog #MCLS1) are passed through a fiber combiner (OZ Optics, custom 3-way combiner) and collimated with a collimator lens (Newport Catalog #PAC052AR.14). The combined light then passes through a filter assembly as shown. The central filter is clear glass only, made from the same substrate as the bandpass filters (custom cut by Chroma). The three surrounding filters are narrow bandpass centered at the R, G, and B emission wavelengths (Chroma 8 mm diameter filters). The beams then pass through a sample chamber of matching geometry so that the central light, of all 3 wavelengths, illuminates the sample of interest. The 3 filtered beams pass through a blank chamber filled with dH2O and provide the reference beams. All 4 beams then encounter matched aspheric objective lenses (NA = 0.37) (Asphericon, custom part) which immediately follow the sample chamber. A relay lens then forms an image of the specimen and the reference chambers and overlays them on the detector array, producing interference fringes for each wavelength. The lateral separation of the two objective lenses of each color, and the focal length of the relay lens are paired such that the resulting fringes are properly sampled by the pixels on the imaging array. In the final focal plane, at the CCD, three sets of fringes are formed, each with a unique orientation. Each set of fringes is normal to the vector that defines the sample-to-reference objective for that wavelength. Because there are three orientations of reference objective lenses with respect to the sample objective, there are three fringe orientations on the array, as seen in the Fourier transform of the hologram. The fringe spacing is proportional to wavelength, so longer wavelengths correspond to lower frequencies in Fourier space; thus the red image and its twin appear closest to the center, green in the middle, and blue the farthest from the center [22] (Figure 1B).
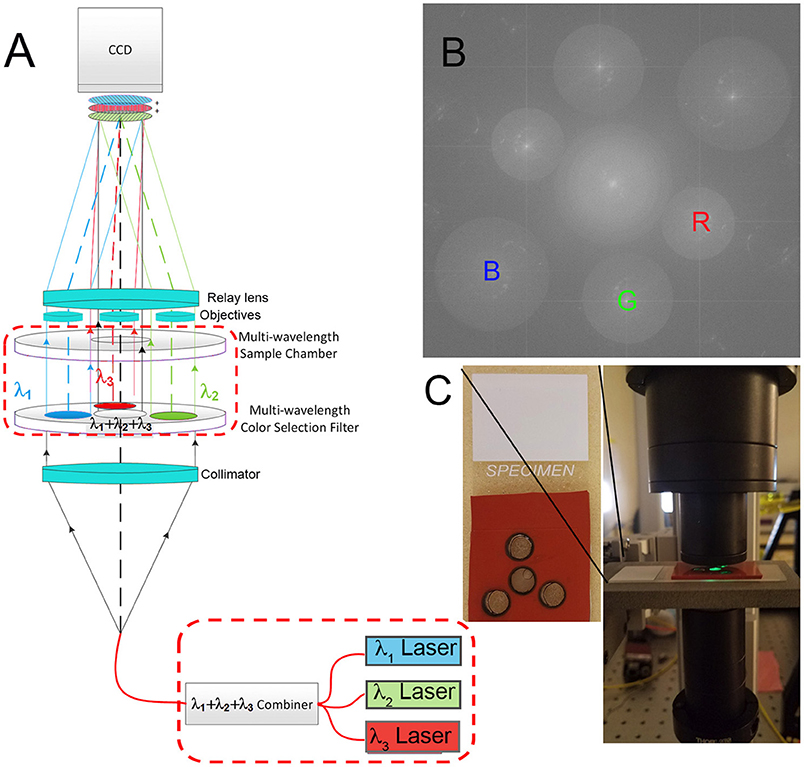
Figure 1. Multiwavelength off-axis DHM. (A) Schematic of the microscope design. Instrument part specifications are as in Wallace et al. [22], with the dashed red boxes indicating modifications for the multiwavelength design as specified here. (B) Fourier pattern showing spatially separated frequencies corresponding to the red, green, and blue laser lines. Each could be filtered separately for reconstruction. (C) Photo of a sample chamber and its positioning in the instrument. The spacing of each hole was determined precisely with a template, and the chamber was aligned by verifying that fringes could be seen using each wavelength separately.
The sample chambers were produced using a 6.47 mm diameter hole punch in an adhesive silicone sheet of 1/32 inch thickness (McMaster-Carr #9010k41). In order to ensure that the sample chamber geometry matched the aspheric lenses, a laser-cut template was used to indicate the necessary positions of each hole. The resulting mold was adhered to a microscope slide (Fisherfinest Premium, Fisher Scientific). The sample of interest was delivered to the “science” chamber with a micropipette; the reference chambers were filled with dH2O. After filling, a 22 × 22 mm No. 1 GoldSeal Coverglass was placed over the top and the sample was imaged (Figure 1C).
FIJI Programming
This paper reports new plug-ins for reconstruction, phase unwrapping, and registration (multi-image landmark correspondences) (a tutorial is provided in the on-line documentation). The reconstruction plugin is based on Opto-Digital's Numerical Propagation plugin [24] using JTransforms. The user does not need to install the Numerical Propagation plugin manually to run our plugin, as ours downloads all necessary dependencies. Upon running the “Plugins > DHM > Reconstruct” command, all of the parameters including wavelength, image dimensions, and reconstruction parameters can be set. Aberration correction by use of a reference hologram may be selected as desired. The reference hologram's negative phase is multiplied with the hologram before propagation as described previously [25]. Automatic correction of tilt is done through polynomial fitting as described in Colomb et al. [26]. In the tilt correction, the “auto” setting determines flat horizontal and vertical lines by picking several lines and finding which of them best fits the polynomial using a least-squares approach.
The phase unwrapping plugin attempts to unwrap the phase in a phase image once it has been reconstructed. There are currently two algorithms available in this plugin: quality-guided single wavelength unwrapping and double wavelength unwrapping. The two algorithms are found in the “Plugins > DHM > Phase Unwrapping” menu. The quality-guided unwrapping method uses a quality metric and unwraps pixels one at a time, picking the next adjacent pixel that has the highest quality. This method is described in Goldstein [27]. The quality metrics can be extended programmatically by implementing the Quality interface. The double wavelength unwrapping method uses the subtraction method described in several places in the literature [12, 16, 28].
Chromatic aberration correction was performed using image registration using a multi-image landmark correspondences plugin. This plugin is based on mpicbg's landmark correspondences plugin [29], but extended to any number of images. The command is not included in the DHM folder and is instead under “Plugins > Transform > Multi-Image Landmark Correspondences.” Before running this command, corresponding points must be chosen on each image. This can be done manually or through some method of automatic registration.
Simulated Holograms
Simulated holograms were prepared in Fiji. Briefly, images of selected sizes, shapes, and colors of objects were generated in a 2,048 × 2,048 pixel RGB image. The image was split into color channels as 3 8-bit images (R, G, and B). For purely absorbing objects, only a real input was used, equivalent to amplitude. For phase-shifting objects, a value of OPL was chosen that was similar to that seen in real samples, and the phase shift calculated for each wavelength according to Equation (5). To simulate dispersive objects, a phase shift was applied only to the blue channel. The real and imaginary inputs were then calculated according to Equation (4). Each of these types of objects was propagated using the Angular Spectrum method as described elsewhere [24]. The depth to which each color was propagated varied to represent chromatic aberration, using differences in focal planes similar to those observed experimentally on our system. Simulated fringes at the 3 angles and colors were generated using OD-utilities as described elsewhere [30]. According to the following parameters: blue, 405 nm and angles α = 90°, β = 87.8°; green, 520 nm and angles α = 92°, β = 89.8°; red, 638 or 685 nm and angles α = 94°, β = 91.8°. These wavelengths represented our experimentally used lasers and the spacing as determined by the microscope geometry. Reconstruction of the simulations was performed using the Angular Spectrum plug-in.
Data Processing Workflow
Amplitude and phase images suffer from different types of noise and thus require different types of processing. Amplitude images did not require reference hologram subtraction, but if a reference hologram was not used, then tilt correction was necessary. After reconstruction, noise was removed from amplitude images by subtraction of the median image calculated over time at each z for each color. Color channels and z stacks were then concatenated to create a 5D stack. The white balance was equalized by getting statistical RGB values from a selected background region and normalizing them using a Fiji macro.
Phase images were reconstructed using a reference hologram consisting of the median of either the full time series or the first 10 frames of the series, depending upon the stability of the recording. Further noise subtraction was not required after reconstruction. Phase images at the different wavelengths were overlaid and white balance corrected as described above.
Both amplitude and phase images were corrected for chromatic aberration and dispersion. The z plane of best focus was determined visually. Offsets and magnification differences in x and y were corrected by applying Landmark Correspondences as discussed above.
For unwrapping, holograms were cropped around the cell or region of interest and processing was applied to the cropped image. Some cropping of the image was always necessary to remove phase jumps at the edges that would otherwise result in low dynamic range reconstructions.
Results
Euglena Appearance and Spectra
Wild-type Euglena gracilis showed distinct colored features under brightfield microscopy, particularly the green chloroplasts (Figure 2A). Absorbance and emission spectroscopy showed peaks consistent with chlorophyll and carotenoids [31, 32] (Figures 2C,D). Streptomycin-bleached Euglena appeared hollowed under brightfield, with transparent regions (Figure 2B). The absorbance spectrum was dominated by scattering that showed a monotonic decrease with wavelength consistent with simple dispersion. There was a 75% reduction in fluorescence emission intensity. This reduction in absorbance and emission was consistent with loss of chlorophyll (Figures 2C,D). Acridine-orange bleached Euglena were flattened and non-motile, so were less appropriate as a control (not shown). We therefore used streptomycin-bleached cells for all of the comparisons presented here.
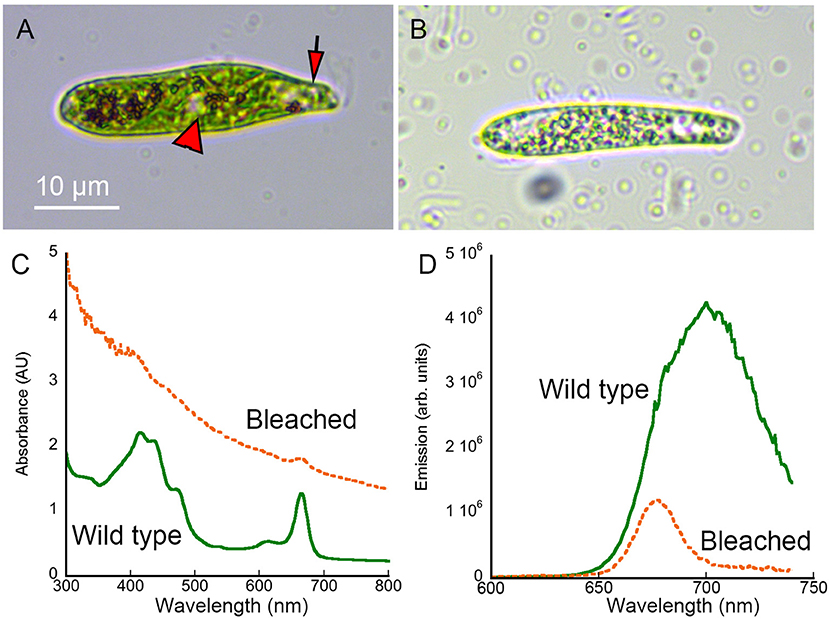
Figure 2. Brightfield images and absorbance and fluorescence spectra of wild-type and streptomycin-bleached Euglena gracilis. Scale bar applies to both panels. (A) Wild-type Euglena showing the eyespot (arrow) and nucleus (arrowhead). (B) Streptomycin-bleached Euglena. (C) Absorbance spectrum of wild type vs. bleached Euglena in methanol. (D) Emission spectrum (excitation 400 nm) of wild-type vs. bleached Euglena in methanol.
Simulated Holograms
In order to test the ability of the reconstruction algorithms to convey color information, we created holograms from a variety of simulated RGB shapes as the sum of holograms from each color channel. Each channel was put into focus at a different z plane in order to simulate chromatic aberration. Pure amplitude objects are shown in Figure 3. Figures 3A–C shows the original objects, the simulated hologram, and the Fourier transform for colored ovals approximately the size of a Euglena cell but without depth or 3D properties. Figures 3D–F shows the 2D projection of a 50 μm diameter red sphere and its simulated hologram and Fourier transform. Figures 3G–I shows simulated Euglena containing 3D organelles.
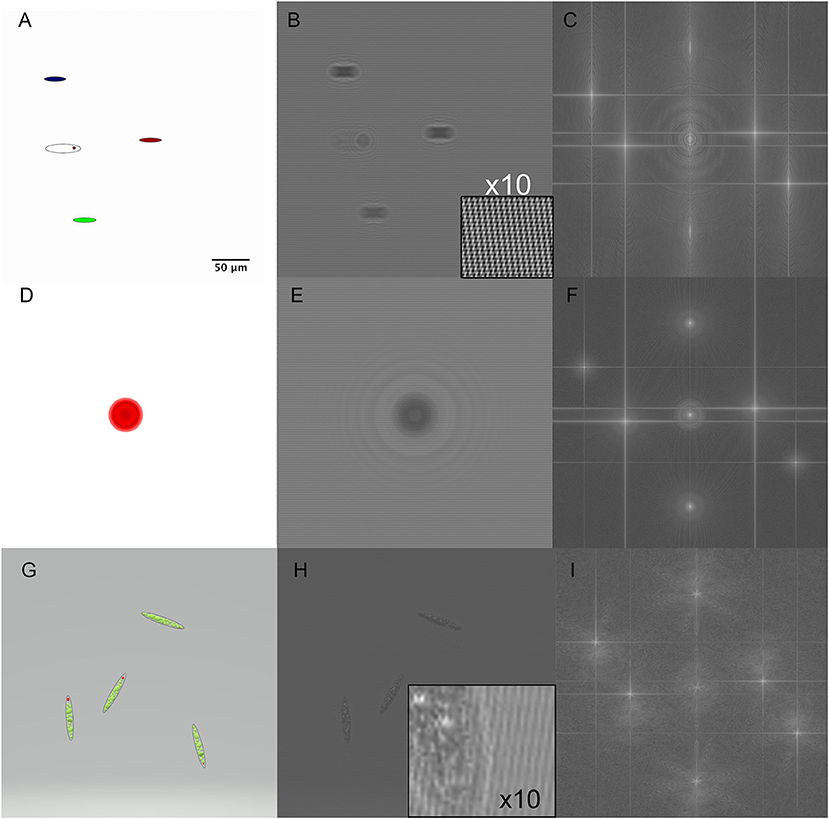
Figure 3. Simulated holograms of RGB pure amplitude objects. Scale bar applies to all panels. (A) Ellipses corresponding to approximate Euglena dimensions. (B) 3-wavelength hologram simulation with the magnified inset showing the 3 sets of fringes rotated with respect to each other. (C) Fourier transform of the hologram showing the actual and virtual images in each wavelength. (D) A red sphere of sufficient depth to cause phase wrapping (OPL > λ). (E) Hologram of the red sphere. (F) Fourier transform of sphere hologram. (G) A simulated RGB Euglena showing green chloroplasts and a red eyespot. (H) Simulated hologram of model Euglena with inset showing size of features relative to fringe spacing. (I) Fourier transform of Euglena hologram.
Amplitude reconstructions of these same objects using our Fiji plugs-ins are shown in Figure 4. Finding best focus could be done visually or using any best-focus algorithm. The original color of the objects was accurately conveyed by the 3-wavelength reconstruction, but white balance correction or background subtraction was required to eliminate background color. The intracellular features comparable in size to the fringe spacing were accurately reconstructed (Figures 4E,F).
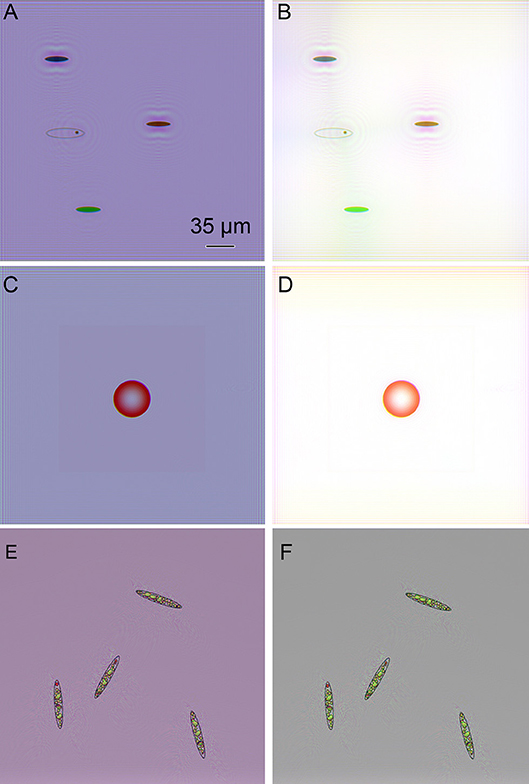
Figure 4. Amplitude reconstructions of simulated objects from Figure 3. Scale bar applies to all panels. (A) Colored ovals (B) Colored ovals with white balance correction. (C) Red sphere. (D) Red sphere with white balance correction. (E) Complex simulated Euglena. (F) Complex simulated Euglena with white balance correction.
Simulations of phase objects illustrated wavelength-dependent phase wrapping. An object with an identical index of refraction at all three illumination wavelengths (non-dispersive) will show phase shifts that scale with wavelength according to Equation (5). If the phase shift is >2π, phase wrapping will occur at different places in the 3 wavelengths. Figure 5A shows an object that was designed to wrap twice in blue and green, but only once in red. The RGB overlay shows bands of mixtures of the three colors. Figure 5B shows a dispersive object that wrapped twice in blue, but showed only weak phase shifts in green and red. Figure 5C shows a simulated Euglena cell containing non-dispersive organelles with wrapping in all three wavelengths.
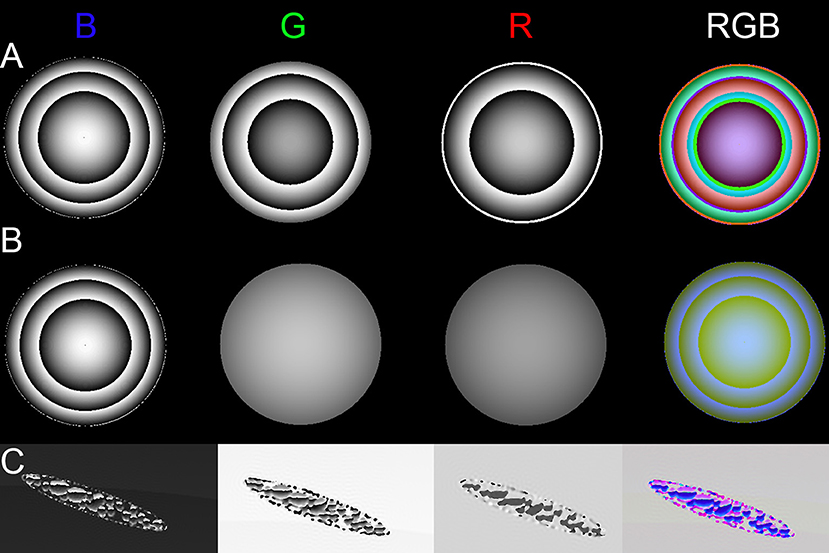
Figure 5. Phase images of dispersive and non-dispersive red sphere and simulated Euglena. (A) Non-dispersive sphere with strong phase shift across all wavelengths. (B) Dispersive sphere, with a strong phase shift only in blue. (C) Phase of simulated (non-dispersive) Euglena.
Real Holograms
A single hologram of an active Euglena culture is shown in Figure 6A. Cells were present on multiple focal planes, and came into focus on different planes depending upon the wavelength, since the aspheric lenses used had no chromatic aberration correction. All three sets of fringes were visible, though the 405 nm fringes were the highest contrast. The Fourier transform showed real and virtual image power spectra corresponding to each wavelength (Figure 6B).
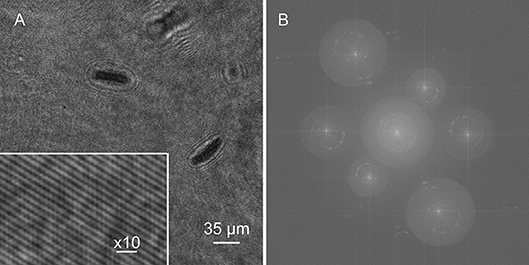
Figure 6. Holograms and Fourier transform. (A) Hologram of Euglena culture with inset showing fringes. (B) Fourier transform.
Unbleached Euglena were highly active (see Supplementary Video 1). Registration to correct for xy offsets and slight magnification differences among the three colors was essential (Figures 7A,B). Best focus in z was determined visually, and registration in x and y by manual choice of corresponding points in both amplitude and phase. Images with larger numbers of cells gave the best results, since more points were available. Ideally 8–9 points were used, though 2–3 could also yield satisfactory results. No automated technique we tried was superior to manual choice of points for registration. Given several images with point ROIs on them, the algorithm first used mpicbg's plugin to compute the transformation needed to transform between any two images. It then picked one to be the reference and transformed all images to correspond with the reference. The reference was chosen by the algorithm to be whichever image was the smallest. Interpolation could be done as well, but could be turned off at discontinuities. Turning it off at discontinuities was always done on phase images so that the 2π jumps remained sharp for unwrapping.
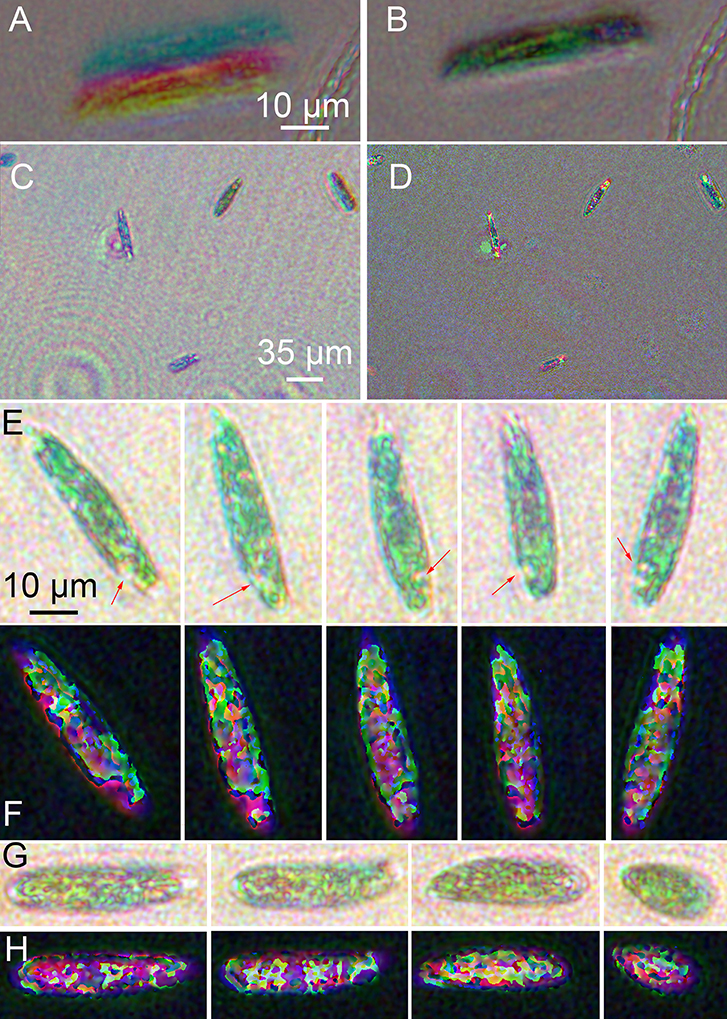
Figure 7. Images of wild-type Euglena reconstructed at a single focal plane. (A) Amplitude image of a single cell before registration. (B) Image after multi-point registration. All following images have been registered. (C) Amplitude, wide field of view. (D) Phase, wide field of view. (E) Amplitude reconstruction of a single cell rotating as it swam in x and y with minimal change in z. Scale bar applies to all panels (E–H). The arrows indicate the eyespot. (F) Phase reconstruction of rotating cell. (G) Amplitude reconstruction of a cell contracting. (H) Phase reconstruction of contracting cell.
Amplitude reconstructions showed both red and green features (Figures 7C,E,G). The prevailing color of the cells was green, as in ordinary brightfield images, although some color variation across the field of view was always apparent (Figure 7C). The eyespot appeared red. Swimming cells showed two distinct motility patterns: forward swimming with cell rotation, and contraction/tumbling. Figure 7E shows a time series of a single cell rotating. The eyespot could be used to determine orientation (also see Supplementary Video 2). Figure 7G shows amplitude reconstructions of a cell as it contracted. The corresponding phase images are shown in Figures 7D,F,H and Supplementary Video 3. Strong phase shifts were seen at all wavelengths, resulting in patterns resembling those of the non-dispersive simulated object. Most of the intracellular features seen in amplitude could also be seen in phase. In Figure 7F, the rotating cell can be seen, with both the eyespot and tail region clearly shifting position. In Figure 7H, increased phase shifts were seen as the cell contracted and its thickness increased (see Supplementary Video 4).
Streptomycin-bleached Euglena were noticeably different from untreated cells in amplitude and phase (Figure 8). The cells were sparser and less motile than unbleached cells (see Supplementary Video 5). In amplitude (Figures 8A,C,E), the majority of the green was absent, with the cells appearing bluish-red. The cells also appeared less dense overall with fewer intracellular features than the unbleached cells. A rotating cell is shown in Figure 8C and a contracting cell in Figure 8E. In phase, there was markedly less red and less phase wrapping overall. A more obvious correspondence between amplitude and phase could be seen compared with the unbleached cells. A rotating cell is shown in Figure 8D and a contracting cell in Figure 8F (also see Supplementary Videos 6, 7).
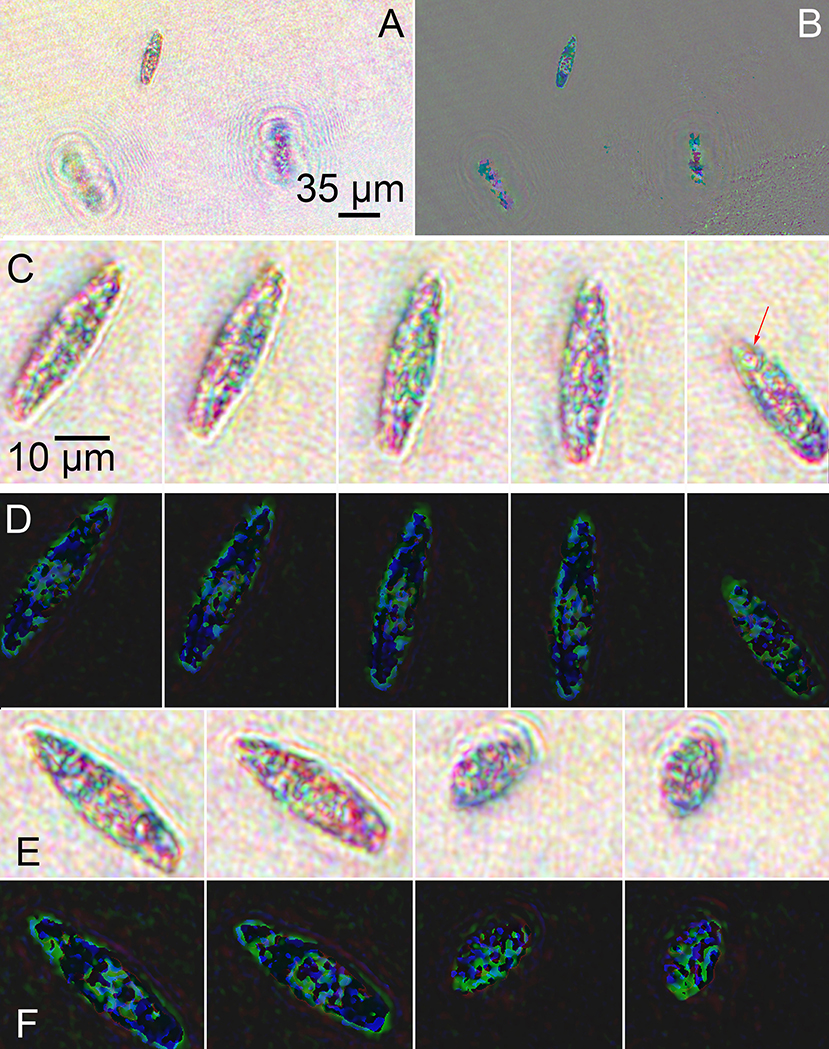
Figure 8. Images of streptomycin bleached Euglena reconstructed at a single focal plane. (A) Amplitude. (B) Phase. (C) Amplitude reconstruction of a single cell rotating as it swam in x and y with minimal change in z. The arrows indicate the eyespot. Scale bar applies to all panels (C–F). (D) Phase reconstruction of rotating cell. (E) Amplitude reconstruction of a cell contracting. (F) Phase reconstruction of contracting cell.
Phase Unwrapping
Both bleached and unbleached Euglena showed phase wrapping. Poor results were obtained with dual-wavelength unwrapping algorithms, so single-wavelength unwrapping was used for all of the images. In wild-type cells, multiple phase jumps over small spatial areas were apparent in blue. In green and red, phase wraps were mostly restricted to a large area in the center of the cell (Figure 9A). Despite the complexity of the phase image in blue, unwrapping yielded good results, with excellent correlation between features in the unwrapped phase and the amplitude images. Recognizable subcellular features, such as the nucleus, could be seen; the nucleus demonstrated positive phase contrast in blue. Of the three unwrapped phase images, the green showed the fewest features, with most of the phase shift corresponding to an essentially featureless intracellular region that did not demonstrate the features seen in amplitude. The red phase image had the least wrapping and so was easiest to unwrap, although the resolution of the resulting features was lowest due to the degradation of resolution with wavelength. Areas of positive and negative contrast were apparent, correlating with dark and light features in amplitude. Figures 9B,C shows the unwrapped phase at each wavelength and its correspondence with amplitude. Figure 9D shows surface plots of unwrapped phase, showing areas of positive and negative contrast.
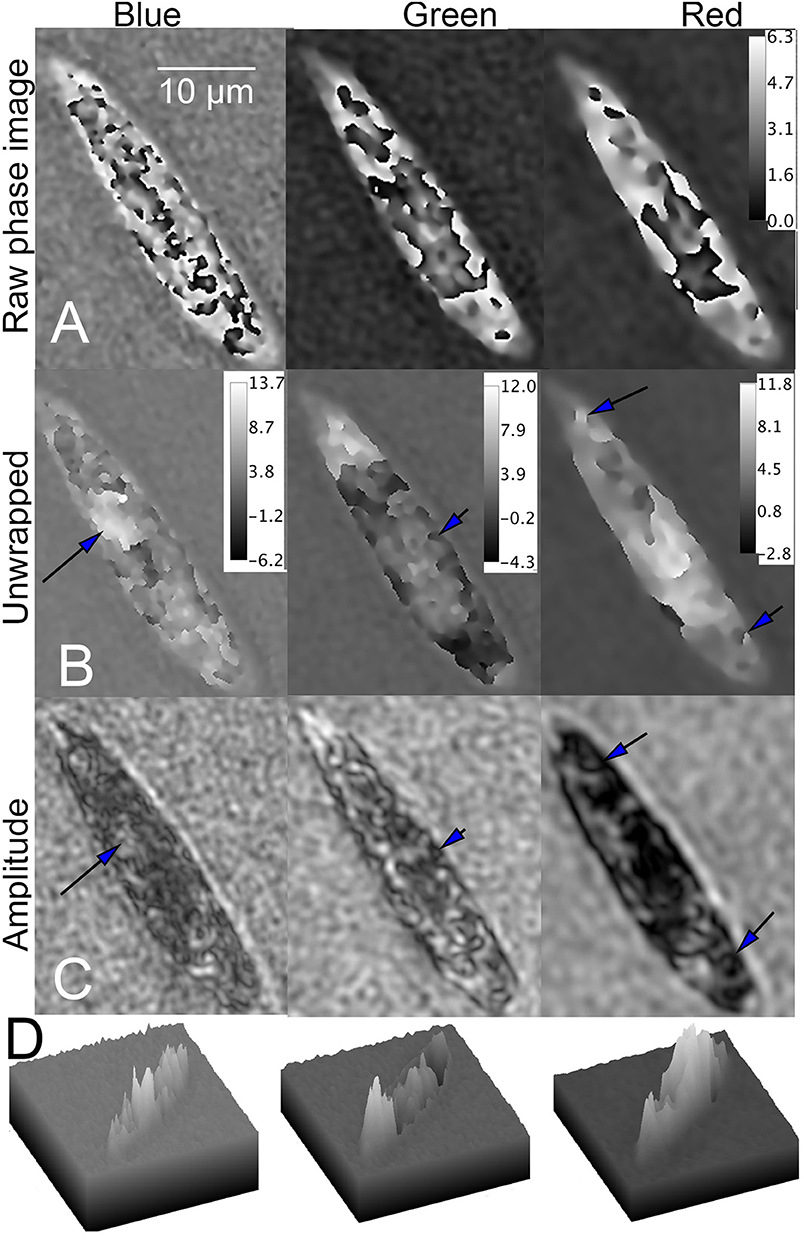
Figure 9. Phase unwrapping of wild-type Euglena in three wavelengths. Phase scale bars are in radians. The spatial scale bar applies to all panels. (A) Raw phase image showing decreasing wrapping with increasing wavelength. (B) Unwrapped phase images compared with (C) amplitude image. In the blue (Left), the nucleus can be seen (arrow). In green (Center), features at the edge of the cell correspond in amplitude and phase (arrow), but the phase in the central part of the cell is almost featureless. In red (Right), areas of both positive and negative contrast are seen (arrows), with large areas of positive phase contrast corresponding to dark areas in amplitude. (D) Surface plot of phase shifts in blue (left), green (center), and red (right).
In bleached cells, overall phase shifts were considerably less. In blue, wrapping was seen primarily at the perimeter of the cell. In green and red, phase wraps occurred near the center of the cell, with multiple small regions rather than a single large wrapped region as seen in the unbleached cells (Figure 10A). Unwrapping in blue yielded excellent results, with numerous micron-sized sub-cellular features that correlated with the amplitude images. The green and red unwrapped phase images also showed a significant amount of subcellular detail. Areas of positive and negative contrast were apparent, correlating with dark and light features in amplitude. Figures 10B,C shows the unwrapped phase at each wavelength and its correspondence with amplitude. Figures 10D shows surface plots of unwrapped phase, showing areas of positive, and negative contrast.
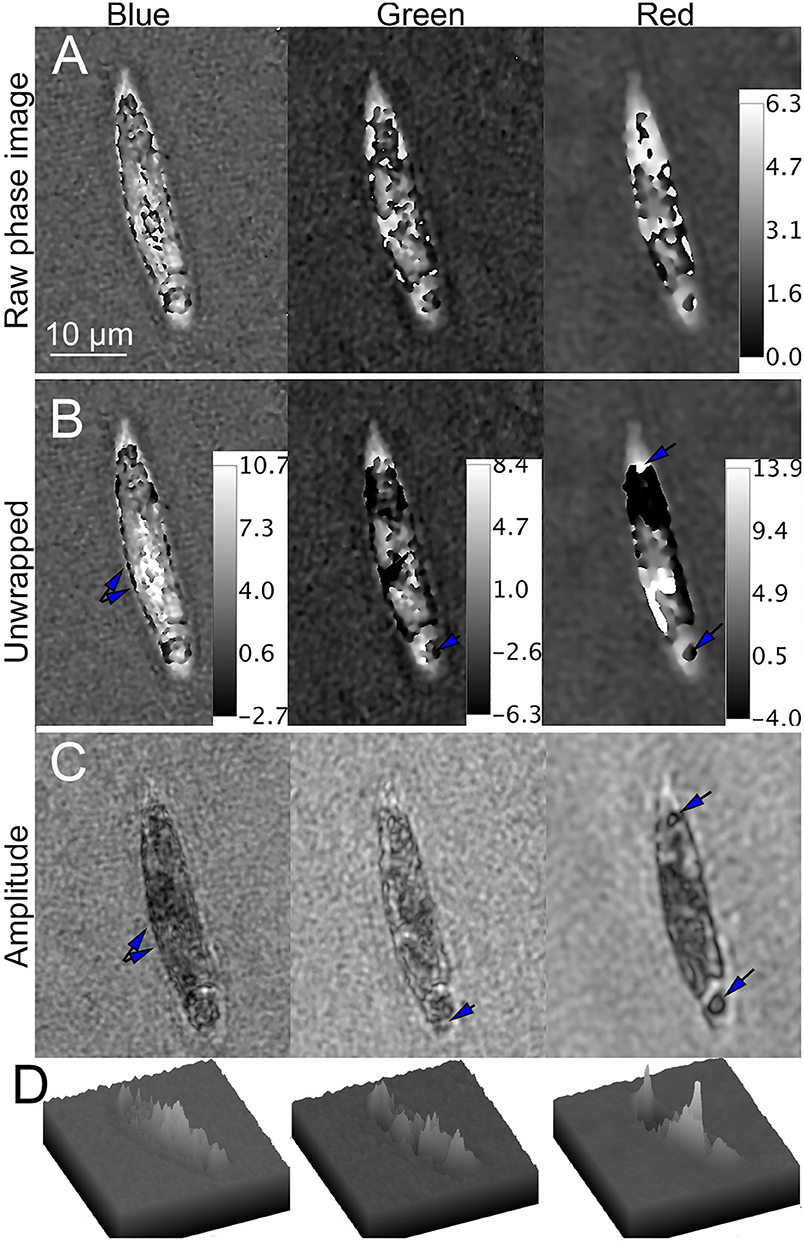
Figure 10. Phase unwrapping of streptomycin bleached Euglena in three wavelengths. Phase scale bars are in radians. The spatial scale bar applies to all panels. (A) Raw phase image showing decreasing wrapping with increasing wavelength. (B) Unwrapped phase images compared with (C) amplitude image. In the blue (Left), there are multiple small features on the edges of the cell apparent in both amplitude and phase (arrows). In green (Center), large areas of the cell that appear transparent in amplitude are dark in phase. In red (Right), areas of both positive and negative contrast are seen (arrows), with large areas of positive phase contrast corresponding to dark areas in amplitude and negative contrast corresponding to transparent areas in amplitude. (D) Surface plot of phase shifts in blue (left), green (center), and red (right).
Discussion
Microalgae, such as Euglena, are vitally important parts of aquatic ecosystems and determine the amount of light that penetrates into bodies of water. Because of this importance, their optical properties at the molecular, cellular, and bulk level have been well characterized and modeled; an excellent review is found in [32]. A Euglena cell and its components fall between the Mie regime (comparable to the wavelength of light) and the geometric optics regime (much larger than the wavelength). The cytoplasm may be considered as homogeneous, with organelles and the cell itself corresponding to areas of altered real and imaginary refractive index. The real part of the refractive index causes phase shifting and is related to the density of the material (mostly related to carbon content). Values for cytoplasm are ~1.36 and for chloroplasts ~1.51 across the visible spectrum. The imaginary part is related to the absorbance (extinction coefficient) and is near zero for everything except pigments such as chlorophyll and carotenoids.
We therefore used the presence or absence of chlorophyll as a method of evaluating the ability of DHM amplitude and phase imaging to reflect changes in both the real and imaginary index. Wild-type Euglena have a large number of chloroplasts, with the majority of the cell appearing green in brightfield as seen in Figure 2A. Notable exceptions are the eyespot, which appears red, and the nucleus, which appears translucent. Streptomycin-bleached Euglena contain much less chlorophyll and fewer organelles overall, as shown in Figure 2B. Their absorbance spectra differ accordingly and clearly illustrate that two of the wavelengths used (blue, 405 and red, 638 nm) are strongly absorbed by chlorophyll, whereas the third wavelength (green, 520 nm) fell between both absorbance peaks.
These properties were clearly illustrated by the amplitude and phase reconstructions seen in Figures 7, 8. In amplitude, assignment of our chosen illumination wavelengths to Blue, Green, and Red channels led to a surprisingly accurate reconstruction of the real color of the cells. This was made possible by the sharp peaks of the chlorophyll spectrum.
Phase images showed large shifts across all 3 colors, as simulated in Figures 5A,C. This is consistent with the real part of the refractive index being reasonably constant across wavelength. Wild-type Euglena were very dense, resulting in multiple phase wraps with all wavelengths. The dual-wavelength “beat wavelength” approach to phase unwrapping did not work for these samples. We did obtain good results using this approach with a microlens (data not shown), indicating that the algorithm worked as previously reported in the literature. However, it may not work for many biological samples, probably due to multiple factors: phase noise that varies across the wavelengths as well as some degree of dispersion in the cells. Even minimal dispersion would affect the performance of the algorithm at the spatial scale of organelles, which were the objects of interest here.
Nonetheless, a single-wavelength algorithm worked quite well. For cells of this size and density, tomographic techniques [33–35] would be required to obtain greater resolution of organelles.
Streptomycin-bleached Euglena showed a dramatic loss of the green color in amplitude, and a significant reduction in phase shift at all wavelengths. Intracellular organelles down to the ~1 μm scale could be resolved after phase unwrapping with the 405 nm wavelength. This increased ease of phase imaging resulted from an overall decrease in cell density and number of organelles, as could be confirmed from the brightfield and amplitude images—the cells appeared “full of holes.”
Amplitude and phase reconstructions, registration, and unwrapping were all performed using the algorithms cited in the literature, which we converted to custom Fiji plug-ins. These plug-ins are maintained on a Fiji update site that we maintain regularly. In the future, we hope to add more reconstruction algorithms, automatic focus detection, and a way to insert custom extensions throughout the entire process. We also wish to add more robust unwrapping methods.
In conclusion, 3-wavelength DHM can provide realistic RGB renditions of microalgae and insight into their real and imaginary indices. The volumetric imaging capability of DHM allows for this imaging to be done while microalgae move unconstrained in a 3D environment populated by multiple organisms interacting with each other and their environment.
Data Availability
The datasets analyzed for this study, plus additional datasets, are available on our public motility database: motility.research.pdx.edu or by request. To install the plugins described here in Fiji, the update site “http://sites.imagej.net/Sudgy” must be enabled in the updater (see Fiji's documentation for details).
Author Contributions
DC chose algorithms for reconstruction, reference hologram subtraction, and unwrapping, wrote plug-ins and created plug-in repository and tutorials, reconstructed and unwrapped data. IH cultured and maintained Euglena, performed all imaging experiments and spectroscopy, chose representative datasets to present, reconstructed holograms and created simulations. JW designed and built the microscope. JN conceived and oversaw experiments, performed simulations and data analysis, wrote the paper.
Funding
This work was supported by the Gordon and Betty Moore Foundation (GBMF) grant number 4038 and the National Science Foundation Award #1828793. Portions of this work were carried out at the Jet Propulsion Laboratory, California Institute of Technology, under a contract with the National Aeronautics and Space Administration. We thank C. Lindensmith and E. Serabyn for useful discussions.
Conflict of Interest Statement
The authors declare that the research was conducted in the absence of any commercial or financial relationships that could be construed as a potential conflict of interest.
Supplementary Material
The Supplementary Material for this article can be found online at: https://www.frontiersin.org/articles/10.3389/fphy.2019.00094/full#supplementary-material
Supplementary Video 1. RGB amplitude reconstruction of wild-type Euglena swimming in real time.
Supplementary Video 2. A few Euglena cells reconstructed in amplitude with speed slowed down by a factor of 15, showing characteristic rotation as the cells swim.
Supplementary Video 3. RGB phase reconstruction of wild-type Euglena swimming in real time.
Supplementary Video 4. A few Euglena cells reconstructed in phase with speed slowed down by a factor of 15, showing characteristic rotation as the cells swim.
Supplementary Video 5. Larger field of view RGB amplitude reconstruction of bleached Euglena.
Supplementary Video 6. A single bleached Euglena cell reconstructed in amplitude, showing cell contraction.
Supplementary Video 7. Bleached Euglena cell reconstructed in phase, showing cell rotations, and contractions (slowed 7 ×).
References
1. Marquet P, Rappaz B, Magistretti PJ, Cuche E, Emery Y, Colomb T, et al. Digital holographic microscopy: a non-invasive contrast imaging technique allowing quantitative visualization of living cells with subwavelength axial accuracy. Opt Lett. (2005) 30:468–70. doi: 10.1364/OL.30.000468
2. Boss D, Kuhn J, Jourdain P, Depeursinge C, Magistretti PJ, Marquet P. Measurement of absolute cell volume, osmotic membrane water permeability, and refractive index of transmembrane water and solute flux by digital holographic microscopy. J Biomed Opt. (2013) 18:036007. doi: 10.1117/1.JBO.18.3.036007
3. Son K, Brumley DR, Stocker R. Live from under the lens: exploring microbial motility with dynamic imaging and microfluidics. Nat Rev Microbiol. (2015) 13:761–75. doi: 10.1038/nrmicro3567
4. Lindensmith CA, Rider S, Bedrossian M, Wallace JK, Serabyn E, Showalter GM, et al. A submersible, off-axis holographic microscope for detection of microbial motility and morphology in aqueous and icy environments. PLoS ONE. (2016) 11:e0147700. doi: 10.1371/journal.pone.0147700
5. Bedrossian M, Barr C, Lindensmith CA, Nealson K, Nadeau JL. Quantifying microorganisms at low concentrations using Digital Holographic Microscopy (DHM). J Vis Exp. (2017) 129:e56343. doi: 10.3791/56343
6. Jourdain P, Boss D, Rappaz B, Moratal C, Hernandez M-C, Depeursinge C, et al. Simultaneous optical recording in multiple cells by digital holographic microscopy of chloride current associated to activation of the ligand-gated chloride channel GABAA receptor. PLoS ONE. (2012) 7:e51041. doi: 10.1371/journal.pone.0051041
7. Khmaladze A, Matz RL, Epstein T, Jasensky J, Holl MMB, Chen Z. Cell volume changes during apoptosis monitored in real time using digital holographic microscopy. J Struct Biol. (2012) 178:270–8. doi: 10.1016/j.jsb.2012.03.008
8. Pavillon N, Kuhn J, Moratal C, Jourdain P, Depeursinge C, Magistretti PJ, et al. Early cell death detection with digital holographic microscopy. PLoS ONE. (2012) 7:e30912. doi: 10.1371/journal.pone.0030912
9. Schnars U, Juptner WPO. Digital recording and numerical reconstruction of holograms. Measur Sci Technol. (2002) 13:R85–101. doi: 10.1088/0957-0233/13/9/201
10. Kim MK. Digital Holographic Microscopy: Principles, Techniques, and Applications. New York, NY: Springer (2011). doi: 10.1007/978-1-4419-7793-9
11. Nehmetallah G, Williams L, Nguyen T, Li H, Matthews S. Latest advances in single and multiwavelength digital holography and holographic microscopy. Asian J Phys. (2016) 25:609–30.
12. Liu Y, Wang Z, Huang JH. Recent progress on aberration compensation and coherent noise suppression in digital holography. Appl Sci-Basel. (2018) 8:444. doi: 10.3390/app8030444
13. Cuche E, Bevilacqua F, Depeursinge C. Digital holography for quantitative phase-contrast imaging. Opt Lett. (1999) 24:291–3. doi: 10.1364/OL.24.000291
14. Park Y, Depeursinge C, Popescu G. Quantitative phase imaging in biomedicine. Nat Photonics. (2018) 12:578–89. doi: 10.1038/s41566-018-0253-x
15. Gass J, Dakoff A, Kim MK. Phase imaging without 2 pi ambiguity by multiwavelength digital holography. Opt Lett. (2003) 28:1141–3. doi: 10.1364/OL.28.001141
16. De Nicola S, Finizio A, Pierattini G, Alfieri D, Grilli S, Sansone L, et al. Recovering correct phase information in multiwavelength digital holographic microscopy by compensation for chromatic aberrations. Opt Lett. (2005) 30:2706–8. doi: 10.1364/OL.30.002706
17. Kuhn J, Colomb T, Montfort F, Charriere F, Emery Y, Cuche E, et al. Real-time dual-wavelength digital holographic microscopy with a single hologram acquisition. Opt Express. (2007) 15:7231–42. doi: 10.1364/OE.15.007231
18. Parshall D, Kim MK. Digital holographic microscopy with dual-wavelength phase unwrapping. Appl Opt. (2006) 45:451–9. doi: 10.1364/AO.45.000451
19. Matsuda A, Schermelleh L, Hirano Y, Haraguchi T, Hiraoka Y. Accurate and fiducial-marker-free correction for three-dimensional chromatic shift in biological fluorescence microscopy. Sci Rep. (2018) 8:7583. doi: 10.1038/s41598-018-25922-7
20. Foltinova P. Permanent bleaching of euglena-gracilis by acridine-orange and its inhibition caused by substances with antimutagenic properties. Biologia. (1994) 49:851–4.
21. Zahalsky AC, Burger RM, Hutner SH, Keane M. Bleaching Euglena Gracilis With Antihistamines and Streptomycin-Type Antibiotics. Archiv Fur Mikrobiologie. (1962) 42:46–55. doi: 10.1007/BF00425189
22. Wallace JK, Rider S, Serabyn E, Kuhn J, Liewer K, Deming J, et al. Robust, compact implementation of an off-axis digital holographic microscope. Opt Express. (2015) 23:17367–78. doi: 10.1364/OE.23.017367
23. Wallace JK, Nadeau J, Bedrossian M, Rider S, Serabyn E, Lindensmith C. A multiwavelength digital holographic microscope architecture for enhancing life detection. In: IEEE Aerospace Conference, Big Sky, MT (2019). doi: 10.1109/AERO.2019.8742091
24. Piedrahita-Quintero P, Castaneda R, Garcia-Sucerquia J. Numerical wave propagation in ImageJ. Appl Opt. (2015) 54:6410–5. doi: 10.1364/AO.54.006410
25. Colomb T, Kuhn J, Charriere F, Depeursinge C. Total aberrations compensation in digital holographic microscopy with a reference conjugated hologram. Opt Expr. (2014) 39:6070–3. doi: 10.1364/oe.14.004300
26. Colomb T, Cuche E, Charriere F, Kuhn J, Aspert N, Montfort F, et al. Automatic procedure for aberration compensation in digital holographic microscopy and applications to specimen shape compensation. Appl Opt. (2006) 45:851–63. doi: 10.1364/AO.45.000851
27. Goldstein G. Smart Temporal Phase Unwrapping for Biological Objects. PhD, University of Arizona (2013).
28. Turko NA, Eravuchira PJ, Barnea I, Shaked NT. Simultaneous three-wavelength unwrapping using external digital holographic multiplexing module. Opt Lett. (2018) 43:1943–6. doi: 10.1364/OL.43.001943
29. Saalfeld S, Tomancák P. Automatic landmark correspondence detection for ImageJ. In: Proceedings of the ImageJ User and Developer Conference 6th and 7th November. Luxembourg (2008). p. 128–133.
30. Piedrahita-Quintero P, Garcia-Sucerquia J. Off-axis digital holography simulation in ImageJ. Optik. (2017) 140:626–33. doi: 10.1016/j.ijleo.2017.04.091
31. Singhal GS, Williams WP, Rabinowi E. Fluorescence and absorption studies on chlorophyll a in vitro at 77 degrees K. J Phys Chem. (1968) 72:3941. doi: 10.1021/j100858a002
32. Lehmuskero A, Chauton MS, Bostrom T. Light and photosynthetic microalgae: a review of cellular- and molecular-scale optical processes. Prog Oceanogr. (2018) 168:43–56. doi: 10.1016/j.pocean.2018.09.002
33. Charriere F, Marian A, Montfort F, Kuehn J, Colomb T, Cuche E, et al. Cell refractive index tomography by digital holographic microscopy. Opt Lett. (2006) 31:178–80. doi: 10.1364/OL.31.000178
34. Isikman SO, Greenbaum A, Luo W, Coskun AF, Ozcan A. Giga-pixel lensfree holographic microscopy and tomography using color image sensors. PLoS ONE. (2012) 7:e45044. doi: 10.1371/journal.pone.0045044
Keywords: digital holographic microscopy, phase imaging, phase unwrapping, multiwavelength, imageJ, hologram reconstruction, image registration
Citation: Cohoe D, Hanczarek I, Wallace JK and Nadeau J (2019) Multiwavelength Digital Holographic Imaging and Phase Unwrapping of Protozoa Using Custom Fiji Plug-ins. Front. Phys. 7:94. doi: 10.3389/fphy.2019.00094
Received: 28 February 2019; Accepted: 19 June 2019;
Published: 05 July 2019.
Edited by:
Pietro Ferraro, Italian National Research Council (CNR), ItalyReviewed by:
Xiaojun Yu, Nanyang Technological University, SingaporeRohith Reddy, University of Houston, United States
Copyright © 2019 Cohoe, Hanczarek, Wallace and Nadeau. This is an open-access article distributed under the terms of the Creative Commons Attribution License (CC BY). The use, distribution or reproduction in other forums is permitted, provided the original author(s) and the copyright owner(s) are credited and that the original publication in this journal is cited, in accordance with accepted academic practice. No use, distribution or reproduction is permitted which does not comply with these terms.
*Correspondence: Jay Nadeau, bmFkZWF1QHBkeC5lZHU=
 David Cohoe1
 Iulia Hanczarek
 Jay Nadeau