Abstract
Mitochondria are dynamic organelles found in almost all eukaryotic cells and perform several key cellular functions such as generating energy, triggering cell differentiation, and initiating cell death. They have their own DNA (mtDNA) and often come in multiple genetic varieties within a single cell. Dynamical processes such as mitochondrial fission, fusion, autophagy, and mitotic segregation can enable a mitochondrion population to eventually dominate the mitochondria genomic pool, sometimes with devastating consequences. Therefore, understanding how changes in mtDNA accumulate over time and are correlated to changes in mitochondrial function can have a profound impact on our understanding of fundamental cell biophysics and the origins of some human diseases. Motivated by this, we develop and study a mathematical model to determine which cellular parameters have the largest impact on mtDNA population dynamics. The model consists of coupled differential equations to describe populations of healthy and dysfunctional mitochondria subject to mitochondrial fission, fusion, autophagy, and varying levels of cellular ATP. We study the time evolution of each population under specific selection biases and obtain a heat map in the parameter space of the ratio of the rates of fusion and autophagy of the healthy and dysfunctional populations. Our results may provide insights into how different mitochondrial populations survive and evolve under different selection pressures and with time.
1. Introduction
Mitochondria are organelles located inside eukaryotic cells and are famously known as the powerhouse of the cell because of their role in energy (ATP) production. They are also essential for other key cellular processes such as cell signaling, triggering cell differentiation, and initiating apoptosis. Mitochondria have their own genome (mitochondrial DNA or mtDNA) rather than taking molecular instructions from genetic material in the cell nucleus [1–4]. Most human cells have several hundred mitochondria that undergo fission and fusion in response to factors that are largely unknown [5–8, 16, 17]. Mitochondrial DNA can undergo recombination in addition to nucleotide substitutions, and base insertions or deletions that lead to mtDNA heterogeneity [2–4]. Thus, all organisms are believed to have low levels of variation in mtDNA. Furthermore, mtDNA is continuously turned over, independently of the nuclear genome. The lack of coordination between mtDNA replication and the cell cycle, and clonal expansion can cause mitochondria with mutant (unhealthy) mtDNA to outnumber mitochondria with wild-type (healthy) mtDNA in the daughter cell, eventually dominating the mtDNA pool [1–4, 9, 16, 17]. If the proportion of mitochondria with mutant mtDNA exceeds the pathogenic threshold for a tissue, it can lead to diseases. Alterations in mtDNA are connected to a range of human health conditions, including respiratory problems, epilepsy, heart failure, Parkinson's disease, diabetes, multiple sclerosis, and the process of aging [1, 9–12]. Conversely, mutant mtDNA populations can shrink and disappear, particularly in fast-dividing tissues.
A significant leap in the understanding of mtDNA population dynamics came in the form of experiments which found that cells can control mitochondrial quality and health though the interplay of mitochondrial fusion and mitophagy, with faster isolation of mutant mtDNA via selective fusion and their removal via selective mitochondrial autophagy (mitophagy) [8, 13, 14]. However, most studies in mammalian cells were performed on tumor cells lines or involved non-physiological perturbations of mitochondrial functions such as via the uncoupler carbonyl cyanide m-chlorophenylhydrazone (CCCP), and quantitative data on the rates of mitochondrial fission, fusion, and mitophagy and how they relate to mtDNA quality control in healthy mammalian tissues is still lacking [15]. At the same time, systems biology approaches consisting of a variety of mathematical models and sensitivity analyses have emerged as a complementary approach to obtain insights into how the selectivity and rates of mitochondrial dynamical processes impact quality control [7, 15–17].
Here we ask: What are the population dynamics of mtDNA in mammalian cells, and how are they modulated by mitochondrial dynamics and bioenergetics? We present a minimal mathematical model to study the interplay of mitochondrial dynamics [16, 17] and bioenergetics, and its impact on mtDNA population dynamics. The model consists of coupled ODEs to describe populations of healthy and dysfunctional (unhealthy) mitochondria subject to mitochondrial fission, fusion, mitophagy, and varying levels of cellular ATP, which depend on ATP production by mitochondria and energy use during mitochondrial dynamics and other physiological processes [18]. Using this model, we predict the time evolution of each population under specific selection biases, and obtain a heat map for mitochondrial population health in the parameter space of the ratio of the rates of fusion and autophagy of the healthy and unhealthy populations.
2. Model
All mitochondria are formed in cells via biogenesis. Smaller mitochondria can fuse together to form larger structures by fusion, while larger mitochondria can fragment into smaller mitochondria via fission. Small, unfused mitochondria can be removed from the cell through mitophagy [5–8]. This is schematically shown in Figure 1 These dynamical processes interplay with mitochondrial bioenergetics i.e., processes that determine ATP generation and use, and together they modulate the dynamics of mitochondrial genome (mtDNA) populations.
Figure 1
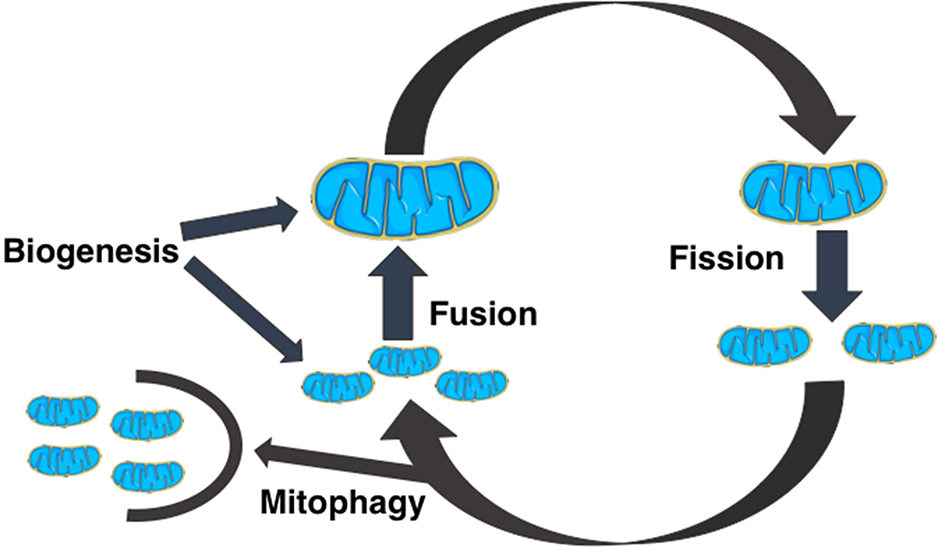
A schematic diagram of the dynamical events that regulate the size, shape, and number of mitochondria in cells. Cells create new mitochondria by the process of biogenesis, a mitochondrion spontaneously divides into two mitochondria by mitochondrial fission, two mitochondria can combine to form a bigger mitochondrion by mitochondrial fusion, and fragmented or unfused mitochondria are removed from the cell by mitophagy.
To model the health of a single cell's mitochondria population, we divided the total concentration of mitochondria into four populations: healthy and fused (Chf), healthy and unfused (Chu), unhealthy and fused (Cuf), unhealthy and unfused (Cuu). In the context of this model, an “unhealthy” mitochondrion is a mitochondrion whose DNA has undergone harmful mutations.
We make the following assumptions.
-
All mitochondria are formed at a rate B, and all fused mitochondria undergo fission at a rate F. In other words, healthy and dysfunctional mitochondria have the same rates of biogenesis and fission.
-
Healthy mitochondria fuse at a higher rate, while dysfunctional mitochondria undergo mitophagy at a higher rate [16, 17]. The rates of fusion of healthy and unhealthy mitochondria are λh and λu, respectively, and the corresponding rates of mitophagy are Mh and Mu respectively.
-
Energy (ATP) is produced by all mitochondria. Healthy mitochondria are more efficient in producing ATP than unhealthy mitochondria (by a factor γ), and within the healthy and unhealthy populations, fused mitochondria produce ATP at a rate that is μ times that of their unfused counterparts.
-
Energy (ATP) is used in mitochondrial fission and fusion. This is incorporated in our model by making the rates of fission and fusion dependent on ATP concentration [ATP] as F = F0[ATP], λh = λh0[ATP], and λu = λu0[ATP]. ATP is also consumed in other physiological processes (σcell).
With the above assumptions, the coupled ODEs that describe the dynamics of the mitochondria populations can be written as follows.
where
We further assume that the total amount of mtDNA in a cell does not change with time. In the model, this assumption translates to the total number of mitochondria created by biogenesis being equal to the total number of mitochondria that is removed by mitophagy, i.e., B(Chf + Cuf + Chu + Cuu) = MhChu + MuCuu. We use this constraint to replace the rate of biogenesis B in our model in terms of the mitophagy rates and the concentrations of the four mitochondria populations.
We studied the time evolution of the concentrations of the four mitochondria populations using Equations (1) and (2) for physiologically relevant cellular conditions. The rates associated with mitochondrial dynamics, unless otherwise mentioned, were chosen to be λh0 = 0.2 Mito−1 min−1, λu0 = 0.15 Mito−1 min−1, F0 = 0.1 Mito−1 min−1, Mu = 5 × 10⁻³ Mito−1 min−1, and Mh = 5 × 10⁻⁴ Mito−1 min−1, approximately following the values used in Patel et al. [17]. The parameters chosen represent an example of mitochondria in mammalian cells that have not been altered by pharmacological agents and do not belong to specific disease states such as cancer which can alter mitochondrial states in ways not yet well-understood.
For the ATP dependent calculations, we have set σcell = 3.0, γ = 1.87 Mito−1 min−1, and μ = 1.43, unless otherwise mentioned. Initial concentration of each population is 1.
3. Results and Discussion
We first examine the role of mitochondrial dynamics, i.e., fission, fusion, and mitophagy, without taking ATP dependence into consideration. In our model, this amounts to setting the parameter [ATP] = 1 in Equation (1) and ignoring Equation (2). Assuming selection pressures that lead to healthy mitochondria fusing at higher rates than unhealthy mitochondria while the latter is removed from the cell at a higher rate, one would expect mitochondrial populations to consists of significantly higher concentrations of healthy mitochondria at long times. This is captured by our model and shown in Figure 2. This figure shows that over long times ~ few days, mitochondrial populations reach a steady state whereby the concentration of healthy mitochondria saturate at large values, while their unhealthy counterparts reach vanishingly small concentrations. Furthermore, we observe that within the healthy population, fused mitochondria are more prevalent. To examine the relative impact of selective fusion and mitophagy, we vary the ratio of rates fusion α = λh/λu, and of mitophagy ω = Mh/Mu of the of healthy and unhealthy mitochondria, where subscripts h and u correspond to healthy and unhealthy, respectively. In Figure 3A, we show the ratio of the healthy to unhealthy mitochondria population concentrations, , in steady state. We find that mitochondria population health can be enhanced by increasing α and by decreasing ω, most effectively by a combination of the two. While increasing α helps to selectively isolate dysfunctional mitochondria, decreasing ω helps to selectively remove them. This also explains the more sensitive dependence of the quality control mechanism on variations in ω.
Figure 2
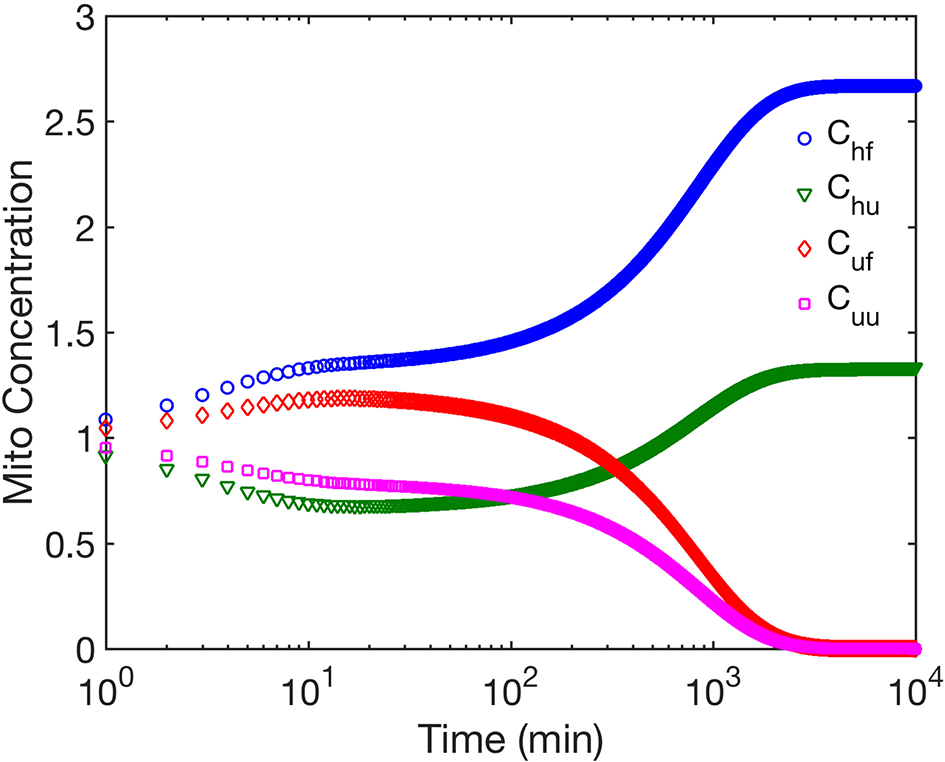
The figure shows the time evolution of concentrations of the four mitochondria subpopulations corresponding to fused mitochondria with wild type (healthy) mtDNA (Chf), fused mitochondria with mutant (unhealthy) mtDNA (Cuf), unfused mitochondria with healthy mtDNA (Chu), and unfused mitochondria with unhealthy mtDNA (Cuu). Note there is no cell division within the timeframe studied. We have ignored ATP dependence here.
Figure 3
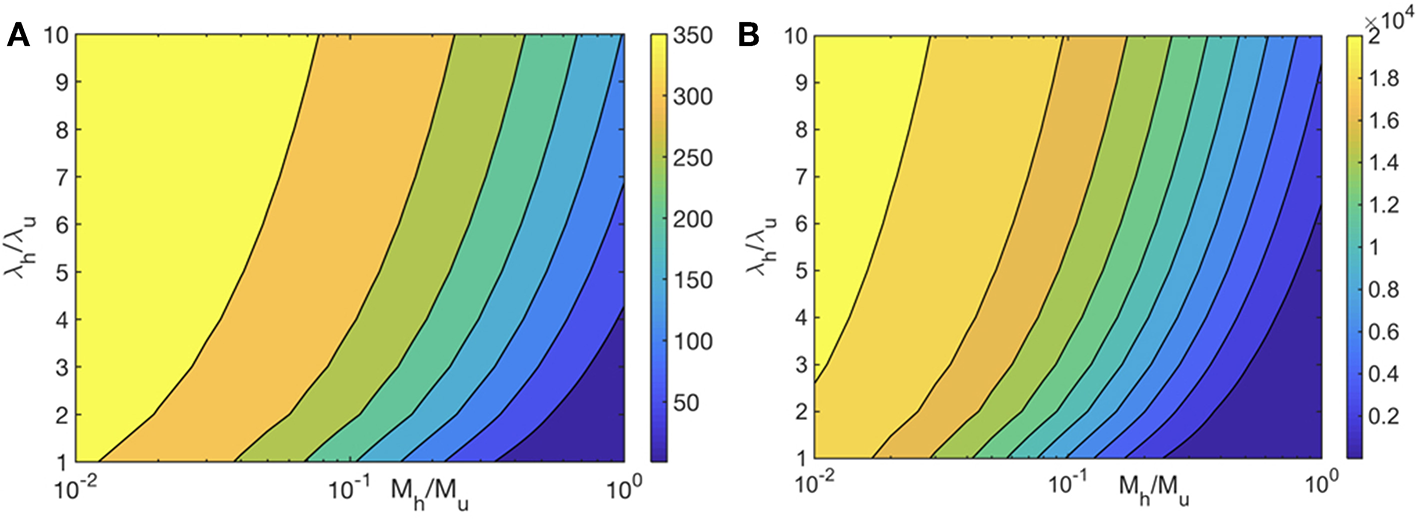
Heat map of the steady state ratio of healthy and unhealthy mitochondria populations () as a function of the ratio of their fusion (λh/λu) and mitophagy (Mh/Mu) rates. We have set λu0 = 0.15 Mito−1 min−1, and Mu = 5 × 10⁻³ Mito−1 min−1. ATP dependence is ignored in (A) and is taken into account in (B) with all mitochondria producing ATP at the same rate.
Next we study how mitochondrial bioenergetics modulates the population dynamics by solving Equations (1) and (2) together. We studied two cases: (i) where all mitochondria produce ATP at the same rate, i.e., γ = μ = 1, and (ii) where healthy mitochondria produce ATP at a higher rate than unhealthy mitochondria (γ = 1.87 Mito−1 min−1), and within each population, we assume the fused mitochondria to be more efficient in generating ATP (μ = 1.43). We investigate how the presence of ATP dependence changes the dynamics of mitochondria populations, and what, if any, perturbations are facilitated by the possible advantages possessed by healthy or fused populations.
We first examine the heat map for mitochondria population health for (i) and compare it to the case without any ATP dependence. Although the heat maps without and with ATP dependence look qualitatively similar, the difference between the concentrations of healthy and unhealthy mitochondria is significantly larger for the ATP dependent case, implying that the quality control mechanism is much more effective (Figures 3A,B). Mitochondria population health is thus significantly enhanced when we take the ATP dependence of mitochondrial dynamical processes into account.
Next we compare the cases (i) and (ii). We find that for both mechanisms, ATP dependence causes small but observable variations in the dynamics of the four mitochondria populations at small times as seen by comparing Figures 2, 4, while their asymptotic behavior is the same. We do find a significant enhancement of the steady state ATP concentration for case (ii) compared to (i) (Figure 4 inset). In Figure 5, we compare the time evolution of ratio of the total populations of fused (Chf + Cuf) and unfused (Cuf + Cuu) mitochondria, and find that while bioenergetics confers an extra advantage to fused mitochondria over unfused mitochondria at small to moderate times (~ 10 min), the behavior of the models with and without bioenergetics are the same at very large times (~ days); the difference at small times may, however, be important when such times are comparable to the timescales for other relevant cellular processes such as mitosis for fast dividing cells.
Figure 4
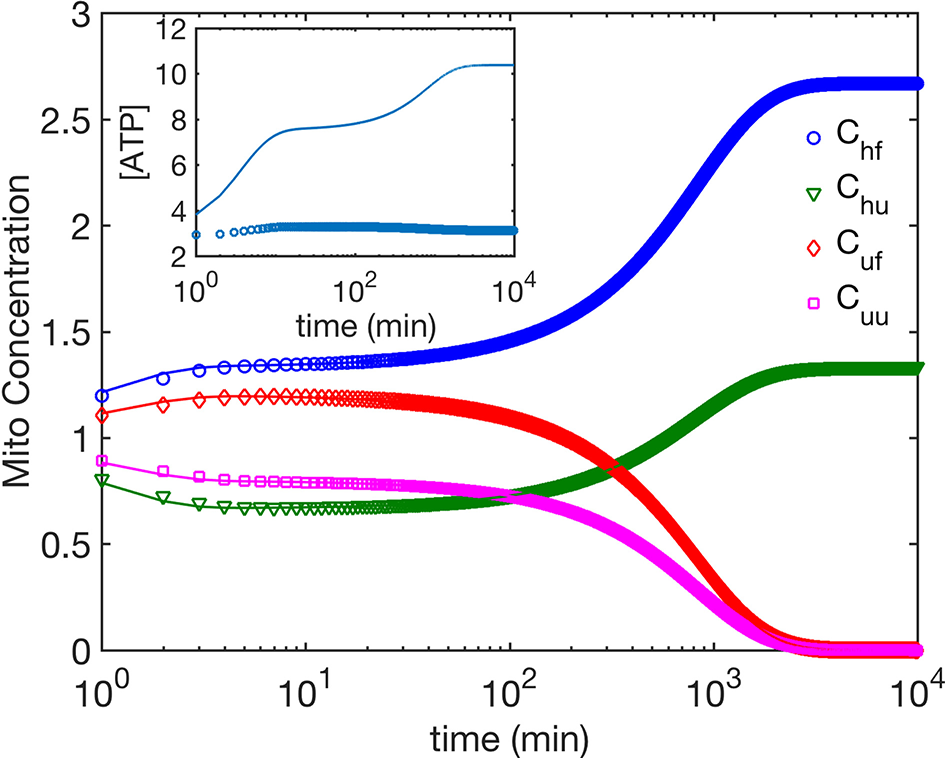
The time evolution of mitochondria population concentrations; ATP dependence is taken into account. Inset shows the time evolution of ATP concentration. The phenomenological parameters for ATP generation and use are as follows. σcell = 3 for all data shown here. Open symbols correspond to γ = 1.87 Mito−1 min−1, μ = 1.43, i.e., healthy and fused mitochondria are more efficient in generating ATP, while the solid lines correspond to γ = 1 Mito−1min−1, μ = 1, i.e., all mitochondria generate ATP at the same rate.
Figure 5
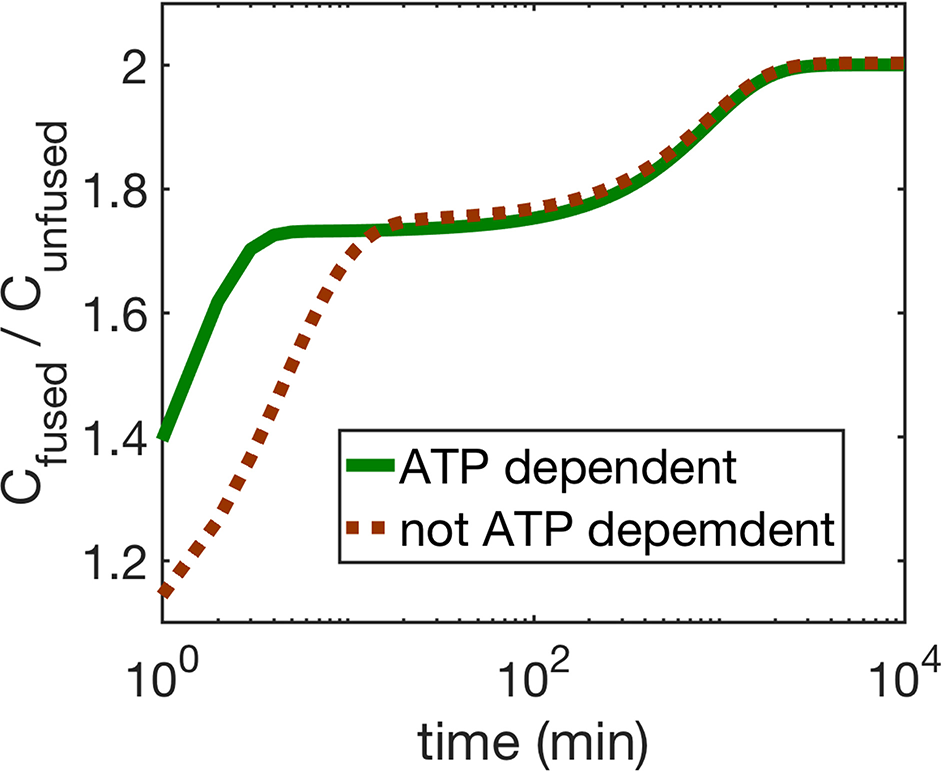
The figure shows the ratio of fused and unfused mitochondria concentrations when (i) ATP dependence is taken into account (solid line), and (ii) when it is not taken into account (dashed line). For the ATP dependent case, all mitochondria generate ATP at the same rate, i.e., γ = 1 Mito−1min−1, μ = 1.
Finally, we performed a standard linear stability analysis to investigate the stability of the steady states of the healthy fused, healthy unfused, unhealthy fused, and unhealthy unfused population concentrations. To do this, we introduced small perturbations in the concentrations Chf, Chu, Cuf, and Cuu, obtained the Jacobian matrix that governs the evolution of the perturbations at the steady state, and computed its eigenvalues. We carried out this analysis for both the ATP independent case as well as the ATP dependent case (i). In Figure 6, we show the eigenvalues as a function of the selective mitophagy parameter ω = Mh/Mu, the quantity that has the most impact on mitochondrial quality control in our model. We find that, for each case, two of the eigenvalues are approximately zero suggesting marginal stability. Upon closer inspection, however, one of these two eigenvalues has a negative value while the other has a positive value implying that the steady states are unstable. It is also possible that the small deviation of these eigenvalues from zero is a result of the finite precision of the numerical method used to calculate the steady states. We will carry out a more detailed stability analysis in future work.
Figure 6
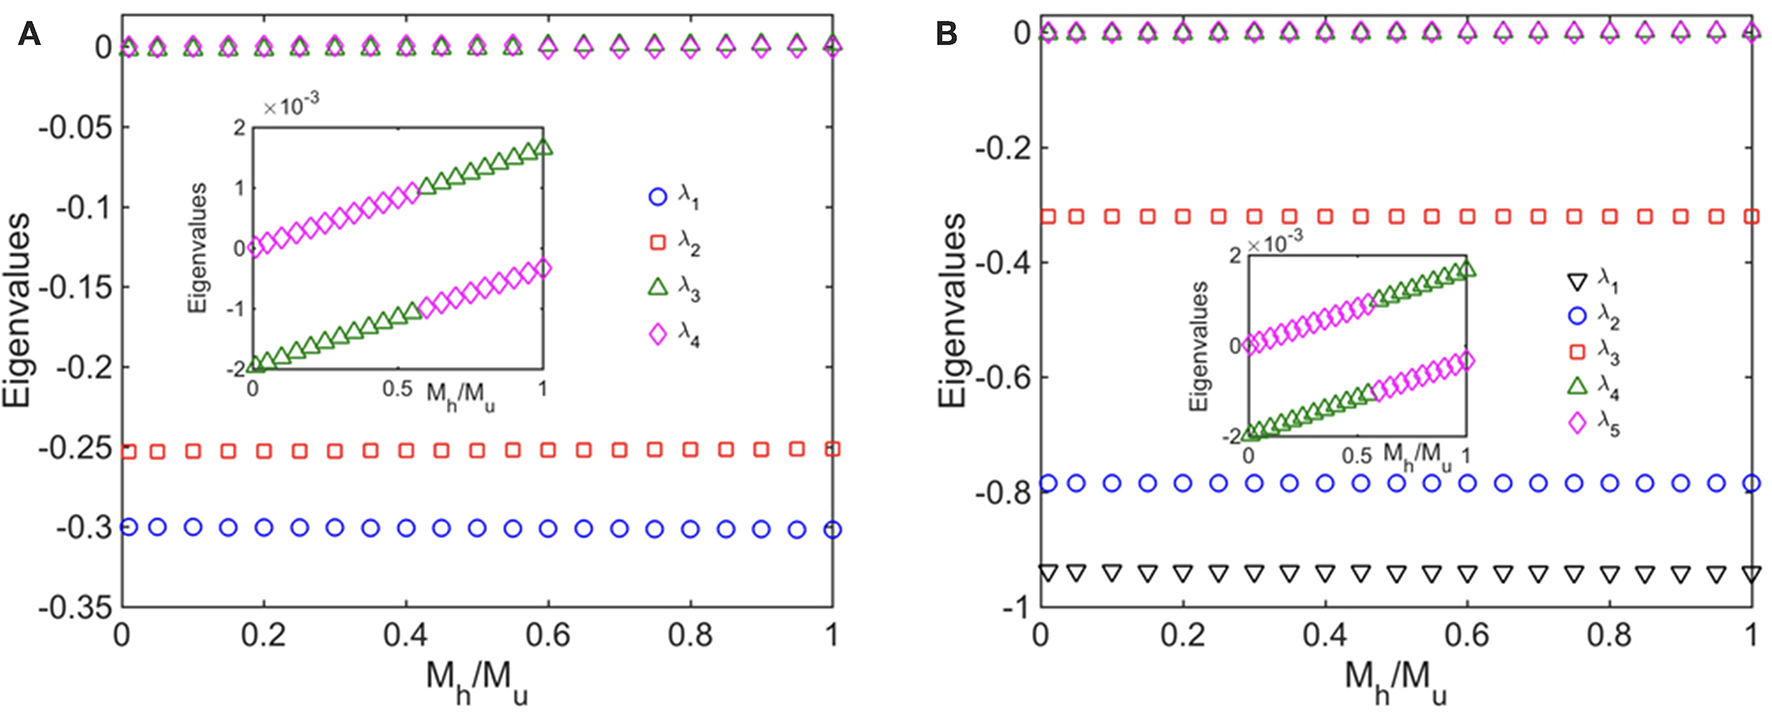
Linear Stability analyses (A) without ATP, and (B) with ATP dependence taken into account; in (B) all mitochondria produce ATP at the same rate. The figures show the eigenvalues of the Jacobian matrix as a function the ratio of the mitophagy rates of healthy and unhealthy mitochondria. We have set λh0 = 0.2 Mito−1 min−1, λu0 = 0.15 Mito−1 min−1, F0 = 0.1 Mito−1 min−1, Mu = 5 × 10⁻³ Mito−1 min−1. In addition, for the ATP dependent case, we have set σcell = 3.0, γ = 1 Mito−1 min−1, and μ = 1.
4. Conclusion
We have studied a minimal ODE model to examine how the population dynamics of cellular mtDNA is influenced by variations in the rates of mitochondrial fission, fusion, mitophagy, and cellular ATP levels, and their interplay. Using this model, we predicted the time evolution of healthy and dysfunctional mitochondria populations, including under specific selection biases in mitochondrial dynamics, namely, selective fusion and selective mitophagy. In particular, we obtained a heat map of mitochondrial population health in the parameter space of the ratio of the rates of fusion, and mitophagy of the healthy and dysfunctional populations. We find that larger mitophagy rates for unhealthy mitochondria have the most significant impact in ensuring that healthy fused mitochondria form the dominant contributor to the mitochondria genome pool at large times. Preferential fusion of healthy mitochondria can further reinforce this mechanism by leaving more unhealthy mitochondria in unfused states to be removed by mitophagy. This suggests that cells may use a combination selective mitophagy of unhealthy mitochondria and selective fusion of healthy mitochondria for quality control of mtDNA, and that these processes likely undergo pathological changes during mtDNA disorders, in agreement with experimental studies [8, 13, 14]. Our results may complement experiments in helping to understand how mitochondrial dynamics and bioenergetics interact synergistically to determine the accumulation of changes in mtDNA over time, and how these changes are correlated to changes in mitochondrial function.
Finally, while the ODE model used in this study provides insights into which selections pressures or biases may be mechanistically most responsible for the regulation of the sizes of mitochondrial subpopulations and hence mtDNA population health, it considerably simplifies reality by assuming equal amount of mtDNA in each mitochondrion no matter whether it is healthy, unhealthy, fused, or unfused, and by ignoring spatial distribution and diffusion of the mitochondria which may play an important role in fusion. Furthermore, while it is widely believed that mitochondrial fusion allows mitochondria to mix their contents thereby providing the chance for mtDNA repair, we have not incorporated the fusion of healthy with unhealthy mitochondria in our model given the lack of quantitative data on the necessary and sufficient conditions for mitochondrial repair mechanisms to work. These would be incorporated in future studies. We will also frame mitochondrial bioenergetics in terms of the mitochondrial membrane potential [19] and oxidative processes [20, 21] in future work, to better connect to experiments, and systematically quantify how perturbations in mitochondrial dynamics and bioenergetics impact the heterogeneity of mitochondrial genotypes over multiple cell cycles, and in collections of many cells.
Statements
Author contributions
MD conceived and directed the research, wrote and edited the manuscript. KK, BB, and LS are undergraduate students who carried out the research under the supervision of MD.
Funding
This research was funded in part by the Gordon and Betty Moore Foundation through Grant GBMF5263.01 to MD. MD and KK were also partially supported by a Cottrell College Science Award from Research Corporation for Science Advancement.
Acknowledgments
MD would like to thank Dan Needleman, and Doug Weibel for useful discussions.
Conflict of interest
The authors declare that the research was conducted in the absence of any commercial or financial relationships that could be construed as a potential conflict of interest.
References
1.
Taylor RW Turnbull DM . Mitochondrial DNA mutations in human disease. Nat Rev Genet. (2005) 6:389–402. 10.1038/nrg1606
2.
Samuels DC Li C Li B Song Z Torstenson E Boyd Clay H et al . Recurrent tissue-specific mtDNA mutations are common in humans. PLoS Genet. (2013) 9:e1003929. 10.1371/journal.pgen.1003929
3.
Stewart JB Chinnery PF . The dynamics of mitochondrial DNA heteroplasmy: implications for human health and disease. Nat Rev Genet. (2015) 16:530–42. 10.1038/nrg3966
4.
Stewart JB Larsson NG . Keeping mtDNA in shape between generations. PLoS Genet. (2014) 10:e1004670. 10.1371/journal.pgen.1004670
5.
Detmer SA Chan DC . Functions and dysfunctions of mitochondrial dynamics. Nat Rev Mol Cell Biol. (2007) 8:870–9. 10.1038/nrm2275
6.
Zhu J Wang KZ Chu CT . After the banquet: mitochondrial biogenesis, mitophagy, and cell survival. Autophagy. (2013) 9:1663–76. 10.4161/auto.24135
7.
Chauhan A Vera J Wolkenhauer O . The systems biology of mitochondrial fission and fusion and implications for disease and aging. Biogerontology. (2014) 15:1–12. 10.1007/s10522-013-9474-z
8.
Ashrafi G Schwarz TL . The pathways of mitophagy for quality control and clearance of mitochondria. Cell Death Differ. (2013) 20:31–42. 10.1038/cdd.2012.81
9.
Seo Y Joseph AM Dutta D Hwang JCY Aris JP Leeuwenburgh C . New insights into the role of mitochondria in aging: mitochondrial dynamics and more. J Cell Sci. (2010)123:2533–42. 10.1242/jcs.070490.
10.
Osiewacz HD Hermanns J . The role of mitochondrial DNA rearrangements in aging and human diseases. J Aging Clin Exp Res. (1992) 4:273–86. 10.1007/BF03324108
11.
Trifunovic A Larsson NG . Mitochondrial dysfunction as a cause of ageing. J Intern Med. (2008) 263:167–78. 10.1111/j.1365-2796.2007.01905.x
12.
Wallace DC . Mitochondrial DNA mutations in disease and aging. Environ Mol Mutagen. (2010) 51:440–50. 10.1002/em.20586
13.
Twig G Elorza A Molina AJA Mohamed H Wikstrom JD Walzer G et al . Fission and selective fusion govern mitochondrial segregation and elimination by autophagy. EMBO J. (2008) 27:433–46. 10.1038/sj.emboj.7601963
14.
Twig GG Hyde B Shirihai OS . Mitochondrial fusion, fission and autophagy as a quality control axis: the bioenergetic view. Biochem Biophys Acta. (2008) 1777:1092–7. 10.1016/j.bbabio.2008.05.001
15.
Figge MT Reichert AS Meyer-Hermann M Osiewacz HD . Deceleration of fusion-fission cycles improves mitochondrial quality control during aging. PLoS Comput Biol. (2012) 8:e1002576. 10.1371/journal.pcbi.1002576
16.
Hoitzing H Johnston IG Jones NS . What is the function of mitochondrial networks? A theoretical assessment of hypotheses and proposal for future research. BioEssays. (2015) 37:687–700. 10.1002/bies.201400188
17.
Patel P Shirihai O Huang KC . Optimal dynamics for quality control in spatially distributed mitochondrial networks. PLoS Comput Biol. (2013) 9:e1003108. 10.1371/journal.pcbi.1003108
18.
Kornick K Das M . Population dynamics of mitochondria in mammalian cells, biophysical society meeting abstract. Biophys J. (2017) 112:437A. 10.1016/j.bpj.2016.11.2336
19.
Zorova LD Popkov VA Plotnikov EY Silachev DN Pevzner IB Jankauskas SS et al . Mitochondrial membrane potential. Analyt Biochem. (2018) 552:50e59. 10.1016/j.ab.2017.07.009
20.
Lee J Giordano S Zhang J . Autophagy, mitochondria and oxidative stress: cross-talk and redox signaling. Biochem J. (2012) 441:523–40. 10.1042/BJ20111451
21.
Nissanka N Moraes CT . Mitochondrial DNA damage and reactive oxygen species in neurodegenerative disease. FEBS Lett. (2018) 592:728–42. 10.1002/1873-3468.12956
Summary
Keywords
population dynamics, mitochondria, mathematical modeling, biophysics, mitochondrial fission, fusion, mitophagy
Citation
Kornick K, Bogner B, Sutter L and Das M (2019) Population Dynamics of Mitochondria in Cells: A Minimal Mathematical Model. Front. Phys. 7:146. doi: 10.3389/fphy.2019.00146
Received
08 October 2018
Accepted
19 September 2019
Published
09 October 2019
Volume
7 - 2019
Edited by
Jennifer Lynn Ross, University of Massachusetts Amherst, United States
Reviewed by
Qing Yun Wang, Beihang University, China; Lin Wang, Institut Pasteur, France
Updates
Copyright
© 2019 Kornick, Bogner, Sutter and Das.
This is an open-access article distributed under the terms of the Creative Commons Attribution License (CC BY). The use, distribution or reproduction in other forums is permitted, provided the original author(s) and the copyright owner(s) are credited and that the original publication in this journal is cited, in accordance with accepted academic practice. No use, distribution or reproduction is permitted which does not comply with these terms.
*Correspondence: Moumita Das modsps@rit.edu
This article was submitted to Interdisciplinary Physics, a section of the journal Frontiers in Physics
†These authors have contributed equally to this work
Disclaimer
All claims expressed in this article are solely those of the authors and do not necessarily represent those of their affiliated organizations, or those of the publisher, the editors and the reviewers. Any product that may be evaluated in this article or claim that may be made by its manufacturer is not guaranteed or endorsed by the publisher.