 Christian Nasel
 Uros Klickovic
 Hakan Cetin4
 Walter Struhal
 Ewald Moser
- 1Center for Medical Physics and Biomedical Engineering, Medical University of Vienna, Vienna, Austria
- 2Department of Radiology, University Hospital Tulln, Tulln, Austria
- 3UCL Queen Square Institute of Neurology, University College London, London, United Kingdom
- 4Department of Neurology, Medical University of Vienna, Vienna, Austria
- 5Department of Neurology, University Hospital Tulln, Tulln, Austria
Purpose: Neuromuscular diseases (NMDs) frequently cause severe disabilities. Magnetic resonance imaging (MRI)–based calculation of the so-called fat fraction (FF) in affected muscles was recently described as a reliable biomarker for monitoring progression of NMDs. This is of high interest as newly available modern gene therapies, currently subject to intensive investigations, may provide at least palliation of these severely disabling diseases. In this retrospective study feasibility of advanced image analysis, potentially extending the application of FF in lower limbs in patients suffering various NMDs was investigated.
Methods: Patients receiving MRI due to manifestation of proven NMDs (amyotrophic lateral sclerosis [n = 6], spinobulbar muscular atrophy [n = 4], limb girdle muscular dystrophy [n = 5], metabolic myopathy [n = 2]) in lower limbs were compared to patients without NMD [n = 9]. FF and new parameters derived from an advanced image analysis with generation of standardized MRI feature–based matrices were correlated with clinical grades of strength obtained using the MRC scale (Medical Research Council for Muscle Strength). While FF displays the fat partition in muscles only, the advanced image analysis considers the full MR-image information. Here, principal (PCA) and independent component analyses (ICA) were employed to derive parameters describing the full data obtained in more detail.
Results: PCA- and ICA-based full-image parameters remained strongly correlated with FF (Spearman coefficient 0.96–0.59), but generally showed stronger correlations with the MRC score in lower limbs (Spearman coefficient; FF = −0.71; PCA & ICA parameters = −0.76–0.78). So far, age was no significant confounder in full-image assessment.
Conclusion: The proposed advanced image analysis in NMDs is technically feasible and seems to effectively extend the information of FF.
Introduction
Neuromuscular diseases (NMDs), although low in prevalence (1–3/100,000 persons), are known to show either slow or sometimes fast progression of symptoms leading to severe disabilities, currently without the opportunity of an effective treatment. Disease-modifying therapies are subject to intensive investigations in order to provide at least palliation of the often heavily disabling symptoms of NMDs [1]. In parallel, this requires the development of objective and sensitive methods enhancing the diagnostic algorithm and reliably measuring alterations in affected muscle tissue over time to prove effectiveness and validity of therapeutic interventions.
Magnetic resonance imaging (MRI)–based high-resolution myometry with quantification of the fat fraction (FF) was validated as a sensitive biomarker for both myopathies and neuropathies showing strong correlations with clinical and functional scores [2, 3]. In this context, certain MRI techniques, as described by Dixon [4], enable the direct determination of signal contributions from either structurally bound or highly mobile protons. This allows the differentiation of muscular water and fat content, since signal from bound protons mainly represents fat and signal from highly mobile protons is primarily attributed to cellular and interstitial water components. In this way, separate water and fat images can be generated, where FF simply calculates the proportion of fat signal from the signal totally gained from both, i.e., water and fat, proton pools [5].
FF proved useful especially in slowly progressing NMDs leading to fatty infiltration of muscular tissue, but further alterations in the muscle tissue texture attributed to edema, a common pathological feature of neuropathies, may occur as well [6]. So far, patterns of regional muscular affections in various NMDs were analyzed. Typically, the specific appearance of muscle tissue in regions of interest (ROIs) drawn in representative MRI sections was rated by FF and compared with clinical findings [5, 7, 8]. This way, FF was established as standard parameter for MRI-based myometry and became a promising tool to play an important role in the assessment of disease state and progression [7, 9].
However, as FF displays the proportion of fat signal only, we hypothesized that this does not fully account for all potentially meaningful information about relevant shifts in the global muscular water/fat distribution caused by NMDs. Therefore, we propose a novel, extended quantitative voxel-based assessment method for muscular tissue using principal component analysis (PCA) and independent component analysis (ICA) to analyze and describe the full, directly measured, muscular water/fat signal distribution in MRI. So far, PCA and ICA have already been used to extract certain features in (functional) MRI data. In contrast to PCA, ICA can be used to find a linear representation also of non-Gaussian data so that the components are statistically independent, or as independent as possible. Such a representation seems to be able to capture essential features of the data in various applications, including feature extraction and signal separation [10]. Although ICA is able to extract an unknown number of components, depending on the quality and amount of data, the exact or optimum number of components remains an issue [11, 12]. In our application, the number of components is known and low, so we can expect robust results. This approach could provide a deeper insight into muscular tissue alterations in NMDs, which in turn could be used for a more detailed analysis of disease progression and response of NMDs to therapeutic efforts.
Methods
Patients
In total, 22 consecutive patients receiving 26 MRI examinations due to suspected degenerative neuromuscular disease with primary manifestation at the lower limbs were included in this retrospective study. Five groups with two subgroups were differentiated, where in the reference group patients initially suspected for NMD, but during clinical workup identified as articular induced pain syndromes without degenerative muscle affection, were collected as controls (CO, control group; n = 9; male:female = 7:2; age: 55.3 ± 16.8 years). Next to this, two subgroups differentiating subjects from the cumulative control group by age were created. One subgroup included subjects younger than 50 years at the time of their examinations only (control subgroup: CO <50; n = 4; male:female= 3:1; age: 33.2 ± 3.4 years), while the other subgroup included only subjects older than 50 years (control subgroup: CO >50, n = 5; male:female = 4:1; age: 60.4 ± 4.0 years).
Patients with proven amyotrophic lateral sclerosis (ALS) according to the revised El Escorial criteria (ALS group: n = 5 [including 2 follow-up examinations]; male:female = 1:2; age: 61.6 ± 0.01 years) were collected into another group [13]. Additionally, patients with genetically confirmed spinal and bulbar muscular atrophy (SBMA group: n = 4 [including 1 follow-up examination]; male:female = 3:0; age: 33.9 ± 5.55 years), patients with genetically proven limb girdle muscular dystrophy (LGMD group: n = 5 [including 1 follow-up examination]; male:female = 3:1; age: 54.1 ± 14.43 years), and patients suffering from metabolic myopathy (MMP group: n = 2 male patients; age: 57 and 58 years) were gathered in separate groups.
The clinical grade of muscle strength in the lower limbs at the time of MRI was assessed according to the Medical Research Council (MRC) scale for muscle strength in all patients employing the commonly used six grades (i.e., 5–0) scoring system, where grade 5 is assigned to full strength and grade 0 is given in case of complete paralysis [14, 15].
The study was approved by the local institutional review board (NÖ Ethikkommission, trial: GS1-EK-4/597-2019) and conducted according to WMA guidelines in force at the time of patient data acquisition [16].
Magnetic Resonance Imaging
MRI simultaneously depicting both legs was performed on a clinical 1.5-T whole-body scanner (Magnetom Avanto, Siemens, Erlangen, Germany) using the system's standard peripheral angiography coil set with full coverage of both legs (Tim matrix coil system of about 1,000 mm length). The scan protocol included T1-weighted (T1w), three-dimensional (3D) gradient-echo (GE) imaging implemented as a two-point Dixon volumetric interpolated GE sequence (3D-Dixon-VIBE-sequence). The 3D-Dixon sequence offers fast, high-resolution imaging of muscles through asymmetric k-space sampling and interpolation (voxel size = 1.2 × 1.2 × 5.0 mm; slices = 64; FOV = 380 mm; total scan time: 4:05 min) and allows generation of separate water- and fat-only images due to the incorporated dual echo Dixon technique (TE1 = 2.39 ms; TE2 = 4.78 ms; TR = 10 ms; NSA = 1).
Geometrically matched to the 3D-Dixon sequence, a short-τ inversion recovery (STIR) sequence (TE = 89 ms; TI = 150 ms; TR = 6,962 ms; NSA = 2; voxel size = 0.7 × 0.7 × 15.0 mm; slices = 25) and a dual-echo inversion recovery proton echo usage sequence (protoneus) with spectral fat suppression (TE1 = 7.8 ms; TE2 = 62 ms; TI = 49 ms; TR = 2,950 ms; NSA = 1; voxel size = 1.2 × 1.2 × 15 mm; slices =25) were employed [17]. Scan times for STIR and protoneus sequences were 2:56 and 2:28 min, respectively.
Depiction of the MRI-Based Muscular Water/Fat Distribution
All image data were translated to NIfTI-2 format for further processing [18]. A representative slice at the mid-level of all thighs and calves was selected from the 3D-Dixon sequences, and separate regions of interest indexed by distinct numbers for each depicted muscle (ROIm) on each side were drawn by an experienced reader (U.K.) who was blinded to the respective NMD. All examinations were presented to him in random order. The respective slice was chosen in such a manner that as much of the cross-sectional muscle tissue was visible as possible for the assessment. The specific fascia defined the boundaries of each muscle ROI, thereby excluding large nerves, vessels, the skin, and the subcutaneous fat, as well as the bone structures from the evaluations. In this way, in thighs ROIs showing the rectus femoris muscle, the vastus medialis, intermedius and lateral muscles, the semimembranosus, the semitendinosus, the biceps femoris, the adductor magnus, and the sartorius and gracilis muscles were drawn at each side. In calves, the anterior tibial, the long peroneal, the lateral and medial gastrocnemii, the soleus, and the posterior tibial muscles were outlined on each side (Supplementary Figure 1). Subsequently, scripts written for the applied statistical software used the indexed ROIm to generate virtual cumulative ROIs for thigh (ROIT) and calf muscles (ROIC), which, in turn, were integrated into virtual cumulative master ROIs for assessment of the whole lower limbs (ROILL). Besides visual inspection of theROIm, they served also to correct for potential Dixon inversion artifacts by testing the plausibility of the signal relation between bone marrow and muscle signal encountered in both legs.
Signal intensities from water- and fat-only images were then normalized voxel-wise in all ROIT, ROIC, and ROILL to their signal specific maximum:
where wn and fn represent the normalized water and fat signal intensities, ws and fs the original signal, and wmax and fmax the respective ROI-specific maximum of water or fat signal. In order to generate comparable images of ROI-specific water/fat distributions (WFDROI), all values of wn and fn were resampled within discrete intervals of i = 0.01 and adjusted to the interval ]0, 1] by:
where xn denotes the normalized water or fat signal values wn or fn and r(xn) conforms to the rank of xn according to the used resampling interval i. Note that replacing equal or less than zero by i is a convenient way to correct for inconsistencies of the previous Dixon water- and fat-only image calculations and that these values were eliminated later by thresholding the noise in the various ROIs.
Equation 2 was used to assign a distinct pair of ranks (r(wn), r(fn)) to each voxel of the given ROI. Then, the absolute frequency of each (r(wn), r(fn)) combination was determined leading to WFDROI. After normalization of WFDROI to its maximum, a k × l matrix Mw/f was built from the normalized frequencies p(r(wn), r(fn)) using their ranks (r(wn), r(fn)) as subscripts:
In Equation (3), Mw/f denotes the squared ROI-specific standardized WFD matrix. The number of rows k and columns l, where k = l, depends on the interval steps i defined in Equation 2. Symbols (Rwn)k = 1/i, …, 1 and (Rfn)l = 1, …, 1/j denote the ordered sequences of ranks r(wn) and r(fn), which were used as subscripts of the elements of Mw/f. All other symbols have the same meaning as in Equations 1 and 2. A full summary of the Mw/f workup is given in Figure 1.
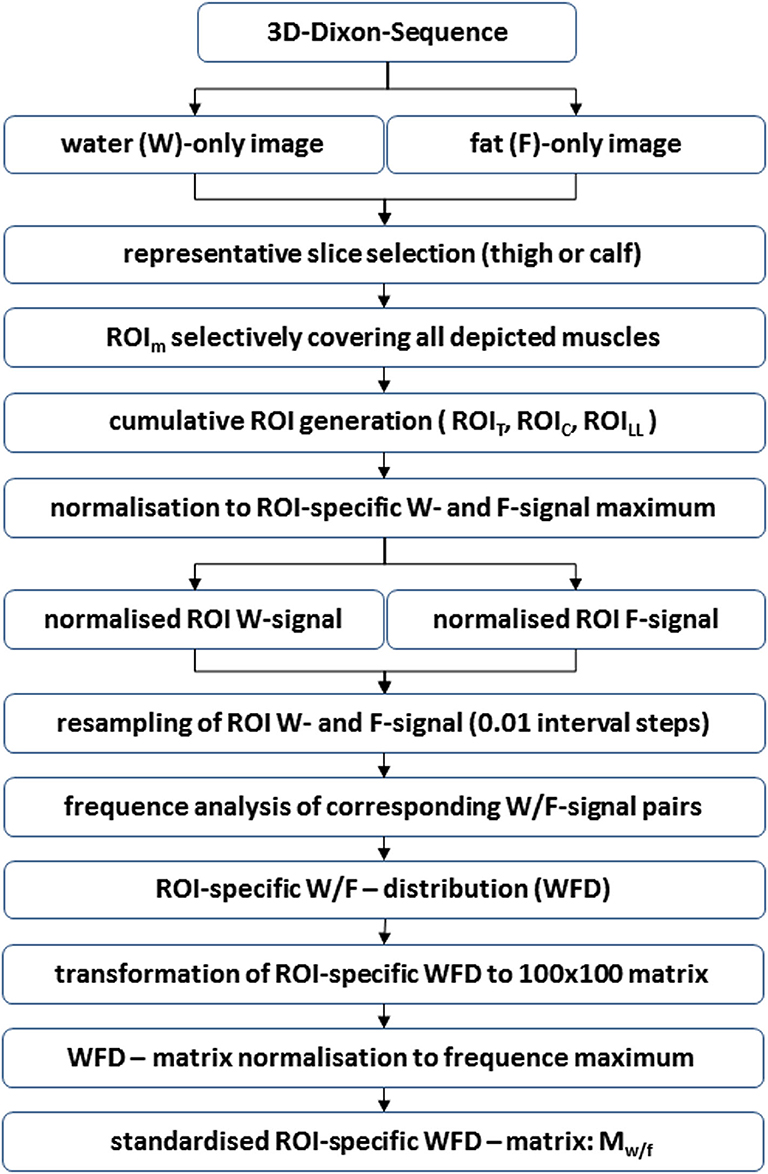
Figure 1. Flow chart showing the generation of standardized ROI-specific WFD matrices Mw/f. The described process is essentially based on the normalization to the corresponding maximum of (1) water signal, (2) fat signal, and (3) the frequency of observed normalized water/fat signal pairs in the analyzed ROIs. Technically, this procedure may be applied to any combination of MR sequences without, in their effect, co-linear signal components.
For further assessment of Mw/f, the subscript or rank order, respectively, was set descending for water signal and ascending for fat signal. This is owed to the fact that in the following standardized WFD matrices Mw/f were interpreted like images depicting the specific water/fat distribution of the various ROIs. These images may be visualized directly to depict a specific WFD in a certain NMD or can be stored in a database for further statistical image analysis.
In order to set any results derived from Mw/f images in relation to established parameters, also the FF, as proposed in the literature [19], was calculated for all ROIT, ROIC, and ROILL:
where all symbols have the same meaning as in Equations (1–3).
Analysis of the Muscular Water/Fat Distribution
First, PCA was performed on all matrices Mw/f of ROIs: ROIT, ROIC, and ROILL in the various groups. Matrices Mw/f were noise-thresholded, and using the water- and fat-signal ranks, r(wn) and r(fn), as dimensions, the quantity P(rwn, rwn) = {p(r(wn), r(fn)) ∈ Mw/f|p(r(wn), r(fn)) ≥ 0.1} was generated. From PCA performed on P(rwn, rwn), the rotation angle φ(w/f) (unit: radiant) of the normalized first principal component eigenvector relative to the unit vector :
and the related scattering defined by the coherence function c(φ(w/f), σn):
were derived. In Equation (6), σn denotes the components' standard deviations σ1 and σ2, with n = 2 according to the number of dimensions of the PCA. All other symbols have the same meaning as in Equation (3). The constant ck × l is the product of the matrix dimensions of Mw/f (here: ). Note that only measurements with the same values for ck × l are directly comparable.
Assuming distinct shapes of WFD related either to regular or to non-regular (NMD) muscle tissue as depicted in Mw/f, PCA and derived angles φ(w/f) and scattering c(φ(w/f), σn) were used to identify these two conditions constituting the shape of Mw/f in the various groups and regions (cumulative group WFDs are displayed in Figures 2, 3, and Supplementary Figures 2–4).
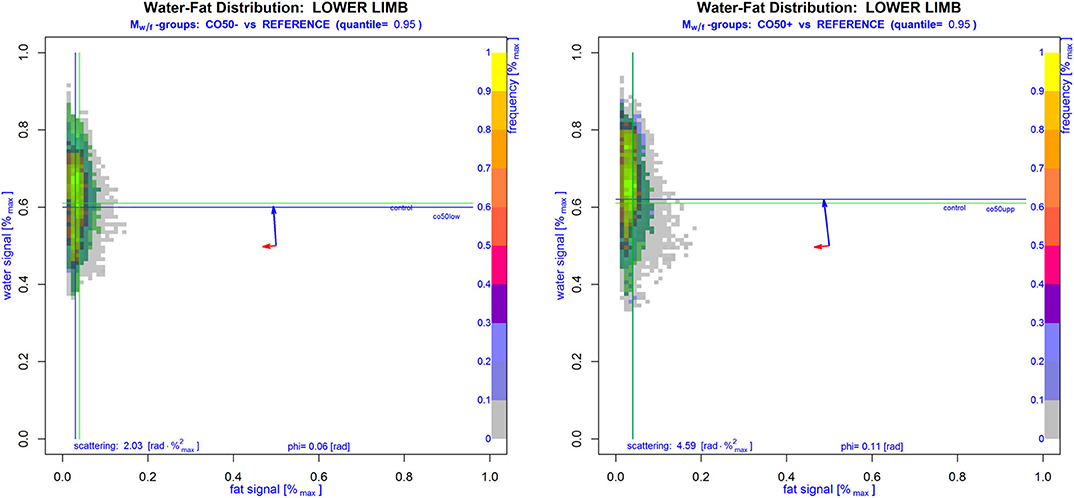
Figure 2. Cumulative standardized WFD matrices Mw/f of lower limbs from subjects without NMD. The left image displays subjects younger than 50 years, while on the right side subjects older than 50 years are shown. The area including 95% of all cases without NMD is marked in green color with green lines denoting the median of water and fat signals of all non-NMD cases. Generally, the WFDs in these subjects represent regular muscle tissue, which seems rather homogeneous and shows a greater variance of the water signal with, in its effect perpendicular to this, only minimal fat signal variances. Accordingly, eigenvectors in Mw/f were nearly parallel to the main signal axes (blue and red arrows: eigenvectors multiplied by corresponding standard deviations arbitrarily drawn in the middle of Mw/f showing the variance size and direction of the principal components). Also, the PCA-derived angle φ(w/f) and scattering c(φ(w/f), σn) are given. The slightly higher scattering in older subjects was not significantly different from younger ones.
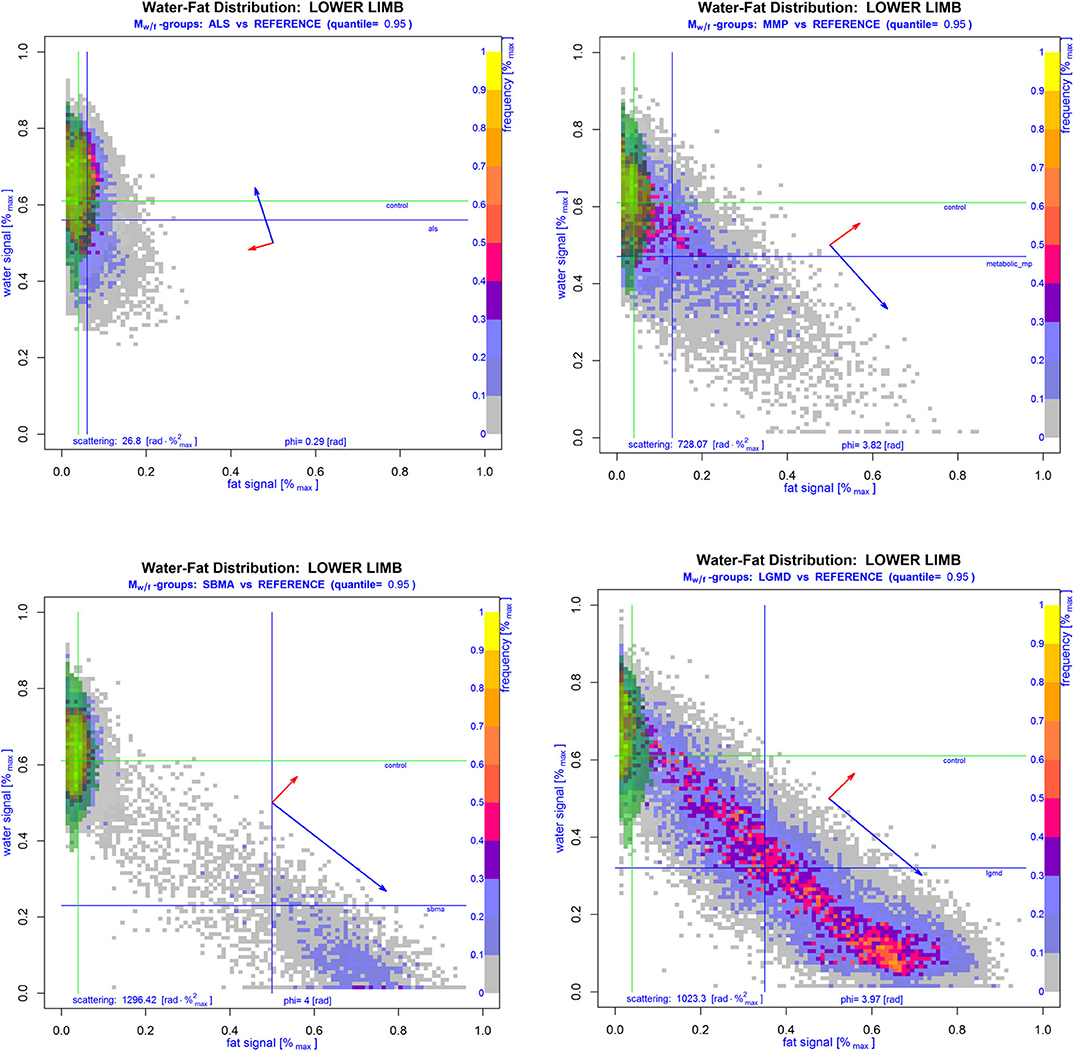
Figure 3. Cumulative WFD matrices Mw/f of lower limbs of subjects with proven NMD overlaid with the corresponding 95th quantile area of the cumulative regular reference group (green area). Lines show the median of normalized water and fat signals of NMD (blue) and reference patients (green). Blue and red arrows drawn in the middle of the respective Mw/f show the standard deviation and direction of the principal components in each group-WFD. Compared to the WFD in regular muscle tissue of control patients, group-WFDs of patients suffering from ALS (left upper image), MMP (right upper image), SBMA (left lower image), or LGMD (right lower image) were clearly more inhomogeneous and rotated into the direction of the fat signal, which is also supported by angles φ(w/f) and scatteringc(φ(w/f), σn). Note that the latter two parameters are clearly higher in NMD patients than in controls.
As PCA suggested distinctly different WFD patterns for (1) regular and (2) non-regular muscle tissue in matrices Mw/f, ICA with separation of two components was performed to test the automatic separation of these. Similar to general image pattern recognition [20], we first transformed all matrices Mw/f of dimension: k × l to one-dimensional vectors of length: k · l. Vectors were then used to generate separate s × (k · l) matrices Sw/f for thighs, calves, and whole lower limbs, where the number of rows s conforms to the number of subjects (=observations) involved. To warrant a reproducible strength of pattern separation, correlation (Spearman's Rho, ρ) of the two obtained component-vectors and derived from ICA was tested and ICA was performed repetitively until condition ρ < 0.3 was true. Component-vectors and were sorted such, that always applied to regular (1) and to non-regular (2) muscle tissue. Sorting was achieved by testing the location of the median crossing point after re-transformation of and to their corresponding matrix Mw/f (Figure 4; Supplementary Figure 5).
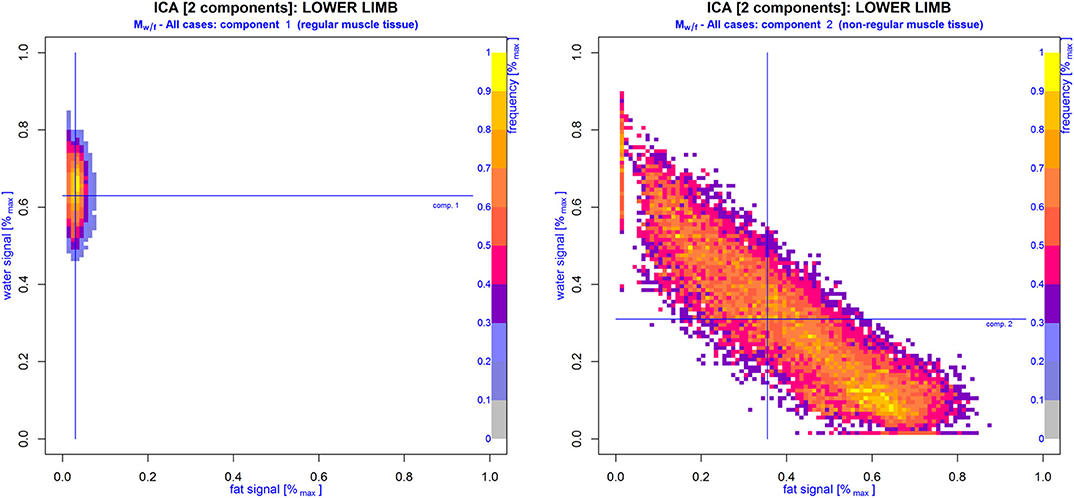
Figure 4. WFD matrices Mw/f generated from component vectors (right image) and (left image) derived from model-free ICA with differentiation of two components. Cumulative ROIs of both lower limbs of all cases included in this study were assessed for distinct WFD patterns: regular () and non-regular () muscle tissue. Note that Mw/f of vector virtually resembles the same WFD as depicted in the control group (compare Figure 2), while Mw/f of vector strongly correlates with WFDs found in patients with proven NMD.
After this, vectors of each case and region (thighs, calves, lower limbs) were analyzed for their correlation with and using Spearman rank correlation tests (Spearman's Rho: ρ) with calculation of and . To gain the same effect direction for and , correlations were always given as (complement of ) and . Muscular MRI examinations using ICA were described by ρ1 and ρ2, or, more comprehensively, by the scalar neuromuscular index NMi: = ρ1 + ρ2.
Statistical Analysis of the Muscular Water/Fat Distribution
Since, clinically, no noticeable differences between left and right legs were assessable, and with respect to the small number of cases, only one MRC score was given for both lower limbs. Accordingly, image parameters also represent cumulative evaluations of both legs. Additionally, we assessed age as a possible confounder of FF and the newly introduced full image–related parameters using robust linear regression analysis (LRA) and calculation of group-differences with conservative correction for multiple comparisons.
Conformity of WFDs in the various ROIsm with the normal distribution was found in <5% of all cases (Shapiro–Wilk test, testing ROIsm: WFD conform with normal distribution: water signal = 4.62%, fat signal= 3.85%; p < 0.05). Thus, median-based tests were used for inferential statistics and the median, the median absolute deviation (MAD), and range [min–max] for descriptive statistics. Single subject analysis and group testing were based on rank correlation tests with calculation of Spearman's Rho.
Differences between groups were evaluated using Kruskal–Wallis tests (K-W test) with Dunnett's modified Tukey–Kramer pairwise multiple comparison tests (DTK) for post-hoc analysis [21]. Conservative correction for multiple comparisons (Bonferroni) was performed. A p < 0.05 was considered significant. Linear regression analysis was performed using least trimmed squares robust (high breakdown point) regression. All computations and statistical evaluations were performed using scripts written for cran-R involving packages AnalyzeFMRI, robustbase, fastICA, and DTK [21–25].
Results
Testing the relation between disability (MRC score) in lower limbs (ROILL) and FF revealed a strong correlation, independently of the underlying disease (−0.71 [Spearman's Rho]). PCA-based angle φ(w/f) and scattering c(φ(w/f), σn) showed even stronger correlations with the MRC score in ROIsLL (both: −0.76 [Spearman's Rho]). The ICA-derived coefficients ρ1 and ρ2 and the index NMi exhibited the strongest correlations with the MRC score in the lower limbs (ρ1: −0.78, ρ2: −0.76, NMi: −0.78 [Spearman's Rho]). In thighs (ROIT), correlations of PCA- and ICA-derived parameters with MRC scores were generally strong, with rather heterogeneous results in calves (ROIC). Throughout all regions, i.e., ROIT, ROIC, and ROILL, nearly all parameters were significantly different between clinically healthy patients (MRC score: 5) and those with MRC scores 4 or 3 (K-W test [ROILL], post-hoc: DTK, groups = 3 [corr.], FF: p = 0.0005; φ(w/f): p = 0.0001, c(φ(w/f), σn): p = 0.0001, ρ1: p = 0.00009, ρ2: p = 0.0002, and NMi: p = 0.0001). Since only one patient presented with MRC score 2, this patient was not included in the score-group comparison (detailed data are provided in Table 1).
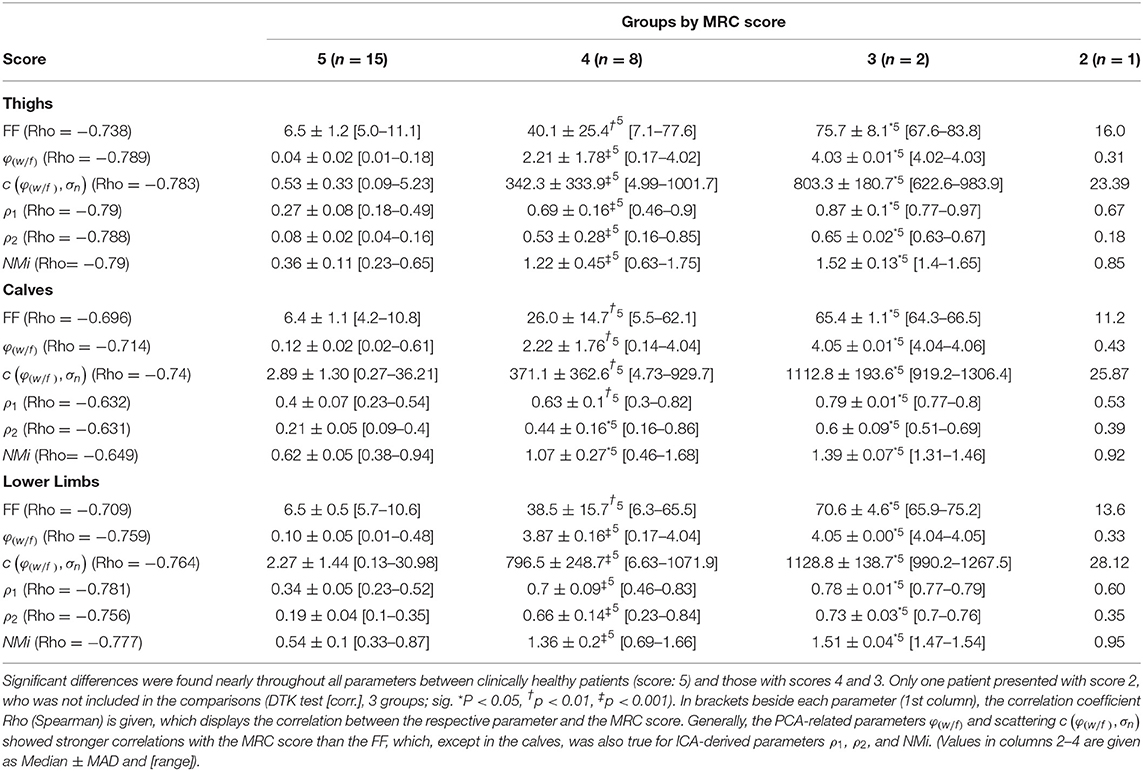
Table 1. Summary of FF, φ(w/f), c(φ(w/f), σn), ρ1, ρ2, and NMi grouped by the corresponding MRC score in lower limbs.
FF, PCA-derived angle φ(w/f), and scattering c(φ(w/f), σn) in lower limbs (ROILL) were correlated strongly with ρ = 0.888 and 0.886 (Spearman's Rho), respectively. Correlations between FF, φ(w/f), and c(φ(w/f), σn) in thighs (ROIT) were even stronger with ρ = 0.962 and ρ = 0.938 (Spearman's Rho), respectively. In calves (ROIC), the correlations between FF, φ(w/f), and c(φ(w/f), σn) were still strong with ρ = 0.745 and 0.742 (Spearman's Rho), respectively. Also, the ICA-based parameters ρ1, ρ2, and NMi were strongly correlated with FF in lower limbs with ρ = 0.819, 0.826, and 0.828 (Spearman's Rho), respectively. The same was true in thighs, where strong correlations of FF with ρ1, ρ2, and NMi with ρ = 0.849, 0.875, and 0.878 (Spearman's Rho), respectively, were found. Correlations between FF and ρ1, ρ2, and NMi in calves were rather moderate with ρ = 0.621, 0.611, and 0.588 (Spearman's Rho), respectively.
The already visually different WFD patterns of regular and non-regular muscle tissue were investigated further, and the relation between the ICA-derived coefficients ρ1 and ρ2 was assessed using a robust linear regression model after transformation of ρ2 to the logarithmic scale. Using the model ρ1: = a · log(ρ2) + b, regression analysis revealed that the loss of regular muscular tissue was strongly correlated with an exponential increase in non-regular muscular tissue (LRA; log-linear model; R2[adjusted]: ROIT: 0.981, ROIC: 0.964, ROILL: 0.966; p < 2.2 × 10⁻¹⁶) (Figure 5; Supplementary Figure 6). Additionally, depending on the MRC score, PCA-derived angles φ(w/f) and scattering c(φ(w/f), σn) showed distinctly different distributions of NMDs with primary neuronal degeneration and those primary leading to fatty degeneration of the muscle tissue (Figure 6).
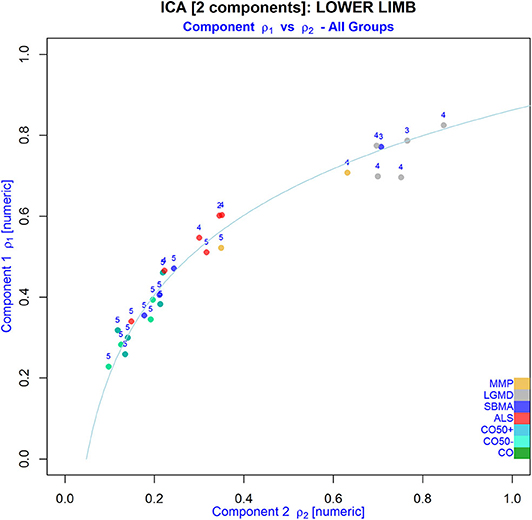
Figure 5. Relation between the WFD-derived regular (component 1) and non-regular (component 2) muscular tissue fractions in ROIs of the lower limbs from all patients after extracting two components from matrices Mw/f using ICA (NMD groups are indicated by different colors; numbers indicate the MRC score). Note that non-regular tissue seems to increase exponentially with loss of regular muscle tissue.
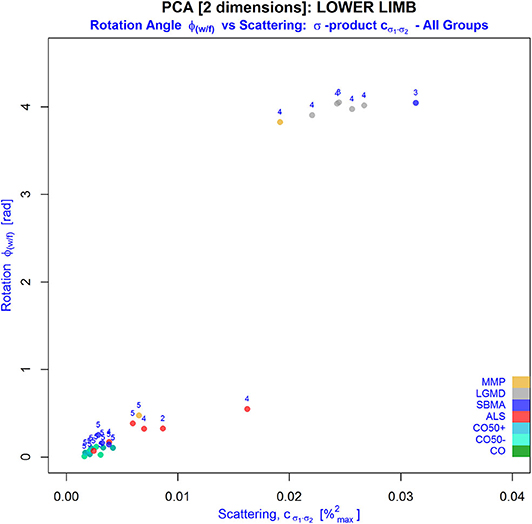
Figure 6. Behavior of PCA-derived parameters: φ(w/f) (y-axis) and the so-called σ -product (x-axis), an inherent part of scattering defined by the coherence function c(φ(w/f), σn), in the various NMD groups (indicated by different colors; numbers indicate the MRC score). Alterations in the muscular water/fat texture with higher fat partitions shift the measurements to the right and upward. Especially, an increased heterogeneity of the WFD indicated by the σ product was related to reduced MRC scores in muscles of lower limbs. As this suggests an excellent differentiation of alterations attributed predominantly to fatty infiltration from those primarily caused by denervation, this could serve automatic classification of NMDs in future trials. Note that younger and older controls share the same behavior suggesting nearly no effect of age on the measurements.
Concerning disability, the MRC score in LGMD patients was significantly lower compared to the control groups (K-W test: MRC, post-hoc: DTK [corr.], p = 0.002), while for the rest of the NMD groups no significant differences were found. In lower limbs, FF was also significantly different between the LGMD and control groups only (K-W test: FF, post-hoc: DTK [corr.], p = 0.004). The same was found for PCA-derived angle φ(w/f) and scattering c(φ(w/f), σn) (K-W test: (φ(w/f),c(φ(w/f), σn)), post-hoc: DTK [corr.], p = (0.0003, 0.0003). The ICA-based coefficients ρ1 and ρ2 and index NMi showed a comparable behavior (K-W test: (ρ1,ρ2,NMi), post-hoc: DTK [corr.], p = (0.0006, 0.0007, 0.0007).
Generally, age in the ALS (median ± MAD: 61.6 ± 0.5, range: [45.5–62.2], unit: years), and MMP groups (55.1 ± 3.0, [52.1–58.1]) was significantly higher than in the young control group CO <50 (33.2 ± 3.4, [23.6–38.6]), while patients in the SBMA group (37.9 ± 2.1, [33.9–52.5]) were significantly younger than subjects in the older control group CO >50 (60.4 ± 4.0, [55.3–72.4]) (K-W test: age, post-hoc: DTK [corr.: Bonferroni], p = 0.028). Otherwise, there were no significant differences found between the various groups, especially when testing the cumulative and the young and older control groups separately against the NMD groups. Additionally, linear regression analysis testing the influence of age on the various muscle parameters in the cumulative control group CO revealed that age was no significant confounder, neither of FF (LRA: FF × age, = 0.359 [thighs], −0.143 [calves], −0.166 [lower limbs], n.s.) nor of the PCA-derived parameters φ(w/f) (LRA: φ(w/f) × age, = 0.345 [thighs], 0.391 [calves], 0.084 [lower limbs], n.s.), and c(φ(w/f), σn) (LRA: c(φ(w/f), σn) × age, = 0.159 [thighs], −0.119 [calves], 0.307 [lower limbs], n.s.), respectively. The same was true for the ICA-based correlation coefficients ρ1 (LRA: ρ1 × age, = −0.015 [thighs], 0.135 [calves], 0.108 [lower limbs], n.s.) and ρ2 (LRA: ρ2 × age, = −0.139 [calves], −0.026 [lower limbs], n.s.), as well as the NMi (LRA: NMi × age, = 0.02 [thighs], −0.112 [calves], 0.06 [lower limbs], n.s.), where the influence of age was not significant. The only significant relation between age and any of the tested parameters, was found for ρ2 in thighs (LRA: ρ2 × age, = 0.772 [thighs], p = 0.013). A full summary of the results for all ROIs, i.e., ROIT, ROIC, and ROILL concerning angle φ(w/f), scattering c(φ(w/f), σn), coefficients ρ1 and ρ2, and index NMi is given in Tables 2–4.
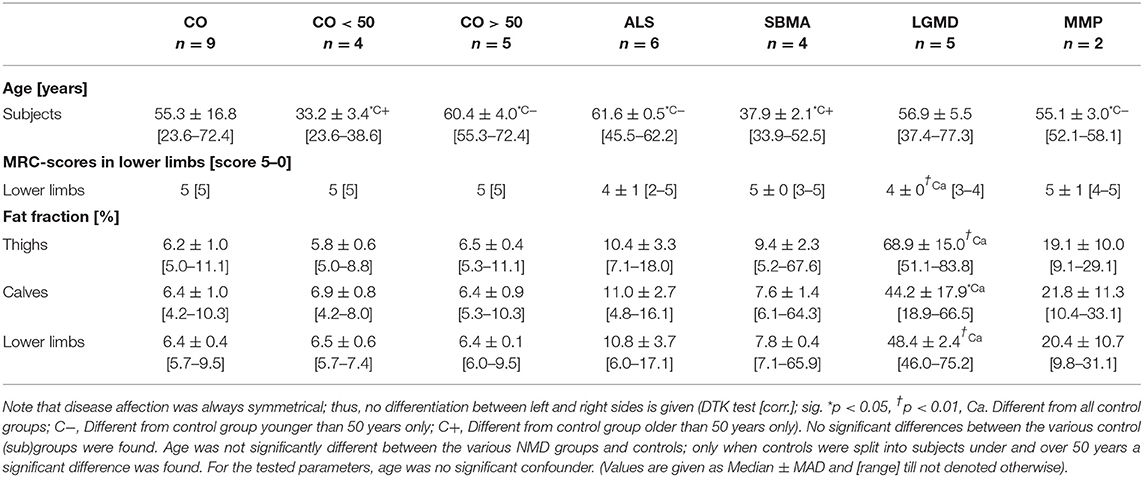
Table 2. Summary of age, MRC scores in lower limbs, and FF in thighs, calves, and lower limbs per NMD group.
Discussion
PCA and ICA were used to extend the widely accepted and validated MRI-based scalar quantity FF. Though FF is a robust biomarker, reliably assessing progression and stage of NMDs [2, 3, 26], we aimed to demonstrate the feasibility of statistical methods known from image analysis and pattern recognition to provide an even deeper insight into pathological alterations depicted by MRI in muscles. In contrast to FF, the quantitative methods proposed in this study rely on the assessment of the entire water- and fat-related signal acquired by muscular MRI in the lower limbs considering a wider range of MRI-accessible information. The proposed PCA- and ICA-derived parameters remained related to FF, but exhibited stronger correlations with muscle strength in lower limbs indicating a potentially higher clinical relevance of these methods in the assessment of the course and progression of NMDs.
FF considers the relative amount of the fat-attributed muscular tissue partition in MRI only, while the full range of the water/fat signal is used to correct for possible signal variations of the measurement. Though this warrants robust results [27], on the one hand, this could mask meaningful information about subtle shifts in the water/fat relation in muscles, on the other hand. Thus, the complete distribution of all water/fat signal pairs, the so-called WFD, encountered in MRI of lower limb muscles was evaluated in this study. In case of a high number of voxels with strong signal from stationary protons, much of the WFD is explained by muscular fat content, which rotates the preferential axes of the WFD in Mw/f into the direction of the fat signal, and vice versa (Figures 2, 3). Consequently, the specific information of the FF-correlated fat content is conserved in PCA and ICA, while all the water-attributable signal information is added to the analysis. This assertion is clearly supported by the strong correlation between PCA- or ICA-derived parameters and the corresponding FF. Nevertheless, the correlation between the MRC score and PCA- and ICA-derived parameters was in large part stronger than that found for FF (Table 4), which indicates that FF may not reveal all the information about subtle but relevant alterations in the muscular texture depicted in MRI. Thus, the advanced analysis of muscular MRI stressed in this study seems to further extend the accuracy of FF.
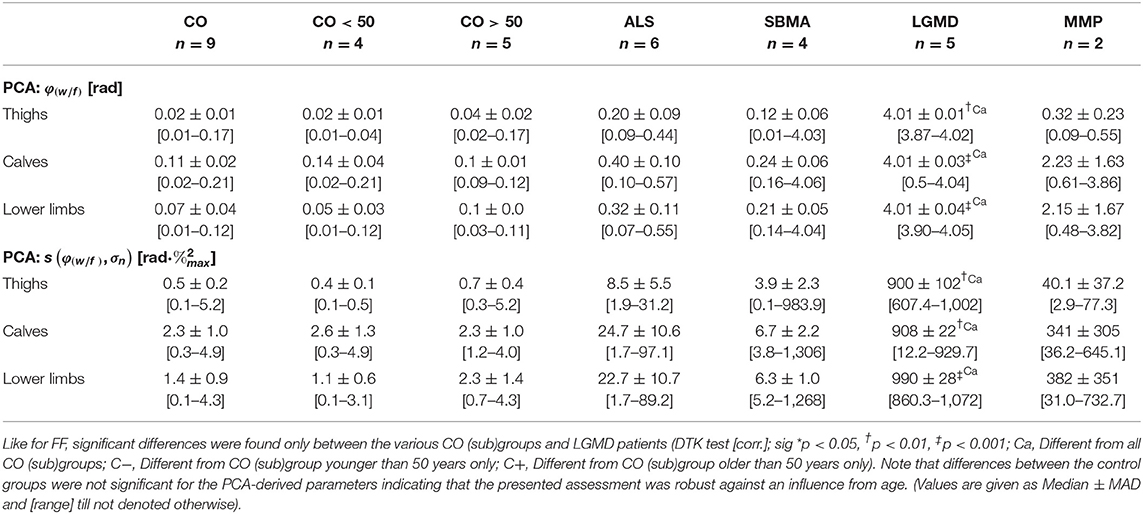
Table 3. Summary of PCA-derived parameters φ(w/f) and scattering s(φ(w/f), σn) per NMD group.
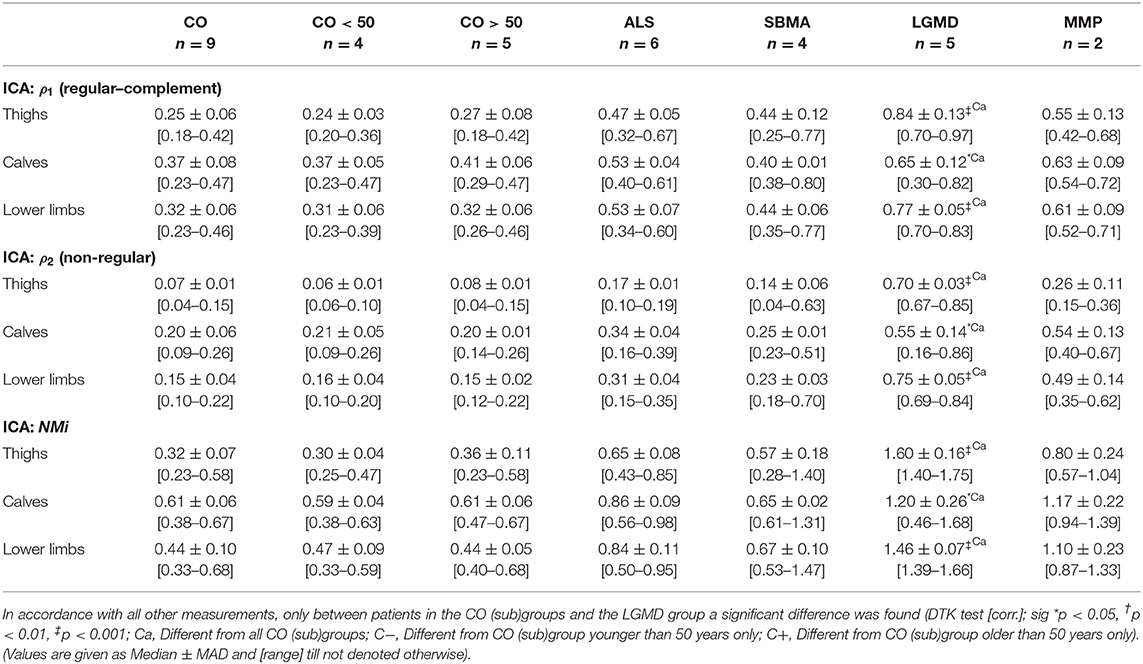
Table 4. Summary of ICA-based coefficients ρ1 and ρ2 and index NMi per NMD group.
As the WFD constitutes from the linear combinations of the underlying water/fat signal, PCA was used to calculate eigenvectors and values of the specific distribution. From the eigenvector of the main principal component, the rotation angle φ(w/f) relative to the virtual y-axis of Mw/f was computed to quantify the excursion of the measured signal distribution in the direction of either the water or fat signal. Additionally, scattering described by the coherence function c(φ(w/f), σn) was evaluated in order to estimate the impact of variances of the acquired water and fat signals on the respective WFD. Further investigation of φ(w/f) and c(φ(w/f), σn) revealed that all patients with regular muscle strength, independently of their diagnosis, presented with small values for φ(w/f) and c(φ(w/f), σn). This induced a certain WFD pattern of water/fat signal pairs densely packed near the virtual y-axis of Mw/f, where the eigenvector of the major component was nearly parallel to this axis and pointed clearly into the direction of the water signal (Figure 2). In patients with reduced strength grades, the WFD patterns were more heterogeneous. They presented with a more or less widespread distribution of water/fat signal pairs around the virtual diagonal spanned between the extremes of Mw/f. Due to the clearly stronger excursions of their WFD into the direction of the fat-related signal with much larger variations of the encountered signal components, values found for φ(w/f) and c(φ(w/f), σn) were significantly higher than those in patients with regular muscle strength. Compared to FF, differentiation of patients with various MRC scores in thighs and lower limbs was in favor of the PCA-derived parameters, since correlations were stronger and the ability to separate patients from different groups was better defined using angles φ(w/f) and/or scattering c(φ(w/f), σn) (Table 4). According to this, PCA parameters were strongly correlated with the MRC score and were significantly different in patients grouped by this score. This implies an improved discrimination of various stages of disease by the PCA parameters with preservation of the properties of FF, as the correlation with FF was strong. In this way, angles φ(w/f) and an inherent part of the coherence function c(φ(w/f), σn), the product of standard deviations (σ product), theoretically, could serve automatic classification of NMDs in future trials on big data using artificial intelligence based approaches (Figure 6).
Generally, two distinct WFD patterns, one typical for regular and the other for non-regular muscular tissue, with only a small overlap between the two patterns, were found (Figures 2, 3, Supplementary Figures 2–4). This encouraged the use of ICA for automatic separation of these distinctly different patterns. A WFD can be seen as an image displaying a specific distribution of regular and non-regular muscle components, or, more precisely, it is a combination of at least two “sub-images” each depicting either regular or non-regular muscle tissue. These sub-images are represented by component vectors, which neither share a collinear statistical effect, as shown by φ(w/f), nor conform to the normal distribution in statistical testing. Thus, both components or sub-images may be assumed as non-Gaussian linear representations of water/fat signals of different disease conditions, which can be decomposed by ICA as statistically independent components hidden in the full WFD image. This assumption is proven by our results exhibiting a robust decomposition of the postulated two—characteristic—patterns using ICA.
The match of individual WFD image vectors with regular or non-regular muscle tissue component vectors and was quantified by computing the rank correlation coefficients ρ1 and ρ2 and their sum: NMi. In patients with reduced MRC scores suffering from long-lasting, i.e., already progressed NMDs (e.g., SBMA and LGMD patients), an exponential increase in non-regular muscle tissue was found. Patients with reduced muscle strength in rapidly progressing NMDs (e.g., ALS) and, therefore, shorter disease durations showed by far less reorganization of the muscle texture. However, both conditions were significantly different from patients without strength constraint. Accordingly, the ICA-derived parameters showed much stronger correlations with MRC scores than FF, though FF was still strongly correlated to ρ1, ρ2, and NMi. These findings emphasize the ability of ICA to robustly decompose regular and non-regular muscle components depicted in Mw/f with preserving the information inherent to FF. However, the MRC scores were explained better by ICA-based parameters than by FF. Since the number of cases in this study was rather small, we did not try to separate other components by ICA, especially from the non-regular sub-image pattern of WFD. Nevertheless, separation of other components appears promising in larger and more homogenous (sub)samples, where ICA could be used to objectively explore conceivable further subtypes of NMD-induced muscle alterations.
It has to be noted that standardized Mw/f matrices may contain—in principle—any combination of different MR signals. Three-point-, proton-density-, or T2-weighted Dixon techniques, which seem to offer more stable results for quantification of the muscular fat content [27], could also help to differentiate the various muscular conditions in NMDs, like fatty degeneration, denervation edema or fibrosis, which could further expand the power of our methods.
Though our preliminary results underline the advantages of sampling the full WFD, several limitations have to be considered. The sample size of our NMD cohort is quite small and most of our observations remain yet to be proven in larger NMD cohorts. Our results may, therefore, suffer from heterogeneity, where effects from, e.g., age, training state, or the body mass index, could not be considered entirely. On the other hand, given the very low prevalence of the investigated NMDs, the number of cases presented here appears at least fair to prove the feasibility of the proposed analysis methods. Even in our small sample of NMD patients, assessment using the proposed standardized matrices Mw/f seemed to offer a valuable extension to FF. As the PCA- and ICA-derived parameters remained strongly correlated to FF, the proposed methods should still compare to FF. Despite this, we were able to demonstrate that, for instance, age was no significant confounder in our analysis, though some studies reported a relevant, but mostly weak, influence from age on FF. However, several other studies did not confirm this finding [3, 28] and, accordingly, no significant influence from age on the assessed parameters was found in this study (compare Supplementary Figure 7). For the moment our approach, which primarily aims to demonstrate the feasibility of PCA- and ICA-based assessment of the proposed standardized WFD matrices, appears rather robust to influences of patients' age.
As our sample consisted of several different NMDs, another limitation of this study was the need to abstain from commonly recognized clinical and functional scales describing special features of a particular NMD in more detail than the proposed assessment based on the MRC score. The MRC score helped to preserve comparability of clinical assessment and to reduce effects from the heterogeneity of the various NMDs in our sample. Additionally, MRC grading is a commonly accepted clinical tool validated to reliably measure strength in the lower limbs. However, the generally weaker relation between PCA, ICA, and FF and their weaker correlation to the MRC score in calves in our sample could also result from deficiencies of this score system. Actually, this system tests the ability to move the lower limbs against gravity, which does not require too much function of calf muscles. The overall smaller muscle volumes in calves, potentially inducing greater variances in the measurements, could also contribute to this. Moreover, as our methods indicate a higher sensitivity to detect subtle shifts in the muscular water/fat-content in NMDs, one also has to consider that alterations in MRI may precede the clinical deterioration of a patient. Obviously, this is not fully described by the MRC score and requires a closer analysis of the exact relation between changing of ICA- and PCA-based parameter values and the correlated clinical presentation of a patient.
Finally, since we evaluated the full WFD without correction, we assume our measurements to be prone to bias from inhomogeneities of B0 and geometrical properties of the used coil system. As all data was recorded on a single scanner using the same coil system, this seemed not to have played a major role. However, this needs to be investigated further, especially when assessing regions with smaller muscle volumes, as in the neck or the arms, with expectedly higher distortions of the magnetic field. Also, differences in data quality performed on different MR scanners or with higher field strengths and improved sequence techniques (e.g., 3-point Dixon sequence) is to be expected, potentially leading to improved spatial resolution and discrimination power.
Conclusion
PCA was found promising to allow robust classification of patients according to their stage of NMD, thereby extending the possibilities of FF. ICA enabled an apparently robust separation of regular from non-regular muscle components in the proposed standardized MRI feature–based matrices Mw/f, which could offer a practical way for automatic identification of pathologically altered muscle tissue and possible NMD subgroups. Compared to FF, our preliminary results suggest a higher power of PCA- and ICA-derived parameters to detect subtle shifts in the MRI water/fat signal relation in NMDs, which encourages the conduction of further trials to overcome limitations of this study. PCA- and ICA-driven statistical assessment of neuromuscular MRI may, therefore, be used to substantially improve the diagnostic workup and monitoring of disease progression in NMDs.
Data Availability Statement
The datasets generated for this study are available on request to the corresponding author.
Ethics Statement
The studies involving human participants were reviewed and approved by NÖ-Ethikkommission. The patients/participants provided their written informed consent to participate in this study.
Author Contributions
CN, UK, HC, and WS conducted the data collection. CN conceptualized the study and method design. CN and EM contributed to the analysis and interpretation of the data. CN drafted the paper. All other authors revised it critically and approved the final version and agreed to be accountable for all aspects of this work.
Funding
No external funding was received for this study. Institutional infrastructure support was provided by the various departments participating in the study.
Conflict of Interest
The authors declare that the research was conducted in the absence of any commercial or financial relationships that could be construed as a potential conflict of interest.
Acknowledgments
We are grateful to all patients participating in this study and providing their data.
Supplementary Material
The Supplementary Material for this article can be found online at: https://www.frontiersin.org/articles/10.3389/fphy.2020.00195/full#supplementary-material
Supplementary Figure 1. Example of individual ROIs covering the various muscles at each side in a representative slice near the mid-level of thighs and calves. These individual muscle ROIs were assessed cumulatively, thereby evaluating thighs or/and calves from both sides or legs as one large cumulative ROI, respectively. This allowed a cumulative investigation of both thighs, both calves and both lower limbs. Note that the ROIs covering bone marrow were used to check for Dixon inversion artifacts only.
Supplementary Figure 2. Cumulative standardized WFD-matrices Mw/f of thighs (upper images) and calves (lower images) measured in subjects without NMD. On the left side controls younger than 50 years and on the right side controls older than 50 years are displayed. The area including 95% of all control cases is marked in green color and green lines indicate their median water- and fat-signals. WFD in regular muscle tissue, was found rather homogeneous with a greater variance of the water-signal compared to, in its effect perpendicular to this, only minimal fat-signal variances. In calves and older subjects slightly bigger fat-signal variances were observed, which were not significantly different from younger subjects. Eigenvectors of Mw/f (multiplied by corresponding standard deviations, drawn as blue and red arrows in the middle) were nearly parallel to the x- and y-axes. Scattering c(φw/f, σn) and rotation φw/f were very small in all control subjects.
Supplementary Figure 3. WFD-matrices Mw/f of thighs measured in subjects with proven NMD overlain by the corresponding 95th quantile reference area of the control-group (green area). Lines give the median of normalized water- and fat-signals of NMD-patients (blue) and controls (green). Eigenvectors of each Mw/f (multiplied by corresponding standard deviations, drawn as blue and red arrows in the middle) show the direction of the principal components of each group. Compared to controls (reference), WFDs in patients suffering from ALS (left upper image), MMP (right upper image), SBMA (left lower image), or LGMD (right lower image) were clearly more inhomogeneous and rotated. Accordingly, scattering c(φw/f, σn) and rotation φw/f were much bigger compared to control subjects.
Supplementary Figure 4. WFD-matrices Mw/f of calves measured in subjects with proven NMD overlain by the corresponding 95th quantile reference area of the control-group (green area). Lines display the median of normalized water- and fat-signals of NMD- (blue) and control-patients (green). Eigenvectors of each Mw/f (multiplied by corresponding standard deviations, drawn as blue and red arrows in the middle) show the direction of the principal components of each group. Compared to controls (reference), WFDs in patients suffering from ALS (left upper image), MMP (right upper image), SBMA (left lower image), or LGMD (right lower image) were clearly more widespread and rotated. Scattering c(φw/f, σn) and rotation φw/f were also higher compared to control subjects.
Supplementary Figure 5. WFD-matrices Mw/f generated from component-vectors (right images) and (left images) derived from ICA with separation of two components. Cumulative ROIs of thighs (upper row) and calves (lower row) including all cases in the study were assessed for distinct WFD-patterns for regular () and non-regular () muscular tissue. Note that Mw/f of vectors display the same WFD as found in direct measurements in the control group.
Supplementary Figure 6. ICA component plot showing the relation between component 1 (regular muscular tissue) and component 2 (non-regular muscular tissue) in thighs (left graph) and calves (right graph) from all patients (NMD-groups are indicated by colors, numbers indicate the MRC-score). Note that non-regular tissue seems to increase exponentially with loss of regular muscle tissue, where this behavior is clearly more pronounced in thighs than in calves.
Supplementary Figure 7. Age was no significant confounder of PCA- and ICA-derived parameters. Robust linear regression analysis (LRA) testing for relevant effects from age revealed no significant relation with the measurements. In fact, parameters φw/f, c(φw/f, σn), ρ1 and ρ2 turned out as rather specific indicators for muscle degeneration. Independently from age, stronger deviations of measurements from the x-axis were found in persons already more severely disabled by their NMD (NMDs are indicated by different colors; numbers display the MRC-score). Blue lines show the regression line for the respective parameter tested for its dependence on age in controls. Adjusted R2 and significance of the relation between the respective parameter and age are also displayed.
Abbreviations
ICA, independent component analysis; FF, fat fraction; MRC, Medical Research Council; NMD, neuromuscular disease; PCA, principal component analysis; ROI, regions of interest; WFD, water/fat distribution.
References
1. Nelson CE, Robinson-Hamm JN, Gersbach CA. Genome engineering: a new approach to gene therapy for neuromuscular disorders. Nat Rev Neurol. (2017) 13:647–61. doi: 10.1038/nrneurol.2017.126
2. Morrow JM, Sinclair CDJ, Fischmann A, Machado PM, Reilly MM, Yousry TA, et al. MRI biomarker assessment of neuromuscular disease progression: a prospective observational cohort study. Lancet Neurol. (2016) 15:65–77. doi: 10.1016/S1474-4422(15)00242-2
3. Klickovic U, Zampedri L, Sinclair CDJ, Wastling SJ, Trimmel K, Howard RS, et al. Skeletal muscle MRI differentiates SBMA and ALS and correlates with disease severity. Neurology. (2019) 93:e895–e907. doi: 10.1212/WNL.0000000000008009
4. Dixon WT. Simple proton spectroscopic imaging. Radiology. (1984) 153:189–94. doi: 10.1148/radiology.153.1.6089263
5. Mercuri E. An integrated approach to the diagnosis of muscle disorders: what is the role of muscle imaging?. Dev Med Child Neurol. (2010) 52:693. doi: 10.1111/j.1469-8749.2010.03726.x
6. Jenkins TM, Alix JJP, David C, Pearson E, Rao DG, Hoggard N, et al. Imaging muscle as a potential biomarker of denervation in motor neuron disease. J Neurol Neurosurg Psychiatry. (2018) 89:248–55. doi: 10.1136/jnnp-2017-316744
7. Fischer D, Kley RA, Strach K, Meyer C, Sommer T, Eger K, et al. Distinct muscle imaging patterns in myofibrillar myopathies. Neurology. (2008) 71:758–65. doi: 10.1212/01.wnl.0000324927.28817.9b
8. Wattjes MP, Kley RA, Fischer D. Neuromuscular imaging in inherited muscle diseases. Eur Radiol. (2010) 20:2447–60. doi: 10.1007/s00330-010-1799-2
9. Bugiardini E, Morrow JM, Shah S, Wood CL, Lynch DS, Pitmann AM, et al. The diagnostic value of MRI pattern recognition in distal myopathies. Front Neurol. (2018) 9:456. doi: 10.3389/fneur.2018.00456
10. Hyvarinen A, Oja E. Independent component analysis: algorithms and applications. Neural Netw. (2000) 13:411–30. doi: 10.1016/S0893-6080(00)00026-5
11. Schöpf V, Kasess CH, Lanzenberger R, Fischmeister F, Windischberger C, Moser E. Fully exploratory network ICA (FENICA) on resting-state fMRI data. J Neurosci Methods. (2010) 192:207–13. doi: 10.1016/j.jneumeth.2010.07.028
12. Schöpf V, Windischberger C, Robinson S, Kasess CH, Fischmeister FP, Lanzenberger R, et al. Model-free fMRI group analysis using FENICA. Neuroimage. (2011) 55:185–93. doi: 10.1016/j.neuroimage.2010.11.010
13. Brooks BR, Miller RG, Swash M, Munsat TL. El escorial revisited: revised criteria for the diagnosis of amyotrophic lateral sclerosis. Amyotroph Lateral Scler Other Motor Neuron Disord. (2000) 1:293–9. doi: 10.1080/146608200300079536
14. Medical Research Council. Aids to Examination of the Peripheral Nervous System. Memorandum No. 45. London: Her Majesty's Stationary Office (1976).
15. Janda V. Manuelle Muskelfunktionsdiagnostik, 4 edn. Stuttgart; Jena; Amsterdam: Urban & Fischer by Elsevier (2000).
16. WMA. World Medical Association - Declaration of Helsinki (2014) Available Online at: http://www.wma.net/en/30publications/10policies/b3/ (accessed July 28, 2014).
17. Nasel C. Protoneus-sequence: extended fluid-attenuated inversion recovery MR imaging without and with contrast enhancement. Eur J Radiol. (2005) 55:219–23. doi: 10.1016/j.ejrad.2004.11.008
18. Whitcher B, Schmid VJ, Thornton A. Working with the DICOM and NIfTI data standards in R. J Stat Softw. (2011) 44:1–28. doi: 10.18637/jss.v044.i06
19. Morrow J. Development of quantitative MRI as an outcome measure in charcot-marie-tooth disease and inclusion body myositis (Ph.D), University College London, London, United Kingdom (2016).
20. Turk M, Pentland A. Eigenfaces for recognition. J Cogn Neurosci. (1991) 3:71–86. doi: 10.1162/jocn.1991.3.1.71
21. Lau MK. DTK: Dunnett-Tukey-Kramer Pairwise Multiple Comparison Test Adjusted for Unequal Variances and Unequal Sample Sizes. R package version 3.5. (2013) Available Online at: http://CRAN.R-project.org/package=DTK (accessed July 22, 2015).
22. Kondziolka D, Bilbao JM. An immunohistochemical study of neuroepithelial (colloid) cysts. J Neurosurg. (1989) 71:91–7. doi: 10.3171/jns.1989.71.1.0091
23. Bordier C, Dojat M, Lafaye de Micheaux P. Temporal and spatial independent component analysis for fMRI data sets embedded in the analyzeFMRI R package. J Stat Softw. (2011) 44:1–24. doi: 10.18637/jss.v044.i09
24. R-Development CoreTeam. R: A Language and Environment for Statistical Computing. R version 3.11.0. (2015-04-16). Vienna: R Foundation for Statistical Computing (2015).
25. Rousseeuw P, Croux C, Todorov V, Ruckstuhl A, Salibian-Barrera M, Verbeke T, et al. Robustbase: Basic Robust Statistics. R package version 0.92-5 (2015). Available Online at: http://CRAN.R-project.org/package=robustbase (accessed June 17, 2014).
26. Dahlqvist JR, Fornander F, de Stricker Borch J, Oestergaard ST, Poulsen NS, Vissing J. Disease progression and outcome measures in spinobulbar muscular atrophy. Ann Neurol. (2018) 84:754–65. doi: 10.1002/ana.25345
27. Schlaffke L, Rehmann R, Rohm M, Otto LAM, Luca A, Burakiewicz J, et al. Multi-center evaluation of stability and reproducibility of quantitative MRI measures in healthy calf muscles. NMR Biomed. (2019) 32:e4119. doi: 10.1002/nbm.4119
Keywords: neuromuscular disease imaging, skeletal muscle fibers, spinal and bulbar muscle atrophy, muscular dystrophies, amyotrophic lateral sclerosis, water-fat distribution, magnetic resonance imaging
Citation: Nasel C, Klickovic U, Cetin H, Struhal W and Moser E (2020) Advanced Analysis of the Water/Fat Distribution in Skeletal Muscle Tissue Using Magnetic Resonance Imaging in Patients With Neuromuscular Disease. Front. Phys. 8:195. doi: 10.3389/fphy.2020.00195
Received: 27 September 2019; Accepted: 01 May 2020;
Published: 19 June 2020.
Edited by:
Federico Giove, Centro Fermi - Museo Storico della Fisica e Centro Studi e Ricerche Enrico Fermi, ItalyReviewed by:
Fiona Elizabeth Smith, Newcastle University, United KingdomTimothy J. P. Bray, University College London, United Kingdom
Copyright © 2020 Nasel, Klickovic, Cetin, Struhal and Moser. This is an open-access article distributed under the terms of the Creative Commons Attribution License (CC BY). The use, distribution or reproduction in other forums is permitted, provided the original author(s) and the copyright owner(s) are credited and that the original publication in this journal is cited, in accordance with accepted academic practice. No use, distribution or reproduction is permitted which does not comply with these terms.
*Correspondence: Christian Nasel, Y2hyaXN0aWFuLm5hc2VsQG1lZHVuaXdpZW4uYWMuYXQ=
†These authors have contributed equally to this work