- Department of Physics, University of Texas at San Antonio, San Antonio, TX, United States
Thermodynamic integration (TI), a powerful formalism for computing Gibbs free energy, has been implemented for many biophysical processes with alchemical schemes that require delicate human efforts to choose/design biasing potentials for sampling the desired biophysical events and to remove their artifactitious consequences afterwards. Theoretically, an alchemical scheme is exact but practically, an unsophisticated implementation of this exact formula can cause error amplifications. Small relative errors in the input parameters can be amplified many times in their propagation into the computed free energy [due to subtraction of similar numbers such as (105±5)−(100±5) = 5±7]. In this paper, we present an unsophisticated implementation of TI in 3n dimensions (3nD) (n = 1, 2, 3…) for the potential of mean force along a 3nD path connecting one state in the bound state ensemble to one state in the unbound state ensemble. Fluctuations in these 3nD are integrated in the bound and unbound state ensembles but not along the 3nD path. Using TI3nD, we computed the standard binding free energies of three protein complexes: trometamol in Salmonella effector SpvD (n = 1), biotin-avidin (n = 2), and Colicin E9 endonuclease with cognate immunity protein Im9 (n = 3). We employed three different protocols in three independent computations of E9-Im9 to show TI3nD's robustness. We also computed the hydration energies of 10 biologically relevant compounds (n = 1 for water, acetamide, urea, glycerol, trometamol, ammonium and n = 2 for erythritol, 1,3-propanediol, xylitol, biotin). Each of the 15 computations is accomplishable within 1 (for hydration) to 10 (for E9-Im9) days on an inexpensive GPU workstation. The computed results all agree with the available experimental data.
Introduction
Accurate computation of protein interactions [1–8] is fundamental to understanding essential biological processes such as molecular recognitions in terms of “the gigglings and wigglings” of the atoms that constitute the biomolecules and their aqueous environments [9]. However, errors are inevitable in all computations including quantification of protein interactions in terms of the Gibbs free energy. Errors in the input force field parameters propagate to the final results in the free-energy differences we are interested to evaluate. And the relative errors can be amplified catastrophically in the process. Take the hydration of a bio-relevant molecule, the simplest biomolecular interaction, for an example. The powerful alchemical approach gives the free energy of hydration as the difference, ΔGhydr = ΔGvac−ΔGaq , between the Gibbs free energy to annihilate the molecule in vacuum, ΔGvac, and the same term in water, ΔGaq. For a hypothetical (but not atypical) molecule with ΔGvac = 100±5 kcal/mol and ΔGaq = 105±5 kcal/mol each with about a 5% error, the resulting free energy of hydration ΔGhydr = 5±7 kcal/mol has the relative error amplified to 140% if the errors in the two annihilation energies do not happen to cancel each other out. Very high accuracy in the free energies of annihilation is necessary to have a reasonable accuracy in the computed free energy of hydration. Indeed, the alchemical methods have been widely applied with many successes but they have also been found to have their share of producing false positives/negatives [10, 11]. Various sophistications are necessary and have been devised to avoid the afore-stated error amplification, e.g., the approach of relative binding free energy [11–14]. It is still challenging for us to accurately compute the absolute binding free-energies for various protein interactions [15–38].
Thermodynamic integration (TI) [39] is an exact and powerful formalism that has been widely adapted and used in the current literature. Typically, a numerical implementation of TI is to compute the potential of mean force (PMF) [39–43] by integrating the mean force acting on a collective degree of freedom represented with a one-dimensional (1D) order parameter [44]. It may involve alchemical cycles that cause amplifications of the inevitable errors in the force field parameters. And it depends on delicately designed biasing potentials to achieve sufficient sampling for convergence, which bring in artifactitious effects that must be carefully removed to reach the physics of the natural systems of our investigation.
In this paper, we present a direct, unsophisticated implementation of TI in 3n-dimensions (TI3nD), without invoking alchemy or biasing potentials, for non-covalent interactions between proteins, ligands, and aqueous environments. In contrast to the orthodox implementations of TI for 1D PMF as a function of an order parameter representing one degree of freedom of the system which is biased delicately with various biasing potentials, this simple implementation of TI is for 3nD PMF as a function of 3n coordinates of n centers directly representing 3n degrees of freedom of the system without invoking any biasing potentials. The n centers can simply be n atoms of the partners of a binding complex. They can also be n centers-of-mass of n groups of atoms chosen on the binding partners. We tested TI3nD on computing the hydration energies of 10 biologically relevant small molecules for which we obtained results in close agreement with the experimental data available from the current literature. We also validated TI3nD by computing the absolute binding free energies of three protein binding problems: (1) Colicin E9 endonuclease (E9 DNase) in complex with the cognate immunity protein Im9 [45] which gives the most difficult test of TI3nD (n = 3) as any protein recognition problem will do. For the E9-Im9 problem that has been well-studied experimentally [46], the absolute binding free energy is yet to be computed on a rigorous basis in the current literature. Computations have only been carried out on the relative binding free energies among various E9 alanine mutants with no definitive agreements with the in vitro data [47], which well reflects the problem of error amplifications inherent in alchemical algorithms involving subtractions between similarly large numbers. In this difficult test, three rounds of TI3nD were conducted using three different protocols (different choices of n centers and different initial conditions). The results converged to agree with the in vitro data, showing TI3nD's robustness. (2) Biotin (BTN) in complex with avidin (AVD) that represents the strongest non-covalent binding among ligand-protein interactions, for which the test run of TI3nD (n = 2) produced perfect agreement with the in vitro data and confirmed the hypothesized importance of the loop connecting the 3rd and the 4th β-sheets of AVD [23]. (3) Trometamol (TRS) in complex with Salmonella enterica effector protein SpvD which provided us the simplest case (n = 1) in which the computed binding affinity agrees well with the value extracted from the in vitro experiments [48].
Methods
Absolute Binding Free Energy From PMF in 3nD
Following the standard literature (e.g., [15, 27]), one can relate the standard (absolute) free energy of binding to the PMF difference and the two partial partitions as follows:
Here c0 is the standard concentration. kB is the Boltzmann constant. T is the absolute temperature. W[r1, r2, ⋯rn] is the 3n-dimensional PMF, the free energy of the system as a function of 3n coordinates of the n centers (r1, r2, ⋯rn) chosen to represent the positions of the partner molecules of the binding complex, which can simply be n atoms or the centers-of-mass of n groups of atoms. The subscripts 0 and ∞ indicate the bound and the dissociated states, respectively. ΔW0, ∞ is the PMF difference between one state out of the bound state ensemble u(0) = (r10, r20, ⋯rn0) and the corresponding one state of the dissociated state ensemble u(1) = (r1∞, r2∞, ⋯rn∞). Those two particular states are connected via a chosen curve in the 3nD space,
where the parameter λ goes from 0 to 1. Along the curve, all the 3n degrees of freedom of the n centers are not allowed to fluctuate. Their fluctuations in the bound state ensemble and in the dissociated state ensemble are represented in the partial partitions Zn, 0 and Zn, ∞, respectively [49, 50]. The bound state partial partition Zn, 0 integrates all 3n degrees of freedom in the neighborhood of the initial state u(0),
The partial partition function Zn, ∞ of the dissociated state has the integration over 3(n−1) degrees of freedom while 3 degrees of freedom are fixed so that the fluctuations in the unbound state would not bring the system back into the bound state,
The formulas for computing these partial partitions are given in the Supplemental Material. With Equations (1), (3), and (4), the computations of the fluctuations are isolated in the bound or the unbound state. Along the dissociation path, Equation (2), there are no fluctuations in the 3n degrees of freedom. Their fluctuations are fully integrated in the partial partitions of the bound and the unbound states. This isolation-of-fluctuations approach reduces computing efforts and enhances accuracy as demonstrated in the three binding problems and 10 hydration problems discussed in the Results and Discussion section.
PMF in 3nD
Central to this work is the PMF in 3nD, W[r1, r2, ⋯rn], as a function of the 3n coordinates of n centers (r1, r2, ⋯rn) along a single curve/line u(λ) = (r1(λ), r2(λ), ⋯rn(λ)) connecting one state u(0) = (r10, r20, ⋯rn0) that is arbitrarily chosen from the bound state ensemble to the corresponding one state u(1) = (r1∞, r2∞, ⋯rn∞) that belongs to the dissociated state ensemble. From the definition of PMF, we have the following formula for the 3nD PMF difference:
where H is the Hamiltonian of the entire system, a function of 3N coordinates (r1, r2, ⋯rn, rn+1, ⋯rN) of all the N atoms of a model system. Consequently, we have the following formula of TI3nD relating the 3nD PMF to the mean force on the 3n degrees of freedom:
Here the partial derivative with respect to u represents the 3nD gradient of the Hamiltonian. The dot product is between the two 3nD vectors. The brackets with subscript u(λ) mean the statistical average of the total forces acting on the n centers by all the 3(N-n) degrees of freedoms of the system when the n centers are fixed at u(λ) = (r1(λ), r2(λ), ⋯rn(λ)). In this, the 3nD PMF difference between the two states is equal to the line integral of the mean force acting on the 3n degrees of freedom along a line connecting the two states. Since the PMF is a function of state, any one line/curve connecting the two end states is necessary and sufficient for the computation in Equation (6). This TI3nD formula can be implemented without biasing potentials and therefore no efforts are needed to remove the artifactitious effects of the biases.
Hydration Energy From PMF in 3nD
Hydration of a molecule can be regarded as a simple binding problem for which the PMF is along a straight path from deep inside a box of water to far outside the box. In each of the 10 hydration problems studied in this work, the solute molecule was inside a cubic box of water with each side at 80 Å. The coordinates were chosen so that the top side of the cube is parallel to the xy-plane at z0 = 10 and the molecule is located at the origin, zA = 0 . When the solute was moved along the z-axis from zA = 0 to zB = 20, the PMF difference ΔWA, B was computed via Equation (6). The PMF difference from zB = 20 to z∞ = ∞ was computed analytically by approximating water as a continuous medium. For this range, the attraction on the charged solute (net charge q) by the water box can be accurately approximated by the force from its image charge [51]. Consequently,
Here ε0 is the dielectric constant of vacuum. ε = 81ε0 is the dielectric constant of water. ΔWA, B is the 3nD PMF difference between the state of the molecule being inside water and the state of the molecule being in vacuum. The two partial partitions and represent the fluctuations in all the other degrees of freedom of a molecule when n centers are fixed in water and in vacuum, respectively. For short molecules, one center is sufficient to represent the molecule's position, the choice of n = 1 suffices and . For long molecules, the choice of n = 2 can significantly reduce the computing time needed in a given problem because two centers on a molecule can define its position and, partly, its orientation. The tradeoff is that one must now compute the partial partitions in vacuum and in water, as described in Equation (S5).
Simulation Parameters
In all the MD runs, the CHARMM36 force field parameters [52, 53] were used for all the intra- and inter-molecular interactions. The Langevin stochastic dynamics was implemented with NAMD [54] to simulate the systems at constant temperature of 298 K and constant pressure of 1 bar. The time step was 1 fs for the short-range and 2 fs for the long-range interactions. The damping constant was 5/ps. Explicit solvent (water) was represented with the TIP3P model. Full electrostatics was implemented via particle mesh Ewald at the level of 128 × 128 × 128 for the three binding problems or via the analytical approximation in Equation (7) for the hydration problems.
All-Atom Model Systems
The 13 model systems were set up as follows:
(1) The Im9-E9 system was formed by taking Chains A and B of the Im9-E9 DNase complex (PDB: 1EMV), translating it to center around the origin of the coordinate systems, rotating it so that the dissociation path is approximately along the z-axis, solvating it with an 80 Å × 80 Å × 120 Å box of water, neutralizing its charge with Na+/Cl− ions and salinizing it to 150 mM of NaCl.
(2) The BTN-AVD system was formed by taking Chain A of the BTN-AVD complex (PDB: 2AVI) and following the same procedure stated in (1).
(3) The TRS-SpvD system was formed by taking the X-ray structure of the TRS-SpvD complex (PDB: 5LQ7) and following the procedure described in (1).
(4) The hydration system of a small solute (water, acetamide, urea, glycerol, trometamol, or ammonium) was formed by placing the solute at the origin of the coordinate system and solvating it with an 80 Å × 80 Å × 80 Å box of water. The top side of the water box is the plane of z = 10 in parallel to the xy-plane. The bottom side of the water box is the plane of z = −70 .
(5) The hydration system of a long solute (1,3-propanediol, erythritol, xylitol, or biotin) was formed by rotating the solute so that it lies on the xy-plane and solvating it in the same way as described in (4).
Results and Discussion
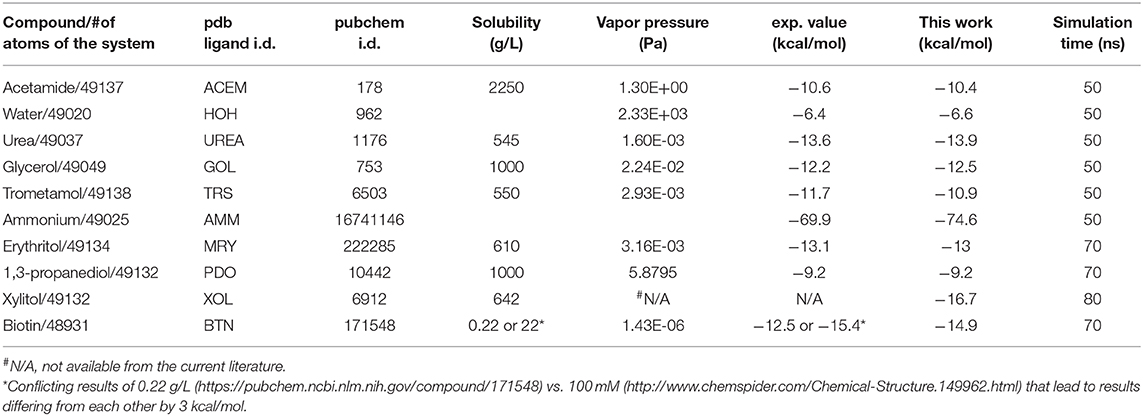
The binding free energies of three protein complexes are tabulated in Table 1. The computing costs were ~4 days for a drug-protein binding problem (TRS-SpvD or Biotin-Avidin) and 10 days for a protein recognition problem (E9 DNase-Im9) on a workstation with dual 8-core CPUs and single nVidia P5000 GPU. The robustness of TI3nD is demonstrated by the agreement among three independent computations for E9 DNase-Im9 using different protocols (choices of n centers and initial coordinates and velocities, illustrated in Figures 1–3). The hydration energies of 10 small molecules are tabulated in Table 2. The computing cost for a hydration problem is less than a day on the same workstation. All these computations do not amplify the inherent errors of the force field parameters, namely, the errors in the final results remained around the level of ±kBT. And it is worth noting that the TI3nD computing cost for an absolute binding energy is similar to the state-of-the-art approaches for relative binding energies of current literature, e.g., Wang et al. [56].
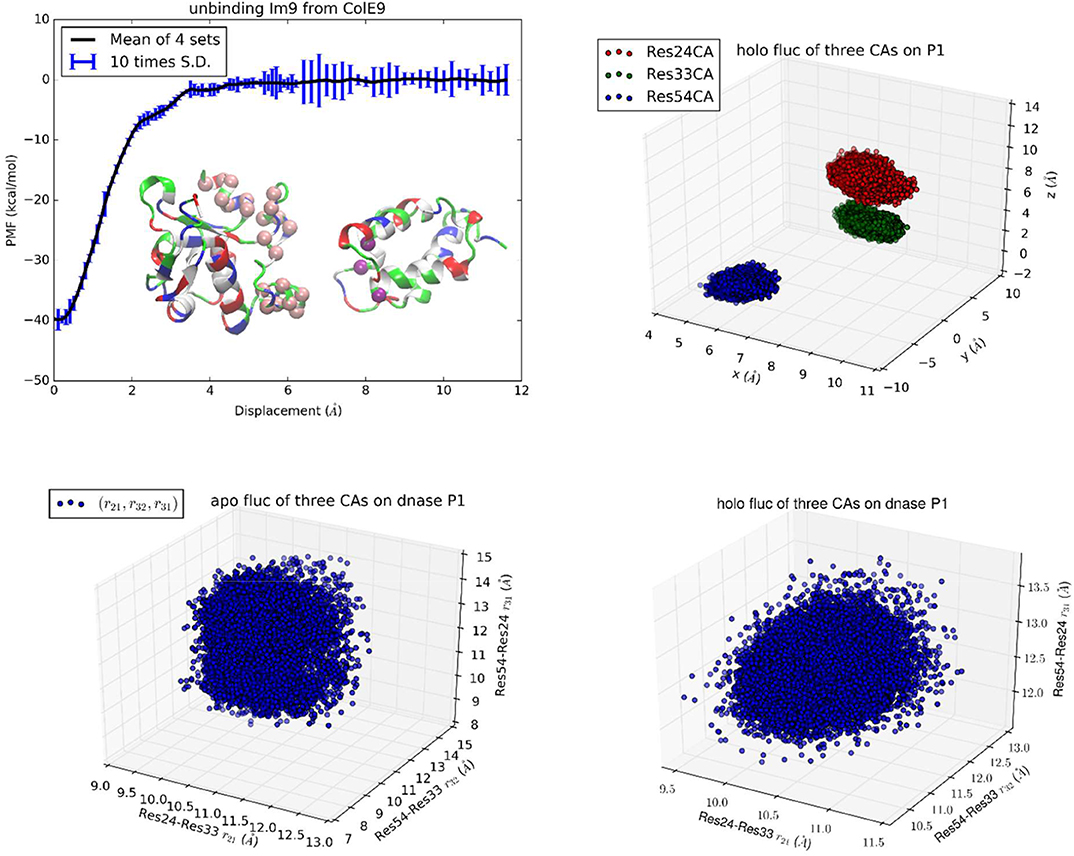
Figure 1. Unbinding Im9 immunity protein from Colicin E9 DNase with Protocol 1. Shown in the upper left panel is the PMF curve of unbinding Im9 from E9. Insets: Im9 and E9 in the unbound state are shown in ribbons colored by residue types (hydrophobic, white; hydrophilic, green; negatively charged, red; positively charged, blue). The three centers (α-carbons) on Im9 (Asn24Cα, Leu33Cα, and Tyr54Cα) are marked as purple balls, whose coordinates represent the position and orientation of Im9. The 22 centers (α-carbons) on E9 DNase (Pro73Cα, Ser74Cα, Asn75Cα, Lys76Cα, Ser77Cα, Ser78Cα, Val79Cα, Ser80Cα, Phe86Cα, Lys89Cα, Asn90Cα, Gln91Cα, Val93Cα, Arg96Cα, Val98Cα, Pro124Cα, Lys125Cα, Arg126Cα, His127Cα, Ile128Cα, Asp129Cα, and Ile130Cα) are marked as pink spheres whose fluctuations in the bound and the unbound states are computed for shifting and rigidifying (or softening) of the interface residues upon binding. The upper right panel shows the fluctuations of the three centers in the bound state in terms of their coordinates: (x1,y1, z1), (x2,y2, z2), and (x3,y3, z3). The lower left/right panel shows their fluctuations in the unbound/bound state in terms of three mutual distances: (r21, r32, r31).
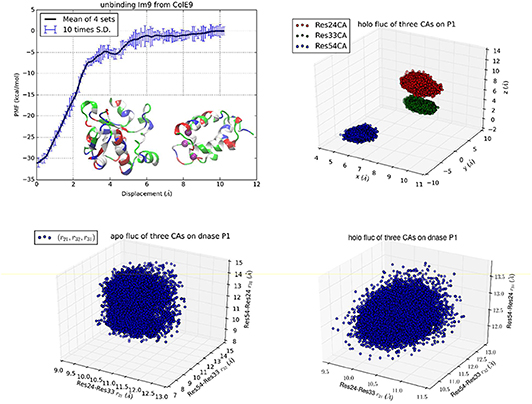
Figure 2. Unbinding Im9 immunity protein from Colicin E9 DNase with Protocol 2. Shown in the upper left panel is the PMF curve of unbinding Im9 from E9. Insets: Im9 and E9 in the unbound state are shown in ribbons colored by residue types (hydrophobic, white; hydrophilic, green; negatively charged, red; positively charged, blue). The three centers (α-carbons) on Im9 (Asn24Cα, Leu33Cα, and Tyr54Cα) are marked as purple balls, whose coordinates represent the position and orientation of Im9. The upper right panel shows the fluctuations of the three centers in the bound state in terms of their coordinates: (x1,y1, z1), (x2,y2, z2), and (x3,y3, z3). The lower left/right panel shows their fluctuations in the unbound/bound state in terms of three mutual distances: (r21, r32, r31).
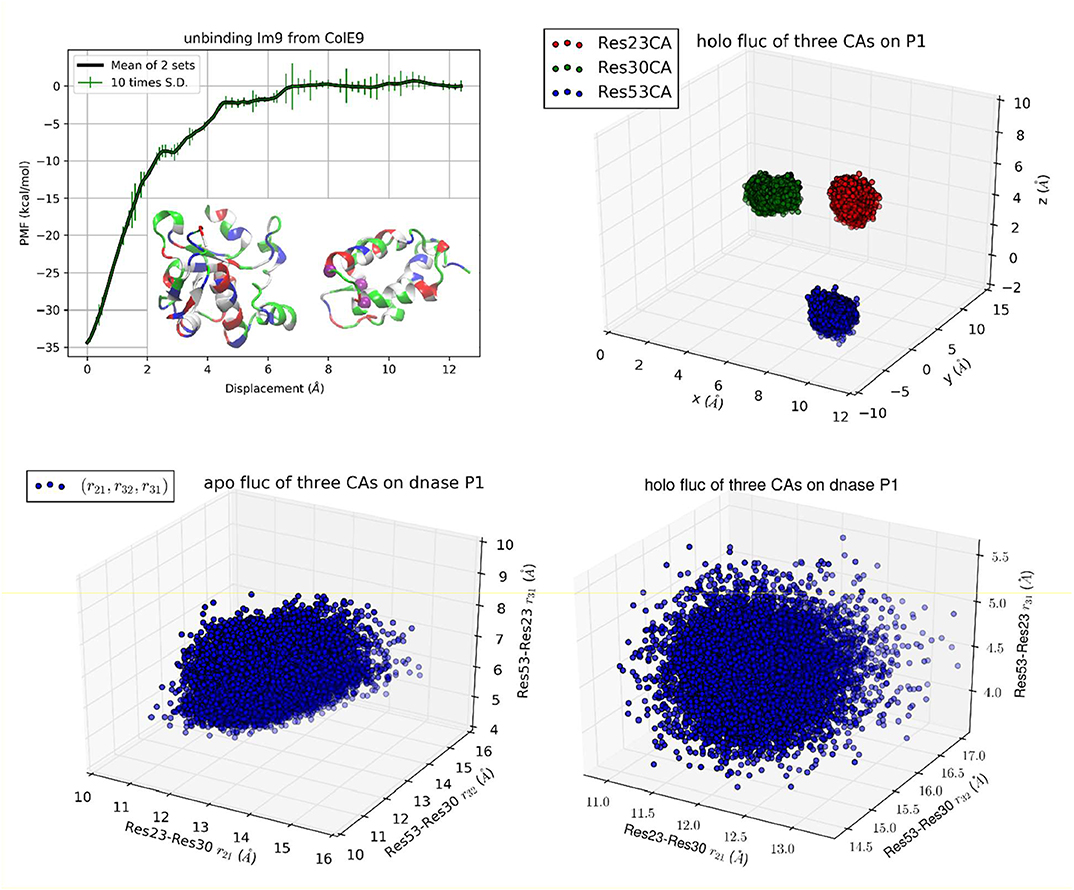
Figure 3. Unbinding Im9 immunity protein from Colicin E9 DNase with Protocol 3. Shown in the upper left panel is the PMF curve of unbinding Im9 from E9. Insets: Im9 and E9 in the unbound state are shown in ribbons colored by residue types (hydrophobic, white; hydrophilic, green; negatively charged, red; positively charged, blue). The three centers (α-carbons) on Im9 (Cys23Cα, Glu30Cα, and Ile53Cα) are marked as purple balls, whose coordinates represent the position and orientation of Im9. The upper right panel shows the fluctuations of the three centers in the bound state in terms of their coordinates: (x1,y1, z1), (x2,y2, z2), and (x3,y3, z3). The lower left/right panel shows their fluctuations in the unbound/bound state in terms of three mutual distances: (r21, r32, r31).
Im9-E9 DNase
Colicin E9 endonuclease (E9 DNase) binds very strongly with its cognate immunity protein Im9. This binding complex has received intensive investigations for its direct relevance in bacterial biology and for its being a model system for the study of how one protein recognizes another [45–47, 57]. This difficult binding problem represents a serious challenge for TI3nD or any other theoretical-computational approaches to produce quantitative agreement with the in vitro data available in the current literature. To meet this standing challenge, we conducted multiple runs of atomistic MD simulations based on the established CHARMM 36 force field parameters [52] from which we obtained the absolute free energy of Im9-E9 binding in quantitative agreement with the in vitro data (Table 1). This close agreement between the in silico and the in vitro data indicates that the chemical accuracy (±kBT) can be achieved for protein recognition problems when rigorous statistical mechanics is implemented on the basis of the established force field parameters.
In the first implementation of TI3nD for Im9-E9 (Protocol 1), three α-carbons were chosen on the immunity protein Im9 (Asn24Cα, Leu33Cα, and Tyr54Cα) as the three centers whose coordinates represent the position and orientation of Im9 (Figure 1, Inset). The PMF shown in Figure 1 is a function of the displacement of these three centers (which are displaced identically). The displacement from 0 to 6 Å was divided into 60 increments (or windows) of 0.1 Å each and the displacement from 6 to 12 Å was divided into 30 increments of 0.2 Å each. At each of these 90 displaced positions of Im9, four sets of data of the forces acting on the three centers were collected from four segments of unbiased MD runs after a long equilibration process during which the three centers on Im9 and additionally, the 22 centers on E9 (shown in Figure 1 inset) were fixed. The statistical mean of the forces was integrated as in Equation (6) along the displacement to yield the PMF shown in Figure 1.
In order to account for the E9 conformation-rigidity changes due to binding, 22 α-carbons on E9 DNase (Pro73Cα, Ser74Cα, Asn75Cα, Lys76Cα, Ser77Cα, Ser78Cα, Val79Cα, Ser80Cα, Phe86Cα, Lys89Cα, Asn90Cα, Gln91Cα, Val93Cα, Arg96Cα, Val98Cα, Pro124Cα, Lys125Cα, Arg126Cα, His127Cα, Ile128Cα, Asp129Cα, and Ile130Cα) were chosen as the 22 centers for which we computed the changes in deviations and fluctuations between the bound and the unbound states (shown in Figures S1–S22). These 22 centers were fixed during the simulations covering the entire range of Im9 displacements. Therefore, n = 3 + 22 in this case of TI3nD study. The two partial partitions involved in the binding energy formula, Equation (1), are 75-dimensional and 72-dimensional, respectively. Namely, and . The ratio between these two partial partitions constitutes a large part of the absolute binding energy in Equation (1) (Table 1). The contributors to these two partial partitions are the following:
The position and orientation of Im9 are quantified by the nine coordinates of the three centers on Im9 (Asn24Cα, Leu33Cα, and Tyr54Cα shown in insets of Figure 1). The nine degrees of freedom of these three centers can be divided into the first group of six degrees of freedom for the translation and rotation of Im9 and the second group of three degrees of freedom for its rigidity. In the bound state, the first group of six degrees of freedom are confined by the binding partner E9 (Figure 1, bottom left panel). In the unbound state, they are unconfined, namely, Im9 is free to translate (three degrees of freedom) and to rotate (three degrees of freedom). The confinement of the first group of six degrees of freedom corresponds to a contribution of 13.77 kcal/mol to the TI3nD computation of the binding free energy (the confinement of the three degrees of freedom in translation contributes 7.34 kcal/mol while the confinement of the three degrees of freedom in rotation carries 6.43 kcal/mol). The second group of three degrees of freedom for the relative motions between these three centers (represented by the three mutual distances shown in Figure 1, bottom right panel) does not differ significantly between the bound and the unbound states. The relative shifting of these three centers contributes −0.98 kcal/mol and the rigidifying of them upon binding, 1.35 kcal/mol, to the absolute binding energy, which sum up to 0.37 kcal/mol.
The position and situation of E9 are quantified by the coordinates of the 22 centers chosen on/near the contact surface with Im9. Upon binding with Im9, they become slightly more rigid. The reduction of their fluctuations altogether give rise to a contribution of 2.23 kcal/mol to the absolute binding energy. The shifting of these 22 centers contributes 5.13 kcal/mol to the absolute binding energy. Both factors are positive and thus against E9-Im9 binding. This unfavorable amount of 7.36 kcal/mol caused by the use of the 22 steering centers is artifactitious. It must be canceled out by the other effects caused by the same. In fact, the physical interactions for Im9-E9 binding, which give rise to the steep changes in the PMF curve of Figure 1, are the hydrophobic contacts and the buried hydrogen bonds between the two proteins (Figure S23). The use of the 22 steering centers made the PMF curve steeper in Figure 1 than in Figure 2. This corresponds to more forceful separation of Im9 from E9 that requires more work done to the system along the pulling paths. The additional rise in the PMF curve (Figure 1 vs. Figure 2) is ~8.6 kcal/mol, which is indeed similar to the unfavorable amount caused by the use of 22 steering centers. Altogether, the use of the 22 centers did not produce a significant change to the final result of the binding free energy. It should be noted that using more steering centers makes the separation of two binding partners more efficient. However, using more steering centers leads to lower accuracy because the cancellation of two large opposite contributions causes error amplification that is exactly what we set out to avoid.
While Protocol 1 involving a large number of centers (3 on Im9 plus 22 on E9) gives accurate insights about how binding of Im9 causes changes to E9, a natural question is about the robustness of TI3nD. Does the result rely on the choice of the steering centers? In order to demonstrate the robustness of TI3nD, we implemented two additional protocols: Protocol 2 has only 3 centers on Im9 (shown in Figure 2) that are identical to the same in Protocol 1 but without the 22 centers on E9. Protocol 3 has 3 centers on Im9 (shown in Figure 3) that are different from Protocol 2. Both Protocols 2 and 3 led to similar results in agreement with the experimental data (Table 1).
While all three protocols lead to identical results in the free energy of binding, Protocol 1 has slight advantages over Protocols 2 and 3 in computing cost and in biophysical insights. Indeed, having more steering centers makes the computation more accurate/efficient because the fluctuations in more degrees of freedom are isolated to the bound and the unbound states. These fluctuations are not computed along the 3nD path connecting one state from the bound state ensemble to the one state in the unbound state ensemble. The choice of steering centers can be quite arbitrary as long as they are on the binding interface between the protein partners. However, they should be on the most stable parts so that it is valid to employ the Gaussian approximation for the fluctuations in the bound and the unbound states.
BTN-AVD
The binding problem of the biotin-avidin complex has been a subject of repeated theoretical-computational investigations because it represents the strongest non-covalent binding and has brought serious challenges to theoretical-computational methods [23]. In fact, optimization of BTN charge distribution led to a significant difference from the generic CHARMM values that are shown in Table S1 and Figure S24 (BTN has a total charge of −e in this work at neutral pH). With the optimized parameters, we obtained the hydration energy of BTN in reasonable approximation to the experimental data (detailed in the next subsection) and the BTN-AVD binding free energy in perfect agreement with the experimental data (Table 1). Since BTN is a long molecule, it is appropriate to choose n = 2. Atoms C4 and C10 of BTN (Figure S24) are chosen as the two centers (six degrees of freedom) to represent its location and orientation. Along one dissociation path, the PMF was computed as an integration of the mean forces on the six degrees of freedom in dot product with the 6D displacement as defined in Equation (6). Four sets of force data were collected from four segments of 0.1 ns sampling after 1 ns equilibrium at each given position. The mean values and the standard deviations are shown in Figure 4, top panel. The middle panel of Figure 4 shows the fluctuations of BTN-C4-C10 in the bound state ensemble, which gives the bound state partial partition . The bottom panel of Figure 4 shows the fluctuations of BTN-C4-C10 in the unbound state ensemble in terms of one degree of freedom that is the C4-C10 distance fluctuating in time. In the unbound state ensemble, two degrees of freedom are in rotation where BTN is free to rotate and its environment is isotropic. The one plus two degrees of freedom in the unbound state combine to give the unbound state partial partition . From the computed values of the PMF difference and the two partial partitions, we obtained the absolute binding free energy of biotin-avidin ΔG = −20.5 kcal/mol which is in close agreement with the experimental value of −21.0 kcal/mol.
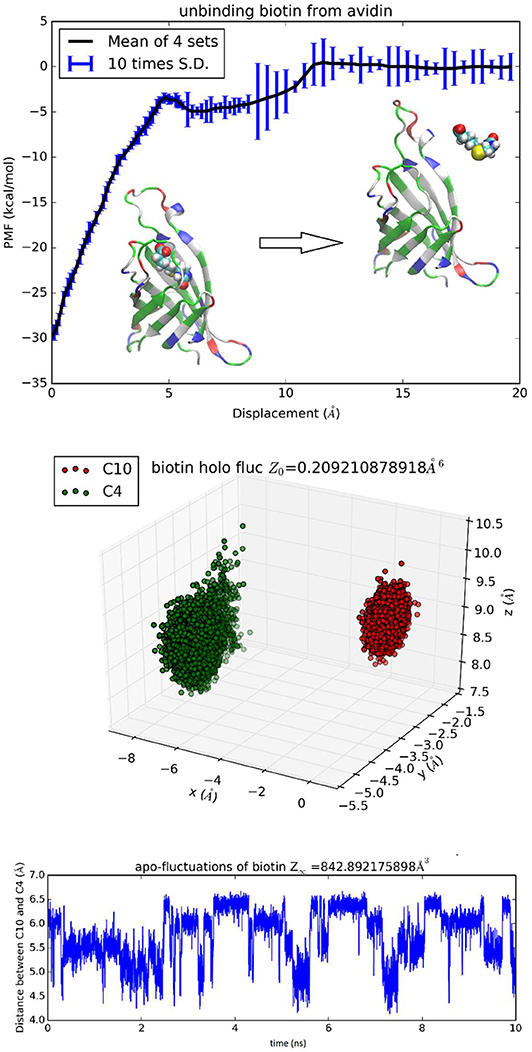
Figure 4. Unbinding biotin from avidin. In the top panel, the PMF is plotted as a function of the displacement of BTN along an unbinding path. Inset: the protein is shown as ribbons colored by residue types and biotin is shown as spheres colored by atoms (hydrogen, white; carbon, cyan; oxygen, red; nitrogen, blue; sulfur, yellow). Fluctuations of C4 and C10 in the bound state ensemble are shown in the middle panel. The fluctuating distance between C4 and C10 in the unbound state ensemble is shown in the bottom panel.
It is interesting to examine the interactions between BTN and the loop connecting the 3rd and the 4th β-sheets consisting of residues 35–46 (noted as L3,4) which were suggested as a significant contributor to the overall binding free energy [23]. The van der Waals interaction energy between the charged BTN and L3,4 is shown in Figure 5 (central panel) as a function of BTN displacement from the binding packet (left panel) along the dissociation path to the unbound state (right panel). With a signal clearly above the noise level, this curve indicates a contribution of about −6 kcal/mol to the total binding free energy of −20.5 kcal/mol, which confirms the hypothesis of General et al. [23]. The electrostatic energy between BTN and L3,4 is also shown in Figure 5. However, the noise is not significantly lower than the signal in this case and thus prevents us from drawing any conclusions based on this one curve. Besides, factors including L3,4-water and BTN-water interactions need to be incorporated and the cancellations among them will cause gross amplifications of the relative errors in approaches relying on direct computation of energies. These considerations all favor the PMF-based approaches for quantitative accuracy.
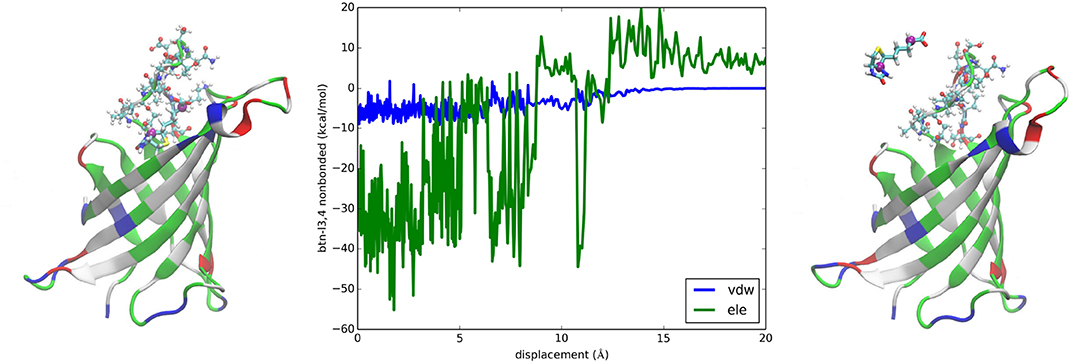
Figure 5. Interactions between biotin and L3,4 of avidin. Plotted in the central panel are the van der Waals and the electrostatic interactions between biotin and L3,4 along the dissociation path. The left and the right panels show the bound and the unbound states of BTN-AVD, respectively. The whole protein is shown as ribbons colored by residue types. The L3,4 residues are shown in ball-and-sticks colored by atom names. BTN is shown in licorices colored by atom names whose C4 and C10 atoms are shown as purple spheres.
TRS-SpvD
SpvD is a Salmonella enterica effector protein whose structure was resolved to atomistic resolution to elucidate the mechanistic basis of its role as a cysteine protease [48]. The binding of a trometamol (TRS) molecule in the structure was not identified as biologically relevant due to the fact that 100 mM of TRS was present in the buffer liquids. Nonetheless, this binding complex provides a simple test for the TI3nD technique because its absolute free energy of binding can be readily inferred from the experimentally measured values of its occupancy at the binding site (PDB code: 5LQ7). In this test of TI3nD, we chose n = 1. The tetrahedral carbon of trometamol (TRS-C) was chosen as the center to represent the molecule's location (three degrees of freedom). Along one dissociation path in the 3D space of the TRS-C coordinates, the PMF was computed as the integration of the mean forces on the three degrees of freedom in dot product with the 3D displacement as defined in Equation (6). Four sets of force data were collected from four segments of 0.1 ns sampling after 1 ns equilibrium at each given position as indicated by the error bars in Figure 6. The mean values and the standard deviations are shown in Figure 6, top panel. Figure 6 also shows the 3D fluctuations of TRS-C at the binding site that gives rise to the partial partition of the bound state . In this case of n = 1, the partial partition of the unbound state is simply Z1, ∞ = 1. The PMF difference between the bound and the unbound states ΔW0, ∞ = −9.5 kcal/mol and two partial partitions combine to give the absolute binding free energy ΔG = −4.1 kcal/mol which agrees well with the experimental data of −4.5 kcal/mol.
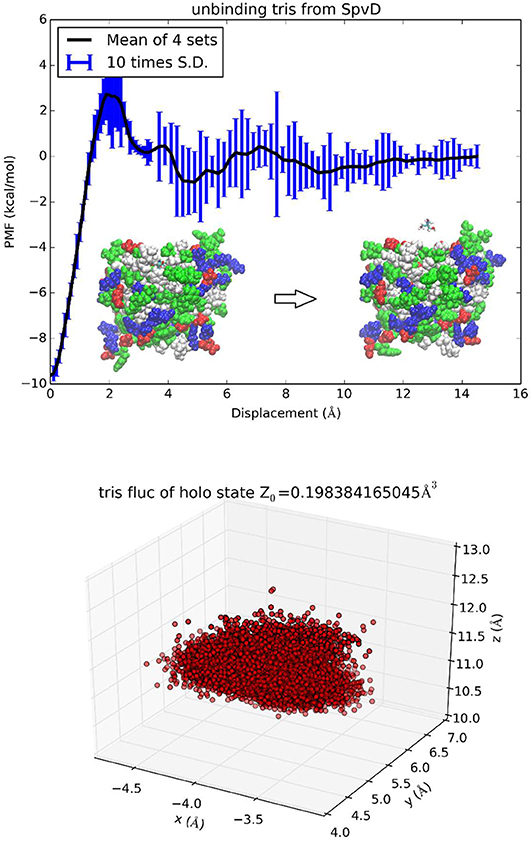
Figure 6. Unbinding trometamol from Salmonella SpvD. In the top panel the PMF is shown as function of the displacement of the TRS tetrahedral carbon (TRS-C) along the z-axis. Inset: the protein is shown as spheres colored by residue types and TRS is shown as licorices colored by atoms. The bottom panel shows TRS fluctuations at the binding site (the xyz-coordinates of TRS-C sampled in the bound state ensemble).
Hydration Energy
For acetamide, water, urea, glycerol, trometamol and ammonium, one center (n = 1) was chosen to represent the molecule's position and therefore partial partitions in water and in vacuum are both equal to one, . The third term on the right-hand side of Equation (7) is simply zero. The PMF difference (shown in Figures S25–S30) directly gives the hydration free energy except in the case of ammonium where the net charge of the cation renders the second term of Equation (7) non-zero. For erythritol, 1,3-propanediol, xylitol, and biotin, two centers (n = 2) were chosen to represent the molecule's position. The partial partitions in water and in vacuum give a small but non-zero contribution in the third term of Equation (7). In these four cases, can be computed by invoking the Gaussian approximation for the fluctuations or by integrating the PMF for stretching the molecule between the two centers (Equation S5). The PMF curves and the partial partitions are shown in Figure 7 for biotin and in Figures S31–S33 for erythritol, 1,3-propanediol and xylitol, respectively. The computed hydration energies of these 10 biologically relevant compounds are tabulated in Table 2 alongside the experimental data. In each case, the computed free energy of hydration agrees closely with the experimental data available from the current literature.
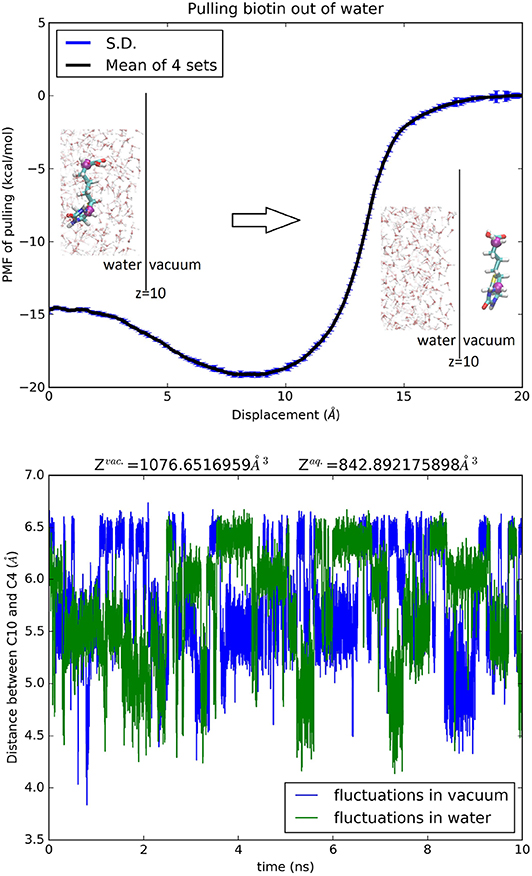
Figure 7. Hydration of biotin. Top panel, the PMF of pulling biotin out of water. The error bars reflect the standard errors among four sets of samplings. The insets show the protonated, neutral biotin in water (left) and out of water (right). BTN is shown as licorices colored by atom names whose C4 and C10 atoms are shown as purple spheres indicating the two centers chosen in this study. The water-vacuum interface is at z = 10 Å. Some of the waters are shown in ball-and-sticks colored by atom names. The bottom panel shows the fluctuating distance between C4 and C10 in water and in vacuum.
Conclusions
In terms of computational approaches, this work adds to the literature a brute force method, TI3nD, which is an unsophisticated implementation of TI on a rigorous basis of statistical mechanics. Without invoking biasing potentials or alchemical schemes, it is shown to be accurate and efficient for protein-interaction problems and to provide a simple, direct way of computing hydration energies. In terms of the biological underpinnings, quantitative insights have been elucidated on the thermodynamic characteristics of E9-Im9 recognition and on the strength of biotin-avidin binding, both in perfect agreement with in vitro experiments. With TI3nD, many complex biophysical processes can be investigated with quantitative accuracy at moderate computing costs. Further development of TI3nD is needed to dissect enthalpic and entropic contributions to the binding/hydration free energy.
Data Availability Statement
All datasets generated in this study are included in the article/Supplementary Material.
Author Contributions
LC was responsible for all aspects of this research.
Conflict of Interest
The author declares that the research was conducted in the absence of any commercial or financial relationships that could be construed as a potential conflict of interest.
Acknowledgments
The author thanks Ruth Chan for a careful reading of the manuscript. He acknowledges support from the NIH (GM121275) and the computing resources provided by the Texas Advanced Computing Center at University of Texas at Austin. This manuscript has been released as a pre-print at bioRxiv [58].
Supplementary Material
The Supplementary Material for this article can be found online at: https://www.frontiersin.org/articles/10.3389/fphy.2020.00202/full#supplementary-material
Abbreviations
3nD, 3n dimensions/dimensional; AVD, deglycosylated egg-white glycoprotein avidin; BTN, biotin, vitamin B7; E9, Colicin E9 endonuclease domain; Im9, cognate immunity protein of E9; MD, molecular dynamics; PMF, potential of mean force; SpvD, Salmonella enterica effector protein, a cysteine hydrolase; TI, thermodynamic integration; TI3nD, thermodynamic integration in 3n dimensions; TRS, tris, trometamol.
References
1. Marín-López MA, Planas-Iglesias J, Aguirre-Plans J, Bonet J, Garcia-Garcia J, Fernandez-Fuentes N, et al. On the mechanisms of protein interactions: predicting their affinity from unbound tertiary structures. Bioinformatics. (2017) 34:592–8. doi: 10.1093/bioinformatics/btx616
2. Liu H, Liu X, Zhou S, An X, Liu H, Yao X. Disclosing the template-induced misfolding mechanism of tau protein by studying the dissociation of the boundary chain from the formed tau fibril based on a steered molecular dynamics simulation. ACS Chem Neurosci. (2019) 10:1854–65. doi: 10.1021/acschemneuro.8b00732
3. Qiao B, Lopez L, Olvera de la Cruz M. “Mirror”-like protein dimers stabilized by local heterogeneity at protein surfaces. J Phys Chem B. (2019) 123:3907–15. doi: 10.1021/acs.jpcb.9b01394
4. Stourac J, Vavra O, Kokkonen P, Filipovic J, Pinto G, Brezovsky J, et al. Caver Web 1.0: identification of tunnels and channels in proteins and analysis of ligand transport. Nucleic Acids Res. (2019) 47:W414–22. doi: 10.1093/nar/gkz378
5. Zhang L, Bell DR, Luan B, Zhou R. Exploring the binding mechanism between human profilin (PFN1) and polyproline-10 through binding mode screening. J Chem Phys. (2019) 150:015102. doi: 10.1063/1.5053922
6. de Ruiter A, Oostenbrink C. Advances in the calculation of binding free energies. Curr Opin Struct Biol. (2020) 61:207–12. doi: 10.1016/j.sbi.2020.01.016
7. Gong Q, Zhang H, Zhang H, Chen C. Calculating the absolute binding free energy of the insulin dimer in an explicit solvent. RSC Adv. (2020) 10:790–800. doi: 10.1039/C9RA08284K
8. Menzer WM, Xie B, Minh DDL. On restraints in end-point protein–ligand binding free energy calculations. J Comput Chem. (2020) 41:573–86. doi: 10.1002/jcc.26119
9. Durrant JD, McCammon JA. Molecular dynamics simulations and drug discovery. BMC Biol. (2011) 9:71. doi: 10.1186/1741-7007-9-71
10. Boyce SE, Mobley DL, Rocklin GJ, Graves AP, Dill KA, Shoichet BK. Predicting ligand binding affinity with alchemical free energy methods in a polar model binding site. J Mol Biol. (2009) 394:747–63. doi: 10.1016/j.jmb.2009.09.049
11. Wahl J, Smieško M. Assessing the predictive power of relative binding free energy calculations for test cases involving displacement of binding site water molecules. J Chem Inf Model. (2019) 59:754–65. doi: 10.1021/acs.jcim.8b00826
12. Miyamoto S, Kollman PA. Absolute and relative binding free energy calculations of the interaction of biotin and its analogs with streptavidin using molecular dynamics/free energy perturbation approaches. Proteins. (1993) 16:226–45. doi: 10.1002/prot.340160303
13. Gapsys V, Michielssens S, Peters JH, de Groot BL, Leonov H. Calculation of binding free energies. In: Kukol A, editor. Molecular Modeling of Proteins. New York, NY: Springer (2015). p. 173–209.
14. Cournia Z, Allen B, Sherman W. Relative binding free energy calculations in drug discovery: recent advances and practical considerations. J Chem Inf Model. (2017) 57:2911–37. doi: 10.1021/acs.jcim.7b00564
15. Woo HJ, Roux B. Calculation of absolute protein–ligand binding free energy from computer simulations. Proc Acad Natl Sci USA. (2005) 102:6825–30. doi: 10.1073/pnas.0409005102
16. Ytreberg FM, Swendsen RH, Zuckerman DM. Comparison of free energy methods for molecular systems. J Chem Phys. (2006) 125:184114. doi: 10.1063/1.2378907
17. Mobley DL, Dill KA. Binding of small-molecule ligands to proteins: “What You See” is not always “What You Get.” Structure. (2009) 17:489–98. doi: 10.1016/j.str.2009.02.010
18. Zhou HX, Gilson MK. Theory of free energy and entropy in noncovalent binding. Chem Rev. (2009) 109:4092–107. doi: 10.1021/cr800551w
19. Hou T, Wang J, Li Y, Wang W. Assessing the performance of the MM/PBSA and MM/GBSA methods. 1. The accuracy of binding free energy calculations based on molecular dynamics simulations. J Chem Inf Model. (2010) 51:69–82. doi: 10.1021/ci100275a
20. Cai L, Zhou HX. Theory and simulation on the kinetics of protein–ligand binding coupled to conformational change. J Chem Phys. (2011) 134:105101. doi: 10.1063/1.3561694
21. Chodera JD, Mobley DL, Shirts MR, Dixon RW, Branson K, Pande VS. Alchemical free energy methods for drug discovery: progress and challenges. Curr Opin Struct Biol. (2011) 21:150–60. doi: 10.1016/j.sbi.2011.01.011
22. Gallicchio E, Levy RM. Recent theoretical computational advances for modeling protein–ligand binding affinities. In: Christo C, editor. Advances in Protein Chemistry Structural Biology. Cambridge, MA: Academic Press (2011). p. 27–80.
23. General IJ, Dragomirova R, Meirovitch H. Absolute free energy of binding of avidin/biotin, revisited. J Phys Chem B. (2012) 116:6628–36. doi: 10.1021/jp212276m
24. Wu X, Damjanovic A, Brooks BR. Efficient and unbiased sampling of biomolecular systems in the canonical ensemble: a review of self-guided langevin dynamics. In: SA Rice, AR Dinner editors. Advances in Chemical Physics. Hoboken, NJ: John Wiley & Sons, Inc. (2012). p. 255–326.
25. Gumbart JC, Roux B, Chipot C. Standard binding free energies from computer simulations: what is the best strategy? J Chem Theory Comput. (2013) 9:794–802. doi: 10.1021/ct3008099
26. Zeller F, Zacharias M. Evaluation of generalized born model accuracy for absolute binding free energy calculations. J Phys Chem B. (2014) 118:7467–74. doi: 10.1021/jp5015934
27. Doudou S, Burton NA, Henchman RH. Standard free energy of binding from a one-dimensional potential of mean force. J Chem Theory Comput. (2009) 5:909–18. doi: 10.1021/ct8002354
28. Misini Ignjatović M, Caldararu O, Dong G, Muñoz-Gutierrez C, Adasme-Carreño F, Ryde U. Binding-affinity predictions of HSP90 in the D3R grand challenge 2015 with docking, MM/GBSA, QM/MM, and free-energy simulations. J Comput Aid Mol Des. (2016) 30:707–30. doi: 10.1007/s10822-016-9942-z
29. Kingsley LJ, Esquivel-Rodríguez J, Yang Y, Kihara D, Lill MA. Ranking protein–protein docking results using steered molecular dynamics and potential of mean force calculations. J Comput Chem. (2016) 37:1861–5. doi: 10.1002/jcc.24412
30. Zhang Z, Santos AP, Zhou Q, Liang L, Wang Q, Wu T, et al. Steered molecular dynamics study of inhibitor binding in the internal binding site in dehaloperoxidase-hemoglobin. Biophys Chem. (2016) 211:28–38. doi: 10.1016/j.bpc.2016.01.003
31. Hu G, Cao Z, Xu S, Wang W, Wang J. Revealing the binding modes and the unbinding of 14-3-3σ proteins and inhibitors by computational methods. Sci Rep. (2015) 5:16481. doi: 10.1038/srep16481
32. Musgaard M, Biggin C. Steered molecular dynamics simulations predict conformational stability of glutamate receptors. J Chem Inf Model. (2016) 56:1787–97. doi: 10.1021/acs.jcim.6b00297
33. Niu Y, Pan D, Yongjiu Y, Yao X, Liu H. Revealing the molecular mechanism of different residence times of ERK2 inhibitors via binding free energy calculation and unbinding pathway analysis. Chemometr Intell Lab. (2016) 158:91–101. doi: 10.1016/j.chemolab.2016.08.002
34. Rutardottir S, Karnaukhova E, Nantasenamat C, Songtawee N, Prachayasittikul V, Rajabi M, et al. Conformational free energy of alkylsilanes by nonequilibrium-pulling Monte Carlo simulation. Mol Simulat. (2016) 42:693–701. doi: 10.1080/08927022.2015.1083101
35. Perthold JW, Oostenbrink C. Simulation of reversible protein–protein binding and calculation of binding free energies using perturbed distance restraints. J Chem Theory Comput. (2017) 13:5697–708. doi: 10.1021/acs.jctc.7b00706
36. Lemkul JA, Bevan DR. Assessing the stability of alzheimer's amyloid protofibrils using molecular dynamics. J. Phys. Chem. B. (2010) 114:1652. doi: 10.1021/jp9110794
37. Rodriguez RA, Chen LY, Plascencia-Villa G, Perry G. Elongation affinity, activation barrier, and stability of Aβ42 oligomers/fibrils in physiological saline. Biochem Biophys Res Commun. (2017) 487:444–9. doi: 10.1016/j.bbrc.2017.04.084
38. May A, Pool R, van Dijk E, Bijlard J, Abeln S, Heringa J, et al. Coarse-grained versus atomistic simulations: realistic interaction free energies for real proteins. Bioinformatics. (2014) 30:326. doi: 10.1093/bioinformatics/btt675
39. Kirkwood JG. Statistical mechanics of fluid mixtures. J Chem Phys. (1935) 3:300–13. doi: 10.1063/1.1749657
40. Chandler D. Statistical mechanics of isomerization dynamics in liquids and the transition state approximation. J Chem Phys. (1978) 68:2959–70. doi: 10.1063/1.436049
41. Pratt LR, Hummer G, Garcia AE. Ion pair potentials-of-mean-force in water. Biophys Chem. (1994) 51:147–65. doi: 10.1016/0301-4622(94)00057-3
42. Roux B. The calculation of the potential of mean force using computer simulations. Comput Phys Commun. (1995) 91:275–82. doi: 10.1016/0010-4655(95)00053-I
43. Allen TW, Andersen OS, Roux B. Molecular dynamics—potential of mean force calculations as a tool for understanding ion permeation and selectivity in narrow channels. Biophys Chem. (2006) 124:251–67. doi: 10.1016/j.bpc.2006.04.015
44. Darve E. Thermodynamic integration using constrained unconstrained dynamics. In: Chipot C, Pohorille A, editors. Free Energy Calculations: Theory Applications in Chemistry Biology. Berlin: Springer Berlin Heidelberg (2007). p. 119–70.
45. Wallis R, Leung KY, Pommer AJ, Videler H, Moore GR, James R, et al. Protein-protein interactions in colicin E9 DNase-immunity protein complexes. 2. Cognate and noncognate interactions that span the millilmolar to femptomolar affinity range. Biochemistry. (1995) 34:13751–9. doi: 10.1021/bi00042a005
46. Papadakos G, Wojdyla JA, Kleanthous C. Nuclease colicins and their immunity proteins. Q Rev Biophys. (2011) 45:57–103. doi: 10.1017/S0033583511000114
47. Keeble AH, Joachimiak LA, Maté MJ, Meenan N, Kirkpatrick N, Baker D, et al. Experimental and computational analyses of the energetic basis for dual recognition of immunity proteins by colicin endonucleases. J Mol Biol. (2008) 379:745–59. doi: 10.1016/j.jmb.2008.03.055
48. Grabe GJ, Zhang Y, Przydacz M, Rolhion N, Yang Y, Pruneda JN, et al. The salmonella effector SpvD is a cysteine hydrolase with a serovar-specific polymorphism influencing catalytic activity, suppression of immune responses, and bacterial virulence. J Biol Chem. (2016) 291:25853–63. doi: 10.1074/jbc.M116.752782
49. Chen LY. Hybrid steered molecular dynamics approach to computing absolute binding free energy of ligand–protein complexes: a brute force approach that is fast and accurate. J Chem Theory Comput. (2015) 11:1928–38. doi: 10.1021/ct501162f
50. Rodriguez RA, Yu L, Chen LY. Computing protein–protein association affinity with hybrid steered molecular dynamics. J Chem Theory Comput. (2015) 11:4427–38. doi: 10.1021/acs.jctc.5b00340
51. Chen LY, Bastien DA, Espejel HE. Determination of equilibrium free energy from nonequilibrium work measurements. Phys Chem Chem Phys. (2010) 12:6579–82. doi: 10.1039/b926889h
52. Best RB, Zhu X, Shim J, Lopes PE, Mittal J, Feig M, et al. Optimization of the additive CHARMM all-atom protein force field targeting improved sampling of the backbone φ, ψ and side-chain χ1 and χ2 dihedral Angles. J Chem Theory Comput. (2012) 8:3257–73. doi: 10.1021/ct300400x
53. Vanommeslaeghe K, MacKerell AD Jr. CHARMM additive and polarizable force fields for biophysics and computer-aided drug design. Biochim Biophys Acta. (2015) 1850:861–71. doi: 10.1016/j.bbagen.2014.08.004
54. Phillips JC, Braun R, Wang W, Gumbart J, Tajkhorshid E, Villa E, et al. Scalable molecular dynamics with NAMD. J Comput Chem. (2005) 26:1781–802. doi: 10.1002/jcc.20289
55. Livnah O, Bayer EA, Wilchek M, Sussman JL. Three-dimensional structures of avidin and the avidin-biotin complex. Proc Acad Natl Sci USA. (1993) 90:5076–80. doi: 10.1073/pnas.90.11.5076
56. Wang L, Wu Y, Deng Y, Kim B, Pierce L, Krilov G, et al. Accurate and reliable prediction of relative ligand binding potency in prospective drug discovery by way of a modern free-energy calculation protocol and force field. J Am Chem Soc. (2015) 137:2695–703. doi: 10.1021/ja512751q
57. Kim YC, Tarr AW, Penfold CN. Colicin import into E. coli cells: a model system for insights into the import mechanisms of bacteriocins. Biochim Biophys Acta. (2014) 1843:1717–31. doi: 10.1016/j.bbamcr.2014.04.010
Keywords: free energy, protein interaction, thermodynamic integration, molecular recognition, hydration energy, molecular modeling
Citation: Chen LY (2020) Thermodynamic Integration in 3n Dimensions Without Biases or Alchemy for Protein Interactions. Front. Phys. 8:202. doi: 10.3389/fphy.2020.00202
Received: 25 March 2020; Accepted: 06 May 2020;
Published: 09 June 2020.
Edited by:
Rajarshi Chakrabarti, Indian Institute of Technology Bombay, IndiaReviewed by:
Rajesh Kumar Murarka, Indian Institute of Science Education and Research, Bhopal, IndiaAnanya Debnath, Indian Institute of Technology Jodhpur, India
Copyright © 2020 Chen. This is an open-access article distributed under the terms of the Creative Commons Attribution License (CC BY). The use, distribution or reproduction in other forums is permitted, provided the original author(s) and the copyright owner(s) are credited and that the original publication in this journal is cited, in accordance with accepted academic practice. No use, distribution or reproduction is permitted which does not comply with these terms.
*Correspondence: Liao Y. Chen, bGlhby5jaGVuQHV0c2EuZWR1
 Liao Y. Chen
