- Department of Human and Engineered Environmental Studies, Graduate School of Frontier Science, The University of Tokyo, Kashiwa, Japan
This paper is the first to differentiate between concave and convex price motion trajectories by applying visibility-graph and invisibility-graph algorithms to the analyses of stock indices. Concave and convex indicators for price increase and decrease motions are introduced to characterize accelerated and decelerated stock index increases and decreases. Upon comparing the distributions of these indicators, it is found that asymmetry exists in price motion trajectories and that the degree of asymmetry, which is characterized by the Kullback-Leibler divergence between the distributions of rise and fall indictors, fluctuates after a change in time scope. Moreover, asymmetry in price motion speeds is demonstrated by comparing conditional expected rise and fall returns on the node degrees of visibility and invisibility graphs.
1. Introduction
The use of network science to perform time series analysis has emerged in recent decades. Of the numerous approaches to rendering a time series into a complex network, three major categories of approaches have most attracted researchers’ attention [1–11]. The first approach uses recurrence networks and was introduced by Donner and Zou et al. in 2009 [5–8]. This approach analyzes phase space recurrence of a time series from a geometric point of view by interpreting the recurrence matrix of a time series as the adjacency matrix of a complex network. Transition networks represent the second major approach to transform a time series into a complex network. These networks are constructed by partitioning the phase space of a dynamic system and were introduced by Nicolis et al. in 2005 [9]. Hence, a node in a transition network represents a certain discrete state or pattern that describes the dynamic system. Direct links are established if one of the nodes is followed by another with nonzero probability along the time series [10]. The third category is the algorithmic group of visibility graphs (VG) [11]. In 2008, Lacasa et al. proposed an effective method called the visibility-graph algorithm (VGA) for converting a time series into a graph network by analyzing the mutual visibility relationships between points and cutting points in a computational geometry landscape [12, 13]. This concept has attracted great interest and numerous extensions of the standard VGA have been proposed. Luque et al. [14] came up with a simplified VGA called a horizontal visibility graph (HVG) to transform a time series into a complex network. Specifically, two observations are connected in an HVG if and only if there are no obstacles in between [15]. Based on the concepts of the VG and HVG, parametric VGs introduce a viewing angle
Analyses of financial time series via a VG approach have been studied intensively [19–29]. For example, Long Yu discovered small-world characteristics in visibility-graph networks converted from the time series of the price of gold and its returns [24]. Moreover, Yao et al. found that exchange-rate networks converted from the currency-rate time series of the US dollar, euro, yen, and sterling against the Chinese yuan share consistent topological characteristics with hierarchical structures and mixed small-world and scale-free properties. They also discovered that network communities are actually composed of large numbers of trending points and small numbers of discrete peaks and trough points [25]. Furthermore, a novel method that combined VGA with link prediction was proposed by Zhang et al. to forecast the time series. Using fuzzy logic, better predictability can be achieved by fusing the direct and indirect effects of historical data [26].
Asymmetry in financial time series has generally been explored via statistical analysis [30–42]. Typically, it is found that the distribution of time horizons over which a detrended stock index moves from an arbitrary initial return to a predetermined positive level deviates to a symmetrically predetermined negative level [37–40]. This property is known as the gain-loss asymmetry and has been regarded as a characteristic of financial time series [30, 34, 36, 37]. Another well-known asymmetry, which describes the negative correlation between volatility and the direction of price motion, is the leverage effect [41]. Recently, Jiang et al. investigated asymmetry in large-scale price fluctuations. Analyses reveal that dynamic relaxation before and after large fluctuations is characterized by a power law with exponents
In this paper, we propose to study the financial time series asymmetry via visibility-graph networks based on the intuition that network approaches may be more effective in identifying different price motion trajectories. Hence the terminology of symmetry in this study specifically refers to the topological symmetry of the price motion trajectories. In particular, in a stock price series, we are concerned with whether concave and convex price motions can form a time-reversed symmetry. The research question reads as follows: whether those accelerated/decelerated price rises are statistically symmetric with those decelerated/accelerated falls. It is worth mentioning that conventional VGA analysis cannot be applied directly to investigation of the topologically asymmetric properties of financial series because the method is incapable of distinguishing different stock price rise and fall trajectories by mapping the time series as a whole onto an undirected network. To solve this problem, an idea from Yan et al. (2012) [43] is borrowed to address discrimination between price movements via visibility and invisibility-graph (IVG) networks. Using these graph networks, asymmetry in stock index motion can be measured using concave or convex indicator distributions or expected returns that are conditional on node degrees, instead of the conventional waiting-time statistics.
Recently, fruitful results have been achieved in the investigation of time series time reversibility using the HVG method [44–51]. In a study on how crises affect the motions of US stock prices, different market price behaviors are identified by examining the series irreversibility evolved over the time [50, 51]. Based on the notion that the reversed and original processes are statistically distinguishable if a stationary process is time-reversible, we may postulate that a topological symmetric time series must be a time-reversible one, and vice versa. A quantitative analysis of this postulation is also conducted.
The whole paper consists of four sections. Following the introduction of the study in Section 1, the methodology is detailed in Section 2. Asymmetry in price motion trajectories and speeds is analyzed using graph networks in Section 3 and 4, respectively. Finally, conclusions are described in Section 5.
2. Methodology
2.1. Basic Algorithms
Graph networks for AR and DF motions of a stock index can be constructed by mapping a time series of length
the two data points
The invisibility-graph algorithm (IVGA) [43] can be used to build up the networks that describe DR and AF motions of a stock index. In contrast to the VGA, here, the data points
Based on Yan’s study [43], three conditions are further applied to distinguish AR and DF in VG as well as DR and AF in IVG. These conditions are stated as follows:
1. Any data point in the time series can be linked only to data points located on its left-hand side.
2. The link between
3. A moving time scope
With these three additional conditions, VGA and IVGA can capture rise and fall trends by eliminating links converted from the short-term disturbing price motions. We demonstrate the capture of time series topological symmetry in Figures 1 and 2. The networks in Figures 1 and 2 are built from an artificial time series that combines the original Hang Seng Index sample data with its mirror-symmetric counterpart. Figure 1 shows that VGA can distinguish the concave trajectory of the price rise from other price motions. For those data points located on the concave upward trend (from node 11 to node 14 in the original HSI section and from node 24 to node 26 in the reversed HSI section), the degree numbers of AR nodes are higher. For other data points, in contrast, the degree numbers are lower. VGA can also distinguish concave decreasing price motions as well (from node 3 to node 5 in the original HSI section and from node 15 to node 19 in the reversed HSI section). In Figure 2, however, the convex trajectories of price motions are captured effectively by IVGA based on the degree distributions for price rise (from node 10 to node 12 in the original HSI section and from node 26 to node 28 in the reversed HSI section) and price fall (from node 1 to node 3 in the original HSI section and node 17 to node 19 in the reversed HSI section). Obviously, the artificial time series has perfectly symmetric price motion trajectories since the concave (convex) rise in the original HSI section has a corresponding convex (concave) fall in the reversed HSI section. The identical rising and falling degree distributions of VGs and IVGs in Figures 1 and 2 reveal that this artificial time series does have a perfect topological symmetry. Given the definition of time reversibility, a topologically symmetrical time series must be a time-reversible one. The reason lies in that if a time series is topologically symmetrical, the reversed and original processes should be statistically indistinguishable with regard to the degree distributions of nodes.
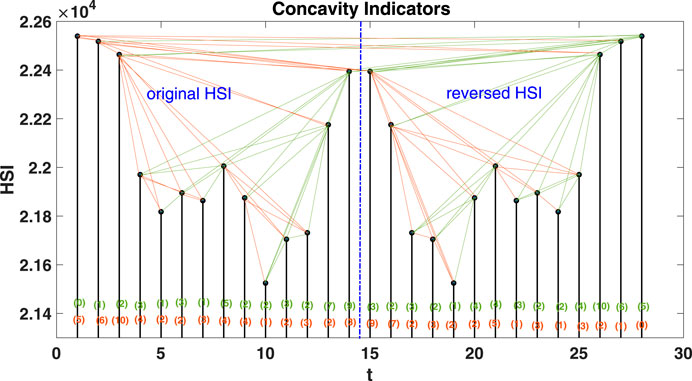
FIGURE 1. Application of VGA to the daily Hang Seng Index from August 13, 2013, to September 2, 2013, and its time-reversely mirrored data set. Note that the perfect reflection symmetry between AR [nodes 10–14] and DF [nodes 1–5] is demonstrated via identically distributed degrees in the two networks.
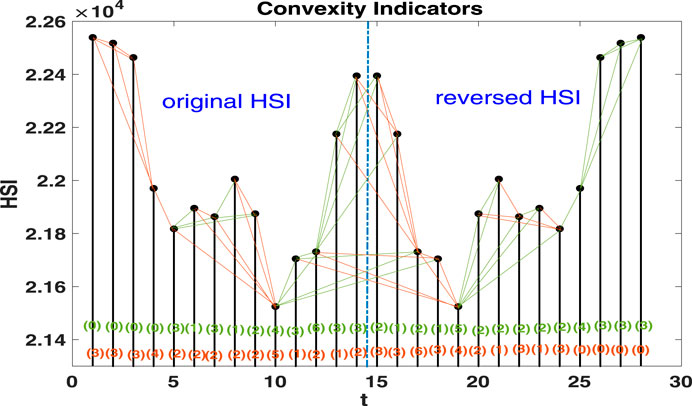
FIGURE 2. Application of the modified IVGA to the daily Hang Seng Index from August 13, 2013, to September 2, 2013, and its time-reversely mirrored data. Note that perfect reflectional symmetry between DR [nodes 5–8 in (A)] and AF [nodes 6–10 in (B)] is demonstrated via identically distributed degrees in the two networks.
2.2. Concave and Convex Motion Indicators
To formalize the algorithms shown above, we specify a node
Employing the three additional conditions described in Section 2.1, the subsets of nodes that connect to node
Hence, the degree of node
By definition,
Note that, for an ideal concave trajectory consisting of
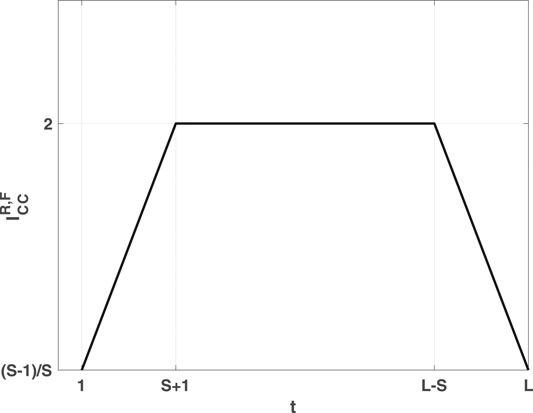
FIGURE 3. The distribution of concave indicators
Hence, the mean value of
In the same manner, the mathematical set that describes the invisibility-graph network can be written as
Subsets of the rise and fall trend read, respectively, as follows:
The degree of node
Convex motion indicators can thus be defined via
the distribution of which measures how perfectly a convex curve can fit an ideal DR or AF motion price trajectories. Likewise,
A quantitative measure of the topological asymmetry in price motion trajectory can be done via the distinguishability between distributions of the concave and convex rise/fall indicators defined above. Specifically, denoting the distribution of rise indicators as
On the other hand, the degree of topological asymmetry is measured by calculating the Kullback-Leibler divergence (KLD) of
which equals 0 if and only if
3. Asymmetry in Trajectories of Price Motion
Analyses that include the application of VGA and IVGA to the stock indices of various countries and regions are presented in this section. Eight data sets from international stock market indices that span from June 28, 1999, to June 28, 2019, were selected. These include the Hong Kong Hang Seng, Dow Jones Industrial Average, Japanese Nikkei 225, London FTSE 100, German DAX, French CAC 40, Shanghai SSE Composite, and Indian BSE. Here, we set the time scope as S = 262 since the number can be interpreted as the trading days in a year.
Networks converted from the Hang Seng Index are used to demonstrate how the concave and convex motion indicators [Eqs 6 and 10] change along with the time evolution of price.
In the upper panel of Figure 4, the long-lasting bubble right before the subprime mortgage crisis in 2008 is characterized by clusters of large concave rise indicators. The large concave fall indicators in the lower panel of Figure 4, however, characterize the decelerated fall of the index over 3 years after it reaches 18,000 points on March 27, 2000. The large convex rise indicators in the upper panel of Figure 5 show that the Hang Seng Index exhibits a decelerated rise from 2009 to 2011 after the subprime mortgage crisis. The notorious 2008–2009 crisis is represented by the extraordinarily large values of convex fall indicators in the lower panel of Figure 5. Both figures show that the concave rise indicator changes asynchronously with its fall counterpart, just as the convex fall indicator changes asynchronously with its rise counterpart.
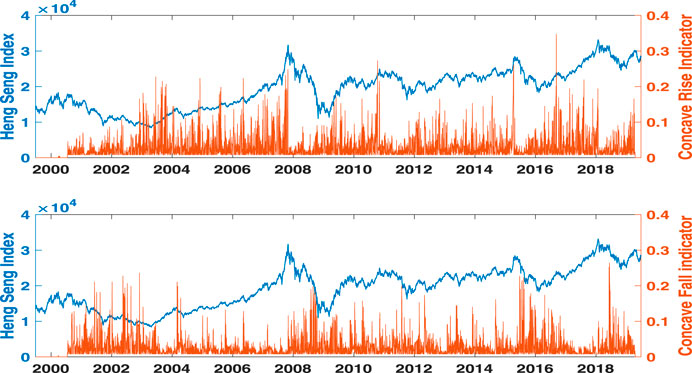
FIGURE 4. Price motion indicators measure AR and DF in the Hang Seng Index from June 28, 1999, to June 28, 2019. Concave rise and fall indicators are shown in the upper and lower panels, respectively. The Hang Seng Index is plotted using blue lines, while the indicators use red bars. The time scope is set to S = 262, which is equal to the number of trading days per year.
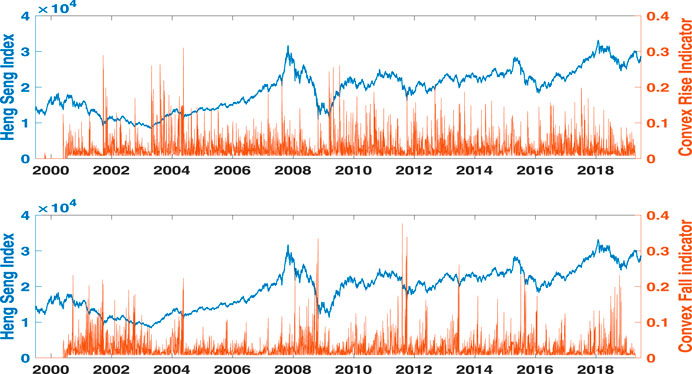
FIGURE 5. Price motion indicators measure DR and AF in the Hang Seng Index from June 28, 1999, to June 28, 2019. Convex rise and fall indicators are shown in the upper and lower panels, respectively. The Hang Seng Index is plotted using blue lines and indicators are represented using red bars. Here, the time scope is set to S = 262, which is equal to the number of trading days per year.
To illustrate asymmetry in the price motion trajectories for these eight financial time series, distributions of
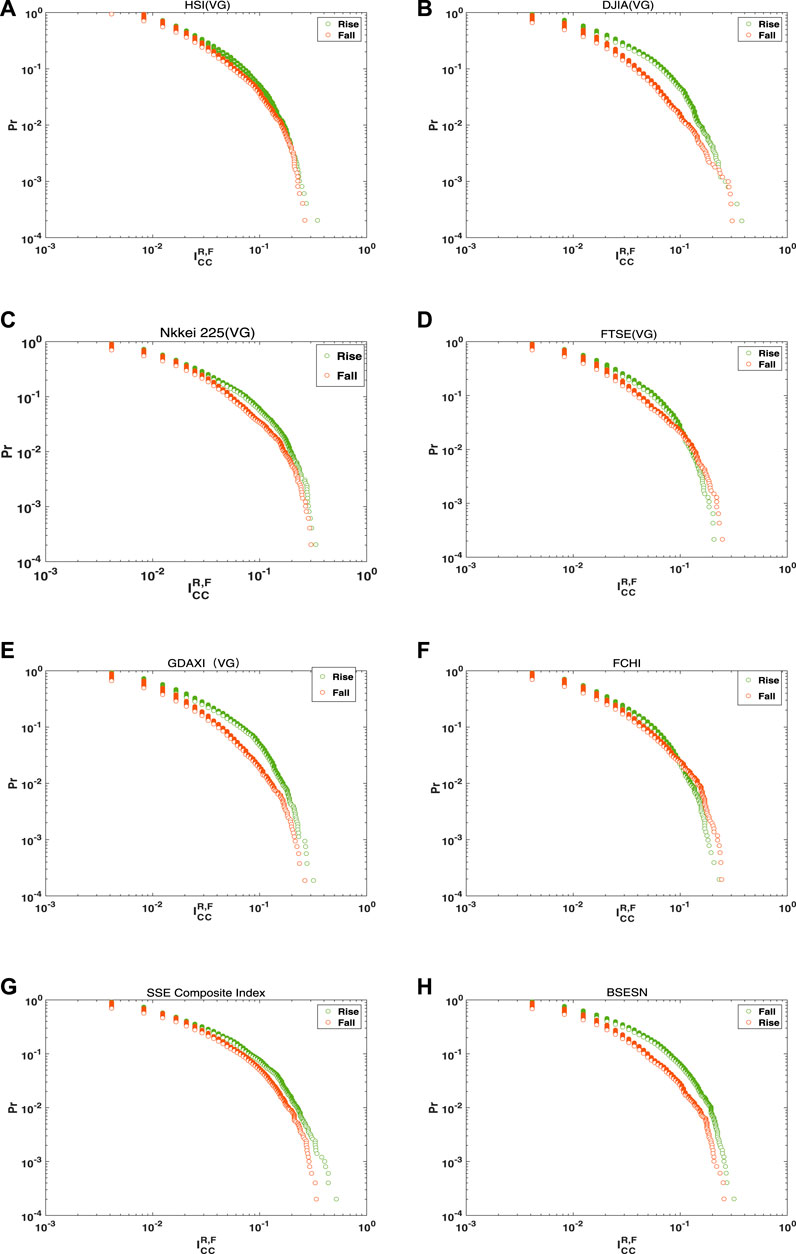
FIGURE 6. Rise and fall
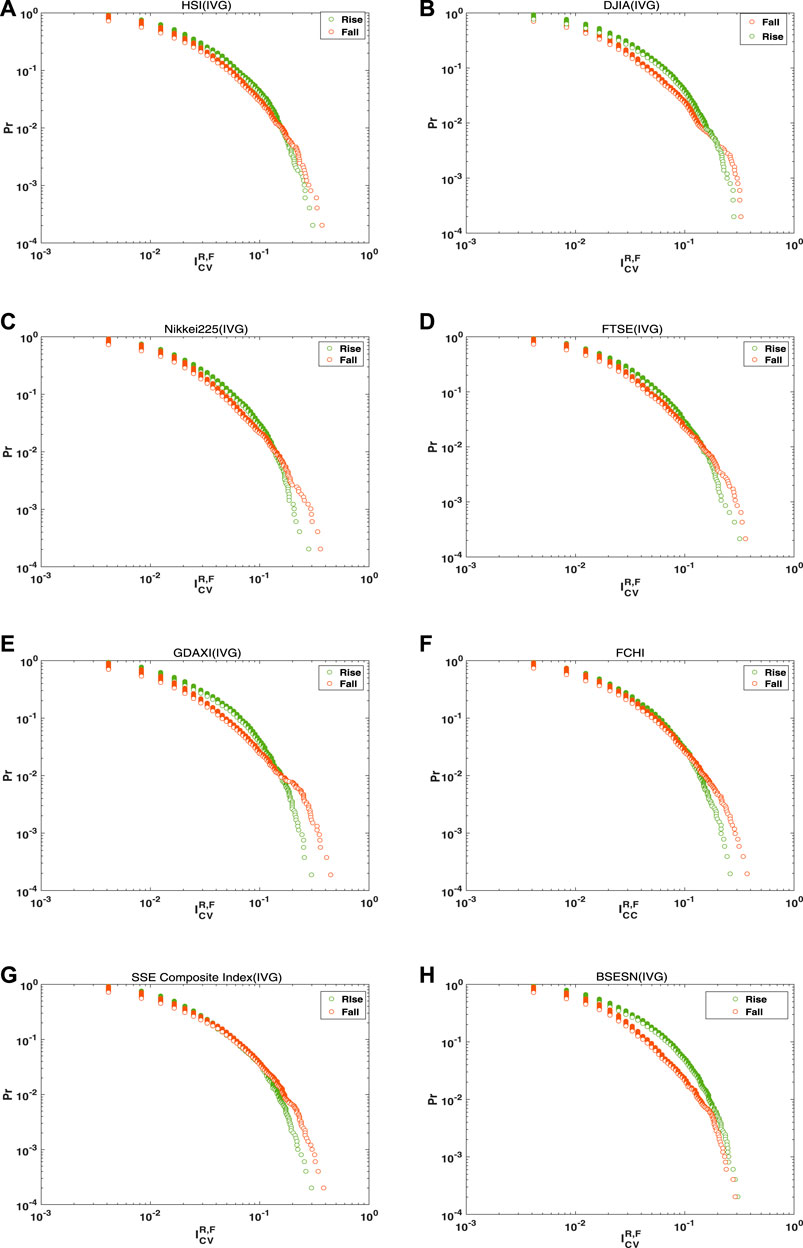
FIGURE 7. Distributions of rise and fall
Average values of rise and fall indicators are also calculated for the eight stock indices. The rise and fall
As the time scale can be an important factor that influences the topological asymmetry in stock price motion, we measure the KLD between the rise and fall distributions of
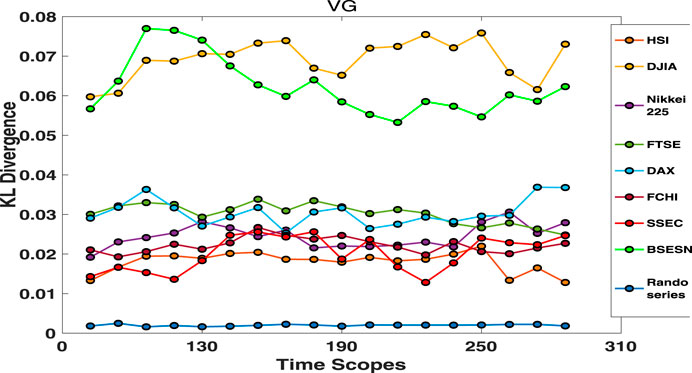
FIGURE 8. KL divergence between
The KL-divergence values between rise and fall
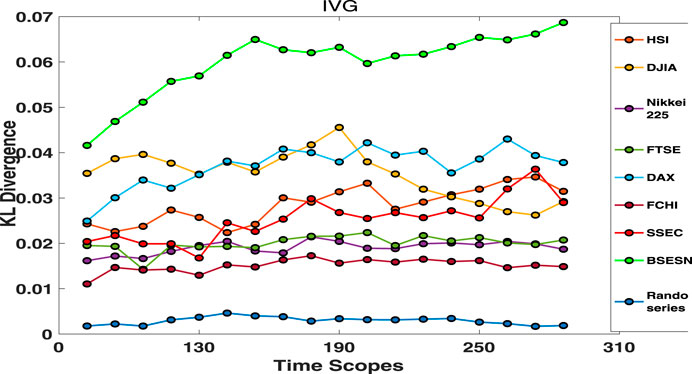
FIGURE 9. KL divergences between
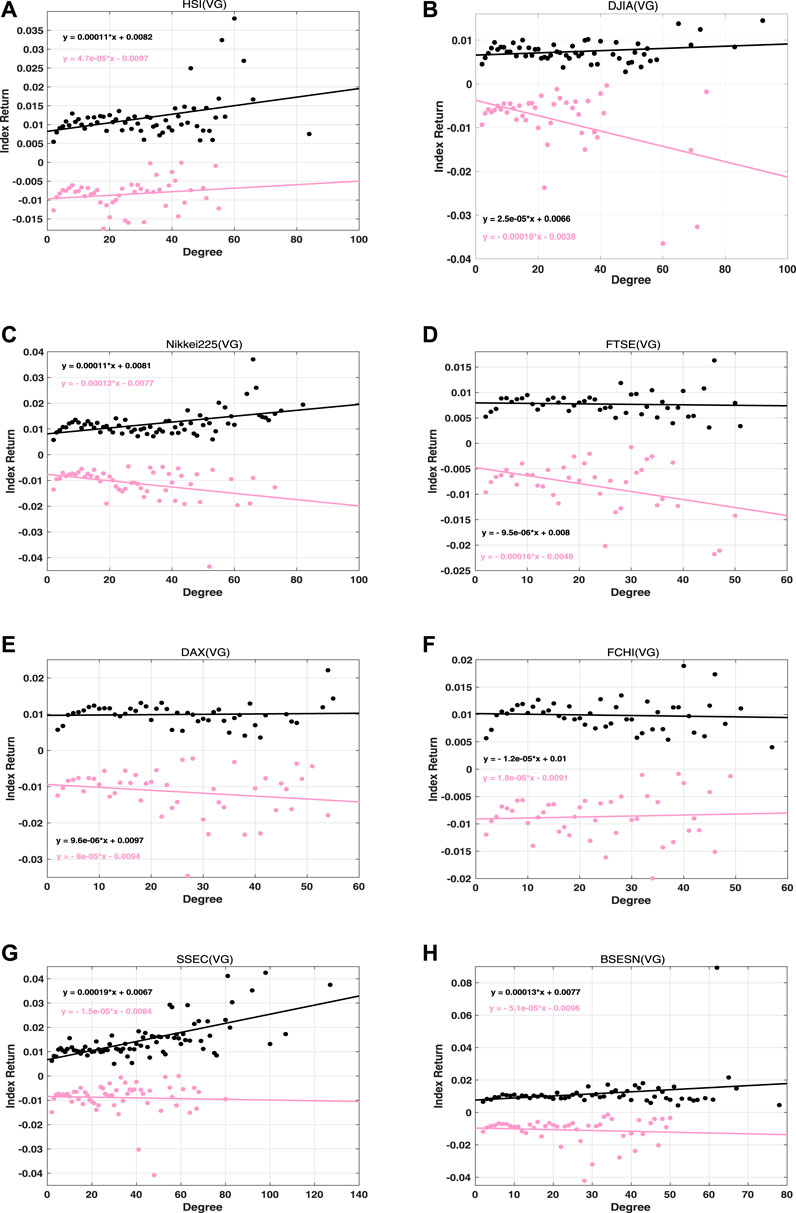
FIGURE 10. Conditional expected index returns for the degree of rise and fall price motions within VG networks for the eight stock indices. Red indicates a rise and black indicates a fall.
In Figures 8 and 9, we note that the KLDs for random series are close to 0 and vary little as the parameter
In addition, KLDs of the BSESN are found to be dramatically higher than those of other stock markets in Figures 8 and 9. In particular, the observation that the BSESN KLD follows an increasing trend in Figure 9 indicates that the Indian stock market index exhibits a long-term, low-speed rise. This is in line with observations that the Indian stock market was in a bull market for over 20 years until the coronavirus outbreak. The KLD results in Figure 8 also show that the DJIA has relatively large topological asymmetry between AR and DF price motions during the period from 1999 to 2019, which indicates that the price is pushed upwards mostly by AF motions in the USA bull markets. As Yan et al. [43] published, the AR price motion implies a superexponential growth typically caused by investors’ herding behavior. Over the past decade, there have been several reports on herd buying behavior of AAPL and MSFT [54, 55]. A report published on December 4, 2019 [56], said “The Dow Jones Industrial Average owes Apple and Microsoft corporation a big thanks.” These reports may explain why AR motions dominate the movement of DJIA index.
4. Asymmetry in Speeds of Price Motion
Yan et al. argued that a higher degree number
In order to measure the asymmetry in the speeds of price motion, the expected price return
where
where
The expected rise and fall returns that are conditioned on the VG node degree for eight stock indices are plotted in Figure 10, while those conditioned on the IVG node degree are in Figure 11. Expected return data points are fitted linearly and shown as black lines for rise motions and pink lines for fall motions, respectively, in Figures 10 and 11. The slopes of the fitting lines show the correlated relationships between expected returns and degree regardless of whether the trajectories are concave or convex. The larger the absolute slope, the more significantly a stock index exhibits a superexponential or a logarithmic motion.
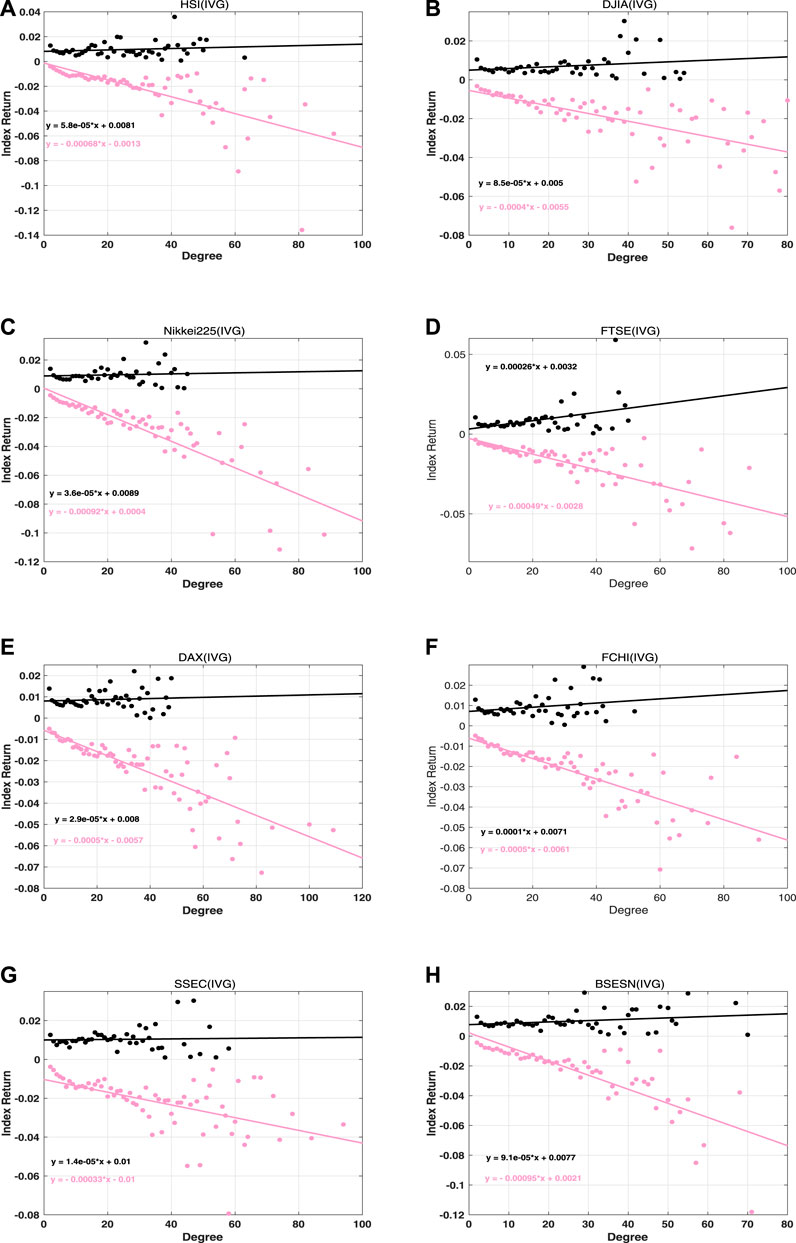
FIGURE 11. Conditional expected index returns based on the degree of rise and fall price motions in IVG networks for the eight stock indices. Red indicates a rise and black indicates a fall.
For concave price trajectories in Figure 10, stock indices can be classified into four categories. For category I, which includes the DAX and FCHI, the rise in absolute slope is almost the same as the fall in absolute slope, and both the rise and fall slopes are quite small. This implies that AR and DF are not the main forms in which these two stock markets exhibit bubbles and crashes. For category II, which includes the DJIA and FTSE, the absolute rise slope is far smaller than the fall slope. This suggests that it is possible for the price to decrease at a logarithmic fall rate after stock crashes in these two markets. For case III, which includes the HSI, SSEC, and BSESN, the absolute rise slope is larger than the fall slope. Obviously, these markets are likely to increase via a superexponential growth rate within bubble regimes. For case IV, which includes the Nikkei 225, the absolute rise slope and absolute fall slope are almost the same. However, their values are bigger than those noted in case I. This means that the Nikkei 225 rise and fall trajectories contain many concave motions in the bubble-and-crash regime. For the convex trajectories in Figure 11, the absolute fall slopes exceed the rise slopes for all of the stock indices. This implies that all of the markets crash at logarithmic rates. We also note that the FTSE and FCHI have rather large absolute rise slopes, which means that the price approaches the critical point in the DR way within the bubble regimes.
Overall, the findings in this section agree with the previous studies of gain-loss asymmetry [37–40]. In particular, stock market prices fall faster than they rise in developed countries. The analysis in this study provides a clearer picture regarding the conclusion made in Ref. [40] that the rise speed overtakes the fall speed in developing country stock markets, such as those of India and China. Indeed, the speed of AR price motion is larger than that of DF motion, while the speed of AF price motion exceeds that of DR motion, just as in mature markets.
5. Conclusion
In this paper, we developed a new concept of financial time series asymmetry based on the topological distinguishability of price motion trajectories. A new application of VGA and IVGA was developed to capture different types of price motion trajectories. Measures based on VGA and IVGA were employed to analyze asymmetry in price motion trajectories as well as in price motion speeds. To analyze topological asymmetry in price motion trajectories, we compared the distributions of concave and convex indicators for both rise and fall price motions. Deviations in rise and fall indicator distributions among VG and IVG networks showed that AR-DF and DR-AF stock index motions are asymmetric with each other. To investigate the influences of time scopes, the relation between KLD and time scope was also illustrated. Unlike with the random series, the KLD of stock index rise and fall indicator distributions is significant and the dependence of KLD on time scopes is strong. This is especially true for Indian and American stock indices.
Furthermore, we calculated the conditional expected index return on node degree to show asymmetry in price motion speeds. The rise and fall conditional expected index returns on VG or IVG network node degrees were distributed in an asymmetric manner, which indicates that asymmetry is embedded in AR-DF and DR-AF price motion speeds when the stock index approaches a bubble-and-crash regime shift. Our result was in line with gain-loss asymmetry overall. However, it offered details regarding why AF motions in emerging markets (e.g., China and India) contribute to faster rises and slower falls.
As a byproduct of this study, we also get some knowledge of the relationship between the topological symmetry and the time reversibility of a time series. By the definition of time reversibility, we proved, with an artificially combined piece of HSI time series, that the topologically symmetrical time series must be time-reversible. On the other hand, by checking the topological symmetry of a random series, the numerical evidence, which supports the postulation that a time-irreversible series must be topologically asymmetric, has also been found.
Future research will include exploration of topological asymmetry in other empirical data that exhibits chaotic behaviors, such as sunspots, heartbeats, and earthquake waves. The relation between topological symmetry and time reversibility is also to be investigated theoretically. Finally, the most important task is to explore how topological symmetry among financial time series affects the time reversibility. In this sense, we must study the network properties of VG and IVG networks and identify network characteristics right before large-scale price changes.
Data Availability Statement
The raw data supporting the conclusions of this article will be made available by the authors, without undue reservation, to any qualified researcher.
Author Contributions
RL and YC contributed to the conception of the study; RL performed the data analyses and wrote the article; CY helped perform the analysis with constructive discussions.
Conflict of Interest
The authors declare that the research was conducted in the absence of any commercial or financial relationships that could be construed as a potential conflict of interest.
Supplementary Material
The Supplementary Material for this article can be found online at: https://www.frontiersin.org/articles/10.3389/fphy.2020.539521/full#supplementary-material.
References
1. Zhang J, Small M. Complex network from pseudoperiodic time series: topology versus dynamics. Phys Rev Lett (2006). 96:238701. doi:10.1103/physrevlett.96.238701.
2. Zhang J, Luo X, Small M. Detecting chaos in pseudoperiodic time series without embedding. Phys Rev (2006). 73:016216. doi:10.1103/physreve.73.016216.
3. Zhang J, Sun J, Luo X, Zhang K, Nakamura T, Small M. Characterizing pseudoperiodic time series through the complex network approach. Phys Nonlinear Phenom (2008). 237:2856–65. doi:10.1016/j.physd.2008.05.008.
4. Xu X, Zhang J, Small M. Superfamily phenomena and motifs of networks induced from time series. Proc Natl Acad Sci Unit States Am (2008). 105:19601–5. doi:10.1073/pnas.0806082105.
5. Marwan N, Donges JF, Zou Y, Donner RV, Kurths J. Complex network approach for recurrence analysis of time series. Phys Lett A (2009). 373:4246–54. doi:10.1016/j.physleta.2009.09.042.
6. Donner RV, Zou Y, Donges JF, Marwan N, Kurths J. Recurrence networks—a novel paradigm for nonlinear time series analysis. New J Phys (2010). 12(3):033025. doi:10.1088/1367-2630/12/3/033025.
7. Donner RV, Zou Y, Donges JF, Marwan N, Kurths J. Ambiguities in recurrence-based complex network representations of time series. Phys Rev E (2010). 81:015101. doi:10.1103/physreve.81.015101.
8. Donner RV, Small M, Donges JF, Marwan N, Zou Y, Xiang R, et al. Recurrence-based time series analysis by means of complex network methods. Int J Bifurcation Chaos (2011). 21:1019–46. doi:10.1142/s0218127411029021.
9. Nicolis G, Cantu AG, Nicolis C. Dynamical aspects of interaction networks. Int J Bifurcation Chaos (2005). 15:3467–80. doi:10.1142/s0218127405014167.
10. McCullough M, Small M, Stemler T, Ho-Ching Iu H. Time lagged ordinal partition networks for capturing dynamics of continuous dynamical systems. Chaos (2015). 25:053101. doi:10.1063/1.4919075.
11. Nuñez AM, Lacasa L, Gomez JP, Luque B. Visibility algorithms: a short review. In: Y Zhang, editor. New frontiers in graph theory. Rijeka, Croatia: IntechOpen (2012). p. 119–52.
12. Lacasa L, Luque B, Ballesteros F, Luque J, Nuño JC. From time series to complex networks: the visibility graph. Proc Natl Acad Sci Unit States Am (2008). 105:4972–5. doi:10.1073/pnas.0709247105.
13. Lacasa L, Luque B, Luque J, Nuño JC. The visibility graph: a new method for estimating the Hurst exponent of fractional Brownian motion. Europhys Lett (2009). 86:30001. doi:10.1209/0295-5075/86/30001.
14. Luque B, Lacasa L, Ballesteros F, Luque J. Horizontal visibility graphs: exact results for random time series. Phys Rev E (2009). 80:046103. doi:10.1103/physreve.80.046103.
15. Lacasa L, Toral R. Description of stochastic and chaotic series using visibility graphs. Phys Rev E (2010). 82:036120. doi:10.1103/physreve.82.036120.
16. Bezsudnov IV, Snarskii AA. From the time series to the complex networks: the parametric natural visibility graph. Phys Stat Mech Appl (2014). 414:53–60. doi:10.1016/j.physa.2014.07.002.
17. Zhou T-T, Jin N-D, Gao Z-K, Luo Y-B. Limited penetrable visibility graph for establishing complex network from time series. Acta Phys Sin (2012). 61(3):030506. doi:10.7498/aps.61.030506.
18. Gao Z-K, Hu L-D, Zhou T-T, Jin N-D. Limited penetrable visibility graph from two-phase flow for investigating flow pattern dynamics. Acta Phys Sin (2013). 62(11):110507. doi:10.7498/aps.62.110507.
19. Stephen M, Gu C, Yang H. Visibility graph based time series analysis. PloS One (2015). 10:e0143015. doi:10.1371/journal.pone.0143015.
20. Vamvakaris MD, Pantelous AA, Zuev KM. Time series analysis of S&P 500 index: a horizontal visibility graph approach. Phys Stat Mech Appl (2018). 497:41–51. doi:10.1016/j.physa.2018.01.010.
21. Fan X, Li X, Yin J, Tian L, Liang J. Similarity and heterogeneity of price dynamics across China's regional carbon markets: a visibility graph network approach. Appl Energy (2019). 235:739–46. doi:10.1016/j.apenergy.2018.11.007.
22. Qian M-C, Jiang Z-Q, Zhou W-X. Universal and nonuniversal allometric scaling behaviors in the visibility graphs of world stock market indices. J Phys Math Theor (2010). 43:335002. doi:10.1088/1751-8113/43/33/335002.
23. Wang N, Dong L, Wang Q. Visibility graph analysis on quarterly macroeconomic series of China based on complex network theory. Phys Stat Mech Appl (2012). 391:6543–55. doi:10.1016/j.physa.2012.07.054.
24. Long Y. Visibility graph network analysis of gold price time series. Phys Stat Mech Appl (2013). 392:3374–84. doi:10.1016/j.physa.2013.03.063.
25. Yao C-zhong, Lin J-N. A visibility graph approach to CNY exchange rate networks and characteristic analysis. Discrete Dyn Nat Soc (2017). 2017:5632374. doi:10.1155/2017/5632374.
26. Zhang R, Ashuri B, Deng Y. A novel method for forecasting time series based on fuzzy logic and visibility graph. Adv Data Anal Classif (2017). 11:759–83. doi:10.1007/s11634-017-0300-3.
27. Liu C, Zhou W-X, Yuan W-K. Statistical properties of visibility graph of energy dissipation rates in three-dimensional fully developed turbulence. Phys Stat Mech Appl (2010). 389:2675–81. doi:10.1016/j.physa.2010.02.043.
28. Ni X-H, Jiang Z-Q, Zhou W-X. Degree distribution of the visibility graphs mapped from fractional Brownian motions and multifractal random walks. Phys Lett Sec A (2008). 373:3822. doi:10.1016/j.physleta.2009.08.041.
29. Liu C, Zhou W-X, Yuan W-K. Statistical properties of visibility graph of energy dissipation rates in three-dimensional fully developed turbulence. Physica A (2010). 389:2675–81. doi:10.1016/j.physa.2010.02.043.
30. Siven JV, Todd Lins J. Gain/loss asymmetry in time series of individual stock prices and its relationship to the leverage effect. Preprint repository name [Preprint] (2009). Available from: https://arxiv.org/abs/0911.4679
32. Yan J. Asymmetry, fat-tail, and autoregressive conditional density in financial return data with systems of frequency curves. Iowa City, Iowa: University of Iowa: Department of Statistics and Actuarial Science (2005). p. 26.
33. Verhoeven P, McAleer M. Fat tails and asymmetry in financial volatility models. Math Comput Simulat (2004). 64:351–61. doi:10.1016/s0378-4754(03)00101-0.
34. Jensen MH, Johansen A, Simonsen I. Inverse statistics in economics: the gain–loss asymmetry. Phys Stat Mech Appl (2003). 324(1-2):338–43. doi:10.1016/s0378-4371(02)01884-8.
35. Donangelo R, Jensen MH, Simonsen I, Sneppen K. Synchronization model for stock market asymmetry. J Stat Mech (2006). 11:L11001. doi:10.1088/1742-5468/2006/11/L11001.
36. Grudziecki M, Gnatowska E, Karpio K, Orłowski A, Załuska-Kotur M. New results on gain-loss asymmetry for stock markets time series. Acta Phys Pol (2008). 114:569. doi:10.12693/aphyspola.114.569.
37. Siven J, Lins J, Hansen J. A multiscale view on inverse statistics and gain/loss asymmetry in financial time series. J Stat Mech Theory Exp (2008). 2009:P02004. doi:10.1088/1742-5468/2009/02/P02004.
38. Zhou W-X, Yuan W-K. Inverse statistics in stock markets: universality and idiosyncracy. Phys Stat Mech Appl (2005). 353:433–44. doi:10.1016/j.physa.2005.02.011.
39. Chen H, Noronha G, Singal V. The price response to S&P 500 index additions and deletions: evidence of asymmetry and a new explanation. J Finance (2004). 59:1901–30. doi:10.1111/j.1540-6261.2004.00683.x.
40. Karpio K, Kotur M, Orłowski A. Gain–loss asymmetry for emerging stock markets. Phys Stat Mech Appl (2007). 375:599–604. doi:10.1016/j.physa.2006.10.003.
41. Bouchaud J-P, Matacz A, Potters M. Leverage effect in financial markets: the retarded volatility model. Phys Rev Lett (2001). 87:228701. doi:10.1103/PhysRevLett.87.228701.
42. Jiang X, Chen T, Zheng B. Time-reversal asymmetry in financial systems. Phys Stat Mech Appl (2013). 392:5369–75. doi:10.1016/j.physa.2013.07.006.
43. Yan W, Serooskerken E. Forecasting financial extremes: a network degree measure of super-exponential growth. PloS One (2015). 10:e0128908. doi:10.1371/journal.pone.0128908.
44. Lacasa L, Nuñez A, Roldán É, Parrondo JMR, Luque B. Time series irreversibility: a visibility graph approach. Eur Phys J B (2012). 85:217. doi:10.1140/epjb/e2012-20809-8.
45. Lacasa L, Ryan F. Time reversibility from visibility graphs of nonstationary processes. Phys Rev E (2015). 92:022817. doi:10.1103/PhysRevE.92.022817.
46. Flanagan R, Lacasa L. Irreversibility of financial time series: a graph-theoretical approach. Phys Lett A (2016). 380:1689–97. doi:10.1016/j.physleta.2016.03.011.
47. Xiong H, Shang P, Xia J, Wang J. Time irreversibility and intrinsics revealing of series with complex network approach. Phys Stat Mech Appl (2018). 499:241–9. doi:10.1016/j.physa.2018.02.041.
48. Wu Z, Shang P, Xiong H. An improvement of the measurement of time series irreversibility with visibility graph approach. Phys Stat Mech Appl (2018). 502:370–8. doi:10.1016/j.physa.2018.02.131.
49. Xie F, Fu Z, Piao L, Mao Z. Time irreversibility of mean temperature anomaly variations over China. Theor Appl Climatol (2016). 123:161–70. doi:10.1007/s00704-014-1347-0.
50. Vamvakaris MD, Pantelous AA, Zuev KM. Time series analysis of S&P 500 index: a horizontal visibility graph approach. Phys Stat Mech Appl (2018). 497:41–51. doi:10.1016/j.physa.2018.01.010.
51. Vamvakaris MD, Pantelous AA, Zuev. K. Investors’ behavior on S&P 500 index during periods of market crashes: a visibility graph approach. In: F Economou, K Gavriilidis, GN Gregoriou, V Kallinterakis, editors. Handbook of investors’ behavior during financial crises. San Diego, CA: Academic Press (2017). p. 401–17.
52. Kullback S, Leibler RA. On information and sufficiency. Ann Math Stat (1951). 22(1):79–86. doi:10.1214/aoms/1177729694.
53. Erven T, Harremoës P. R\'enyi divergence and kullback-leibler divergence (2012). Available from: https://arxiv.org/abs/1206.2459
54. Klebnikov S. Apple, Microsoft, Amazon, Google and Facebook make up a record chunk of the S&P 500. Here’s why that might be dangerous (2020). Available from: https://www.forbes.com/sites/sergeiklebnikov/2020/07/24/apple-microsoft-amazon-google-and-facebook-make-up-a-record-chunk-of-the-sp-500-heres-why-that-might-be-dangerous/#432d745a4f6b
55.Global Market Strategist for US Institutional Equities. How Apple and Microsoft could blow up the stock market (2019). Available from: https://edition.cnn.com/2019/11/01/investing/tech-stocks-faang/index.html
56. Derrick J. Why the Dow Jones industrial average owes Apple and Microsoft a big thanks (2019). Available from: https://finance.yahoo.com/news/why-dow-jones-industrial-average-183102086.html?soc_src=social-sh&soc_trk=ma.
Keywords: asymmetry, stock index, price motions, Kullback-Leibler divergence, visibility graph
Citation: Liu R and Chen Y (2020) Analysis of Stock Price Motion Asymmetry via Visibility-Graph Algorithm. Front. Phys. 8:539521. doi: 10.3389/fphy.2020.539521
Received: 01 March 2020; Accepted: 23 October 2020;
Published: 27 November 2020.
Edited by:
Wei-Xing Zhou, East China University of Science and Technology, ChinaReviewed by:
Huijie Yang, University of Shanghai for Science and Technology, ChinaYong Zou, East China Normal University, China
Copyright © 2020 Liu and Chen. This is an open-access article distributed under the terms of the Creative Commons Attribution License (CC BY). The use, distribution or reproduction in other forums is permitted, provided the original author(s) and the copyright owner(s) are credited and that the original publication in this journal is cited, in accordance with accepted academic practice. No use, distribution or reproduction is permitted which does not comply with these terms.
*Correspondence: Ruiyun Liu, cnkubGl1QHNjc2xhYi5rLnUtdG9reW8uYWMuanA=; Yu Chen, Y2hlbkBlZHUuay51LXRva3lvLmFjLmpw
 Ruiyun Liu
 Yu Chen
