 Areejit Samal
 Sunil Kumar
 Yasharth Yadav
 Anirban Chakraborti
- 1The Institute of Mathematical Sciences (IMSc), Homi Bhabha National Institute (HBNI), Chennai, India
- 2Department of Physics, Ramjas College, University of Delhi, New Delhi, India
- 3Indian Institute of Science Education and Research (IISER), Pune, India
- 4School of Computational and Integrative Sciences, Jawaharlal Nehru University, New Delhi, India
- 5Centre for Complexity Economics, Applied Spirituality and Public Policy, Jindal School of Government and Public Policy, O. P. Jindal Global University, Sonipat, India
- 6Centro Internacional de Ciencias, Cuernavaca, México
Over the last 2 decades, financial systems have been studied and analyzed from the perspective of complex networks, where the nodes and edges in the network represent the various financial components and the strengths of correlations between them. Here, we adopt a similar network-based approach to analyze the daily closing prices of 69 global financial market indices across 65 countries over a period of 2000–2014. We study the correlations among the indices by constructing threshold networks superimposed over minimum spanning trees at different time frames. We investigate the effect of critical events in financial markets (crashes and bubbles) on the interactions among the indices by performing both static and dynamic analyses of the correlations. We compare and contrast the structures of these networks during periods of crashes and bubbles, with respect to the normal periods in the market. In addition, we study the temporal evolution of traditional market indicators, various global network measures, and the recently developed edge-based curvature measures. We show that network-centric measures can be extremely useful in monitoring the fragility in the global financial market indices.
1 Introduction
It is possible to describe a financial market using the framework of complex networks such that the nodes in a network represent the financial components and an edge between any two components indicates an interaction between them. A correlation matrix constructed using the cross-correlations of fluctuations in prices can be utilized to identify such interactions. However, a network resulting from the correlation matrix contains densely connected structures. A growing amount of research is focused on methods devised to extract relevant correlations from the correlation matrix and study the topological, hierarchical, and clustering properties of the resulting networks. Mantegna et al. [1, 2] introduced the minimum spanning tree (MST) to extract networks from the correlation matrices computed from the asset returns. Dynamic asset trees, introduced by Onnela et al. [3, 4], were analyzed to monitor the evolution of financial stock markets using the hierarchical clustering properties of such trees. Boginski et al. [5] constructed threshold networks by extracting the edges with correlation values exceeding a chosen threshold and analyzed degree distribution, cliques, and independent sets on the threshold network. Tumminello et al. [6] introduced planar maximally filtered graph (PMFG) as a tool to extract important edges from the correlation matrix, which contains more information than the MST, while also preserving the hierarchical structure induced by MST. Triangular loops and four-element cliques in PMFG could provide considerable insights into the structure of financial markets.
Network-based analysis has been widely used to study not only particular stock market structures but also the complex networks of correlations among different financial market indices across the globe. For example, MST has been used on stock markets to detect underlying hierarchical organization [7–9]. Bonanno et al. [10] studied the correlations of 51 global financial indices and showed that the corresponding MST was clustered according to the geographical locations of the indices. In addition, the changes in the topological structure of MST could help understand the evolution of financial systems [11–13]. MST and threshold networks have been used to analyze the indices during the global financial crisis of 2008 [14–16]. It has also been shown that geography is one of the major factors which govern the hierarchy of the global market [17, 18]. Also, Eryǧit and Eryǧit [19] had investigated the temporal evolution of clustering networks (MST and PMFG) of 143 financial indices corresponding to 59 countries across the world from the period 1995–2008 and once again found that the clustering in the networks of financial indices was according to their geographical locations. From the time-dependent network and centrality measures, they showed that the integration of the global financial indices has increased with time. Further, Chen et al. [20] analyzed dynamics of threshold networks of regional and global financial markets from the period 2012–2018, proposed a model for the measurement of systemic risk based on network topology, and then concluded that network-based methods provide a more accurate measurement of systemic risk compared to the traditional absorption technique. Silva et al. [21] studied the average criticality of countries during different periods in the crisis and found that the United States is the most critical country, followed by European countries, Oceanian and Asian countries, and finally Latin American countries and Canada. They also found a decrease in the network fragility after the global financial crisis. It has been also shown that financial crises can be captured using networks of volatility spillovers [22, 23]. Wang et al. [24] constructed and analyzed the dynamical structure of MSTs and hierarchical trees computed from the Pearson correlations as well as partial correlations, among 57 global financial markets from the period 2005–2014, and concluded that MST based on partial correlations provided more information when compared to MST based on the Pearson correlations. The market indices from different stock markets across the globe comprise assets that are very different; apart from stocks of the big multinational companies that are traded across markets, the stock markets would have little in common and hence would be expected to behave independently, in contrary to the previously reported empirical observations.
In this brief research report, we study the evolution of correlation structures among 69 global financial indices through the years 2000–2014. To ensure that we consider only the most relevant correlations, we construct the network by creating an MST (which connects all the nodes) and then add extra edges from the correlation matrix exceeding a certain threshold, which gives modular structures. Our findings corroborate the earlier results of geographical clustering [17, 25]. We then study the changes occurring in the market by analyzing the fluctuations in various global network measures and the recently developed edge-based geometric measures. Since there are complex interactions that occur among groups of three or more nodes, which cannot be described simply by pairwise interactions, the higher-order architecture of complex financial systems captured by the geometrical measures can help us in the betterment of systemic risk estimation and give us an indication of the global market efficiency. To the best of our knowledge, the present work is the first investigation of discrete Ricci curvatures in networks of global market indices. Thus, we find that this approach along with all these network measures can be used to monitor the fragility of the global financial network and as indicators of crashes and bubbles occurring in the markets. This could in turn relate the health of the financial markets to the development or downturn of the global economy, as well as gauging the impact of certain market crises on the multilevel financial-economic phenomena.
2 Methods
2.1 Data Description
This study is based on a dataset collected from Bloomberg which comprises the daily closing prices of 69 global financial market indices from 65 countries, and this information was compiled for a period of T = 3,513 days over 14 years from January 11, 2000, to June 24, 2014. Note that the working days for different markets are not the same due to differences in holidays across countries. To overcome any inconsistencies due to this difference in working days, we filtered the data by removing days on which
2.2 Cross-correlation Matrix and Market Indicators
Given the daily closing price gj(t) for market index j on day t, wherein
where the mean and standard deviation are computed over a period of τ = 80 days with end date as t. We also construct the ultrametric distance matrix with elements
We have computed three market indicators from these correlation matrices. Firstly, the mean correlation gives the average of the correlations in the matrix Cτ(t). Secondly, we have computed the eigenentropy [26] which involves the calculation of the Shannon entropy using the eigenvector centralities of the correlation matrix Cτ(t) of market indices. Both mean correlation and eigenentropy have been shown to detect critical events in financial markets [26–28]. Thirdly, we have computed the risk corresponding to the Markowitz portfolio of the market indices, which is a proxy for the fragility or systemic risk of the global financial network [29]. A detailed description of the Markowitz portfolio optimization is given in the Supplementary Material.
2.3 Threshold Network Construction and Characteristics
The distance matrix for the time frame ending on t can be viewed as a complete, undirected, and weighted graph Dτ(t), where the element
Firstly, we have computed standard global network measures such as the number of edges, edge density, average degree, average weighted degree [31], average shortest path length, diameter, average clustering coefficient [32], modularity [33, 34], communication efficiency [35], global reaching centrality (GRC) [36], network entropy [37], global assortativity [38, 39], and clique number. Note that the chosen set of global network measures studied here are by no means exhaustive and also depend very much on the specific questions of interest; see, for example, Wang et al. [40] for several gravitational centrality measures. Secondly, we have also computed four edge-centric curvature measures, namely, Ollivier-Ricci (OR) curvature [29, 41, 42], Forman-Ricci (FR) curvature [42–45], Menger-Ricci (MR) curvature [46, 47], and Haantjes-Ricci (HR) curvature [46, 47]. A detailed description of these network measures along with the appropriate natural weight, strength, or distance to use in each case is included in the Supplementary Material.
2.4 Multidimensional Scaling Map
The multidimensional scaling (MDS) technique tries to embed N objects in high-dimensional space into a low-dimensional space (typically, 2 or 3 dimensions), while preserving the relative distance between pairs of objects [48]. Here, we construct the (average) correlation matrix
3 Results and Discussion
The primary goal of this investigation is to evaluate different network measures for their potential to serve as indicators of fragility or systemic risk and monitor the health of the global financial system. For this purpose, we compiled a dataset of the daily closing prices of 69 global financial market indices from 65 different countries for a 14-year period from 2000 to 2014 (Section 2). Thereafter, we use the time series of the logarithmic returns of the daily closing prices for 69 global market indices to compute the Pearson cross-correlation matrices Cτ(t) with a window size of τ = 80 days with an overlapping shift of ∆τ = 20 days, and ending on trading days t (Section 2). Subsequently, we employ a minimum spanning tree (MST) based approach to construct 172 threshold networks Sτ (t) corresponding to the cross-correlation matrices
We reiterate that the threshold networks Sτ(t) are constructed by computing the MST of the cross-correlation matrices Cτ(t) followed by the addition of edges with correlation
In Figures 1, 2 and Supplementary Figure S1, we show the temporal evolution of generic indicators and network measures in the threshold networks of global market indices over the 14-year period (2000–2014). Moreover, the four shaded regions in Figure 1 highlight four periods of the financial crisis, namely, US housing bubble, Lehman brothers crash, Dow Jones flash crash, and August 2011 stock markets fall. From Figure 1, it is seen that the mean correlation between market indices increases during periods of the financial crisis. Also, the eigenentropy which is directly computed from the correlation matrix Cτ(t) increases during the crisis. Earlier works have shown that mean correlation and eigenentropy are indicators of instabilities in the stock market network [26, 28], and we show here that these measures can also serve as indicators of crisis in the network of global financial indices. In Figure 1, we also show the temporal evolution of the minimum risk corresponding to the portfolio comprising the market indices using the Markowitz framework. Moving on to widely used network properties, it is seen that the number of edges, edge density, average degree, average weighted degree, clustering coefficient, communication efficiency, and network entropy increase while diameter, average shortest path length, and modularity decrease during periods of the financial crisis (Figure 1; Supplementary Figure S1). In Figure 1, we also show the evolution of two other network measures, global reaching centrality (GRC) and global assortativity. In Figure 2, we also visualize the threshold network at three distinct time windows of τ = 80 days ending on trading days t corresponding to August 4, 2005 (normal period), August 14, 2006 (US housing bubble crisis), and June 4, 2010 (Dow Jones flash crash), where the node colors are based on geographical regions of the market indices and edge colors are based on modules determined by Louvain method [34] for community detection. The identified communities in the three networks corresponding to the normal period, the US housing bubble, and the Dow Jones flash crash typically reflect the geographical proximity of financial market indices. For example, the indices of the United States, Canada, Mexico, Argentina, Brazil, and Chile form a single community in the threshold network for the normal period (Figure 2). It is evident that the number of edges in threshold networks corresponding to the US housing bubble (246 edges) or Dow Jones flash crash (390 edges) is much higher in comparison to that for the normal period (109 edges). In contrast, the modularity of threshold networks corresponding to the crisis periods, US housing bubble (0.418), or Dow Jones flash crash (0.232) is lower in comparison to that for normal period (0.508). In Figure 2, it is clearly seen that the clique number or size of the largest clique in threshold networks increases during financial crisis, and this is also evident from the network visualizations for normal period, US housing bubble, and Dow Jones flash crash. Note that bubbles are not easy to detect. In fact, our proposition is that holistic approaches with network measures, both node- and edge-based measures, including geometric curvatures, may help us to better detect and distinguish the bubbles from market crashes, as also pointed out in recent contributions [26, 49]. In sum, we find that during a normal period the network of global market indices is less connected, very modular, and heterogeneous, whereas, during a fragile period, the network is highly connected, less modular, and more homogeneous.
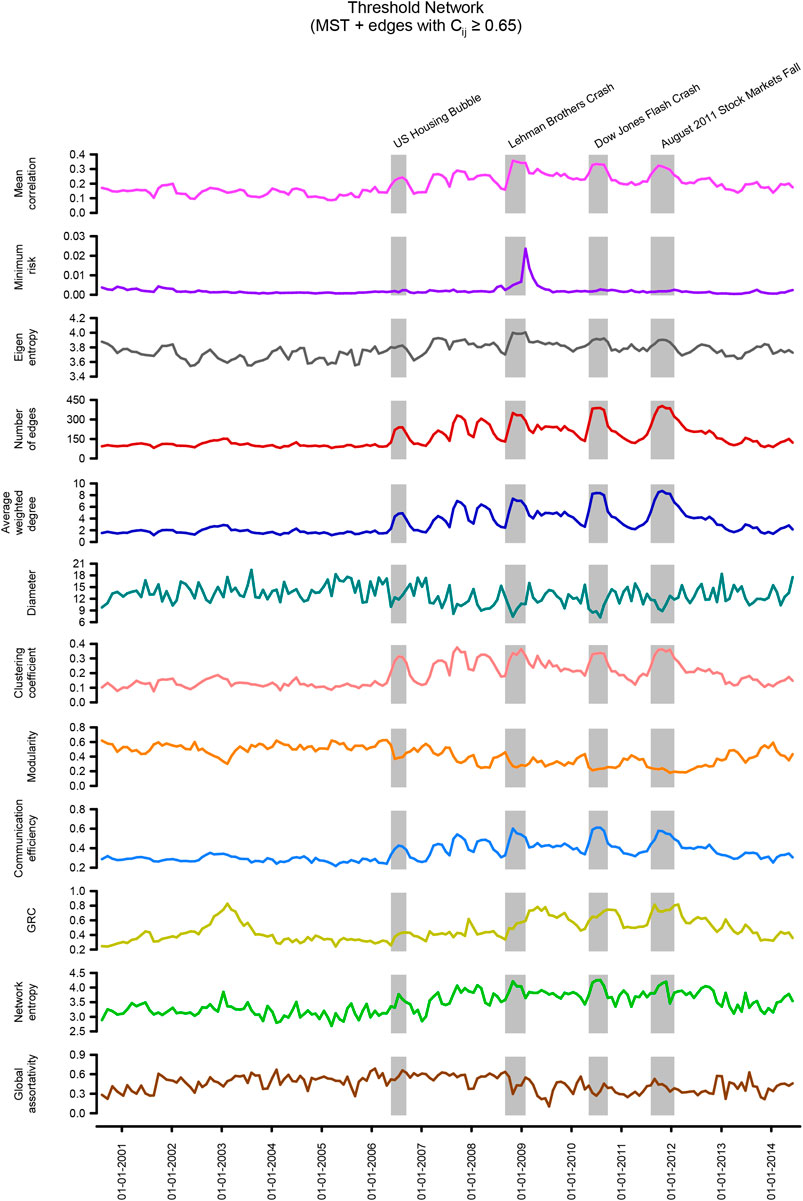
FIGURE 1. Evolution of generic indicators and network characteristics for the global market indices networks Sτ(t), constructed from the correlation matrices Cτ (t) of window size τ = 80 days and an overlapping shift of ∆τ = 20 days over a period of 14 years (2000–2014). The threshold networks Sτ(t) were constructed by adding edges with correlation
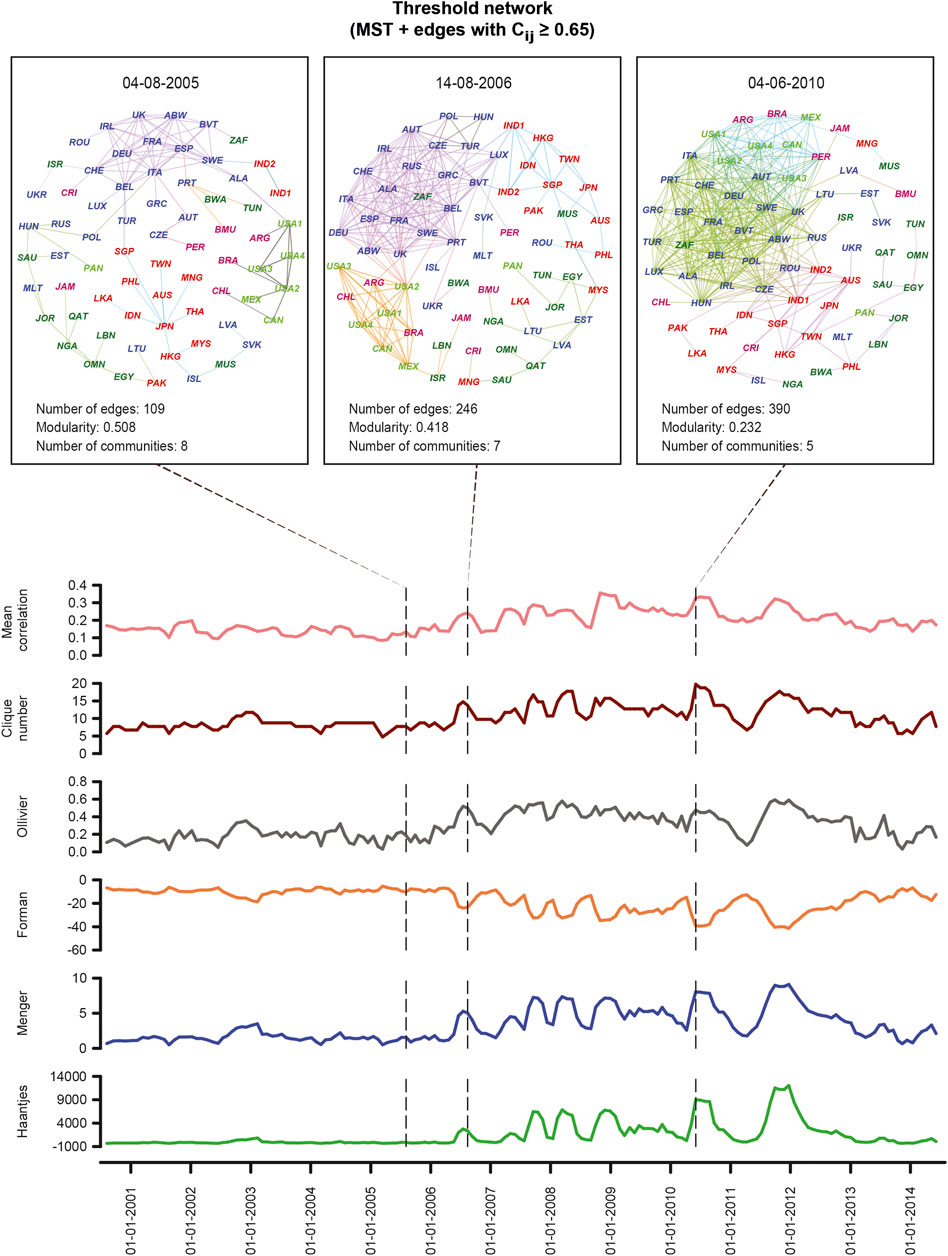
FIGURE 2. Evolution of network characteristics and visualization of the threshold networks Sτ (t) of market indices with a window size of τ = 80 days and an overlapping shift of ∆τ = 20 days, constructed by adding edges with correlation
In addition to the node-centric global network measures described in the preceding paragraph, we have also studied edge-centric network measures, specifically, four discrete Ricci curvatures [Olivier-Ricci (OR), Forman-Ricci (FR), Menger-Ricci (MR), and Haantjes-Ricci (HR)] in threshold networks of global market indices. From Figure 2, it is seen that the average OR, MR, or HR curvature of edges increases during crisis periods in comparison to normal periods. In contrast, the average FR curvature of edges decreases during crisis periods in comparison to the normal periods. Notably, Sandhu et al. [29] have shown that OR curvature can serve as an indicator of fragility in stock market networks. However, to our knowledge, the present work is the first investigation of discrete Ricci curvatures in networks of global market indices. Note that different discretizations of Ricci curvature do not capture the entire features of the classical definition for continuous spaces, and thus, the four discrete Ricci curvatures studied here can capture different aspects of analyzed networks [42]. Overall, our results suggest that discrete Ricci curvatures can serve as indicators of fragility and monitor the health of the global financial system.
In Figure 3, we show the correlation between generic market indicators and different characteristics of the threshold networks Sτ(t) of global market indices computed across the 14-year period from 2000 to 2014. From this figure, it is seen that eigenentropy and several network measures have a very high (absolute) Pearson correlation
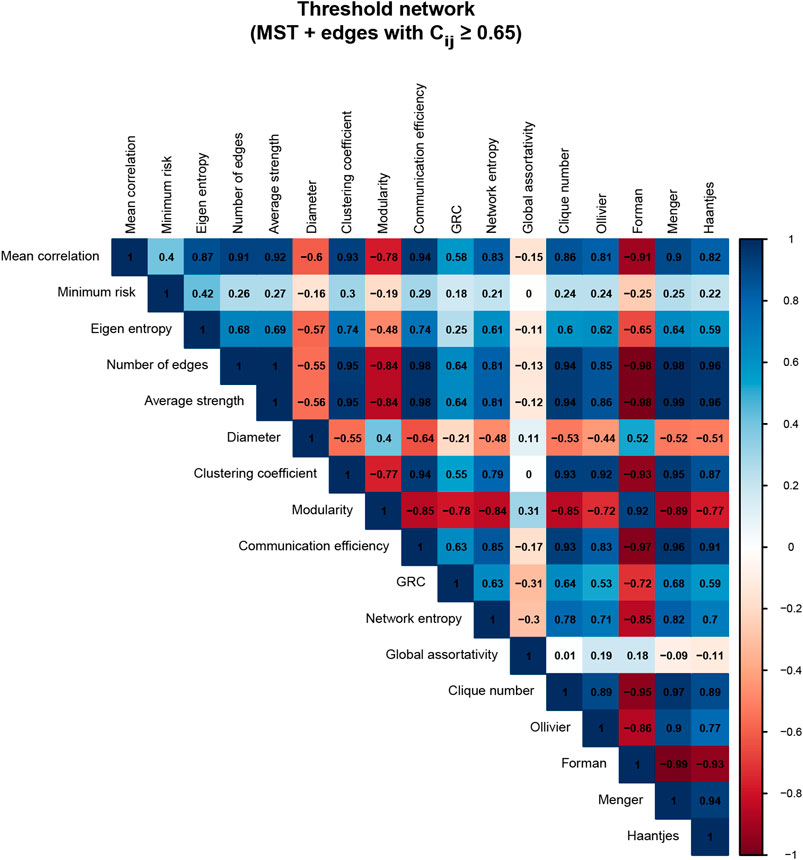
FIGURE 3. Correlations between generic indicators and network characteristics of the global market indices networks Sτ(t), constructed from the correlation matrices Cτ(t) of window size τ = 80 days and an overlapping shift of ∆τ = 20 days over a period of 14 years (2000–2014). The threshold networks Sτ(t) were constructed by adding edges with correlation
We must mention that though in the preceding paragraphs we have described only the results obtained from networks constructed using a threshold of 0.65, we have shown in Supplementary Figures S2–S9 that the qualitative conclusions remain unchanged even when networks with a threshold of 0.75 and 0.85 are considered. In other words, our results are robust to the choice of the threshold used to construct the networks of global market indices.
In previous works, the econophysics community has employed either minimum spanning tree (MST) [7, 9–13, 15, 19] or planar maximally filtered graph (PMFG) [12, 19] or threshold networks [11, 14, 20] to study the correlation structure between global financial market indices. As far as we know, this work is the first to use threshold networks of MST plus edges with a correlation higher than a specified threshold, to study the temporal evolution of relationships between global financial market indices. In contrast, such threshold networks based on MST have been used earlier to study the structure of stock market networks [29, 49]. While MST has a tree structure without loops or cycles, PMFG or threshold network permits loops or cycles. In Supplementary Text and Supplementary Figures S10–S13, we also display the temporal evolution and correlation between generic market indicators and network measures in PMFG of global market indices constructed from cross-correlation matrices Cτ(t). While the construction of PMFG unlike threshold networks is independent of any specific choice of the threshold, the number of edges (thus, edge density and average degree) is fixed in case of PMFG (Supplementary Figures S10, S11). Due to this reason, we find that most of the network measures studied here are not correlated with the generic market indicator, mean correlation of market indices, in the PMFG case (Supplementary Figure S13). Still, we find that average weighted degree (strength), clustering coefficient, and communication efficiency have a very high correlation with the mean correlation of market indices in PMFG-based networks (Supplementary Figure S13). Based on these results, the threshold network construction based on MST plus edges with high correlation seems to be a better framework to monitor the state of the global financial system.
Finally, we have also studied the average correlation structure between global market indices over the 14-year period by computing the correlation matrix CT between the 69 market indices by taking window size as the complete period of T days between 2000 and 2014 (Section 2). Subsequently, we have constructed a threshold network ST corresponding to CT by combining MST plus edges with a correlation above the chosen threshold of 0.65 (Section 2). In Figure 4A, we visualize this overall threshold network ST of market indices for the complete 14-year period of T days. In this figure, the node colors are based on geographical regions of the market indices and edge colors are based on communities obtained from the Louvain method. In Figure 4B, we have separated the communities in this overall threshold network ST of market indices by removing the intermodule edges in the visualization. From Figures 4A,B, it is clear that the market indices form communities in this overall threshold network based on their geographical proximity. Moreover, we have also employed multidimensional scaling (MDS) technique to map the 69 market indices into a 2-dimensional space such that the distances between pairs of indices are preserved (Figure 4C; Section 2). It can be seen that the MDS map is able to partition the 69 market indices into groups based on their geographical proximity, and further, the structure in the MDS map has a close resemblance to the community structure of the overall threshold network (Figure 4). For example, the grouping of indices from the United States, Canada, Mexico, Argentina, Brazil, and Chile can be seen in both the threshold network and MDS map (Figure 4). Interestingly, when we plotted in Supplementary Figure S14 the evolution of the eigenvector centralities of the nodes (market indices), as well as their OR and FR curvature, we found that there exist certain periods of time when some of the countries in close geographical proximity display high (absolute) values and others display low values, indicative of the changes in the complex interactions and community structures.
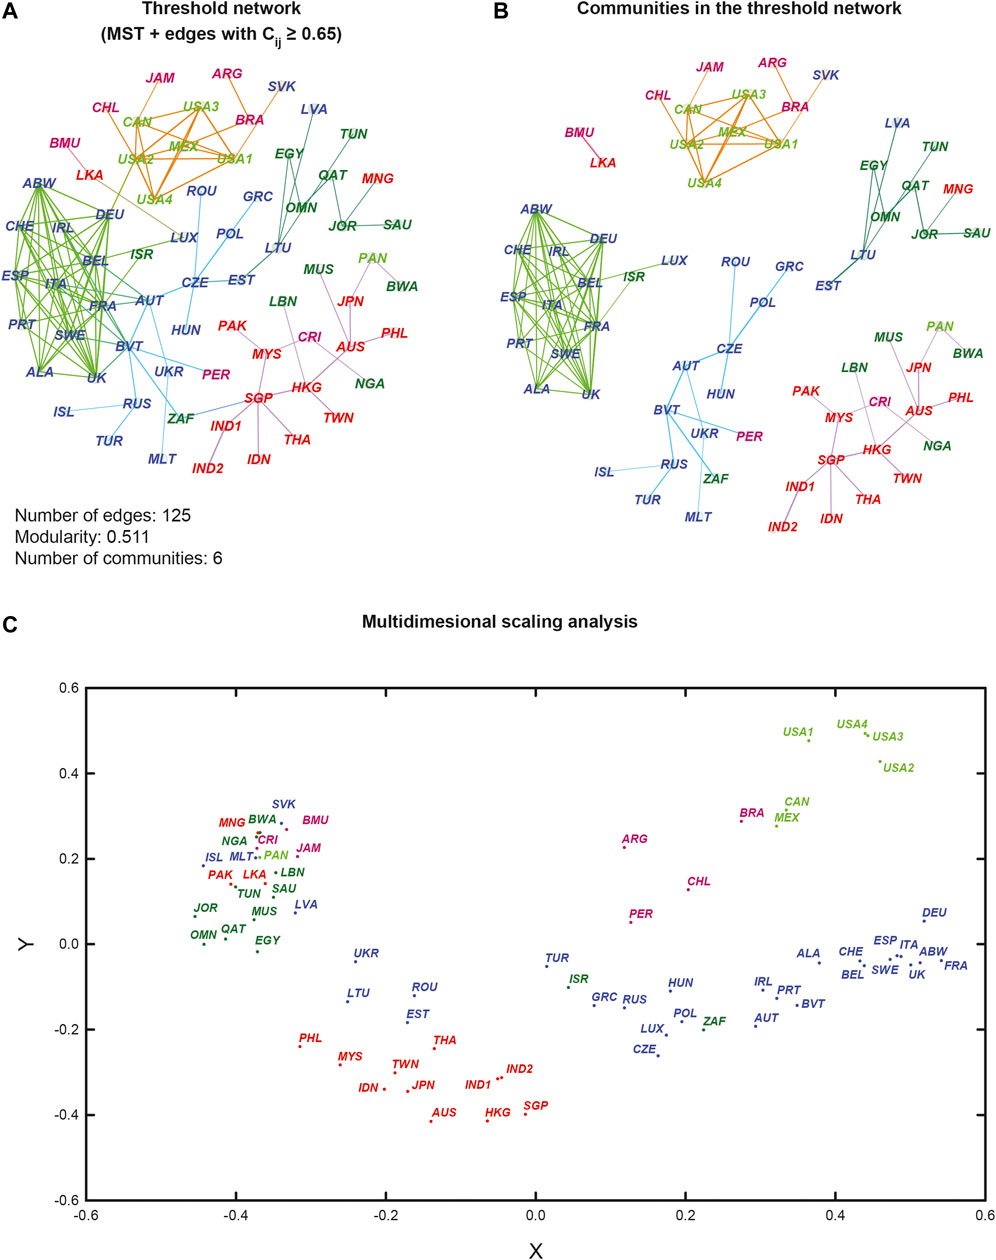
FIGURE 4. The average correlation structure between 69 market indices over the 14-year period is visualized based on the correlation matrix CT for the complete period of T = 3513 days between 2000 to 2014. (a) Visualization of the overall threshold network ST corresponding to CT obtained by combining MST plus edges with correlation ≥0.65. The node colours are based on geographical regions of the market indices and edge colours are based on communities obtained from Louvain method. (b) Visualization of the communities in the overall threshold network ST after removing the inter-module edges. It is evident that the market indices form communities in this network based on their geographical proximity. (c) Multidimensional scaling (MDS) map in 2-dimensions of the 69 market indices. In this figure, the indices are labelled in different colours based on their geographical region and country, respectively. The four USA market indices, NASDAQ, NYSE, RUSSELL1000 and SPX, are labelled as USA1, USA2, USA3 and USA4, respectively, while the two Indian indices, NIFTY and SENSEX30, are labelled as IND1 and IND2, respectively.
4 Summary and Concluding Remarks
In summary, we have investigated the daily closing prices of 69 global financial indices over a 14-year period using various techniques of cross-correlations based network analysis. We have been able to continuously monitor the complex interactions among the global market indices by using a variety of network-centric measures, including recently developed edge-centric discrete Ricci curvatures. In the present study of the global market indices, the novelty lies in the following: i) Construction of the threshold network Sτ(t), as superposition of the MST of the cross-correlation matrix and the network of edges with correlations
The global financial system has become increasingly complex and interdependent and thus prone to sudden unpredictable changes like market crises. Our results, compared to the traditional market indicators, do provide a deeper understanding of the system of global financial markets. Specially, we find that the four discrete Ricci curvatures can be effectively used as indicators of fragility in global financial markets. We reiterate that the methods used in this work can detect instabilities in the market and can be used as early warning signals so that policies can be made in order to prevent the occurrence of such events in the future.
Data Availability Statement
The data analyzed in this study are subject to the following licenses/restrictions. The codes used to construct the networks from correlation matrices and compute the different network measures are publicly available via the GitHub repository: https://github.com/asamallab/FinNetIndicators. The relevant correlation matrices constructed from proprietary data from Bloomberg are available upon reasonable requests. Requests to access these datasets should be directed to YW5pcmJhbkBqbnUuYWMuaW4=.
Author Contributions
AS, SK, and AC conceived the project. AS, SK, YY, and AC performed the computations. SK compiled the dataset. YY and AS prepared the figures and tables. AS and AC analyzed the results. AS, SK, YY, and AC wrote the manuscript. All authors have read and approved the manuscript.
Funding
We have received no specific research funding for this work. AS acknowledges financial support from Max Planck Society Germany through the award of a Max Planck Partner Group in Mathematical Biology and a Ramanujan fellowship (SB/S2/RJN006/2014) from the Science and Engineering Research Board (SERB), India.
Conflict of Interest
The authors declare that the research was conducted in the absence of any commercial or financial relationships that could be construed as a potential conflict of interest.
Acknowledgments
AC acknowledges support from the project UNAM-DGAPA-PAPIIT AG 100819 and CONACyT Project FRONTERAS 201.
Supplementary Material
The Supplementary Material for this article can be found online at: https://www.frontiersin.org/articles/10.3389/fphy.2020.624373/full#supplementary-material.
References
1. Mantegna RN. Information and hierarchical structure in financial markets. Comput Phys Commun. (1999) 121–122:153–6. doi:10.1016/S0010-4655(99)00302-1
2. Mantegna RN. Hierarchical structure in financial markets. Eur Phys J. (1999) 11:193–7. doi:10.1007/s100510050929
3. Onnela JP, Chakraborti A, Kaski K, Kertsz J, Kanto A. Asset trees and asset graphs in financial markets. Phys Scr. (2003) T106:48. doi:10.1238/physica.topical.106a00048
4. Onnela JP, Kaski K, Kertész J. Clustering and information in correlation based financial networks. Eur Phys J. (2004) 38:353–62. doi:10.1140/epjb/e2004-00128-7
5. Boginski V, Butenko S, Pardalos PM. Statistical analysis of financial networks. Comput Stat Data Anal. (2005) 48:431–43. doi:10.1016/j.csda.2004.02.004
6. Tumminello M, Aste T, Di Matteo T, Mantegna RN. A tool for filtering information in complex systems. Proc Natl Acad Sci USA. (2005) 102:10421–6. doi:10.1073/pnas.0500298102
7. Bonanno G, Caldarelli G, Lillo F, Mantegna RN. Topology of correlation-based minimal spanning trees in real and model markets. Phys Rev E. (2003) 68:046130. doi:10.1103/PhysRevE.68.046130
8. Onnela JP, Chakraborti A, Kaski K, Kertész J, Kanto A. Dynamics of market correlations: taxonomy and portfolio analysis. Phys Rev E. (2003) 68:056110. doi:10.1103/PhysRevE.68.056110
9. Bonanno G, Caldarelli G, Lillo F, Micciché S, Vandewalle N, Mantegna RN. Networks of equities in financial markets. Eur Phys J. (2004) 38:363–71. doi:10.1140/epjb/e2004-00129-6
10. Bonanno G, Vandewalle N, Mantegna RN. Taxonomy of stock market indices. Phys Rev E. (2000) 62:R7615–8. doi:10.1103/PhysRevE.62.R7615
11. Nobi A, Lee S, Kim DH, Lee JW. Correlation and network topologies in global and local stock indices. Phys Lett. (2014) 378:2482–9. doi:10.1016/j.physleta.2014.07.009
12. Wang J, He J. Correlation and interdependence structure in stock market: based on information theory and complex networks. 2017 17th international conference on control, automation and systems (ICCAS); 18–21 Oct 2017; Jeju, South Korea. IEEE (2017). 498–504. doi:10.23919/ICCAS.2017.8204288
13. Coelho R, Gilmore CG, Lucey B, Richmond P, Hutzler S. The evolution of interdependence in world equity markets—evidence from minimum spanning trees. Phys A. (2007) 376:455–66. doi:10.1016/j.physa.2006.10.045
14. Kumar S, Deo N. Correlation and network analysis of global financial indices. Phys Rev E. (2012) 86:026101. doi:10.1103/PhysRevE.86.026101
15. Junior L, Mullokandov A, Kenett D. Dependency relations among international stock market indices. J Risk Financ Manag. (2015) 8:227–65. doi:10.3390/jrfm8020227
16. Lee JW, Nobi A. State and network structures of stock markets around the global financial crisis. Comput Econ. (2018) 51:195–210. doi:10.1007/s10614-017-9672-x
17. León C, Kim G, Martínez C, Lee D. Equity markets’ clustering and the global financial crisis. Quant Finance. (2017) 17:1–18. doi:10.1080/14697688.2017.1357970
18. Saeedian M, Jamali T, Kamali MZ, Bayani H, Yasseri T, Jafari GR. Emergence of world-stock-market network. Phys A. (2019) 526:120792. doi:10.1016/j.physa.2019.04.028
19. Eryiğit M, Eryiğit R. Network structure of cross-correlations among the world market indices. Phys A. (2009) 388:3551–62. doi:10.1016/j.physa.2009.04.028
20. Chen L, Han Q, Qiao Z, Stanley HE. Correlation analysis and systemic risk measurement of regional, financial and global stock indices. Phys A. (2020) 542:122653. doi:10.1016/j.physa.2019.122653
21. Silva TC, de Souza SRS, Tabak BM. Structure and dynamics of the global financial network. Chaos Solitons Fractals. (2016) 88:218–34. doi:10.1016/j.chaos.2016.01.023
22. Baumohl E, Evžen Kocenda E, Lyocsa S, Vyrost T. Networks of volatility spillovers among stock markets. Phys A. (2018) 490:1555–74. doi:10.1016/j.physa.2017.08.123
23. Mensi W, Boubaker FZ, Al-Yahyaee KH, Kang SH. Dynamic volatility spillovers and connectedness between global, regional, and gipsi stock markets. Finance Res Lett. (2018) 25:230–8. doi:10.1016/j.frl.2017.10.032
24. Wang GJ, Xie C, Stanley HE. Correlation structure and evolution of world stock markets: evidence from pearson and partial correlation-based networks. Comput Econ. (2018) 51:607–35. doi:10.1007/s10614-016-9627-7
25. Sharma K, Chakrabarti AS, Chakraborti A. Multi-layered network structure: relationship between financial and macroeconomic dynamics. In: F Abergel, BK Chakrabarti, A Chakraborti, N Deo, and K Sharma, editors New perspectives and challenges in econophysics and sociophysics. Gewerbestr, Switzerland: Springer (2019). p 117–31. doi:10.1007/978-3-030-11364-3_9
26. Chakraborti A, Unni HN, Sharma K, Pharasi HK. Phase separation and scaling in correlation structures of financial markets. J Phys Complexity (2020) 2:015002. doi:10.1088/2632-072X/abbed1
27. Chakraborti A, Sharma K, Pharasi HK, Shuvo Bakar K, Das S, Seligman TH. Emerging spectra characterization of catastrophic instabilities in complex systems. New J Phys. (2020) 22:063043. doi:10.1088/1367-2630/ab90d4
28. Kukreti V, Pharasi HK, Gupta P, Kumar S. A perspective on correlation-based financial networks and entropy measures. Front Phys. (2020) 8:323. doi:10.3389/fphy.2020.00323
29. Sandhu RS, Georgiou TT, Tannenbaum AR. Ricci curvature: an economic indicator for market fragility and systemic risk. Sci Adv. (2016) 2:e1501495. doi:10.1126/sciadv.1501495
30. Prim RC. Shortest connection networks and some generalizations. Bell Syst Tech J (1957) 36:1389–401. doi:10.1002/j.1538-7305.1957.tb01515.x
31. Barrat A, Barthélemy M, Pastor-Satorras R, Vespignani A. The architecture of complex weighted networks. Proc Natl Acad Sci USA. (2004) 101:3747–52. doi:10.1073/pnas.0400087101
32. Onnela JP, Saramäki J, Kertész J, Kaski K. Intensity and coherence of motifs in weighted complex networks. Phys Rev E. (2005) 71:065103. doi:10.1103/PhysRevE.71.065103
33. Girvan M, Newman ME. Community structure in social and biological networks. Proc Natl Acad Sci USA. (2002) 99:7821–6. doi:10.1073/pnas.122653799
34. Blondel VD, Guillaume JL, Lambiotte R, Lefebvre E. Fast unfolding of communities in large networks. J Stat Mech Theor Exp. (2008) 2008:P10008. doi:10.1088/1742-5468/2008/10/P10008
35. Latora V, Marchiori M. Efficient behavior of small-world networks. Phys Rev Lett. (2001) 87:198701. doi:10.1103/PhysRevLett.87.198701
36. Mones E, Vicsek L, Vicsek T. Hierarchy measure for complex networks. PLos One (2012) 7:e33799. doi:10.1371/journal.pone.0033799
37. Solé RV, Valverde S. Information theory of complex networks: on evolution and architectural constraints. In: E Ben-Naim, H Frauenfelder, and Z Toroczkai, editors Complex networks. Berlin, Germany: Springer (2004). p 189–207. doi:10.1007/978-3-540-44485-5_9
38. Newman MEJ. Mixing patterns in networks. Phys Rev E. (2003) 67:026126. doi:10.1103/PhysRevE.67.026126
39. Leung CC, Chau H. Weighted assortative and disassortative networks model. Phys Stat Mech Appl. (2007) 378:591–602. doi:10.1016/j.physa.2006.12.022
40. Wang J, Li C, Xia C. Improved centrality indicators to characterize the nodal spreading capability in complex networks. Appl Math Comput. (2018) 334:388–400. doi:10.1016/j.amc.2018.04.028
41. Ollivier Y. Ricci curvature of metric spaces. Compt Rendus Math. (2007) 345:643–6. doi:10.1016/j.crma.2007.10.041
42. Samal A, Sreejith RP, Gu J, Liu S, Saucan E, Jost J. Comparative analysis of two discretizations of Ricci curvature for complex networks. Sci Rep. (2018) 8:8650. doi:10.1038/s41598-018-27001-3
43. Forman R. Bochner’s method for cell complexes and combinatorial Ricci curvature. Discrete Comput Geom. (2003) 29:323–74. doi:10.1007/s00454-002-0743-x
44. Sreejith RP, Mohanraj K, Jost J, Saucan E, Samal A. Forman curvature for complex networks. J Stat Mech Theor Exp. (2016) 2016:P063206. doi:10.1088/1742-5468/2016/06/063206
45. Saucan E, Sreejith RP, Vivek-Ananth RP, Jost J, Samal A. Discrete Ricci curvatures for directed networks. Chaos Solitons Fractals. (2019) 118:347–60. doi:10.1016/j.chaos.2018.11.031
46. Saucan E, Samal A, Jost J. A simple differential geometry for networks and its generalizations. In: H Cherifi, S Gaito, JF Mendes, E Moro, and LM Rocha, editors International conference on complex networks and their applications. Gewerbestr, Switzerland: Springer (2019b). p 943–54. doi:10.1007/978-3-030-36687-2_78
47. Saucan E, Samal A, Jost J. A simple differential geometry for complex networks. Network Sci. (2020). 1–28. doi:10.1017/nws.2020.42
48. Borg I, Groenen PJF. Modern multidimensional scaling: theory and applications. New York, NY: Springer Science & Business Media (2005).
49. Samal A, Pharasi HK, Ramaia SJ, Kannan H, Saucan E, Jost J, et al. Network geometry and market instability. R Soc Open Sci (2021). 8:201734. doi:10.1098/rsos.201734
Keywords: econophysics, correlation, networks, minimum spanning tree, market index
Citation: Samal A, Kumar S, Yadav Y and Chakraborti A (2021) Network-centric Indicators for Fragility in Global Financial Indices. Front. Phys. 8:624373. doi: 10.3389/fphy.2020.624373
Received: 31 October 2020; Accepted: 21 December 2020;
Published: 12 February 2021.
Edited by:
Mahdi Jalili, RMIT University, AustraliaReviewed by:
Gholamreza Jafari, Shahid Beheshti University, IranChengyi Xia, Tianjin University of Technology, China
Copyright © 2021 Samal, Kumar, Yadav and Chakraborti. This is an open-access article distributed under the terms of the Creative Commons Attribution License (CC BY). The use, distribution or reproduction in other forums is permitted, provided the original author(s) and the copyright owner(s) are credited and that the original publication in this journal is cited, in accordance with accepted academic practice. No use, distribution or reproduction is permitted which does not comply with these terms.
*Correspondence: Areejit Samal, YXNhbWFsQGltc2MucmVzLmlu; Anirban Chakraborti, YW5pcmJhbkBqbnUuYWMuaW4=