 Antonio Cobarrubia
 Jarod Tall
 Austin Crispin-Smith1,2
 Antoni Luque
- 1Viral Information Institute, San Diego State University, San Diego, CA, United States
- 2Department of Physics, San Diego State University, San Diego, CA, United States
- 3Department of Physics and Astronomy, Washington State University, Pullman, WA, United States
- 4Department of Mathematics and Statistics, San Diego State University, San Diego, CA, United States
- 5Computational Science Research Center, San Diego State University, San Diego, CA, United States
Mucus is a complex fluid that coats multiple organs in animals. Various physicochemical properties can alter the diffusion of microscopic particles in mucus, impacting drug delivery, virus infection, and disease development. The simultaneous effect of these physicochemical properties in particle diffusion, however, remains elusive. Here, we analyzed 106 published experiments to identify the most dominant factors controlling particle diffusion in mucus. The effective diffusion—defined using a one-second sampling time window across experiments—spanned seven orders of magnitude, from 10–5 to 102 μm2/s. Univariate and multivariate statistical analyses identified the anomalous exponent (the logarithmic slope of the mean-squared displacement) as the strongest predictor of effective diffusion, revealing an exponential relationship that explained 89% of the variance. A theoretical scaling analysis revealed that a stronger correlation of the anomalous exponent over the generalized diffusion constant occurs for sampling times two orders of magnitude larger than the characteristic molecular (or local) displacement time. This result predicts that at these timescales, the molecular properties controlling the anomalous exponent, like particle–mucus unbinding times or the particle to mesh size ratio, would be the most relevant physicochemical factors involved in passive microrheology of particles in mucus. Our findings contrast with the fact that only one-third of the studies measured the anomalous exponent, and most experiments did not report the associated molecular properties predicted to dominate the motion of particles in mucus. The theoretical foundation of our work can be extrapolated to other systems, providing a guide to identify dominant molecular mechanisms regulating the mobility of particles in mucus and other polymeric fluids.
Introduction
Mucus is a complex fluid secreted by animals [1,2]. It protects organs against the invasion of pathogens and promotes the interaction with commensal microbes [3–5]. The diffusivity of particles in mucus is paramount for animal health. The infectivity of animal viruses, like HIV, decreases when their diffusion in mucus is impeded [6]. On the flip side, enhancing the diffusivity of biomolecules in mucus facilitates the delivery of medical drugs in the body [7], and reducing the diffusivity of commensal viruses that infect bacteria in the gut can increase their infectivity and protection against pathogens [8,9]. Multiple factors modify the diffusivity of particles in mucus, including particle size [7,10], particle charge and ionic strength [11–15], pH [1,6,14,16,17], and the concentration and polymeric organization of the characteristic glycoproteins in mucus called mucins [9]. However, the combined effect of these physicochemical factors controlling particle diffusion in mucus remains puzzling.
Small biomolecules and biomolecular complexes tend to diffuse more readily through mucus, while larger particles are caught in the mucin network [7,10]. On the other hand, nonadhesive polystyrene particles with a diameter of 500 nm diffuse faster than smaller particles (200 nm) of the same type [18]. These contrasting results highlight the major impact of parameters other than size in particle diffusion in mucus. In fact, neutrally charged particles display higher diffusivity in mucus than charged particles of the same size with a net negative charge [11–15]. An increase in salt concentration shields charged particles, leading to diffusivities similar to neutrally charged particles [12–14]. Low pH increases the distribution of negative charges in mucins and alters mucus' viscoelasticity, reducing the diffusivity of most particles [1,6,14,16,17]. Low pH also thickens mucus, reducing the diffusion and infection rate of viruses like HIV [6]. Interaction with mucins also alters the diffusivity of particles in mucus. Commensal viruses that infect bacteria and reside in the gut display immunoglobulin-like domains that are attracted to mucins. This interaction reduces their diffusivity and increases their infectivity against bacteria [8,9]. Some of these observations may seem contradictory. However, the fact that mucus has been selected across animals suggests that there could be a more comprehensive emerging effect when these different physiochemical factors are combined [19].
To tackle this problem, we performed a meta-analysis of published experimental data measuring the passive diffusion of microscopic particles in mucus. The correlation between physicochemical properties and particle diffusion in mucus was investigated using univariate and multivariate correlation methods. A theoretical scaling analysis was applied to derive a theoretical framework justifying the empirical results. This framework provided a quantitative understanding of the regulation and control of particle diffusion in mucus and other hydrogels. Our findings predict an effective particle size (and diffusion threshold) where the anomalous exponent becomes dominant, anomalous exponent values for experiments that did not measure it, and molecular factors associated with the anomalous exponent that were not reported in most experiments but should be paramount to understand particle diffusion in mucus.
Materials and Methods
The GitHub repository https://github.com/luquelab/Cobarrubia_etal_FrontPhys_2021 contains the codes and instructions necessary to implement the methods and replicate the research.
Data Extraction
We screened 24 published articles reporting diffusion of particles in mucus or mucus-like hydrogels (Supplementary Data S1). Ten studies contained diffusion data for microscopic, spherical particles that could be compared at the same sampling time window [6,9,11,14,17,18,20–23]. WebPlotDigitizer [24] was used to extract 106 measurements of effective diffusion, Deff, measured at a time window of one second, Δteff = 1 s, that is,
where,
here, Dα is the generalized diffusion and Δt is the sampling time window [27–29]. It is important to note that subdiffusion is predicted to be a transient regime in viscoelastic fluids [30]; at very short timescales, particles' motion is dominated by a ballistic motion and by non-anomalous diffusion at long timescales. Nonetheless, subdiffusion is a relevant phenomenon observed in mucus and other polymeric fluids at a range of timescales important in biological systems, from milliseconds to days [7,31,32]. The experiments analyzed in this study fall within this time window where subdiffusion can be important.
Some references shared measured diffusion relative to particle diffusion in water; in these cases, the particle diffusion in water was inferred applying the Stokes-Einstein equation, using the reported temperature and hydrodynamic particle diameter [33]. It is worth noting that the Stokes–Einstein relation was used only to infer particle diffusion in water. Particle diffusion in mucus is better described using the generalized diffusion equation due to mucus' viscoelastic properties [1]. However, neither the Stokes–Einstein relation nor the generalized diffusion equation was applied to obtain the particle's effective diffusion in mucus. All the diffusion values in mucus were empirical and independent of theoretical assumptions regarding the generalized diffusion equation. The particle types were defined as a qualitative measure of particle-mucin bonds: COOH (carboxylated), pegylated (PEG), virus, amine, antibody/protein, or chitosan. The full data set containing the measurements collected in all experiments is available in Supplementary Data S2.
The dominant mucin composition from each mucus source was obtained by evaluating the expression levels of mucin genes from the genome bioinformatics portal Ensembl [34]. Mucins were identified assuming the tissue/organ associated with each mucus or closely associated tissues. Expression levels were collected by taking the average of the reported median of transcript per million (TPM) RNA sequence and the most explicitly stated low, medium, and high expression levels. Based on potential gene expression of mucins with reported levels below the cutoff, TPM measuring below the minimum (0.05 TPM) was distinguished from experiments with no data due to possible gene expression. Low, medium, and high expression levels were obtained over reports of below cutoff in the same tissue. The dominant mucin was determined by the highest expression level, and then, if necessary, by the highest average of median TPM. Identification of mucin expression based on tissues was associated with each mucus: human respiratory mucus and human cystic fibrosis mucus were associated with the human lung mucin genes; human cervical mucus and cervicovaginal mucus were associated with human cervix or uterus mucin genes; pig intestinal mucus was originally from the jejunum part of the small intestine; however, due to a lack of reports for jejunum tissue, the associated mucin genes were taken as the average of the median of TPM of pig duodenum and pig ileum parts of the small intestine based on the close proximity to the jejunum; pig ileum intestinal mucus was associated with ileum tissue mucin genes; pig gastric mucus was collected from pig stomach mucin genes. Supplementary Data S3 contains the full data set obtained from the bioinformatic analysis.
Statistical Analysis
The multivariate analysis was performed using the nonparametric statistical method random forest, estimating permutation p-values in R, using the rfpermute package [35]. Random forest is a statistical learning method that relies on generating an average ensemble of random decision trees [36]. Here, the effective diffusion was used as the supervised variable for the regression of the random forest algorithm using the rest of the variables as inputs. The mean-squared error (%MSE) was used to identify the importance of each variable as a predictor. The selection of the most relevant variables was obtained by applying random forest in two consecutive rounds, discarding the variables that were not statistically significant in each round (p-value > 0.05). The average percentage increase of the mean-squared error (%MSE) was obtained by investigating permutations of three variables at a time. These permutations assessed if the p-value obtained was robust.
The single-variable correlation analysis was performed using the nonparametric Spearman’s correlation coefficient and parametric linear regressions minimized by the least-squares method. The effective diffusion was used as the predicted variable and compared with all the other variables as predictors. The linear regressions explored logarithmic and non-logarithmic scales for both the predictor and predicted variables. The values of the best fit in the linear regression provided an average response and were compared with the mid-values from the measured physical factors for consistency.
Theoretical Analysis
A scaling ansatz was applied to the subdiffusion equation, Eq. 2, to extract the explicit dependence on the anomalous diffusion α. This theoretical analysis assumed that the microscopic motion of a particle was associated with a characteristic molecular mobility timescale, tD, and displacement scale, LD. This first-order approximation aimed to identify the scaling relationship between the generalized diffusion coefficient and these microscopic observables. The rationale and explicit derivation of this theoretical analysis are included in the Results section. Logarithmic derivatives of the effective diffusion were calculated to estimate the impact of each of these three physical parameters—α, tD, and LD—in the rate of change of the effective diffusion. This determined the threshold condition where the anomalous diffusion, α, was predicted to dominate statistically over the other factors. This theoretical prediction was compared with the empirical values obtained from the empirical statistical analysis.
Results
Particles' Effective Diffusion in Mucus Spanned Seven Orders of Magnitude
The microscopic particles studied had diameters, d, covering three orders of magnitude, from 1 to 1,300 nm, and they displayed an effective diffusion spanning seven orders of magnitude, from 10–2 μm2/s to 105 μm2/s (see Table 1 and Supplementary Data S2). The anomalous exponent, α, ranged from strongly subdiffusive (α ≈ 0.1) to purely diffusive (α ≈ 1), but it was obtained only from a third of the data set (n = 39; 37%). The zeta potential, ζ, measured the effective surface charge of particles in solution [37]. The values ranged from −70 mV to +40 mV and were obtained for half of the data set (n = 57; 52%). The temperature range was narrow, 295–310 K. The pH ranged from mildly acidic (pH = 3.0) to slightly alkaline (pH = 7.4); however, most particle types were measured at a fixed pH (Supplementary Data S2). A third of the experiments had been conducted in artificial mucus-like hydrogels. The rest of the experiments had been conducted in mucus from four sources: human respiratory, human cervix, pig gastric, and pig intestines. The dominant mucins were MUC2 (n = 59; pig intestines and pig stomach sources), MUC5B (n = 30; human cervix source), and MUC5AC (n = 14; human lung source). See Supplementary Data S3 for the extended outputs of the dominant mucin analysis.
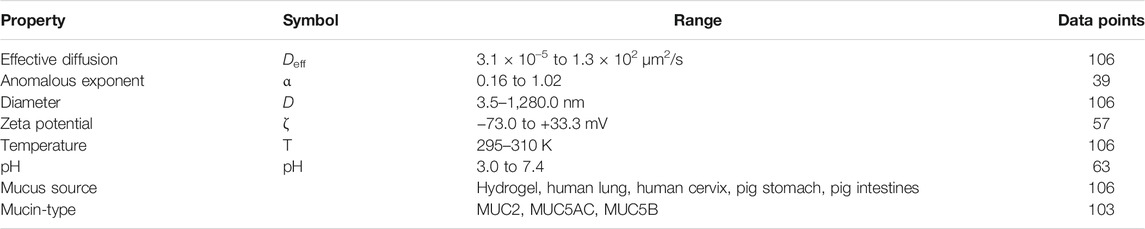
TABLE 1. Summary of empirical data. The effective diffusion, Deff, was obtained for a common time window of 1 s.
The Anomalous Exponent Displayed the Strongest Correlation With the Effective Diffusion
The random forest analysis selected five significant variables affecting the effective diffusion (window sampling time 1 s), Deff (Figure 1). The anomalous diffusion exponent, α, was the most relevant variable predicting effective diffusion in the random forest model, with an average percentage increase in the mean-squared error (%MSE) of 22 (±3)% (std. dev.) (p-value = 0.0099). The second most relevant variable was particle type with 19 (±7)% in %MSE, followed by zeta potential with 15 (±5)%, mucus source with 13 (±7)%, and dominant mucin with 10 (±8)%.
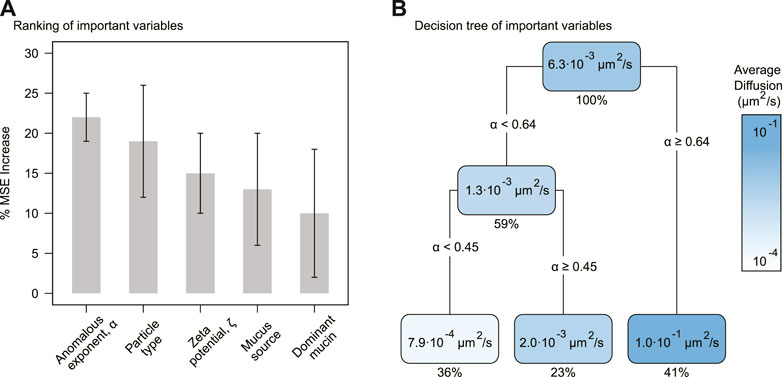
FIGURE 1. Selected variables impacting effective diffusion. (A) Average percentage increase of mean-squared error (% MSE) for the selected variables. The error bars correspond to the standard deviation. (B) Decision tree for the most important variables. Each node contains the predicted average Deff and the percentage of data predicted. The gradient display diffusion values from ∼ 10–4 μm2/s (white) to ∼ 10–1 μm2/s (blue).
When analyzing the selected variables individually, the anomalous diffusion exponent, α, displayed a significantly stronger correlation with the effective diffusion, Deff, than the other variables. The nonparametric Spearman correlation was ρ = 0.93 (p-value < 2.0 × 10⁻¹⁶, n = 39) (Supplementary Table S1). The second strongest individual variable was the negative zeta potential, ζ < 0 (ρ = 0.6, p-value = 0.0002, n = 36). See Supplementary Table S1 for the outputs of all correlations.
The effective diffusion, Deff, increased exponentially with α (Figure 2A). The linear regression for the semi-logged data (log-linear axes) explained 89% of the variance (log 10Deff = a α + b, a = 5.3 ± 0.3, b = −5.0 ± 0.2, R2 = 0.89). The anomalous exponent was extracted for 37% (n = 39) of the data, in particular, carboxylated, PEG, and viral particles. The inverse statistical model was fitted to this data set (α = a′ log 10Deff + b′, a′ = 0.17 ± 0.01, b′ = 0.92 ± 0.02, R2 = 0.88, n = 39) to estimate the mean value of α for the remaining 63% (n = 67) of the data, corresponding to amine, chitosan, antibodies, and protein particles (Figure 2B). Particles with effective diffusion above Deff > 3.5 μm2/s (n = 21) were predicted to display regular diffusion (α = 1); none of the particles analyzed self-propelled, and thus, superdiffusion (α > 1) was discarded. The majority of particles displaying regular diffusion (α ≈ 1) corresponded to human proteins (n = 18) and two viruses, Norwalk virus and human papilloma virus (HPV).
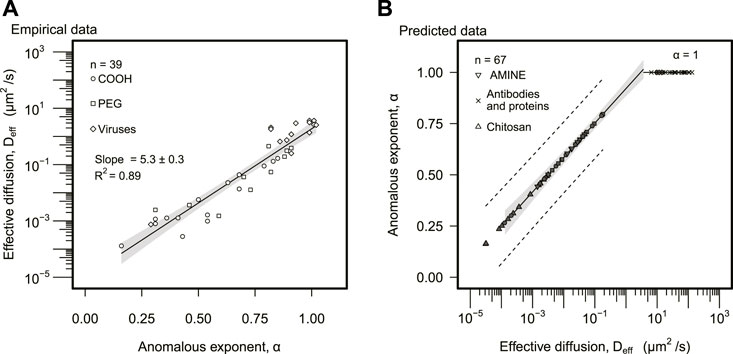
FIGURE 2. Effective diffusion and anomalous exponent analysis. (A) Effective diffusion was plotted as a function of the anomalous exponent. The solid line represents the regression model. The gray area represents the 95% confidence interval. Statistically significant slope and R2 of linear regression are displayed. (B) The anomalous exponent was predicted based on the model found empirically in (A). The solid line designates the predicted linear model. The gray area represents the 95% confidence interval of the predicted linear model. The dashed line represents a 95% prediction interval (A,B), distinguished particle types are represented in the legend of both panels.
The Anomalous Exponent’s Correlation Is Significant at Timescales Two Orders of Magnitude Larger Than the Microscopic Displacement Time
To elucidate the physical origin of the dominance of the anomalous exponent, α, its relationship with the effective diffusion, Deff, was derived from Eqs 1, 2:
Deff displays an explicit exponential dependency with α in the factor
The units of Dα depend on α, Eq. 2. In our study, these were μm2/sα. Like any other physical quantity, α has an associated uncertainty (error or standard deviation) [39]. Thus, the units of Dα are uncertain. In other words, the generalized diffusion coefficient is not a measurable physical quantity. The fact that Dα is not a physical quantity has been previously overlooked and mandates a revision of the classic subdiffusion equation, Eq. 2.
To reformulate the subdiffusion equation, the following ansatz was introduced. It was assumed that the particle diffusion emerges as the stochastic repetition of a particle's local physical motion with a characteristic displacement, LD. This displacement is the consequence of a velocity, vD, propelling the particle during a characteristic time, tD:
This is a general formulation independent of the underlying physical mechanism responsible for the particle's mobility. Other characteristic scales might play a role in the anomalous exponent, α, as exemplified in the Discussion section. This led to the following relationship:
This ansatz was combined with the classic subdiffusion equation, Eq. 2, obtaining:
This reformulated subdiffusion equation is valid for time windows, Δt, larger than the characteristic mobility timescale, tD, that is, Δt ≫ tD. For smaller time windows, the underlying mobility mechanism will dominate, requiring a different formulation for the displacement [38].
The reformulated subdiffusion equation, Eq. 6, was combined with the definition of the effective diffusion, Eq. 1, obtaining:
The effective diffusion, thus, depends exponentially on the anomalous diffusion exponent, α, justifying the empirical relationship observed for the effective diffusion of particles in mucus (Figure 2A). The characteristic displacement, LD, and timescale, tD, depend on the specific physical mechanism responsible for the diffusion. Therefore, experiments using different particles and mucus properties are expected to introduce a variance in these two magnitudes, justifying the data dispersion in Figure 2A.
To determine the conditions that select α over LD and tD as the parameter with the strongest correlation with Deff across multiple scales, the logarithm of Eq. 3 was investigated as follows:
For a fix time window, Δteff, the rate of change of Deff with respect to α is
The impact of LD and tD was evaluated using the logarithms of LD and tD to obtain results valid across scales and independent of measuring units, respectively,
and
The change with respect to the length scale, LD, was constant and equal to 2, Eq. 10. The change with respect to the timescale, tD, was smaller than 1 in absolute value, Eq. 11, because the anomalous exponent had an upper limit of 1, α ≤ 1 (in the experiments analyzed, there were no self-propelled particles or active transport mechanisms that could display superdiffusion). Eqs. 9–11 predict that the anomalous diffusion is the physical parameter with the strongest correlation in determining the rate of change in the effective diffusion:
for sampling time windows two orders of magnitude larger than the characteristic mobility timescale:
This result applies to any physical system as far as the diffusion is the consequence of a local characteristic physical motion.
The Theoretical Ansatz Is Consistent With the Statistical Analysis
The predictions from the reformulated subdiffusion equation were investigated for particle diffusion in mucus data. The slope and intercept obtained from the linear regression in Figure 2A were interpreted with respect to Eq. 8. The values of the best fit represent an average response and were compared to the mid-values from the physicochemical factors to test the consistency of the ansatz, Eq. 5. The mean characteristic length and timescales obtained statistically were LD ≈ 3 nm and tD ≈ 5 µs, respectively. The sampling time window was Δteff = 1 s. Therefore, Δteff/tD ≈ 106 ≫ 102, satisfying the inequality establishing the condition for the strong correlation of the anomalous diffusion exponent, Eq. 13. This implies that the experimental conditions investigating particle diffusion in mucus were on the regime where the anomalous exponent, α, was predicted theoretically to be the dominant factor determining the particle's effective diffusion, Deff, Eq. 13.
To further confirm the consistency of the theoretical framework with the empirical data, it was necessary to justify that the mean values obtained from the linear regression of Eq. 8, that is, LD ≈ 3 nm and tD ≈ 5 µs, were physically sound. Regardless of the physicochemical factors in mucus controlling α, one expects a local displacement caused by a tangible physical mechanism associated with a characteristic velocity vD and a finite timescale tD, Eq. 4. In all experiments analyzed, the particles were passive, and mucus was not forced externally to generate and active transport. It is reasonable to assume that most particles in the experiments acquired their transient velocity from absorbing kinetic energy from the water molecules in mucus, leading to the characteristic velocity
Particles Larger Than 100 nm are More Sensitive to Anomalous Diffusion
Particle size, d, was not selected as a significant predictor in the random forest analysis (Figure 1A). However, the anomalous exponent analysis predicted that a certain group of particles would display regular diffusion (Figure 2B). This suggested that particle size could have an important indirect role in the effective diffusion. In fact, the analysis of Deff as a function of d displayed a clear threshold around d⋆ ∼ 100 nm (Figure 3A). Larger particles, d > 100 nm, displayed a lower effective diffusion, Deff, although with no apparent statistical correlation with size (Spearman correlation ρ = − 0.24, p-value = 0.19). Smaller particles, d < 100 nm, displayed an effective diffusion with a significant statistical correlation (Figure 3A). The slope for the log–log data was m = −2.2 ± 0.3 (R2 − 0.67), that is, the effective diffusion displayed apparently a power law of order 2 with particle size, Deff ∼ 1/d2. Thus, diffusion overall decreased with particle size much rapidly than in regular diffusion, which is consistent with viscoelastic effects. However, a subset of particles (n = 21) diffused normally (α = 1) in Figure 2B, displaying an effective diffusion inversely proportional to particle size with a power function exponent m = − 1.0 ± 0.1 (p-value = 1.4 × 10⁻⁷, R2 = 0.77) (Figure 3A). This empirical scaling, Deff ∼ 1/d, is expected for particles displaying regular diffusion, in agreement with the anomalous exponent prediction in Figure 2B. A similar analysis was performed comparing the rescaled effective diffusion by particle size, Deff d, as a function of particle size, d. As expected, the particles predicted to display regular diffusion had slope zero, and the conclusions of the analysis were analogous (Supplementary Figure S1). Statistically, the analysis of Deff was preferred over Deff d because the use of d as input and output in Supplementary Figure S1 can introduce biases and increase uncertainty.
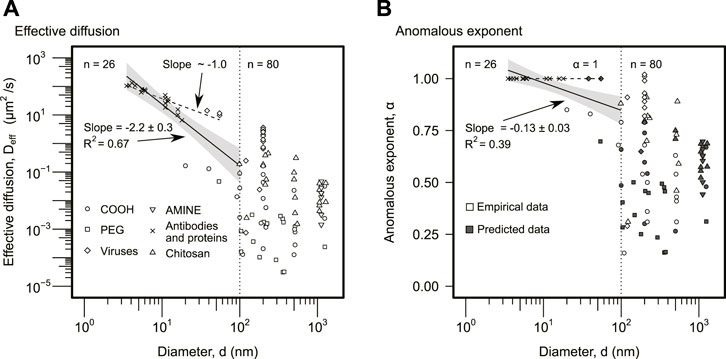
FIGURE 3. Particle size analysis. (A) The effective diffusion was plotted against particle size, d. The different symbols correspond to different particle types as indicated in the legend. The solid line indicates the linear regression for d < 100 nm particles using log–log data (n = 26), and it displays the slope and coefficient of determination, R2. The gray area represents the 95% confidence interval. The group of particles with d > 100 nm (n = 80) did not display a statistically significant relationship, and no solid line is included. The dashed line corresponds to the linear regression of the subset of particles (n = 21) displaying regular diffusion, α = 1, in Figure 2B, using the log–log data. The slope was approximately 1 as expected (slope = − 1.0 ± 0.1, p-value = 1.4 ⋅ 10–7, R2 = 0.77). (B) The anomalous exponent was plotted as a function of the particle size. The symbols and lines are analogous to panel (A). As in panel (A), the solid line is the regression for the particles with d < 100 (n = 26), while the dashed line represents the subset (n = 21) predicted to display regular diffusion, α = 1. Empty symbols anomalous exponents obtained empirically. The solid symbols correspond to the predicted anomalous exponents for the subset of data that did not include empirical values. The predictions were obtained using the model derived from Figure 2B.
Most Parameters Reported Display Weak Correlations With the Effective Diffusion
The other four variables selected in the random forest analysis (Figure 1), that is, particle type, particle charge, mucin source, and mucin-type, displayed weak correlations or no apparent correlations with Deff as single predictors (Supplementary Table S1).
Particle Type
Particle type was selected as the second most relevant variable to predict the effective diffusion based on the random forest analysis (Figure 1). Comparing the effective diffusion for the different particles confirmed this prediction (Supplementary Figure S2A). Antibodies and proteins displayed the fastest effective diffusion with a median of 48.9 μm2/s. Viruses were the second fastest group with a mean effective diffusion of an order of magnitude smaller, 3.5 μm2/s. PEG and amine particles formed the third group. They displayed statistically similar effective diffusion with medians 0.99 μm2/s and 2 × 10⁻² μm2/s. This was followed by carboxylated particles, median 3 × 10⁻² μm2/s, and finally chitosan 4 × 10⁻³ μm2/s. Differences in particle size could explain the reduction in effective diffusion for antibodies/proteins, viruses, and PEG particles (Supplementary Figure S2B). They had median sizes of ∼ 10, ∼ 100, and ∼ 1,000 nm, respectively. It is unclear what were the physicochemical factors behind the slower diffusion of amine, COOH, and chitosan particles (Supplementary Figure S2).
Particle Charge
The third predictor for effective diffusion was particle charge, expressed as the zeta potential ζ (Figure 1). Particles with negative zeta potential displayed a positive correlation with the effective diffusion, with a Spearman correlation of ρ = 0.6 (p = 0.002, n = 36) (Figure 4A). The relationship was approximated by an exponential function, Deff ∼ 10mζ. The potential rate was m = (0.024 ± 0.006) mV−1 (p = 0.0002) obtained from a least-square linear regression using the log-linear data. This exponential model accounted for 30% of the variance (R2 = 0.30). The largest effective diffusions were achieved at neutral zeta potentials. Positive zeta potentials (n = 21) had lower values but did not display a statistically significant correlation for the effective diffusion. Particle size or other properties did not seem to explain the trend observed for negatively charged zeta potentials (Supplementary Figure S3). These particles, however, displayed a linear positive correlation with the anomalous diffusion (Figure 4B).
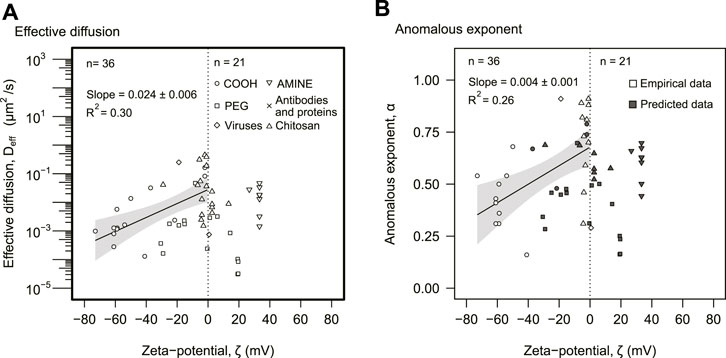
FIGURE 4. Electrostatic analysis. (A) The effective diffusion was plotted against zeta potential. (B) The anomalous exponent was plotted as a function of zeta potential. (A,B) The distinction between empirical and predicted data as well as particle types is represented in the legend. The dotted line indicates ζ = 0. The solid lines correspond to statistically significant linear regressions. The gray areas represent 95% confidence intervals of the linear regression. The slopes and R2 of each linear regression are also displayed in the panels.
Mucus Source
The mucus source and dominant mucin were the last two significant predictors of effective diffusion (Figure 1). The effective diffusion was faster in human cervix samples with a median ∼ 10 μm2/s, although the values spanned six orders of magnitude, from ∼ 10–4 to ∼ 102 μm2/s (Supplementary Figure S4). The effective diffusion was the slowest in mucus from the human lung (median ∼ 10–2 μm2/s) and pig intestine (median ∼ 10–2 μm2/s). The median particle size in empirical data from human cervix mucus was more than an order of magnitude smaller, ∼ 10 nm, than for the empirical data from the other sources. The median pH for the empirical data from human cervix mucus has significantly lower pHs (median 5.5) compared to the other sources (median 7). Lower pH tends to thicken mucus [41], thus expecting a slower effective diffusion. But the particle size may have offset this trend. The transcription analysis identified MUC5B, which is dominant in the human cervix, displaying the largest effective diffusion (median ∼ 10 μm2/s) compared to the other dominant mucins: MUC2 common in intestinal mucus (median diffusion ∼ 10–1 μm2/s) and MUC5AC common in respiratory mucus (median diffusion ∼ 10–2 μm2/s) (Supplementary Figure S4).
Discussion
The meta-analysis of particle diffusion in mucus revealed that diffusion of microscopic particles spanned seven orders of magnitude in passive conditions (no self-propulsion or active mucus transport) (Table 1). The anomalous diffusion exponent, α, was the factor displaying the strongest correlation with the effective diffusion, Deff (Figure 1). Statistically, the effective diffusion displayed an exponential dependence with respect to the anomalous diffusion, explaining 89% of the variance in the data (Figure 2A). This result was based on 39 out of 106 experiments (about a third), which had measured the anomalous exponent. Among the remaining 67 experiments, our statistical model predicts that the anomalous exponent was dominant in determining the effective diffusion in 46 of these experiments, that is, 69% of them (Figure 2B). In the other 21 experiments, the model predicts that particles followed regular diffusion, that is, the anomalous exponent would have no power predicting the change in the effective diffusion (Figure 2B). Therefore, the anomalous exponent was a strong predictor of the effective diffusion in 80% of all experiments analyzed. The anomalous exponent is an emerging property, and this result offers the opportunity to compare the diffusion of particles subjected to different molecular mechanisms. It is puzzling, however, that only a third of the experiments measured the anomalous exponent. One possible explanation is the fact that the anomalous exponent is a well-known emerging property, but the relationship between this exponent and the underlying molecular factors determining its value is not that established in the field yet [26]. Below, we argue that investigating the molecular basis of the anomalous exponent is the key to characterizing and controlling particle diffusion in mucus and other polymeric fluids at relevant biological timescales.
The theoretical scaling analysis of subdiffusion identified that the anomalous diffusion exponent, α, displays a stronger correlation over other physical factors when the diffusion is characterized at sampling times two orders of magnitude larger than the microscopic timescale fueling the diffusive motion, Eqs 13, 12. In our analysis, the experiments focused on passive diffusion conditions, but the principles behind the theoretical scaling can be expanded to situations with motile particles as well as energetically active mucus transport. The theoretical derivation just assumes that there is a characteristic timescale and length scale governing the particle's local motion. For the experiments analyzed here, the kinetic energy and viscosity of the fluid were assumed to be associated with the particle's local motion and were used to investigate the consistency with the theory. But in other contexts, the same analysis can be applied to replace the dependency of the characteristic scales with other mechanisms. For example, if particles run and tumble, like the bacterium Escherichia coli, the transient velocity of the particle depends on the viscosity and concentration of the polymeric network and food sources instead of the kinetic energy [42,43]. The scaling analysis is also consistent with the generalized diffusion equation in complex fluids, which extends the Stokes-Einstein relation to viscoelastic fluids [1]. In this case, the characteristic length and timescales would incorporate the elastic effects of the network. The role of the general characteristic scales in the revised diffusion equation, Eq. 6, aimed to accommodate a diverse set of scenarios. Additionally, it solved the issue of relying on the generalized diffusion constant, which has undefined physical units and is not strictly a well-defined physical magnitude, Eq. 5. The theoretical and empirical analyses presented here highlights the dominance of the anomalous diffusion exponent in determining the range of effective diffusions.
Thus, the problem now translates into identifying the factors that determine the anomalous diffusion exponent. These physical factors depend on the underlying mechanism responsible for the subdiffusion [28]. This is particularly relevant to understand the emergence of the critical particle size d⋆ ∼ 100 nm in Figure 3. This critical value may represent the particle size's onset when the effects of the mucus mesh become relevant. Most experiments analyzed did not report the mucus mesh size, but the critical size observed was consistent with mesh sizes measured in mucus samples, which ranged from 100 to 400 nm [1,44–47]. For particles with sizes similar to or larger than this mesh size, the theoretical description of the molecular displacement, LD, should include the effects of the mesh size. If the mesh hinders mobility, this will lead to a reduction of the average molecular displacement. If the mesh streamlines the mobility, then the molecular displacement could increase; for example, changes in the chemical coating of relatively large particles (200–500 nm) compared to the critical size, d⋆ ∼ 100 nm, can display larger diffusivities in mucus than in water [18]. The key point is that for particles larger than 100 nm, the impact of the mesh size in particle diffusivity will be very diverse. In each case, it is necessary to assess the underlying molecular mechanism responsible for the anomalous diffusion to identify the key physical factors governing the diffusivity. We have clarified this below for two mechanisms that may play an important role in mucus. First, microscopic particles can bind to mucin fibers leading to subdiffusion [9]. Second, mucin fibers form a polymeric mesh that can trap particles as observed in other hydrogels [48]. These two scenarios are particularly relevant in passive conditions. Scenarios involving the activation of the mucus network via cilia or peristalsis are also of interest but fall beyond the scope of this work.
Binding to mucins does not necessarily lead to subdiffusion. If a particle has a single binding site, the characteristic binding time tb would dilate the characteristic time to estimate the diffusivity of the particle, tD ∼ tr + tb, where tr is the relaxation time. The microscopic diffusion would be
The microenvironment trapping mechanism was observed in F-actin networks, where microscopic tracers were shown to follow anomalous diffusion [48]. The anomalous exponent was a linear function of the ratio between the particle size (d) and the network's mesh size (ξ). The empirical dependency obtained was α ≈ 1 for d/ξ < 0.1, α ≈ − 1.25 d/ξ + 1.38 for 0.1 < d/ξ < 1.1, and α ≈ 0.1 for d/ξ > 1.1. Thus, particles with sizes about 10% of the mesh size or smaller diffused normally, while particles with a size similar or larger to the mesh displayed a reduced diffusivity with a low anomalous exponent. The specific parameters of the relationship were not derived, but one would expect similar behavior in mucus. The average mucus in humans has a typical mesh size between 100 and 1,000 nm [7]. In this mechanism, d/ξ controls α, becoming the most important factor determining Deff. This could explain the threshold observed on the effective diffusion as a function of the particle size (Figure 3A). Larger particles, d > 100 nm, displayed lower effective diffusions, Deff, although with no apparent statistical correlation. The variation of α, from 0.15 to 1, could be due to a change in the mesh size (ξ). Unfortunately, the mesh size (or a proxy, like the concentration of mucins) was not measured or reported in most experiments analyzed here.
The two mechanisms discussed above could also help interpret the statistically significant correlations obtained between the effective diffusion and the surface charge of particles (Figure 4). Given the negative charge of mucin fibers, a particle with a larger negative charge would display a larger effective radius within the mucin network. This would increase the particle size to network mesh ratio, thus, reducing the anomalous exponent and, consequently, the particle's diffusivity. This scenario would explain the statistical trends observed for the effective diffusion and anomalous exponent for negative zeta potentials (Figure 4). However, one cannot discard other scenarios. For example, negatively charged carboxylated particles competing for cations at high densities can expose hydrophobic regions in mucus, leading mucus fibers to form bundles [6,18]. This might be a less likely but still plausible scenario. For positively charged particles, the particle-mucin binding mechanism could be responsible for the relatively low anomalous exponents observed. The framework explored here suggests that measuring the particle–mucin binding times and mucin mesh size would help disentangle the variance in the data. This framework should also apply to other polymeric fluids. It has been observed, for example, that particles of 1 μm (1,000 nm) display subdiffusion and trapping in biofilms in the timescale of days, and 0.5 μm (500 nm) particles display lower mean-squared displacement in regions of higher effective cross-linking [32]. These observations were done on the timescale of days. These results resonate with our finding that particles larger than 100 nm in mucus are very sensitive to subdiffusion behavior and trapping. It would be necessary to characterize systematically particle-binding to polymer fibers, polymer mesh sizes, and timescales to compare, extrapolate, and unify results across different polymeric fluid systems.
Some of the weak and highly dispersed correlations analyzed above might be obscured due to the combined effect of multiple variables, for example, particle charge and pH [51]. Unfortunately, at a given particle chemistry and zeta potential (charge), most particle diffusion measurements were reported at a fixed pH (Supplementary Data S2). Thus, the data analyzed posed an intrinsic limitation to disentangle the convoluted effects of charge and pH on particle diffusion. The impact of mucin-type, mucin–mucin interactions, and mucin concentration can also depend on pH. Low pH alters the molecular structure of mucins from a random coil to extended conformations, facilitating cross-linking and transitioning to a mucus solid-gel phase [52]. However, these key physicochemical mucus properties were difficult to extract from most experiments analyzed.
In any case, our results indicate a common approach to investigate these co-dependent properties on particle diffusion: measuring the anomalous exponent and establishing the underlying mechanism responsible for it. The physical factors controlling the anomalous exponent will be the dominant factors in particle diffusion. The theory introduced here is based on a generic ansatz that represents a first approximation. More refined theoretical approaches will be necessary to identify correction factors associated with specific underlying molecular mechanisms. One possible direction would be adapting the continuum models that characterize polymer fluids as viscoelastic Maxwell fluids [1,30,31,53]. In the presence of viscous delays incorporated with the Basset force term, these models predict an emerging subdiffusive transient region at timescales of milliseconds [31]. That timescale is much shorter than the one investigated here (above seconds) and that subdiffusion does not emerge from the molecular mechanisms (particle–mucus interaction mechanism and the caging effect) identified here as relevant in mucus. Incorporating the molecular characteristics of these two mechanisms in Maxwell fluids would offer a more sophisticated framework to predict particle diffusion in mucus.
In conclusion, our meta-analysis revealed that the anomalous exponent displays the strongest correlation with the effective diffusion of particles in mucus compared to other commonly measured factors. It explained almost 90% of the variance of diffusions across seven orders of magnitude. Our theoretical scaling analysis justified this observation assuming the characteristic displacement length and time of the local physical motion. This led to a reformulated subdiffusion equation in terms of these characteristic scales of the underlying mobility mechanism, and it demonstrated that the widely accepted generalized diffusion constant is not a measurable physical quantity. The theoretical analysis predicted that the anomalous exponent determines the order of magnitude of the effective diffusion for sampling time windows two orders of magnitude larger than the microscopic mobility timescale. This prediction applied to any physical system and was consistent with the data from particles diffusing in mucus. Our theoretical analysis indicates that the factors regulating the anomalous exponent are essential to characterize the diffusion of particles. At least two of these factors can control the anomalous exponent in mucus: the distribution of particle–mucin binding times and the particle size-to-mucin mesh ratio. These factors regulate the anomalous exponent and, subsequently, the effective diffusion of microscopic particles. However, these key properties were not reported in most experiments analyzed. Therefore, our study provides a guide on how to characterize, study, and modify the diffusion of particles in mucus and other hydrogels.
Data Availability Statement
The original contributions presented in the study are included in the article/Supplementary Material, further inquiries can be directed to the corresponding author.
Author Contributions
AC, JT, and AC-S collected published data on mucus, carried the meta-analysis, crafted the figures, and drafted the manuscript. AL. designed the research approach, supervised the collection of data and analysis, developed the theoretical analysis, and edited the manuscript.
Conflict of Interest
The authors declare that the research was conducted in the absence of any commercial or financial relationships that could be construed as a potential conflict of interest.
Publisher’s Note
All claims expressed in this article are solely those of the authors and do not necessarily represent those of their affiliated organizations, or those of the publisher, the editors, and the reviewers. Any product that may be evaluated in this article, or claim that may be made by its manufacturer, is not guaranteed or endorsed by the publisher.
Acknowledgments
This manuscript was originally released as a pre-print at bioRxiv [54]. The original contributions presented in the study are included in the article and supplementary material. Further inquiries can be directed to the corresponding author. We thank the Biomath Working Group at San Diego State University for their feedback during the development of the project, and we would like to make a special mention of the insightful comments from Professors Parag Katira and Arlette Baljon. AL acknowledges the support received by the New Investigator Award from the California State University (CSU) Program For Education and Research in Biotechnology (CSUPERB), the CSU Faculty Innovation and Leadership Award, and the National Science Foundation Award 1951678 from the Mathematical Biology Program.
Supplementary Material
The Supplementary Material for this article can be found online at: https://www.frontiersin.org/articles/10.3389/fphy.2021.594306/full#supplementary-material
References
1. Spagnolie S. Complex Fluids in Biological Systems experiment, Theory and Computation. New York: Springer (2015).
2. Krajina BA, Tropini C, Zhu A, DiGiacomo P, Sonnenburg JL, Heilshorn SC, et al. Dynamic Light Scattering Microrheology Reveals Multiscale Viscoelasticity of Polymer Gels and Precious Biological Materials. ACS Cent Sci (2017) 3:1294–303. doi:10.1021/acscentsci.7b00449
3. Bäckhed F, Ley RE, Sonnenburg JL, Peterson DA, Gordon JI. Science (2005) 307:1915. doi:10.1126/science.1104816
4. Bakshani CR, Morales-Garcia AL, Althanus M, Wilcox MD, Pearson JP, Bythell JC, et al. NPJ Biofilms Microbiomes (2018) 4:1–14. doi:10.1038/s41522-018-0057-2
6. Lai SK, Hida K, Shukair S, Wang Y-Y, Figueiredo A, Cone R, et al. Human Immunodeficiency Virus Type 1 Is Trapped by Acidic but Not by Neutralized Human Cervicovaginal Mucus. J Virol (2009) 83:11196–200. doi:10.1128/jvi.01899-08
7. Cone RA. Barrier Properties of Mucus. Adv Drug Deliv Rev (2009) 61:75–85. doi:10.1016/j.addr.2008.09.008
8. Barr JJ, Auro R, Furlan M, Whiteson KL, Erb ML, Pogliano J, et al. Bacteriophage Adhering to Mucus Provide a Non-host-derived Immunity. Proc Natl Acad Sci (2013) 110:10771–6. doi:10.1073/pnas.1305923110
9. Barr JJ, Auro R, Sam-Soon N, Kassegne S, Peters G, Bonilla N, et al. Subdiffusive Motion of Bacteriophage in Mucosal Surfaces Increases the Frequency of Bacterial Encounters. Proc Natl Acad Sci U.S.A (2015) 112:13675–80. doi:10.1073/pnas.1508355112
10. Amsden B, Turner N. Diffusion Characteristics of Calcium Alginate Gels. Biotechnol Bioeng (1999) 65:605–10. doi:10.1002/(sici)1097-0290(19991205)65:5<605:aid-bit14>3.0.co;2-c
11. Abdulkarim M, Agulló N, Cattoz B, Griffiths P, Bernkop-Schnürch A, Borros SG, et al. Nanoparticle Diffusion within Intestinal Mucus: Three-Dimensional Response Analysis Dissecting the Impact of Particle Surface Charge, Size and Heterogeneity across Polyelectrolyte, Pegylated and Viral Particles. Eur J Pharmaceutics Biopharmaceutics (2015) 97:230–8. doi:10.1016/j.ejpb.2015.01.023
13. Hansing J, Ciemer C, Kim WK, Zhang X, DeRouchey JE, Netz RR. Eur Phys J E (2016) 39. doi:10.1140/epje/i2016-16053-2
15. Li LD, Crouzier T, Sarkar A, Dunphy L, Han J, Ribbeck K. Biophys J (2013) 105:1357. doi:10.1016/j.bpj.2013.07.050
16. Celli JP, Turner BS, Afdhal NH, Keates S, Ghiran I, Kelly CP, et al. Proc Natl Acad Sci U.S.A (2009) 106:14321. doi:10.1073/pnas.0903438106
17. Suk JS, Lai SK, Boylan NJ, Dawson MR, Boyle MP, Hanes J. Nanomedicine(Lond) (2011) 6:365. doi:10.2217/nnm.10.123
18. Lai SK, O’Hanlon DE, Harrold S, Man ST, Wang Y, Cone R, et al. Proc Natl Acad Sci U.S.A (2007) 104:1482. doi:10.1073/pnas.0608611104
19. Lang T, Larsson E, Johnansson MEV, Hansson GC, Samuelsson T. Mol Biol Evol (2016) 33:1921. doi:10.1093/molbev/msw066
20. Olmsted SS, Padgett JL, Yudin AI, Whaley KJ, Moench TR, Cone R. Biophys J (2001) 81:1930. doi:10.1016/s0006-3495(01)75844-4
21. Newby J, Schiller JL, Wessler T, Edelstein J, Forest MG, Lai SK. Nat Commun (2017) 8. doi:10.1038/s41467-017-00739-6
22. Schuster BS, Suk JS, Woodworth GF, Hanes J. Biomaterials (2013) 34:3439. doi:10.1016/j.biomaterials.2013.01.064
23. Yildiz HM, McKelvey CA, Marsac PJ, Carrier RL. J Drug Target (2015) 23. doi:10.3109/1061186x.2015.1086359
24. Rohatgi A. Webplotdigitizer 4.2 (2019). Pacifica, CA, United States. Available at https://automeris.io/WebPlotDigitizer
25. Huang F, Watson E, Dempsey C, Suh J. Methods Mol Biol (2013) 991:211. doi:10.1007/978-1-62703-336-7_20
29. Hou R, Cherstvy AG, Metzler R, Akimoto T. Phys Chem Chem Phys (2018) 20:20827. doi:10.1039/c8cp01863d
31. Grebenkov D, Vahabi M, Bertseva E, Forró L, Jeney S. Phys Rev E (2013) 88:040701. doi:10.1103/physreve.88.040701
32. Chew SC, Kundukad B, Seviour T, Van der Maarel J, Yang L, Rice S, et al. MBio (2014) 5:e01536. doi:10.1128/mbio.01536-14
34. Zerbino DR, Achuthan P, Akanni W, Amode MR, Barrell D, Bhai J, et al. Nucleic Acids Res (2018) 46:D754–D761. doi:10.1093/nar/gkx1098
35. Archer E. rfPermute: Estimate Permutation P-Values for Random Forest Importance Metrics (2019). r package version 2.1.7.
36. James G, Witten D, Hastie T, Tibshirani R. An Introduction to Statistical Learning, Vol. 112. Berlin, Germany: Springer (2013).
37. Kumar A, Dixit CK. Advances in Nanomedicine for the Delivery of Therapeutic Nucleic Acids. Sawston, United Kingdom: Woodhead Publishing (2017). p. 43–58. doi:10.1016/b978-0-08-100557-6.00003-1
38. Joiner KL, Baljon A, Barr J, Rohwer F, Luque A. Sci Rep (2019) 9. doi:10.1038/s41598-019-52794-2
39. Taylor J. Introduction to Error Analysis, the Study of Uncertainties in Physical Measurements. New York: University Science Books (1997).
42. Martinez V, Schwarz-Linek J, Reufer M, Wilson L, Morozov A, Poon W. Proc Natl Acad Sci U.S.A (2014) 111:17771. doi:10.1073/pnas.1415460111
44. Suk J, Lai S, Wang Y-Y, Ensign L, Zeitlin P, Boyle M, et al. Biomaterials (2009) 30:2591. doi:10.1016/j.biomaterials.2008.12.076
45. Lai S, Wang Y-Y, Hida K, Cone R, Hanes J. Proc Natl Acad Sci U.S.A (2010) 107:598. doi:10.1073/pnas.0911748107
46. Lai S, Suk J, Pace A, Wang Y-Y, Yang M, Mert O, et al. Biomaterials (2011) 32:6285. doi:10.1016/j.biomaterials.2011.05.008
47. Ensign L, Tang B, Wang Y-Y, Terence A, Hoen T, Cone R, et al. Sci Transl Med (2012) 4:138ra79. doi:10.1126/scitranslmed.3003453
48. Wong IY, Gardel ML, Reichman DR, Weeks ER, Valentine MT, Bausch AR, et al. Phys Rev Lett (2004) 92:178101. doi:10.1103/physrevlett.92.178101
49. Xu Q, Feng L, Sha R, Seeman NC, Chaikin PM. Phys Rev Lett (2011) 106:228102. doi:10.1103/physrevlett.106.228102
50. Armstrong MJ, Rodriguez III JB, Dahl P, Salamon P, Hess H, Katira P. Power Law Behavior in Protein Desorption Kinetics Originating from Sequential Binding and Unbinding. Langmuir (2020) 36 (45):13527–34. doi:10.1021/acs.langmuir.0c02260
52. Cao X, Bansil R, Bhaskar K, Turner B, LaMont J, Niu N, et al. Bioph J (1999) 76:1250. doi:10.1016/s0006-3495(99)77288-7
Keywords: anomalous diffusion, mucus, microscopic particle, meta-analysis, random forest (bagging) and machine learning
Citation: Cobarrubia A, Tall J, Crispin-Smith A and Luque A (2021) Empirical and Theoretical Analysis of Particle Diffusion in Mucus. Front. Phys. 9:594306. doi: 10.3389/fphy.2021.594306
Received: 13 August 2020; Accepted: 04 October 2021;
Published: 23 November 2021.
Edited by:
Jasper Van Der Gucht, Wageningen University and Research, NetherlandsReviewed by:
Antonio Puertas, University of Almeria, SpainKelly Schultz, Lehigh University, United States
Copyright © 2021 Cobarrubia, Tall, Crispin-Smith and Luque. This is an open-access article distributed under the terms of the Creative Commons Attribution License (CC BY). The use, distribution or reproduction in other forums is permitted, provided the original author(s) and the copyright owner(s) are credited and that the original publication in this journal is cited, in accordance with accepted academic practice. No use, distribution or reproduction is permitted which does not comply with these terms.
*Correspondence: Antoni Luque, YWx1cXVlQHNkc3UuZWR1