 Natalia Yudintceva1*
 Natalia Mikhailova1
 Danila Bobkov1
 Liudmila Yakovleva1
 Boris Nikolaev1Darya Krasavina1
 Alexandr Muraviov2,3Tatiana Vinogradova2Petr Yablonskiy2,4
 Igor Samusenko5
 Vyacheslav Ryzhov6
 Vladimir Deriglazov6Yaroslav Marchenko6
 Gabriele Multhoff7
 Alexander P. Klapproth7,8
 Wei Bo Li8Barsa Nayak9
 Avinash Sonawane9
 Maxim Shevtsov1,7,10,11*
- 1Institute of Cytology of the Russian Academy of Sciences (RAS), St. Petersburg, Russia
- 2Saint-Petersburg State Research Institute of Phthisiopulmonology of the Ministry of Healthcare of the Russian Federation, St. Petersburg, Russia
- 3Saint-Petersburg Medico-Social Institute, Saint-Petersburg, Russia
- 4Medical Faculty, St. Petersburg University, St. Petersburg, Russia
- 5The Nikiforov Russian Center of Emergency and Radiation Medicine, Federal State Budgetary Institute, Ministry of Russian Federation for Civil Defense, Emergencies and Elimination of Consequences of Natural Disasters, St. Petersburg, Russia
- 6National Research Centre “Kurchatov Institute”, Petersburg Nuclear Physics Institute, Gatchina, Russia
- 7Department of Radiation Oncology, Central Institute for Translational Cancer Research (TranslaTUM), Klinikum rechts der Isar, Technical University of Munich, Munich, Germany
- 8German Research Center for Environmental Health (GmbH), Institute of Radiation Medicine, Helmholtz Zentrum München, Munich, Germany
- 9Department of Biosciences and Biomedical Engineering, Indian Institute of Technology Indore, Madhya Pradesh, India
- 10Department of Biotechnology, First Pavlov Saint Petersburg State Medical University, St. Petersburg, Russia
- 11World-Class Research Centre for Personalized Medicine, Almazov National Research Centre, St. Petersburg, Russia
Bone-marrow derived mesenchymal stem cells (MSCs) exert anti-tuberculosis effects due to their potential to repair damaged tissues and modulate inflammatory immune responses. MSCs were reported to be recruited to the Mycobacterium tuberculosis (Mtb) affected sites in the organism. However, due to limitations of presently applied in vivo imaging techniques the trafficking and biodistribution of MSCs in Mtb-infected organisms is not possible. In the current study MSCs were labeled with superparamagnetic iron oxide nanoparticles (SPIONs) as a negative MR contrast agent for imaging the biodistribution of MSCs in vivo. Trafficking of SPIONs-labeled MSCs was analyzed in a preclinical model of renal tuberculosis in male Chinchilla rabbits (n = 18) following intravenous administration on the days 0, 2, 3, and 7 employing a highly sensitive method of non-linear longitudinal magnetic response (NLR-M2) measurements. Within 48 h after injection, nanoparticle-labeled MSCs accumulated predominantly in lung, spleen, liver tissues, and paratracheal lymph nodes with subsequent decrease over the observation period of 7 days. The recruitment of MSCs to Mtb-affected organs was further proven by immunohistological analysis. NLR-M2 allowed the detection of SPIONs-labeled cells at low concentrations in different organs and tissues giving insights of in vivo mesenchymal stem cells trafficking in organism after TB infection.
Introduction
Tuberculosis (TB) caused by M. tuberculosis (Mtb) is a major threat to the global health and is associated with poor clinical outcome, high transmission rates (particularly in developing countries), high recurrence rates, and drug resistance [1–3]. With estimated 1.2 million deaths (ranging from 1.1 to 1.3 million) in 2018 worldwide, TB is one of the leading causes for mortality (above HIV/AIDS) induced by a single infectious agent according to the recent “Global tuberculosis report 2019” by the World Health Organization [4]. Apart from the pulmonary TB, other organs (including the urinary system) can also be affected by Mtb [5–8]. Therefore, the development of novel diagnostic and therapeutic approaches represents one of the major goals in translational medicine. Ongoing scientific research and clinical trials are currently evaluating the potential of anti-TB cell therapies, particularly based on mesenchymal stem cells (MSCs) [9–12]. Several preclinical research studies proved the therapeutic potency of MSCs [13–15]. Unique properties of MSCs include participation of cells in immunomodulation and anti-inflammatory responses [15], pro-angiogenic and anti-apoptotic functions [16] and immuno-evasion that allows the application of allogeneic MSCs in cell therapy and tissue engineering [17, 18].
Despite the fact that the exact biological mechanisms underlying the therapeutic effects of MSCs are still unclear, the possibility of MSCs-based adoptive therapies in the complex treatment of TB are actively explored [19–21]. In the recent study by Parida et al. the potential use of allogeneic MSCs in the treatment of multidrug-resistant TB was assessed in a preclinical lung TB model [19, 22, 23]. The authors reported about a prevention of inflammation and reduction in tissue damage which provides a hint for an immunomodulatory function of MSCs [19, 24]. In our previous study, the therapeutic effects of allogeneic MSCs were assessed after local injection in the bladder of TB infected rabbits [25]. Several other preclinical studies further demonstrated the therapeutic potency of systemically or locally administered MSCs [26–30]. Furthermore, accumulation of MSCs in the affected area can be used for a targeted delivery of various therapeutic and/or diagnostic agents [31].
A systemic administration of MSCs represents a clinically relevant route for an adoptive cell therapy. However, the protocols on the optimal cell dose and frequency of the injections, as well as the assessment of the subsequent biodistribution of the MSCs during the follow-up period remain to be studied. MSCs trafficking upon active Mtb infection has not been assessed yet.
The evaluation of the biodistribution of cells in vivo is employed by various methods, with various advantages and disadvantages [32]. The most commonly used methods include PCR, labeling of MSCs with fluorescent lipophilic vital dyes (e.g., PKH26) or exogenously introduced markers [e.g., green fluorescent protein (GFP)], followed by a counting of the labeled cells in the regions of interest. In contrast to these approaches, the whole body imaging techniques [e.g., bioluminescent imaging (luciferase or fluorescent dye-labeled cells), magnetic resonance imaging (MRI), positron emission or single-photon emission tomography, etc.] provide highly sensitive and accurate spatial biodistribution analysis of cells.
In the current study the biodistribution of MSCs was assessed in a preclinical model of renal TB in rabbits. MSCs were labeled with superparamagnetic iron oxide nanoparticles (SPIONs) that had been previously demonstrated to act as a highly sensitive MR contrast agent (due to their unique physicochemical properties) with a low cytotoxicity profile [33–36]. By employing the NLR-M2 method, we demonstrated that MSCs can specifically accumulate not only in the primary Mtb affected renal tissues but also can traffic to secondary Mtb disseminated areas including paratracheal lymph nodes.
In this study for the first time, the biodistribution of SPION-labeled MSCs was determined by a highly sensitive method of longitudinal non-linear response (NLR) to a weak ac magnetic field, in which the second harmonic of magnetization M2 in dependence on the steady field H parallel to the ac field was registered [37]. NLR-M2 magnetic measurements provide the possibility to detect nanoparticle-labeled MSC accumulation in target organs and tissues by registering ReM2(H) and ImM2(H) dependencies. Changing the character of these dependencies in the response of SPION-labeled MSCs in the organs of experimental animals allows of the qualitative tracking of the evolution of their developing state under the influence of various factors which are present in the extracellular space. As will be demonstrated, SPIONs accumulate inside the MSCs as aggregates of about 100–200 nanoparticles. However, magnetic dipole-dipole correlations lead to a sharp decrease in their magnetic moment to a value of the order of the moment of one superparamagnetic nanoparticle.
High sensitivity of the NLR-M2 measurements is provided, on the one hand, by registration of the response to the ac field on the double frequency 2ω. This allows one to avoid the noise from the generator of the ac field on the input of the 2ω receiver (even at large amplitudes of the field) and to register the M2 signal against a low input noise of the receiver. On the other hand, the large M(H) non-linearity of the magnetic nanoparticles ensemble is followed by the large M2(H) response with the presence of specific extrema at a weak H. The large nonlinearity emphasizes the MNP M2− signal in comparison with the paramagnetic media in the environment since their M(H) non-linearity with the linear dependency on H is negligibly small in the weak-field region. Besides, in the NLR-M2 measurements the response of SPIONs to the ac field is detected directly.
In contrast to NLR-M2 measurements, in MRI experiments the signal from protons mainly derived from the surrounding water is registered and the presence and influence of MNPs is detected indirectly via the proton relaxation. Therefore, MRI does not allow of the quantitative information on the concentration of MNPs in the analyzed sample. In electron magnetic resonance measurements, effective magnetic relaxation of an ensemble of magnetic nanoparticles leads to the strong broadening of the recorded signal and, consequently, to a decrease in the sensitivity of the method. Application of another plausible method for the direct detection of SPIONs, SQUID magnetometry, is limited since this method also sensitively detects the diamagnetic contribution of the samples and the cavity. The latter can even dominate when small concentrations of MNPs are used.
Materials and Methods
Experimental Study Design
The nanoparticle-labeled MSCs biodistribution was assessed in the model of renal tuberculosis in rabbits (Figure 1). Analysis of the TB progression was performed using the delayed-type skin hypersensitivity (DTH) test and visually assessed during the laparotomy followed by the histological verification of the biopsy. One month following the injection of Mtb, SPIONs-labeled MSCs were intravenously administered. At the designated time points (2, 3, and 7 days), animals were euthanized and histological analyses (H&E, Ziehl-Nielsen stain) for the tissue samples (kidney, lung, liver, spleen, and paratracheal lymph nodes) were performed. The biodistribution as well as the kinetics of the cells accumulating in different organs and tissues were determined on the days 2, 3, 7 following the injection of the SPIONs-loaded MSCs. The following organs were studied: kidney, lungs, liver, spleen, paratracheal lymph nodes, heart, brain, pancreas, stomach, small intestine, colon, bladder, femur, ovaries, inguinal lymph nodes, and blood. Additionally, the pharmacokinetic modeling of the MSCs biodistribution was performed.
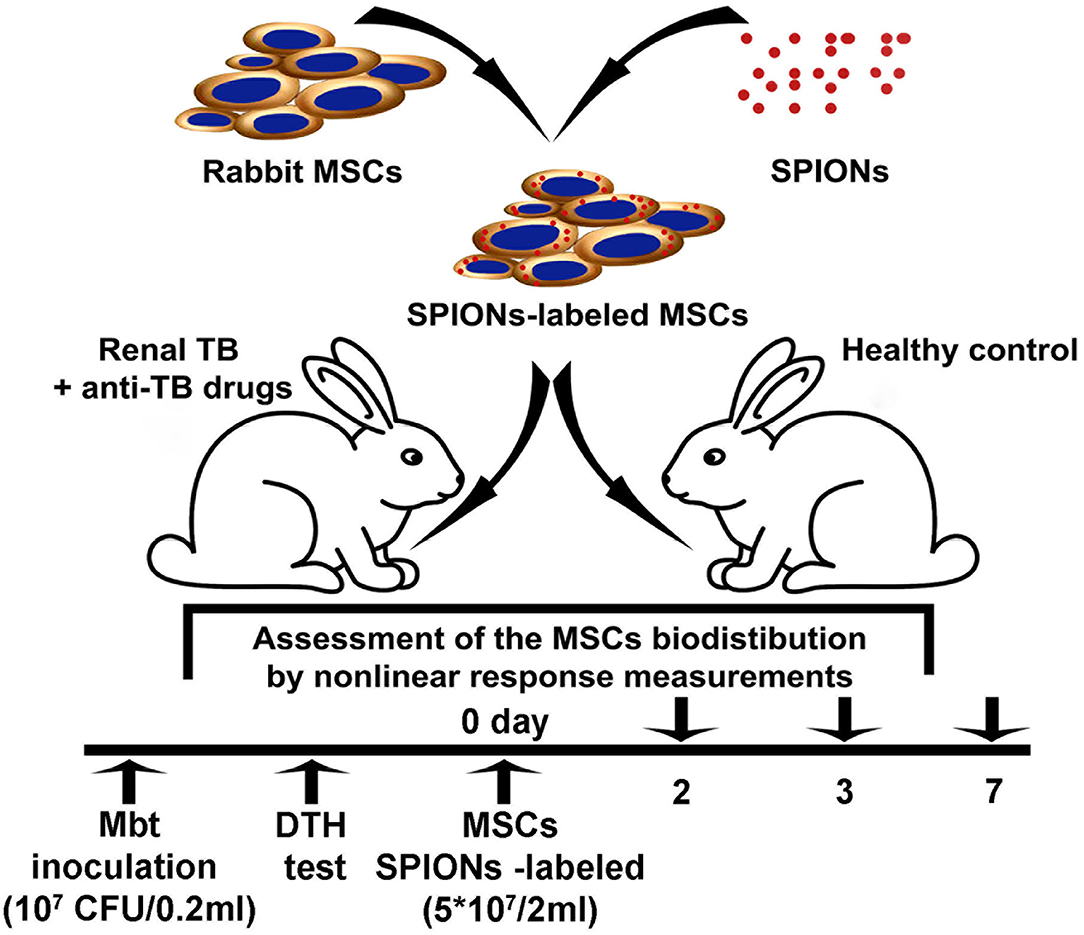
Figure 1. Experimental study design.
MSCs Isolation and Culture
Following aspiration of bone marrow from the ilium, an equal volume of phosphate-buffered saline (PBS) was added. Obtained bone marrow was dispersed by pipetting, filtered through a sterile 70-μm nylon filter (Becton Dickinson Biosciences, Bedford, MA, USA) and centrifuged at 400 × g for 5 min. For the removal of erythrocytes the cell pellet was resuspended in Red Blood Cell Lysis Solution (Panreac, Barcelona, Spain) for 5 min and centrifuged at 400 × g for 5 min. Cells (1 × 10⁷) were cultured in DMEM/F12 medium supplemented with 10% fetal bovine serum (FBS) (Life Technologies, Carlsbad, CA, USA) and antibiotics (100 U/mL penicillin and 100 μg/ml streptomycin (Sigma-Aldrich, St. Louis, USA) at 37°C in the humidified 5% CO2/95% air atmosphere. Following four days of incubation, the non-adherent cells were removed by replacing the medium. The culture medium was exchanged twice a week. At 80–90% confluence, cells were harvested with 0.05% trypsin-EDTA (Life Technologies, Carlsbad, CA, USA) for 3 min at 37°C. Before the experiments, cells were harvested in the log phase of growth and their viability was determined by 0.4% Trypan blue exclusion. The MSCs were used between the passages 4 and 6 in the current study.
Assessment of the MSCs Morphology and Differentiation Potential
The phenotype of rabbit MSCs was assessed according to the minimal criteria for defining multipotent mesenchymal stromal cells [13]. MSCs are presented as a homogeneous population of elongated fibroblast-like cells which showed plastic adherence and were maintained in the standard culture conditions (5% CO2, 37°C). The MSCs obtained from the passage four were tested for the differentiation potential as described previously with minor modifications [38]. The MSCs differentiated into osteoblasts, adipocytes and, chondroblasts in vitro (Supplementary Figure 1).
Synthesis and Physicochemical Characterization of SPIONs
Superparamagnetic nanocarriers were prepared with an iron salt solution containing FeCl3 and FeSO4 by co-precipitation as described previously (Shevtsov et al., 2015, [36]). To prevent sedimentation of the nanoparticles, 10 kDa dextran (Sigma-Aldrich, St. Louis, USA) was added to the nanosuspension during the application of ultrasound. The separated fine fraction was produced from the dextran treated suspension by sedimentation on the NdFeB permanent magnet to remove large particles. The resultant suspension was dialyzed against water. The prepared fine fraction exhibited high colloidal stability. Optical density of the fraction measured by spectrophotometry at λ = 575 nm changed only by 10% from the initial value after 1 year of storage at +4°C. The colloidal stability in magnetic field at different effective Fe concentrations of the dextran-coated MNPs during the time interval 90 min was measured by NMR relaxometry (Supplementary Figure 2). From the 1st to the 90th min the relaxation time of protons changed only within 20% of its original value even in the largest magnetic field ~7 T, indicating insignificant aggregation of the MNPs. When MNPs were stored in a refrigerator in the absence of magnetic field, the relaxation time of protons in the water suspension was constant within the measurement errors, indicating a stable state of MNPs. After long-term storage, before use, the colloidal solution of nanoparticles was shaken to resuspend possible formed aggregates. The hydrodynamic size and the surface charge of nanoparticles were assessed using the Zetasizer Nano (Malvern Instruments, GB). The size of the iron oxide core and the shape of the particles were analyzed employing TEM (JEOL-2000 microscope, Jeol, Japan) and X-ray diffraction. From X-ray diffraction the iron-oxide nuclei of SPIONs exhibited the structure of nanocrystalline magnetite Fe3O4. Highly sensitive non-linear magnetic response measurements were employed for the analysis of superparamagnetic properties of SPIONs. From combined TEM and NLR-M2 data, the dextran shell thickness was estimated to be 1.4–1.7 nm [39]. The MR contrast of the particles was assessed (i.e., R1, R2, and coefficients) in the 7.1 T magnetic field of the NMR spectrometer CXP-300 (Bruker, Germany).
Labeling of the MSCs With SPIONs: Evaluation of Nanoparticles Incorporation and Release
MSCs were co-incubated with SPIONs (at Fe concentration of 150 μg/ml) for 1, 3, 12, and 24 h at 37°C in a CO2-incubator. The non-treated cells were used as a control. Following co-incubation, cells were washed with PBS and their viability was assessed by 0.4% Trypan blue exclusion. The Vybrant® MTT Cell Proliferation Assay Kit was applied according to the manufacturer's protocol (Life Technologies, Carlsbad, CA, USA) for evaluation of the cytotoxicity of the nanoparticles and cell proliferation. To demonstrate ferric iron incorporation into the cells, Prussian blue staining of cells in the culture (BioPAL, Worcester MA, USA) was used in accordance to the manufacturer's protocol. Additionally, the nanoparticles incorporation into MSCs was analyzed employing confocal microscopy. The cells were allowed to settle on the glass slides and were co-incubated in the culture medium with SPIONs (at Fe concentration of 150 μg/ml) for 1, 3, 6, 12, and 24 h at 37°C. Following the co-incubation the cells were washed, fixed in 0.5% paraformaldehyde (PFA), and mounted in DAKO fluorescent mounting medium (Dako, North America Inc., USA). Nuclei were stained with DAPI (Sigma-Aldrich, USA). The intracellular localization of SPIONs was evaluated using Leica TCS SP5 confocal system (Leica Microsystems, Heidelberg, Germany). Obtained images were processed employing Adobe Photoshop PS software (Adobe Software, Palo Alto, United States). To assess the SPIONs released from the labeled cells into the fresh culture medium, a spectrophotometric method was applied. For this the MSCs loaded with SPIONs (300 μg/ml) were cultured in the fresh medium for 1, 3, 5, and 7 days. At designated time points the medium was collected and quantitative analysis of the iron content was performed. DMEM/F12 medium with 10% heat-inactivated fetal bovine serum and mixture of antibiotics (penicillin/streptomycin) was used as a control.
Ferrozine-Based Colorimetric Assay
The nanoparticle uptake by MSCs was analyzed employing an iron assay kit (Sigma-Aldrich, St. Louis, USA) according to the manufacturer's protocol. Briefly, cells were co-incubated with SPIONs at various Fe concentrations (50, 100, 150, 300 μg/ml) for 24 h. Following the co-incubation, cells were washed with PBS and the intracellular iron content as well as the content of iron adsorbed on the outer cell membrane were assessed.
Transmission Electron Microscopy
Following incubation with SPIONs for 24 h, MSCs were fixed in 2.5% glutaraldehyde in 0.1M cacodylate buffer, pH 7.4, for 1 h at 4°C, postfixed in 1% aqueous OsO4 for 1 h, dehydrated, and embedded in Epon and Araldit. Utrathin sections of the cells were collected on fine mesh nickel grids. For examination, the samples were stained with uranyl acetate and lead citrate and analyzed employing Zeiss Libra 120 electron microscope.
Bacterial Strain and Culture
The virulent Mtb strain H37Rv (TBC # 1/47, Institute of Hygiene and Epidemiology, Prague) was obtained from the Federal Scientific Center for Expertise of Medical Products (RF Ministry of Health Care). Mycobacteria were cultured on Middlebrook's 7H11 agar medium (Sigma-Aldrich, St. Louis, USA) supplemented with 10% Middlebrook OADC Enrichment (Sigma-Aldrich, St. Louis, USA). CFUs were determined after 2–3 weeks of culture at 37°C.
Rabbits
Male Chinchilla rabbits weighing 3–3.5 kg (in total 18 animals) were obtained from the Rappolovo Laboratory Animal Nursery of the Russian Academy of Medical Sciences (St. Petersburg, Russia). For sedation prior to anesthesia the mixture of fentanyl/droperidol (Moscow Endocrine Plant, Moscow, Russia; Dalkhimpharm, Vladivostok, Russia) 0.2 mg/kg was intramuscularly injected. Intravenous administration of ketamine (Moscow Endocrine Plant, Moscow, Russia) 10–50 mg/kg and xylazine (Alfasan International B.V., Woerden, Netherlands) 1–3 mg/kg mixture was employed for an anesthesia.
Model of Renal Tuberculosis
Following anesthesia, the kidney was exposed through a midline laparotomy incision of 4 cm. Inoculation of the Mtb H37Rv (107 colony-forming units (CFU)/0.2 ml) by intraparenchymal injection was performed. In the postoperative period, all animals were given one intramuscular injection of 300,000 EU of the antibiotic bicillin-3 (benzathine benzylpenicillin; Sintez, Kurgan, Russia) every 3 days (a total of four injections). TB progression control was performed using delayed-type skin hypersensitivity (DTH) test with the allergen recombinant TB ≪Diaskintest≫ (Generium, Moscow, Russia) and was visually evaluated during diagnostic laparotomy as described previously [25]. The inflammation of the kidney was visually assessed during the laparotomy followed by the histological verification of the biopsy. On day 30 following inoculation of Mtb, the highly positive skin DTH probe was detected in all experimental animals with a diameter of 19.8 ± 1.4 mm (Supplementary Figure 3). The skin DTH probe was not detected in the control group and was regarded as a negative result. For the analysis of MSCs biodistribution in the model of renal TB in the non-treated (control) and treated with anti-TB drugs, the animals were randomly divided into two groups (nine animals in each group). The suspension of MSCs (5 × 10⁷ cells in 2 ml of PBS) labeled with SPIONs was intravenously administrated using a 2-ml syringe (23 G) via the marginal ear vein.
Anti-TB Treatment
One month following intraparenchymal injection of Mtb, standard aTBT was performed for a period of 2 months according to the National clinical guidelines [40]. The treatment protocol included daily intramuscular injection of isoniazid (Biosintez, Penza, Russia) 10 mg/kg with the concomitant oral administration of rifampicin (Kraspharma, Krasnoyarsk, Russia) 10 mg/kg, ethambutol and pyrazinamide (Pharmasintez, Irkutsk, Russia) 20 mg/kg and 15 mg/kg, respectively. After intravenous administration of the MSCs the sustaining treatment with izoniazid and rifampicin was performed daily until termination of the experiment for a period of 7 days.
Histological Analysis
At the designated time points, animals were euthanised by CO2 asphyxiation, and organs (i.e., kidney, lung, liver, spleen, and paratracheal lymph nodes) were extracted and fixed in 10% formalin. Paraffin sections of 3–5 μm were stained with haematoxylin and eosin (H&E). The presence of acid-resistant bacteria (Mtb) was identified using Ziehl-Nielsen stain. For the detection of iron-labeled MSCs, the extracted samples were embedded in Tissue-Tek® (Sakura Finetek Europe BV, Alphen an den Rijn, The Netherlands) and stored at −80°C. Sections (5–10 μm thick) were used for the detection of MSCs labeled with magnetic nanoparticles employing confocal microscopy (Olympus FV3000 confocal system (Olympus IX83 microscope, Olympus Corporation, Tokyo, Japan). Cover glasses were mounted in the fluorescent mounting medium supplemented with 4′,6-diamidino-2-phenylindole (DAPI) (Abcam, Cambridge, GB). For the analysis of SPIONs intracellular localization, reflected laser (504 nm) scanning was applied. For evaluation of nanoparticle localization, single Z-planes were analyzed with Olympus confocal software (FluoView FV31S-SW; Olympus Corporation) and ImageJ 1.51 (National Institutes of Health, Maryland, USA).
In vitro and in vivo Analysis of the SPIONs-Labeled MSCs by M2 Measurements
NLR-M2 was used to characterize the magnetic state of SPIONs (single- or multi-domain) and to determine their magnetic parameters outside and inside nanoparticle-labeled cells (MSC-SPIONs) as well as to assess the biodistribution of the SPION-loaded MSCs in organs and tissues of the animals under study [37]. The home-made setup was employed, registering the NLR response of magnetic nanoparticles (MNPs) to the weak ac magnetic field h(t) = h sinωt parallel to the steady field H (with the frequency f = ω/2π =15.7 MHz and h =13.8 Oe). The setup included two coaxial Helmholtz coils (providing the linear scanning of the steady field H) combined with the electromagnet to create the constant field H0, if necessary, and the transmitter–receiver high frequency coil of the two-mode resonant system. The resonant system, on the one hand, creates the ac field on the sample under study and selects from the total NLR the second harmonic M2 of the magnetization generated by the sample [41]. The M2-signal phase components i.e., ReM2(H) and ImM2(H) are recorded simultaneously as functions of H. The frequency Fsc of the H scan can be changed within 8–0.02 Hz, which allows of testing the state (single- or multi-domain) of MNPs. Indeed, in the multi-domain state, the magnetization reversal is determined by fast motion of domain boundaries and the H hysteresis does not depend on Fsc, whereas in single-domain MNPs, the field hysteresis appears in the blocking regime below the blocking temperature Tb. This temperature can be found from the condition τ = τmes of the hysteresis appearance where τ is the longitudinal magnetization relaxation time and τmes is the measurement time given by Fsc. In the case of uniaxial anisotropy applicable to our MNPs, the relationship 1/τ = f 0exp(–Ea/kBTb) is valid, where Ea is the anisotropy energy, kB is the Boltzmann constant, and the frequency f 0 is of the order 1 ns−1 so that Tb = Ea/[k·ln(f 0/Fsc)] [42]. The dependence of the H hysteresis on Fsc evidences the single-domain state of MNPs. Usually in the measurements, h is small enough to ensure the condition M2 ∞ h2. The main contribution to ReM2(H) arises due to the non-linear behavior of M(H), so in the regime close to SPM it can be semiquantitatively described as ∂2L(H)/∂H2 + kPMH, where L(H) is the Langevin function, and the term kPMH takes into account a possible small linear contribution from the low-molecular paramagnetic fraction [43]. The ReM2(H) reaches an extreme value near the inflection point of M(H), whose position depends on the average moment of MNPs. This description is rather approximate since it does not take into account magnetization dynamics. This account becomes possible with the data processing formalism based on the numerical solution of the Fokker-Planck equation [39]. As shown previously, the cellular structure does not change the form of M(H) and ReM2(H) dependencies [44]. This allows one to determine relative concentrations of SPIONs in different organs of experimental animals by comparing the signal amplitudes and thus to control the biodistribution of MNPs in the organism.
Mathematical Formalism for the NLR Data Processing
The NLR-M2 data were processed with the formalism based on the numerical solution of the kinetic Fokker-Planck equation for SPM particles:
with
Here W(t) is the non-equilibrium probability-density function for the direction of the particle magnetic moment m, α is the damping constant, the time scale τN is the Néel relaxation time, i.e., the free-diffusion (zero-potential) correlation time, which in the Landau-Lifshitz form is proportional to α−1, and β = 1/kBT. The magnetic potential is the sum of the uniaxial anisotropy energy and the energy of the magnetic moment in the total magnetic field H = H0 + h:
where n is the anisotropy axis direction. The direction of m defined by the spherical angles ϑ and φ thermally fluctuates in the field H.
By expanding W(t) in the series on spherical harmonics:
and in the Fourier series, Equation (1) is reduced to a linear set of equations which, in turn, can be expressed as a continuous-fraction matrix equation
where the matrices Qn, Qn+ and Qn+1 (n = 1, 2,…) are composed of the spherical harmonics indices, direction cosines of the magnetic fields, as well as of the parameters entering Equations (1–3) and the magnetic potential . The normalized kth Fourier harmonic of the magnetic moment in the field direction is expressed as
where (ω) are Fourier transforms of clm(t) in Equation (4) and γi are the direction cosines of the magnetic fields relative to the anisotropy axis n. The quantities (ω) are the elements of the column vector S1, the solution of Equation (5). To obtain the fit function for the M2 response, mk(ω) for k = 2 should be convoluted with the distribution over magnetic moments:
where is the saturation magnetization of the SPM system and fM corresponds to the distribution over volumes if all the particles are magnetically homogeneous with the same, size independent, magnetization.
Computation of the fitting function (7) at each experimental point implies the multiple solving of the recursion Equation (5). The solution accuracy is determined by the number of equations in the set, i.e., the retained terms in the Fourier and spherical harmonics expansions. By the simultaneous fit of the real and imaginary components of the measured signal with Equation (7), the following quantities can be directly obtained: (i) the saturation magnetization of the sample , (ii) the mean magnetic moment MC and the width of the lognormal distribution σ, (iii) the number of magnetically responsive centers in the sample, (iv) the mean anisotropy energy Ea and field Ha, (v) the mean angle Ψ between n and H, and (vi) the magnetization dynamics parameters such as the damping constant α and the free-diffusion relaxation time τN. With the knowledge on the iron concentration, some more information can be extracted, viz., the mean number of Fe ions in the magnetic centers, the mean size of the centers and some others.
The data processing has been performed at the PIK Data Center of PNPI.
Pharmacokinetic Model of SPIONs-Labeled MSCs Biodistribution Analysis
To describe the biodistribution of MSCs, a physiologically based pharmacokinetic (PBPK) model was set up. The rabbit body was divided into separate compartments representing blood and organs, while the transportation rates of MSCs were described by differential equations.
The model was based on the previously published PBK model by Wang et al. for MSC distribution in mice [45]. The body in this model is reduced to the most important organs, while the rest is summarized in one compartment. As the main transportation route, blood is divided into venous and arterial. Inside organs MSCs can be trapped in microvessels, which is described by a separate respective compartment for each organ. Arrested cells can either remain arrested, be released back into the corresponding organ or be depleted. Figure 2 represents a sketch of the model compartments and their transition pathways. Each transition rate is described by one kinetical constant. Both, parameter estimation and simulations were performed in MATLAB. Since the data were in the form of concentrations, all data points were first multiplied by their respective organ weights, which were taken from literature. The results were then used to compute a set of optimal parameters using a previously described approximation strategy ([46–54]).
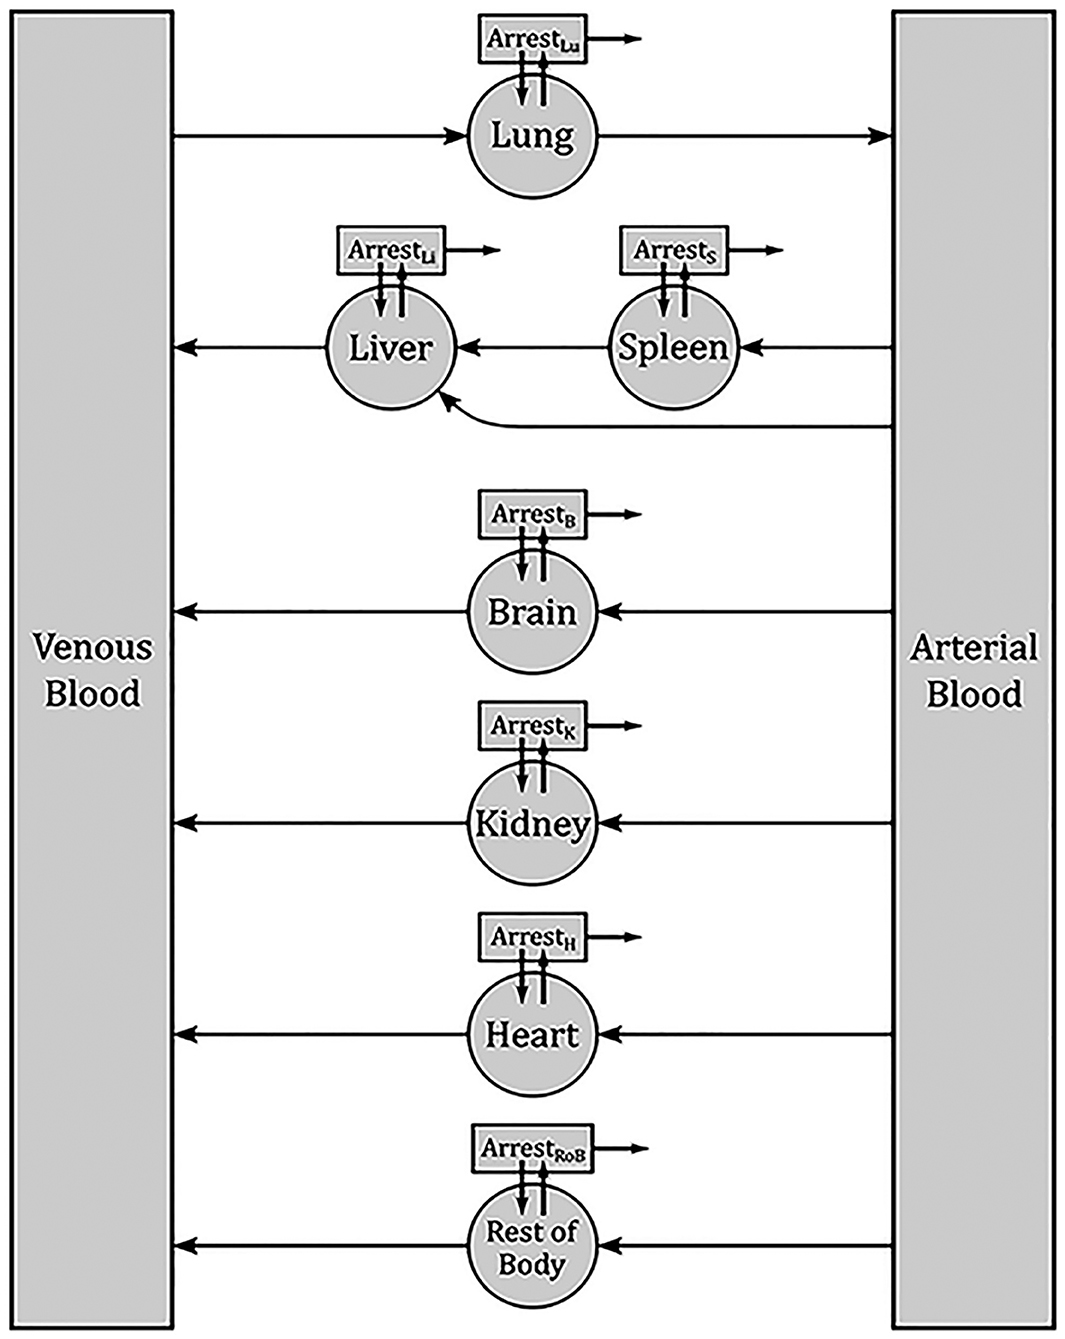
Figure 2. Sketch of the PBPK model for the biodistribution of MSCs in rabbits. Each box denotes one compartment and each arrow one pathway. Each transition rate is described by one kinetic constant. The main compartments for each organ describe the respective interior blood vessels. From there, MSCs can be released back into blood or arrested. Arrested cell can return into the organ blood vessels or be depleted.
Statistical Analysis
For analysis of two continuous variables, the parametric Student's t-test was used. The significance level was equal to 0.05 for all tests with the confidence intervals at the 95% level. For comparison of multiple groups which had few observations, a non-parametric analog to the one-way ANOVA test, the Kruskal–Wallis test, was used. Statistica Version 9.2 software was employed for all the tests.
Results
Characterization of Superparamagnetic Nanoparticles
From TEM the iron oxide core of SPIONs was found to be 9.46 (5) nm in diameter with the lognormal size distribution width σd = 0.383 (4) [39]. From dynamic light scattering of the colloidal PBS solution of dextran-coated SPIONs, the mean hydrodynamic diameter 100.4 (1.7) nm and Z-potential −43.2 (4.5) mV were obtained (Figure 3A). Subsequent measurements of the hydrodynamic diameter and Z-potential over the period of 3 months did not show the aggregation of the nanoparticles. After 12 weeks of storage at +4°C the mean diameter constituted 107.2 (3.1) nm and Z-potential −33.11 (5.7) mV. Relaxometry NMR measurements of spin-spin and spin-lattice relaxations demonstrated increased R2 and relaxation rates that indicated the strong negative MR contrast enhancement due to SPIONs (data not presented).
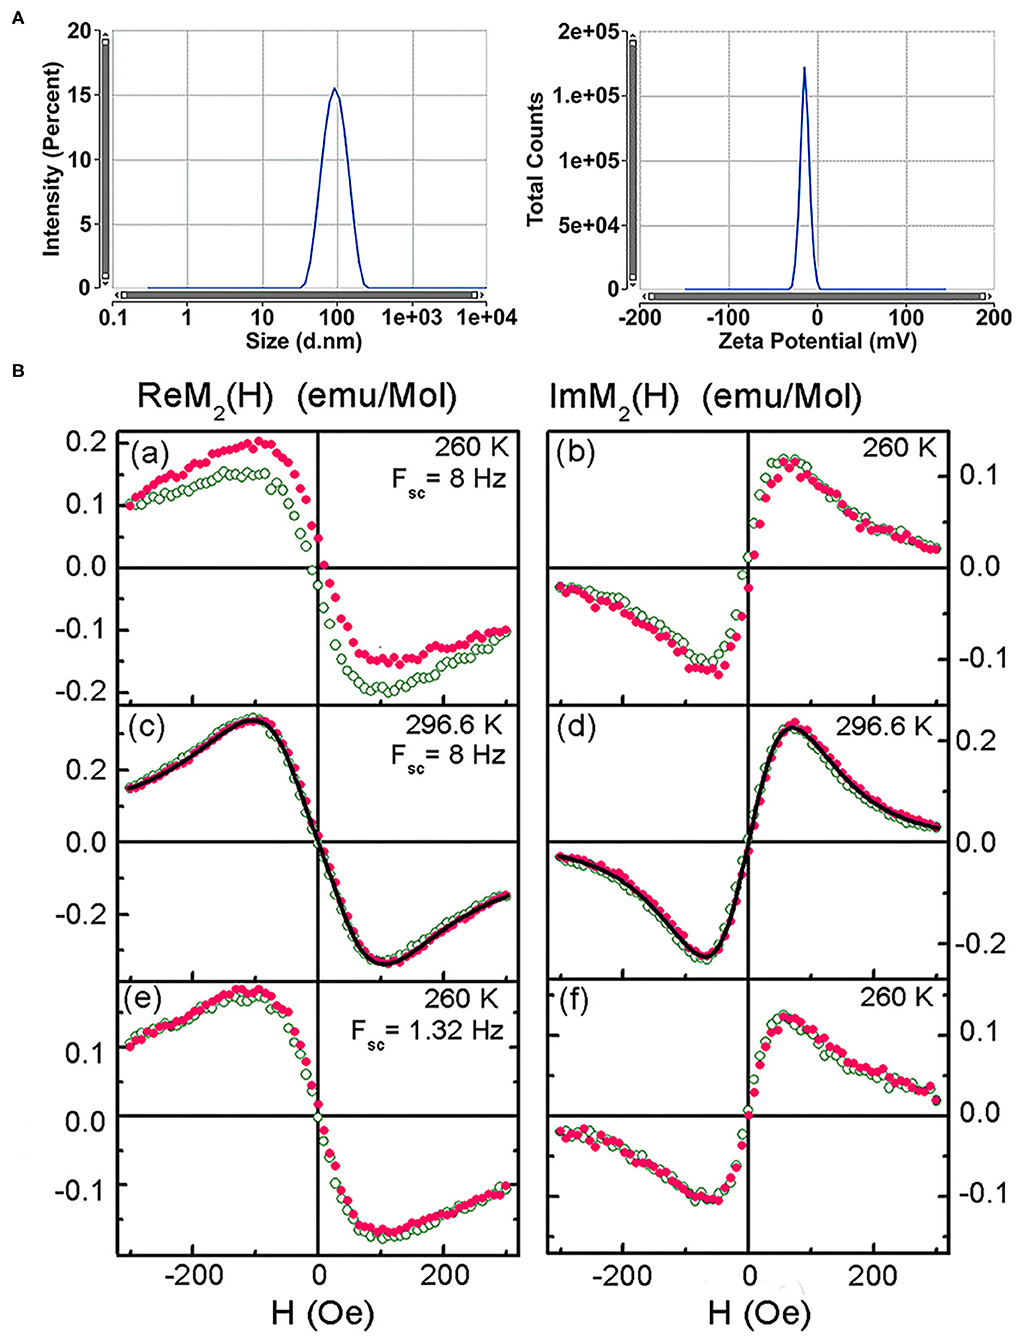
Figure 3. Characterization of the superparamagnetic nanoparticles. (A) Size distribution by intensity and Zeta potential of SPIONs. (B) Real and imaginary parts of the non-linear magnetic response of the SPION aqueous suspension vs. dc magnetic field, direct (filled symbols) and reverse (open symbols) H scans at scan frequencies Fsc = 8 and 1.32 Hz and temperatures 260 and 296.6 K. Only every 16th point is shown. Black curves in (c) and (d) are simultaneous best fit.
NLR-M2 measurements of the aqueous suspension revealed disappearance of the field hysteresis in the ReM2(H) signal from SPIONs at increasing temperature and decreasing the frequency of H scans thus indicating the dynamical character of the hysteresis [39]. Such a behavior is typical of the single-domain state of magnetic nanoparticles inherent to the superparamagnetic regime (Figure 3B). Fitting the registered M2(H) signals with the formalism described above (Figures 3Bc,d) indicated formation of SPIONs aggregates in agreement with the TEM observation. The following parameters were determined: (i) the mean magnetic moment of aggregates MC = 61,200 (100) μB close to the double mean magnetic moment of SPIONs; (ii) the corresponding mean “magnetic” diameter DC = 41.7(1) nm; (iii) the mean amount of SPIONs in the aggregates nSP = 55 (3); (iv) the mean anisotropy energy Ea = 254 (22) K. The magnetic and geometric characteristics did not change with increasing the SPIONs concentration from 0.02 mM(Fe)/L to 2 mM(Fe)/L that indicated the stable chemical nature of the binding of SPIONs dextran shells in water and the absence of noticeable magnetic interaction between the aggregates. Furthermore, subsequent NLR-M2 measurements of the nanosuspension over the period of 3 years (storage at +4°C) demonstrated the single-domain state of the SPIONs without a change of their magnetic properties.
Examination of Nanoparticle-Labeled MSCs
Following co-incubation of MSCs with SPIONs (at a Fe concentration of 150 μg/ml) for 24 h, Prussian blue staining (Figure 4A) and subsequent reflective laser scanning by confocal microscopy demonstrated internalization of nanoparticles in the cytoplasm (Figure 4B). SPIONs are visualized as red dots present in the cytosol but not in the nucleus. MSCs without SPIONs were used as an internal negative control. Additionally, incorporation of nanoparticles by cells at the ultrastructural level was analyzed by TEM. The cytoplasm contained prominent heteromorphous endosomes with a diameter of 0.5 μm filled with the aggregates of numerous small electron-dense particles (Figure 4C). Apart from endo-lysosomes nanoparticles were also found in the cytoplasm as free aggregates. MTT analysis did not reveal any significant toxic effect of the nanoparticles on the proliferation of MSCs at concentrations ranging from 50 to 150 μg/ml. However, an increase in cytotoxicity (up to 20%) was detected when SPIONs were employed at a concentration above 300 μg/ml (Figure 4D). A linear regression analysis confirmed that an increase in the concentration of SPIONs above a range of 0–300 μg/ml was accompanied by a significant decrease in the number of surviving cells after a co-incubation time of 24 h (Figure 4D). The iron assay kit (Sigma-Aldrich, St. Louis, USA) was employed for an assessment of the Fe concentration in a sample of 5 × 10⁶ cells. An increase in the concentration of SPIONs led to an increase of the iron concentration in MSCs, viz., 19, 32, 34, 62 pg/MSC for the Fe concentrations 50, 100, 150, and 300 μg/ml, respectively (Figure 4E). When comparing the number of lysosomes in nanoparticle-labeled cells and control cells (Figure 4G), no significant difference was found (Wilcoxon test p = 0.91, n = 10). Intriguingly, the subsequent co-localization analysis demonstrated that SPIONs were predominantly present in the cytoplasm with a minor pool of nanoparticles present in the endo-lysosomal compartment. Subsequent spectrophotometric experiments that were performed to assess the release of MNPs from the MSCs demonstrated that over a period of 7 days only a tiny fraction of SPIONs (~2 μg/ml) was excreted into the culture medium (Figure 4F).
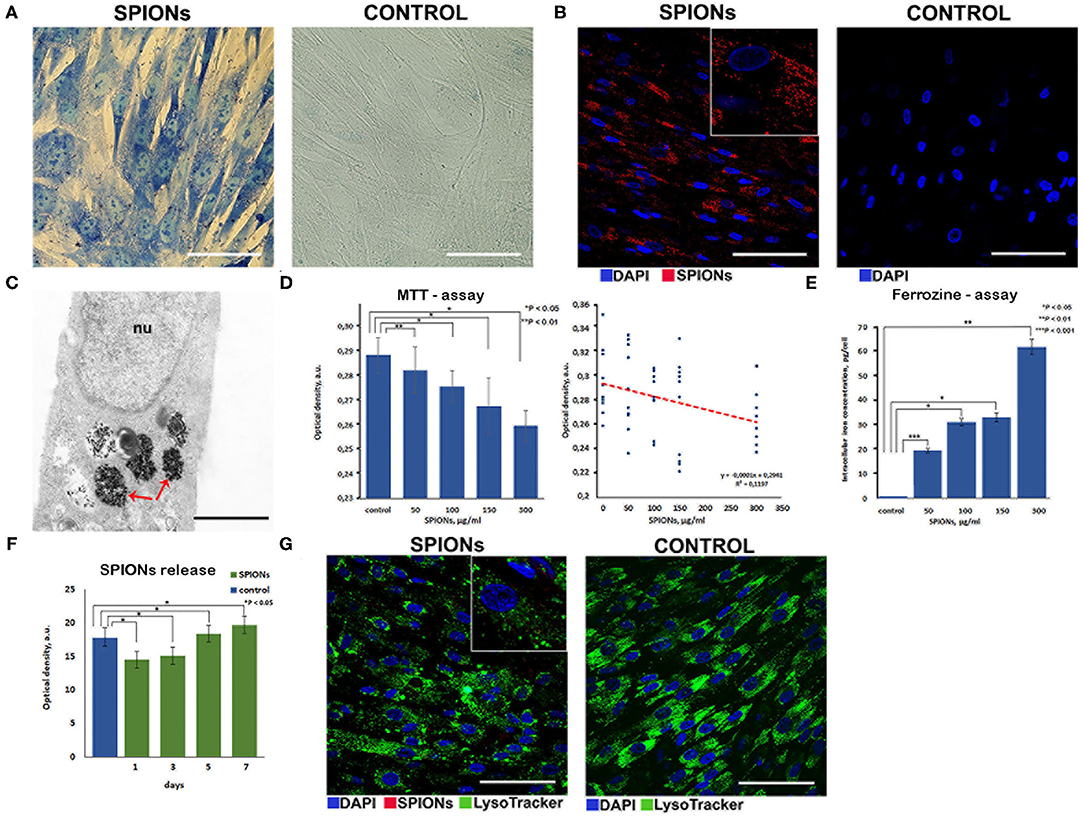
Figure 4. Assessment of nanoparticles internalization by mesenchymal stem cells. (A) Prussian blue staining of the SPION-loaded MCSs. Scale bars, 50 μm. (B) Confocal microscopy images of MSCs co-incubated with SPIONs (150 μg/ml) for 24 h and control (non-treated cells), respectively. Nuclei were stained with DAPI (blue). SPIONs were detected by reflected laser scanning (red). Scale bars, 100 μm. (C) TEM image of the SPIONs. Red arrows point to secondary endosomes filled with heterogeneous material, including electron-dense nanoparticles. Scale bar is 400 nm. (D) The influence of the different concentrations of SPIONs on the viability of cells and a linear regression analysis of MTT data, respectively. Levels of significance between all experimental and control groups are shown as *P < 0.05; **P < 0.01. (E) Correlation between an increase in the concentration of SPIONs and a corresponding increase in the concentration of iron in MSCs. Levels of significance between all experimental and control groups are shown as *P < 0.05; **P < 0.01; ***P < 0.001. (F) Spectrophotometric analysis of the nanoparticles release into the medium from the SPION-loaded MSCs. Data are presented as M ± SD from three independent experiments. (G) Analysis of the co-localization of SPIONs and endolysosomes. Nuclei were stained with DAPI (blue). Lysosomes were stained with LysoTracker dye (green). SPIONs were detected by reflected laser scanning (red). Scale bars, 100 μm.
Possible changes in the state of SPIONs during their incorporation into MSCs were controlled by subsequent NLR-M2 measurements. The signals were registered from the suspensions of the SPION-labeled MSCs. The M2 responses of SPION-labeled MSCs co-incubated with 150 μg/ml Fe in PBS (further used for injection to the experimental animals) and after fixation in formalin are presented in Figure 5 while the fit parameters are presented in Table 1. The amount of Fe (and SPIONs, respectively), absorbed by cells was determined as the difference in the Fe concentration in the culture medium before and after co-incubation, which depended on the effective concentration of Fe during the incubation, and subtracting also the concentration of SPIONs adsorbed on the cell membranes and removed by flushing the SPIONs off the cell surfaces. As a result, the average amount of Fe (and SPIONs, correspondingly) absorbed by MSCs in the sample containing 1.5 × 10⁵ cells was found to be 11.9 (1.3) μg for C(Fe) = 150 μg/ml. The change of the M2(H) response amplitudes was observed from the suspensions of MSCs co-incubated with different concentrations of Fe while the extrema positions changed only slightly. A weak field hysteresis disappeared at decreasing Fsc down to 0.25 Hz indicating transfer to the superparamagnetic regime thus validating the NLR-M2 data processing formalism. The best-fit magnetic parameters, viz., the saturation magnetization, the mean magnetic moment, the log-normal distribution width, the anisotropy field and energy, the damping constant and the Néel relaxation time, appeared to be nearly the same for all the samples regardless of the solvent, PBS or formalin. The small anisotropy energy, Ea = 7–11 K, and the mean “magnetic” diameter [i.e., relating to the magnetic component) DC = 59 (1) nm (corresponding to the mean magnetic moment MC (Table 1)] much exceeding the size of the SPION magnetic core indicate the M2 response to come from the aggregates of SPIONs. The distribution width σV = 0.73 turned out to be even smaller than that of the SPIONs ensemble, σV = 3σd = 1.15. This quantity was underestimated due to the assumption on the homogeneous distribution of magnetization in the aggregates. The dipole-dipole coupling causes magnetic correlations with the finite correlation radius. Its account could yield somewhat larger, more realistic, distribution width and mean magnetic moment [39], unfortunately, not available in the present study. The ratio (Table 1) yields the amount of magnetic centers in the sample NC = 1.24 × 10¹⁰ or 8.27 × 10⁴ aggregates per MSC. With the known concentrations of absorbed iron in the measured co-incubated samples, the mean number of SPIONs per cell, NSP = 1.3 × 10⁷, and nSP = 160 SPIONs per aggregate were found, considerably larger than in the aqueous suspension. The diameter DC determined from NMR-M2 includes only the magnetic component of the aggregates. To obtain the real mean diameter, the “magnetic” diameter DC should be multiplied by the factor ξ = 1.52 which corrects the aggregate size for the dextran shell and the interparticle space [39], giving the true mean diameter value 90 (2) nm. This value well-agrees with the size of the aggregates in the TEM image of Figure 4C and is close to the hydrodynamic diameter 100 nm obtained by dynamic light scattering. The sensitivity of the NLR-M2 setup characterized by the minimal measurable amount of SPION-labeled MSCs in the sample corresponds to the signal-to-noise ratio equal to 1 and was found to be 1,300 cells.
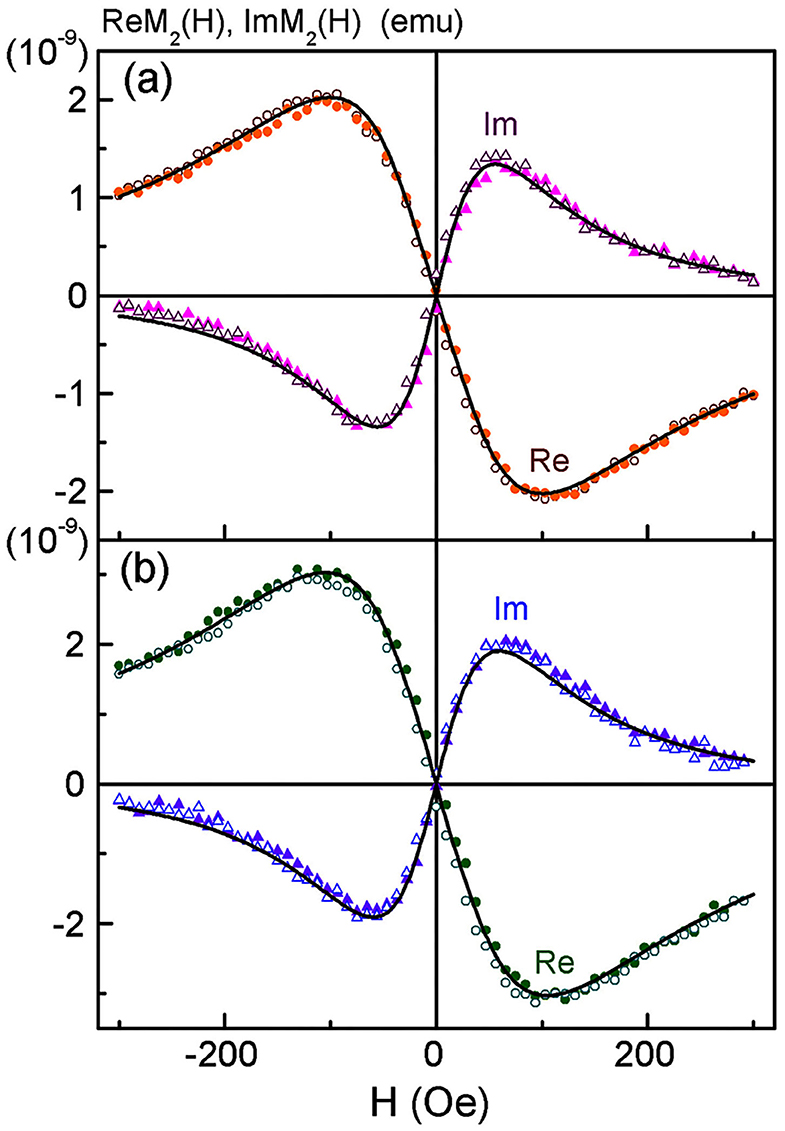
Figure 5. Real and imaginary parts of non-linear magnetic response vs. dc magnetic field, direct (filled symbols) and reverse (open symbols) scans with Fsc = 8 Hz, for SPION-labeled MSCs suspensions in PBS (a) and formalin (b) after co-incubation of MSCs at the concentration of iron 150 μg/ml for 24 h. Every 32nd point is shown. Black curves in (a) and (b) are best fit. Obtained parameters for (a) are presented in Table 1.
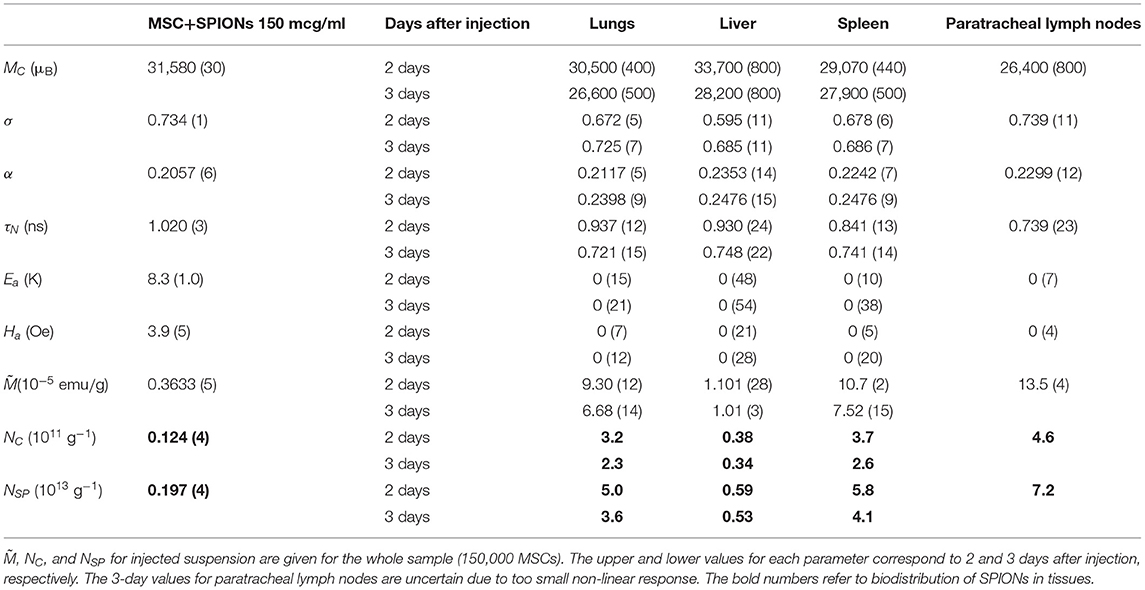
Table 1. Magnetic parameters of injected MSC+SPIONs suspension and of rabbit lungs, liver, spleen, and paratracheal lymph nodes: mean magnetic moment MC, lognormal distribution width of magnetic moments σ, damping constant α, Néel relaxation time τN, anisotropy energy Ea and field Ha, saturation magnetization of the sample per gram of tissue , and mean concentration of aggregates NC and of SPIONs NSP in tissues, respectively.
The mean aggregate magnetic moment should obey the scaling law MC = m, where m ~ (2.2–3.1) × 104 μB is the SPION magnetic moment, and for nSP = 160 was expected to be MC = (2.8–3.9) × 105 μB. However, the dipole-dipole coupling of SPIONs inside the aggregate tends to minimize the magnetostatic energy and, thus, strongly suppresses the aggregate magnetic moment down to 3.14 (6) × 104 μB comparable with that of one SPION.
Intravenous Administration of MSCs With Concomitant Anti-TB Therapy
The intravenous administration (via an ear marginal vein) of SPIONs-labeled MSCs was performed following the treatment of animals with a standard anti-TB protocol [40]. Then rabbits were evaluated on the days 2, 3, and 7 after MSCs administration. The untreated animals after injection of nanoparticle-labeled MSCs were used as an internal control. The specific TB inflammation of the kidney and lung was detected in animals from the experimental group. Acid-resistant bacteria (Mtb) were detected by the staining protocol according to Ziehl-Neelsen (Figure 6A). Giant multinucleated cells of Langhans (Figure 6B), small areas of caseous necrosis, and epithelioid cells were detected in the granulomas (Figure 6C). The cells with incorporated magnetic nanoparticles were visualized in various organs and tissues of the treated animals (i.e., kidney, lung, liver, and spleen) (Figure 7).
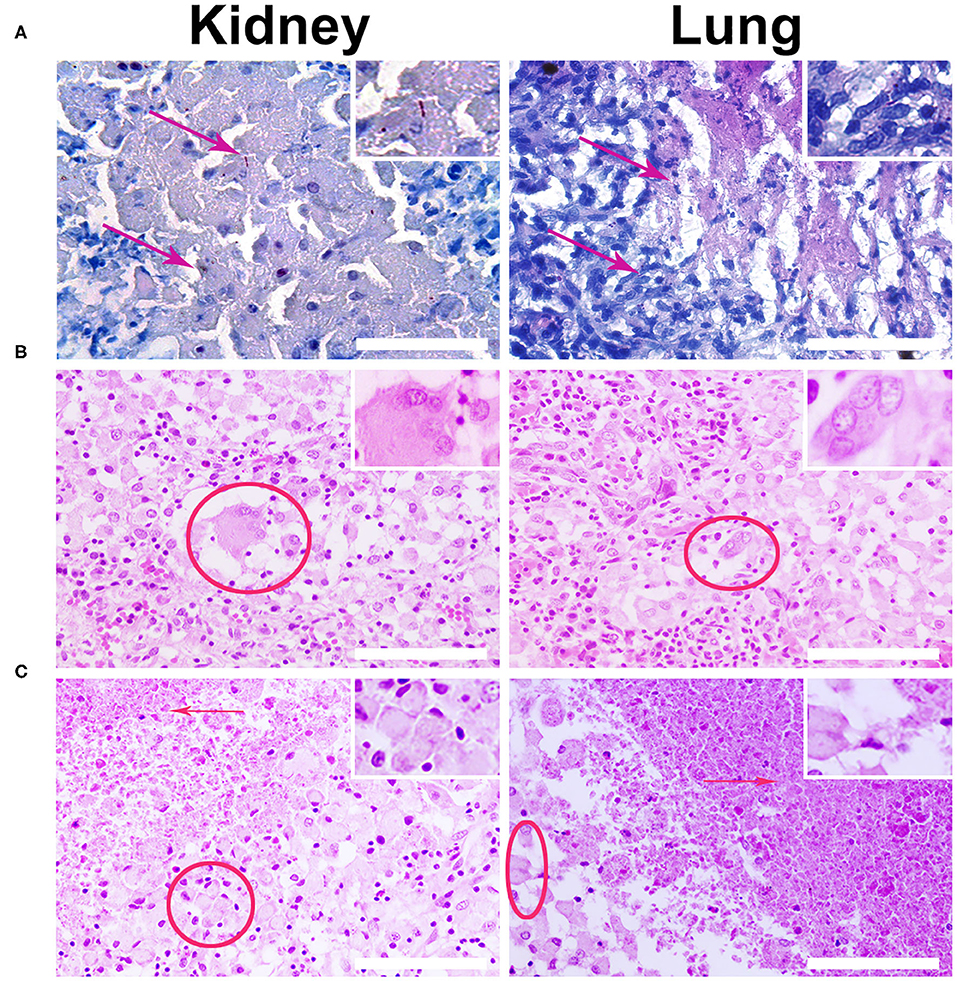
Figure 6. Histological analysis of the kidney and lung tissue samples. (A) Representative images of the specific M. tuberculosis (Mtb) inflammation of the kidney and lung were stained according to Ziehl–Nielsen. Red arrows designate the acid-resistance bacteria (Mtb) in the kidney and lung. Scale bars, 300 μm. (B) Biopsy histological assessment staining H&E of the kidney and lung wall inoculated with Mtb. Giant multinucleated cells of Langhans are indicated by red solid ellipse. (C) Red arrows point to caseous necrosis and epithelioid cells (red ellipse) as the specific histological markers of the tuberculosis inflammation. Staining by H&E. Scale bars, 200 μm.
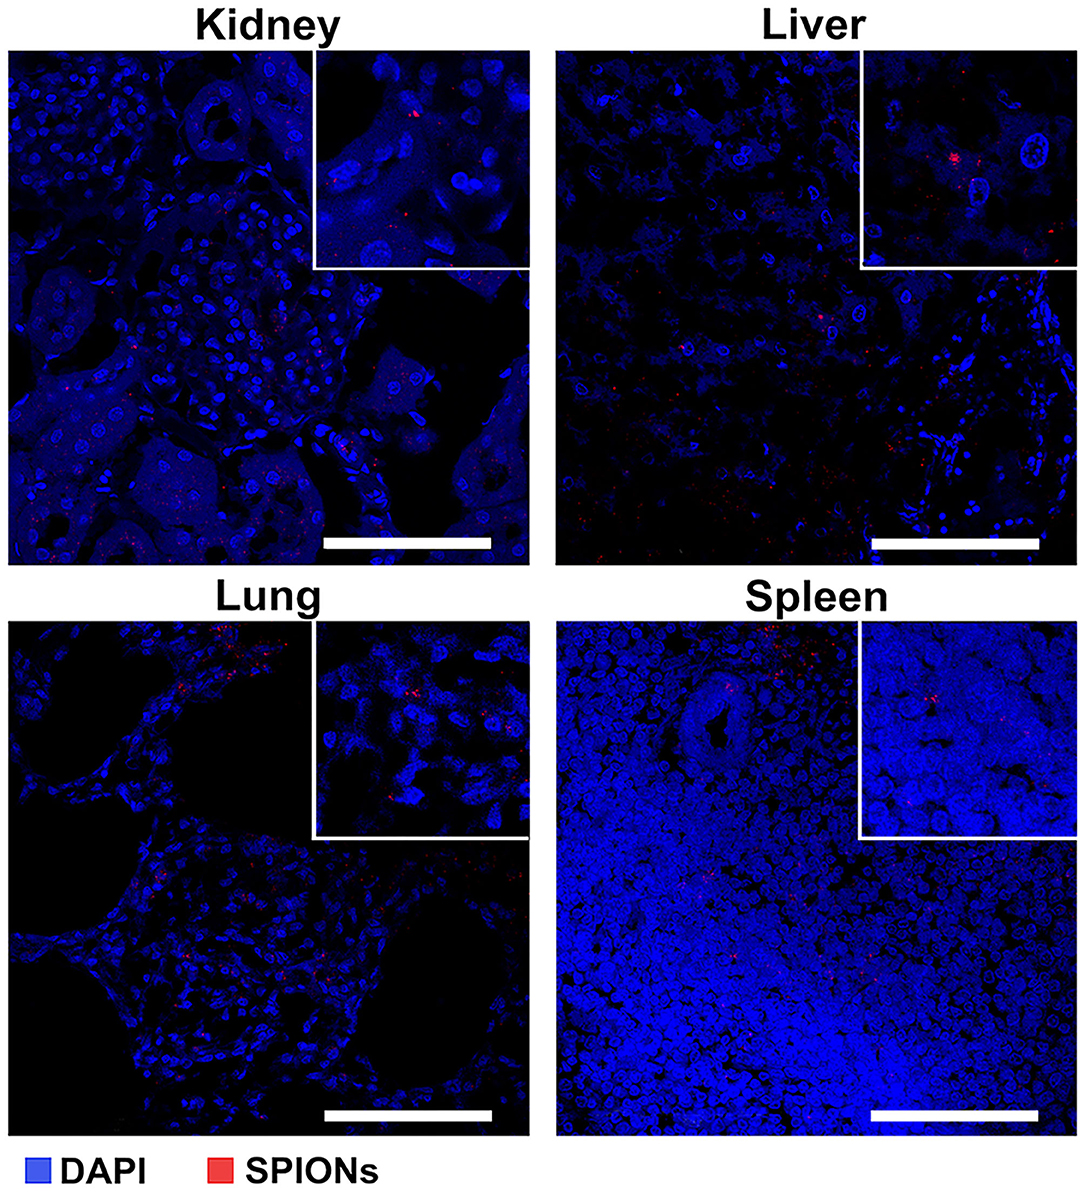
Figure 7. Assessment of the SPION-labeled MCSs accumulation in different organs (kidney, liver, lung, and spleen). Nuclei were stained with DAPI (blue). SPIONs were detected by reflected laser scanning (red). Scale bars, 100 μm.
Biodistribution Analysis of SPIONs-Labeled MSCs by NLR-M2 Measurements
We performed NLR-M2 measurements on the 10% formalin-fixed organ samples of TB. The biodistribution as well as the kinetics of cells accumulated in different organs and tissues were determined in the healthy rabbits on the days 2, 3, 7 after injection of the MSCs loaded with SPIONs. The following organs were studied: (i) kidneys; (ii) lungs; (iii) liver; (iv) spleen; (v) paratracheal lymph nodes; (vi) heart; (vii) brain; (viii) pancreas; (ix) stomach; (x) small intestine; (xi) colon; (xii) bladder; (xiii) femur; (xiv) ovaries; (xv) inguinal lymph nodes; (xvi) blood. The magnetically responsive samples were measured at two field scan frequencies, Fsc = 8 and 0.25 Hz to elucidate their magnetic state (single- or multi-domain). The M2(H) dependences of organs giving the large signals, similar to those from SPION-labeled MSCs in PBS (kidneys, lungs, liver, spleen, paratracheal lymph nodes) together with the hysteretic response from kidneys at different time points after injection are presented in Figure 8, Table 2.
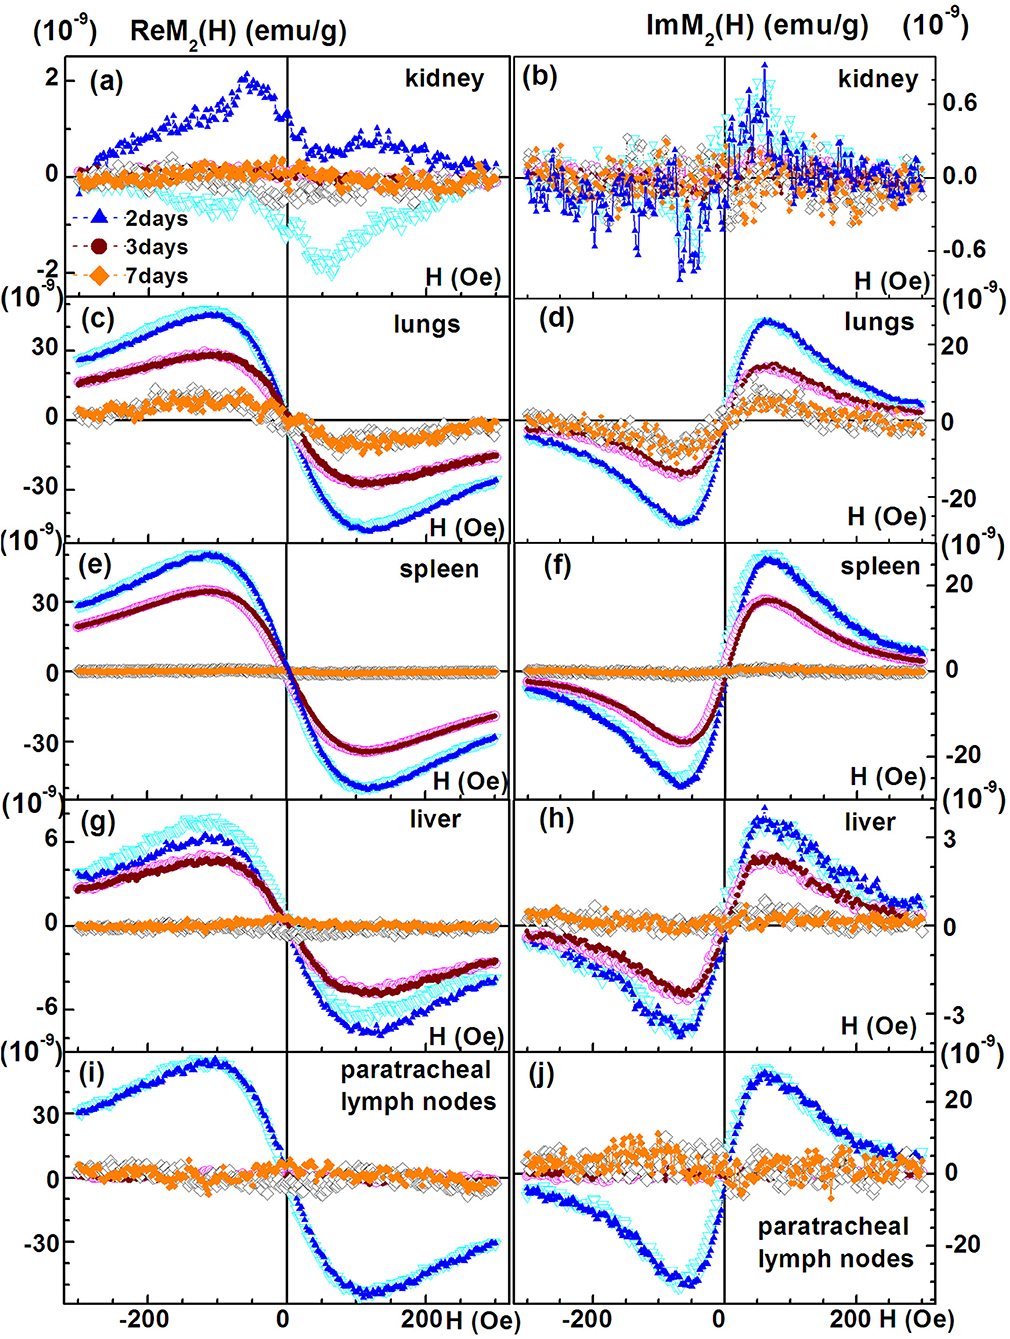
Figure 8. Real and imaginary parts of the non-linear magnetic response as functions of the dc magnetic field direct (filled symbols) and reverse (open symbols) scans with Fsc= 8 Hz for kidney, (A,B); lungs, (C,D); spleen, (E,F); liver, (G,H); and paratracheal lymph nodes, (I,J) at different time points following injection of SPION-labeled MSCs. Except of kidney other organs' probes reveal SPION-like M2 response.
Table 2. Biodistribution of SPION-labeled MSCs in animals with renal TB at different time points.
The signals from lungs, liver, spleen, paratracheal lymph nodes registered 2 days after injection together with their fitting curves are presented in Figure 9. The 2- and 3-day parameters for these organs are presented in Table 1. The probes of other organs (Supplementary Figures 4, 5, Table 2) reveal the similar hysteretic M2 signals, except of pancreas and femur where the H hystereses decrease at reducing the H-scan frequency down to 0.25 Hz. The remaining organs (ovaries and inguinal lymph nodes) as well as blood do not show the presence of MNPs at the sensitivity level of the setup. In Table 2 the amplitudes of the real part of the M2 response and the corresponding “coercive forces” HC2 [that is analog of the coercive force of M(H)] are presented for all magnetically responsive organs. This allows of semi-quantitative comparison and assessment of the retention of SPION-labeled MSC in all organs including those exhibiting hysteretic response where the data processing formalism is inapplicable.
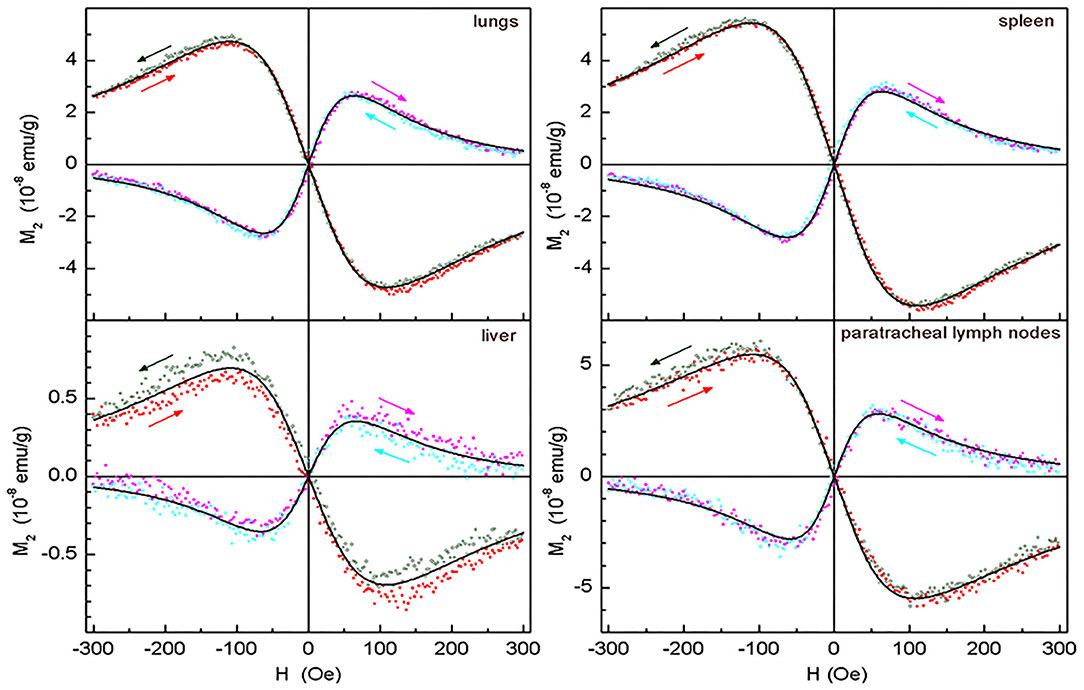
Figure 9. Real and imaginary parts of the non-linear magnetic response as functions of the dc magnetic field direct (filled symbols) and reverse (open symbols) scans with Fsc= 8 Hz, with their best fits for lungs, spleen, liver, and paratracheal lymph nodes following 2 days after intravenous injection of SPION-labeled MSCs. Only every 10th experimental point is shown. Obtained parameters are presented in Table 1.
The M2(H) responses from the healthy rabbits (injected by SPIONs-labeled MSC in the same manner as TB rabbits) are presented in Supplementary Figures 6–8. They demonstrated the predominant accumulation of cells in kidneys,colon, brain, bladder, femur, paratracheal lymph nodes and, to a lesser extent, in lungs, liver, and spleen after 72 h of administration with the subsequent significant decrease of the signal over the period of 7 days accompanied in some organs (brain, femur, paratracheal lymph nodes) by essential change of its dependence on the field H.
Pharmacokinetic Modeling of MSCs Biodistribution
After estimation, the parameters were used for simulations to determine the fitting of the data. As shown in Figure 10, the simulations fit the data very well, suggesting the validity of the model for the MSC biodistribution in rabbits. According to the results, the venous blood releases the MSCs very quickly, resulting in an immediate peak in arterial blood and a peak in all investigated organs after some delay. Due to depletion mechanisms, all concentrations decrease after all MSCs left the system.
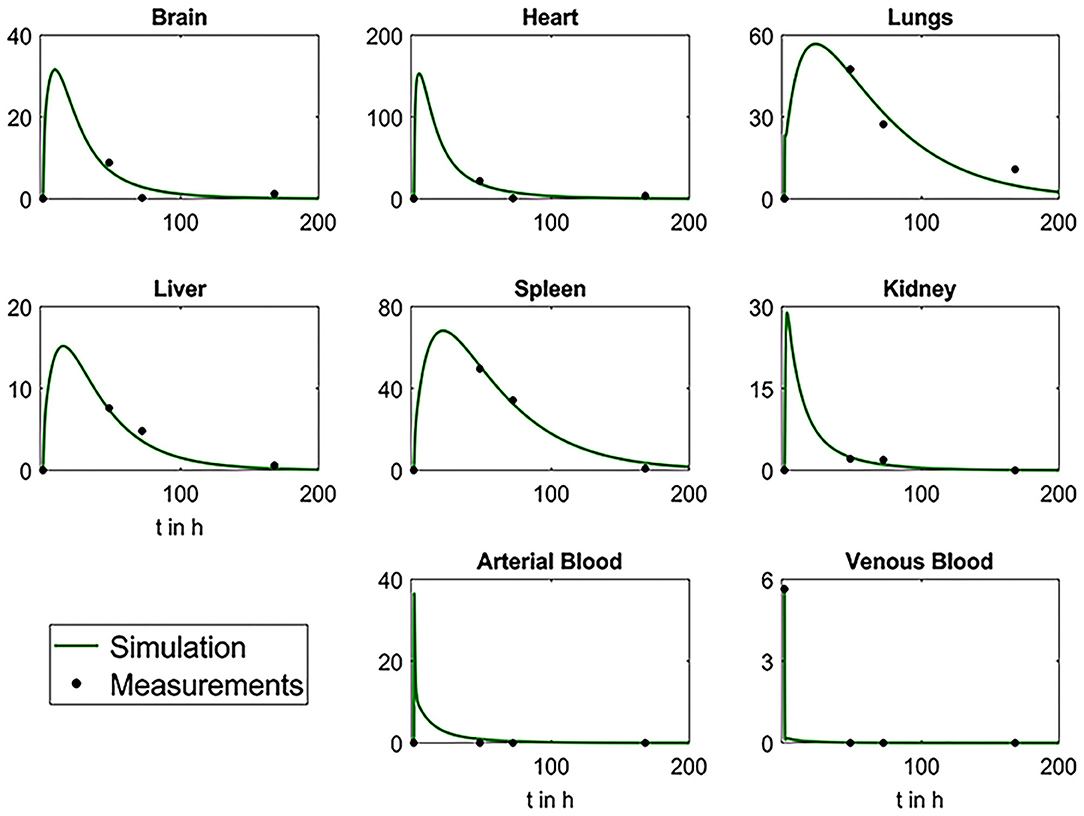
Figure 10. Plots depicting the comparative analysis of biodistribution data and results from simulations with mathematical model. Black dots represent the mean values of the measured experimental data and green curves the simulation results.
Discussion
Cell labeling with magnetic nanoparticles provides an opportunity (due to magnetism) to detect the cells by high-resolution magnetic resonance imaging techniques and enables the possibility of magnetic manipulation by an external magnetic field [55–59]. Particularly, the application of superparamagnetic nanoparticles allows the detection of labeled MSCs by highly sensitive non-linear magnetic response measurements [36]. Furthermore, employment of the non-linear response allows the differentiation of the signal from exogenous magnetic nanoparticles (including the paramagnetic contribution from hemoglobin, ferritin, hemosiderin) due to large non-linearity of the magnetic field dependence of the MNPs magnetization achieving an acceptable signal-to-noise ratio [37]. Of note, diamagnetic species do not provide a contribution to the M2 response. In the current study synthesized, dextran-coated SPIONs possess a negative MR contrast enhancing the properties (i.e., R2 relaxation rates) that correspond to the previously reported agents [60, 61]. The magnetic labeling with SPIONs appeared to be very efficient despite a negative surface charge registered by electrophoretic measurements in the PBS buffer at pH 7–6.8. The high cellular uptake is due to the presence of protein entities from the culture medium. Formation of the protein corona around the SPION clusters compensates the surface charge and facilitates their penetration through the MSC membrane. Subsequent NLR-M2 measurements confirmed superparamagnetism of the obtained nanosuspension (Figures 3B,C) that was also observed in the SPION-labeled MSCs. The M2(H) dependencies of MSCs with SPIONs [co-incubated with C(Fe) = 150 μg/ml] are presented in Figure 5. The obtained parameters (Table 1) differed essentially from those of SPIONs suspended in water that suggests the formation of larger aggregates, ~160 SPIONs per aggregate, with the average amount of the aggregates per cell ~ 8.3 × 10⁴ and the mean magnetic moment of aggregates 31,600μB, close to the SPION magnetic moment. The obtained parameters were used for characterization of the SPIONs magnetic state in the organs of experimental animals exhibiting the SPION-like M2(H) response.
The M2(H) signals from the rabbit lungs, liver, spleen, and paratracheal lymph nodes 2 days after the injection exhibited nearly identical dependences on magnetic field differing only by the amplitudes. Moreover, they appeared to be similar to the SPION-labeled MSC suspensions. The data processing, including the data 3 days after injection, revealed quite close magnetic parameters for all tissues and only slightly differing from those of the injected suspension, as presented in Table 1. The only exception is the data on 3-day paratracheal lymph nodes, for which the parameters are uncertain due to too small non-linear response. Therefore, the aggregate state of SPIONs in the tissues almost has not changed in the above-mentioned organs after injection except, may be, the lymph nodes. The reduction of the anisotropy parameters within the error bars, Ea and Ha, could be due to some rearrangement of the aggregates in MSCs inside the tissues to become more compact. The magnetization is proportional to the signal amplitude and to the concentration of SPIONs NSP. As the values of the rest quantities are the same, it became possible to recalculate the known SPIONs content for the SPIONs-labeled MSCs employed for the injection to rabbit, via the ratios, to obtain the SPIONs concentrations in the tissues. They are seen to vary within the order of magnitude in different tissues, from the lowest concentration in liver to the highest in paratracheal lymph nodes. From comparison of the 2- and 3-day parameters, a systematic reduction is seen for and, thus, for NSP, evidencing withdrawal of SPIONs from the tissues with time, this effect being amazingly great for lymph nodes. A small systematic decrease of MC and τN (proportional to MC) is also observed. This finding indicates the destruction of MSCs with the subsequent damage of SPIONs aggregates in the course of withdrawal.
Detection of the superparamagnetic signal in the cells over a period of 7 days allowed of further in vivo biodistribution studies in the preclinical model of renal TB in rabbits despite a reduction of the nanoparticles by cell divisions.
Following intravenous administration SPION-labeled MSCs accumulated predominantly in the lung within the first 3 days with a short-term retention in liver and spleen (Figure 8, Table 1). Intriguingly, stem cells were eliminated from the blood pool within the first hours after administration and were not detected in the blood for the whole follow-up period of 7 days. The distribution pattern corresponded to the previously reported data of other studies [27, 62, 63]. Furthermore, highly sensitive NLR-M2 measurements also showed an accumulation of MSCs in parenchyma of Mtb-affected kidneys. Subsequent histological analysis confirmed the presence of nanoparticle-labeled MSCs in the lung parenchyma, liver, spleen, and kidneys (Figure 7). Intriguingly, due to the high sensitivity of the applied method we detected a significant retention of MSCs in the paratracheal lymph nodes in the first 2 days after intravenous injection of labeled MCs. Previously, MSCs were shown to infiltrate into Mtb-infected organs [64]. Indeed, specific Ziehl-Neelsen staining for Mtb confirmed the dissemination of bacteria from kidneys to lung and paratracheal lymph nodes. The established PBPK model allowed us to make predictions about the early behavior of the MSC distribution. High correlation between data points and simulations suggests that the model is applicable for measuring the biodistribution of MSCs in rabbits. The main limitation is the lack of early data points (within the first hours after injection) that is important for the refining of the model parameters.
It is important to note that only the hysteretic M2 response from the kidney probe was present at any time points after injection of MSC-SPIONs. Moreover, the decreasing of Fsc (this provides more time to relax for the SPION magnetite cores) did not change the hysteretic character of the signal. This suggests destruction of the dextran SPIONs shell in the inflamed kidney that makes it possible for magnetite cores to stick together under the action of dipolar forces. The latter leads to the formation of larger size magnetite fragments, in which the minimization of magnetostatic energy can be achieved by the formation of domains. In the domains, magnetic relaxation is determined by fast motion of the domain walls, whereas the hysteresis is determined by pinning the magnetic moments on inhomogeneities. Therefore, the field hysteresis of the M2 response is practically independent of the H- scan frequency in accordance with the experimental data. Intriguingly, similar features are observed for the M2response of some other organs (i.e., stomach, small intestine, colon, bladder) indicating the destruction of the dextran shell of SPIONs in these tissues (see Supplementary Figures 4, 5, Table 2) like in kidneys. It is interesting to note that in all organs exhibiting the hysteretic M2 response its amplitude 3 days after the injection decreased in comparison with 2 days and then increased in 7 days following the injection (Table 2). This indicates transformation of the cells state (probably, the cell destruction) and the state of SPIONs aggregates inside them, probably, destruction of the dextran shell accompanied by rearrangement of SPIONs under the dipolar forces acting between them. Such transformation in different tissues occurs probably with different rates. Observation of the unusual “negative” field hysteresis in ReM2(H) response of brain and heart 2 days following the injection, which then changed to normal “positive” 1 in 3 and 7 days following the injection with the larger signal amplitude in 7 days, supports the suggestion on the transformation and evidences its slower rate in these organs (Table 2, Supplementary Figure 4).
The field hysteresis increases in the signals on the days 2, 3, and 7 following the injection of SPION-labeled cells that indicates the destruction of the SPIONs dextran shell. It should be noted that a qualitative analysis of changes in the shape of the M2-response curves and their amplitudes (similar to performed above) makes it possible to obtain information on the evolution of the state of MSC-SPIONs in various organs and tissues.
The confirmation of MSCs retention in the inflammation sites and their anti-inflammatory activity could be employed for the development of novel cellular anti-Mtb therapies [19, 65]. Indeed, in the phase I clinical trial autologous MSCs were administered in 36 MDR-TB patients receiving chemotherapy [23]. The authors reported feasibility of the cells injection and 81% successful outcomes (as compared to 42% in control arm) with radiological improvements [24]. Another approach for the treatment of Mtb could be based on the fact that MSCs presented in extra-pulmonary and pulmonary tuberculosis granulomas are harboring Mtb bacilli mechanistically sheltering them from anti-TB drugs and inflammatory cytokines [66]. As was recently shown by Jain et al. isolated CD45−Sca1+CD73+ MSCs from the lungs of infected mice allowed of the H37Rv drug-tolerance (for isoniazid and rifampicin) due to the expression of ABC transporters ABCC1 and ABCG2 on the MSCs [66]. Therefore, targeting or modulating the activity of resident MSCs in granulomas could enhance the efficacy of a tuberculosis treatment. The inhibition of PGE2 signaling pathway reversed pro-bacterial effects of inflammatory cytokines including INFγ and TNFα on Mtb-containing MSCs [66].
Conclusion
This study demonstrates the recruitment of intravenously administered MSCs to the Mtb-affected sites in a preclinical model of renal tuberculosis in rabbits that can be further explored for the development of novel anti-TB treatment approaches. Furthermore, the study also demonstrates a highly sensitive method of non-linear magnetic response measurements for a sensitive biodistribution analysis of SPIONs-labeled stem cells and for the tracing of their state transformation over a period of time at different organs by the change of M2(H) dependencies. NLR-M2 studies allowed of the detection of MSCs containing nanoparticles with a sensitivity of 1300 cells. This provides an opportunity to target cells even in organs with low proton density (i.e., lungs) where conventional MR imaging techniques cannot be applied.
Data Availability Statement
The datasets presented in this study can be found in online repositories. The names of the repository/repositories and accession number(s) can be found in the article/Supplementary Material.
Ethics Statement
All animal experiments had been approved by the ethical committee of Saint Petersburg Scientific Research Institute of Phthisiopulmonology, Russian Ministry of Health Care (extract from the meeting Protocol No. 25, 10.28) and were in accordance with international guidelines of the Federation of European Animal Science Associations (FELASA) following EU-Directive 2010/63/EU.
Author Contributions
NY, AS, VR, VD, and MS conceived the project, were responsible for experimental design, performed experiments, and drafted the manuscript. NY, NM, DB, LY, BNi, DK, AM, TV, PY, IS, VR, VD, YM, AK, WL, GM, AS, and BNa performed the experiments, analyzed the data. All authors reviewed the manuscript and approved the version to be published.
Funding
This study was supported by the German Research Foundation DFG (SFB824/3), Russian Foundation for Basic Research project No 19-58-45012, the Technische Universität München (TUM) within the DFG funding programme Open Access Publishing, and the Ministry of Science and Higher Education within the State assignment no. 0103-2019-0012. The financial support from the Department of Science and Technology (DST) (International Bilateral Cooperation Division) (INT/RUS/RFBR/380), Government of India to AS is acknowledged.
Conflict of Interest
The authors declare that the research was conducted in the absence of any commercial or financial relationships that could be construed as a potential conflict of interest.
Acknowledgments
The authors would like to acknowledge Dr. Irina Bogolyubova for the preparations for transmission electron microscopy analysis.
Supplementary Material
The Supplementary Material for this article can be found online at: https://www.frontiersin.org/articles/10.3389/fphy.2021.625622/full#supplementary-material
Supplementary Figure 1. Bright-light microscopy analysis of the rabbit MSCs morphology on the 1st day of isolation (i) and following 3 days (ii) of cell cultivation. MSCs differentiation properties: Adipogenic differentiation. Stained with Oil Red; Osteogenic differentiation. Staining of alkaline phosphatase and von Kossa reaction; Chondrogenic differentiation. Staining with toluidine blue, safranin and alcian blue, respectively. Scale bar, 100 μm.
Supplementary Figure 2. T2 proton relaxation dynamics in a magnetic field for MNPs water suspensions. Gray bars–MNPs in a magnetic field of 7.1 T (iron concentration 0.02 mM). Yellow bars–MNPs in a magnetic field of 0.33 T, iron concentration 0.02 mM. Blue bars–MNPs in a magnetic field of 7.1 T, iron concentration 2 mM. Data is presented as M ± SD.
Supplementary Figure 3. Macrophotos of the intact kidney wall (control) and pathological changes of the kidney 4 weeks following the intraparenchymal injection of Mtb, respectively. Black arrows indicate the focuses of TB infection. Hypersensitivity skin test on day 30 following Mtb inoculation.
Supplementary Figure 4. Real and imaginary parts of the non-linear magnetic response as functions of the dc magnetic field (Fsc = 8 Hz) of brain, heart, pancreas, and stomach, exhibiting hysteretic (non-SPION-like) M2-signals, at different time points after injection of SPION-labeled MSCs.
Supplementary Figure 5. Real and imaginary parts of the non-linear magnetic response as functions of the dc magnetic field (Fsc = 8 Hz) of small intestine, colon, femur, and bladder, exhibiting weak hysteretic (non-SPION-like) M2 signals, at different time points after injection of SPION-labeled MSCs.
Supplementary Figure 6. Real and imaginary parts of the non-linear magnetic response as functions of the dc magnetic field (Fsc = 8 Hz) of kidney, lungs, liver, spleen, paratracheal lymph nodes of healthy animals on days 3 and 7 following SPION-labeled MSCs injection.
Supplementary Figure 7. Real and imaginary parts of the non-linear magnetic response as functions of the dc magnetic field (Fsc = 8 Hz) of brain, heart, pancreas, and stomach of healthy animals on days 3 and 7 following SPION-labeled MSCs injection.
Supplementary Figure 8. Real and imaginary parts of the non-linear magnetic response as functions of the dc magnetic field (Fsc = 8 Hz) of small intestine, colon, femur, and bladder of healthy animals on days 3 and 7 following SPION-labeled MSCs injection.
References
1. Flynn JL, Chan J, Lin PL. Macrophages and control of granulomatous inflammation in tuberculosis. Mucosal Immunol. (2011) 4:271–8. doi: 10.1038/mi.2011.14
2. Natarajan A, Beena PM, Devnikar AV, Mali S. A systemic review on tuberculosis. Indian J Tuberc. (2020) 67:295–311. doi: 10.1016/j.ijtb.2020.02.005
3. Urbanowski ME, Ordonez AA, Ruiz-Bedoya CA, Jain SK, Bishai WR. Cavitary tuberculosis: the gateway of disease transmission. Lancet Infect Dis. (2020) e117–28. doi: 10.1016/S1473-3099(20)30148-1
4. World Health Organization. Global Tuberculosis Report 2019. Geneva: World Health Organization (2019). Avaialble online at: http://www.who.int/tb/publications/global_report/archive/en/
5. Figueiredo AA, Lucon AM, Srougi M. Urogenital tuberculosis. Microbiol Spectr. (2017) 5. doi: 10.1128/microbiolspec.TNMI7-0015-2016
6. Leonard MK, Blumberg HM. Musculoskeletal tuberculosis. Microbiol Spectr. (2017) 5. doi: 10.1128/microbiolspec.TNMI7-0046-2017
7. Dunn RN, Ben Husien M. Spinal tuberculosis: review of current management. Bone Joint J. (2018) 100-B:425–31. doi: 10.1302/0301-620X.100B4.BJJ-2017-1040.R1
8. Rodriguez-Takeuchi SY, Renjifo ME, Medina FJ. Extrapulmonary tuberculosis: pathophysiology and imaging findings. Radiographics. (2019) 39:2023–37. doi: 10.1148/rg.2019190109
9. Liang J, Zhang H, Hua B, Wang H, Lu L, Shi S, et al. Allogenic mesenchymal stem cells transplantation in refractory systemic lupus erythematosus: a pilot clinical study. Ann Rheum. (2010) 69:1423–9. doi: 10.1136/ard.2009.123463
10. Shi M, Liu Z, Wang Y, Xue R, Sun Y, Zhang M, et al. A pilot study of mesenchymal stem cell therapy for acute liver allograft rejection. Stem Cells Transl Med. (2017) 6:2053–61. doi: 10.1002/sctm.17-0134
11. Caplan H, Olson SD, Kumar A, George M, Prabhakara KS, Wenzel PI, et al. Mesenchymal stromal cell therapeutic delivery: translational challenges to clinical application. Front Immunol. (2019) 10:1645. doi: 10.3389/fimmu.2019.01645
12. Naji A, Eitoku M, Favier B, Deschaseaux F, Rouas-Freiss N, Suganuma N. Biological functions of mesenchymal stem cells and clinical implications. Cell Mol Life Sci. (2019) 76:3323–48. doi: 10.1007/s00018-019-03125-1
13. Dominici M, Le Blanc K, Mueller I, Slaper-Cortenbach I, Marini F, Krause D, et al. Minimal criteria for defining multipotent mesenchymal stromal cells. The International Society for Cellular Therapy position statement. Cytotherapy. (2006) 8:315–7. doi: 10.1080/14653240600855905
14. Phinney DG. Functional heterogeneity of mesenchymal stem cells: implications for cell therapy. J Cell Biochem. (2012) 113:2806–12. doi: 10.1002/jcb.24166
15. Mao F, Tu Q, Wang L, Chu F, Li X, Li HS, et al. Mesenchymal stem cells and their therapeutic applications in inflammatory bowel disease. Oncotarget. (2017) 8:38008–21. doi: 10.18632/oncotarget.16682
16. Andrzejewska A, Lukomska B, Janowski M. Concise review: mesenchymal stem cells: from roots to boost. Stem Cells. (2019) 37:855–64. doi: 10.1002/stem.3016
17. Bhat IA, Sivanarayanan TB, Somal A, Pandey S, Bharti MK, Panda BSK, et al. An allogenic therapeutic strategy for canine spinal cord injury using mesenchymal stem cells. J Cell Physiol. (2019) 234:2705–18. doi: 10.1002/jcp.27086
18. Yudintceva NM, Nashchekina YA, Mikhailova NA, Vinogradova TI, Yablonsky PK, Gorelova AA, et al. Urethroplasty with a bilayered poly-D,L-lactide-co-ε-caprolactone scaffold seeded with allogenic mesenchymal stem cells. J Biomed Mater Res B Appl Biomater. (2019) 108:1010–21. doi: 10.1002/jbm.b.34453
19. Parida SK, Madansein R, Singh N, Padayatchi N, Master I, Naidu K, et al. Cellular therapy in tuberculosis. Int J Infect Dis. (2015) 32:32–8. doi: 10.1016/j.ijid.2015.01.016
20. Khan A, Hunter RL, Jagannath C. Emerging role of mesenchymal stem cells during tuberculosis: the fifth element in cell mediated immunity. Tuberculosis. (2016) 101:S45–52. doi: 10.1016/j.tube.2016.09.019
21. Regmi S, Pathak S, Kim JO, Yong CS, Jeong JH. Mesenchymal stem cell therapy for the treatment of inflammatory diseases: challenges, opportunities, future perspectives. Euro J Cell Biol. (2019) 98:151041. doi: 10.1016/j.ejcb.2019.04.002
22. Dheda K, Booth H, Huggett JF, Johnson MA, Zumla A, Rook GA. Lung remodeling in pulmonary tuberculosis. J Infect Dis. (2005) 192:1201–9. doi: 10.1086/444545
23. Skrahin A, Ahmed RK, Ferrara G, Rane L, Poiret T, Isaikina Y, et al. Autologous mesenchymal stromal cell infusion as adjunct treatment in patients with multidrug and extensively drug-resistant tuberculosis: an open-label phase 1 safety trial. Lancet Respir Med. (2014) 2:108–22. doi: 10.1016/S2213-2600(13)70234-0
24. Skrahin A, Jenkins HE, Hurevich H, Solodovnikova V, Isaikina Y, Klimuk D, et al. Effectiveness of a novel cellular therapy to treat multidrug-resistant tuberculosis. J Clin Tuberc Other Mycobact Dis. (2016) 4:21–7. doi: 10.1016/j.jctube.2016.05.003
25. Yudintceva NM, Bogolyubova IO, Muraviov AN, Sheykhov MG, Vinogradova TI, Sokolovich EG, et al. Application of the allogenic mesenchymal stem cells in the therapy of the bladder tuberculosis. J Tissue Eng Regen Med. (2018) 12:e1580–93. doi: 10.1002/term.2583
26. Mangraviti A, Tzeng SY, Gullotti D, Kozielski KL, Kim JE, Seng M, et al. Non-virally engineered human adipose mesenchymal stem cells produce BMP4, target brain tumors, extend survival. Biomaterials. (2016) 100:53–66. doi: 10.1016/j.biomaterials.2016.05.025
27. Nenasheva T, Nikolaev A, Diykanov D, Sukhanova A, Tcyganov E, Panteleev A, et al. The introduction of mesenchymal stromal cells induces different immunological responses in the lungs of healthy M. tuberculosis infected mice. PLoS ONE. (2017) 12:e0178983. doi: 10.1371/journal.pone.0178983
28. Pacioni S, D'Alessandris QG, Giannetti S, Morgante L, Cocc è V, Bonomi A, et al. Human mesenchymal stromal cells inhibit tumor growth in orthotopic glioblastoma xenografts. Stem Cell Res Ther. (2017) 8:53. doi: 10.1186/s13287-017-0516-3
29. Perico N, Casiraghi F, Todeschini M, Cortinovis M, Gotti E, Portalupi V, et al. Long-term clinical and immunological profile of kidney transplant patients given mesenchymal stromal cell immunotherapy. Front Immunol. (2018) 9:1359. doi: 10.3389/fimmu.2018.01359
30. Robb KP, Fitzgerald JC, Barry F, Viswanathan S. Mesenchymal stromal cell therapy: progress in manufacturing and assessments of potency. Cytotherapy. (2019) 21:289–306. doi: 10.1016/j.jcyt.2018.10.014
31. Binello E, Germano IM. Stem cells as therapeutic vehicles for the treatment of high-grade gliomas. Neuro Oncol. (2012) 14:256–65. doi: 10.1093/neuonc/nor204
32. Timothy EG, Krueger D, Thorek LJ, Denmeade SR, Isaacs JT, Brennen WN. Concise review: mesenchymal stem cell-based drug delivery: the good, the bad, the ugly, the promise. Stem Cells Transl Med. (2018) 7:651–63. doi: 10.1002/sctm.18-0024
33. Huang X, Zhang F, Wang Y, Sun X, Choi KY, Liu D, et al. Design considerations of iron-based nanoclusters for noninvasive tracking of mesenchymal stem cell homing. ACS Nano. (2014) 8:4403–14. doi: 10.1021/nn4062726
34. Shevtsov MA, Nikolaev BP, Ryzhov VA, Yakovleva LY, Marchenko YY, Parr MA, et al. Ionizing radiation improves glioma-specific targeting of superparamagnetic iron oxide nanoparticles conjugated with cmHsp70.1 monoclonal antibodies (SPION-cmHsp70.1). Nanoscale. (2015) 7:20652–64. doi: 10.1039/C5NR06521F
35. Li K, Nejadnik H, Daldrup-Link HE. Next-generation superparamagnetic iron oxide nanoparticles for cancer theranostics. Drug Discov Today. (2017) 22:1421–9. doi: 10.1016/j.drudis.2017.04.008
36. Shevtsov M, Stangl S, Nikolaev B, Yakovleva L, Marchenko Y, Tagaeva R, et al. Granzyme B functionalized nanoparticles targeting membrane Hsp70-positive tumors for multimodal cancer theranostics. Small. (2019) 15:e1900205. doi: 10.1002/smll.201900205
37. Ryzhov VA, Multhoff G, Shevtsov M. Detection of magnetosome-like structures in eukaryotic cells using nonlinear longitudinal response to ac field. Appl Magn Reson. (2019) 50:943–57. doi: 10.1007/s00723-019-01122-y
38. Reyes M, Lund T, Lenvik T, Aguiar D, Koodie L, Verfaillie CM. Purification and ex vivo expansion of postnatal human marrow mesodermal progenitor cells. Blood. (2001) 98:2615–25. doi: 10.1182/blood.V98.9.2615
39. Ryzhov VA, Kiselev IA, Smirnov OP, Chernenkov YP, Deriglazov VV, et al. Comprehensive characterization of magnetite-based colloid for biomedical applications. Appl Phys A. (2019)125:322. doi: 10.1007/s00339-019-2596-7
41. Ryzhov VA, Larionov II, Fomichev VN. On the spurious signal in the longitudinal nonlinear susceptibility of magnets at the second harmonic of excitation frequency. Tech Phys. (1996) 41:620–6.
42. Gullity BD, Graham CD. Introduction to Magnetic Materials. New York, NY: IEEE Press; Wiley (2009).
43. Ryzhov VA, Pleshakov IV, Nechitailov AA, Glebova NV, Pyatyshev EN, Malkova AV, et al. Magnetic study of nanostructural composite material based on cobalt compounds and porous silicon. Appl Magn Resonan. (2014) 45:339–52. doi: 10.1007/s00723-014-0527-5
44. Shevtsov MA, Nikolaev BP, Ryzhov VA, Yakovleva LY, Dobrodumov AV, Marchenko YY, et al. Brain tumor magnetic targeting and biodistribution of superparamagnetic iron oxide nanoparticles linked with 70-kDa heat shock protein study by nonlinear longitudinal response. J Magn Magn Mater. (2015) 388:123–34. doi: 10.1016/j.jmmm.2015.04.030
45. Wang H, Liang X, Xu ZP, Crawford DHG, Liu X, Roberts MS. A physiologically based kinetic model for elucidating the in vivo distribution of administered mesenchymal stem cells. Sci Rep. (2016) 6:22293. doi: 10.1038/srep22293
46. Brown WH, Pearce L, Van Allen CM. The relation between body and organ weights in the rabbit. J Exp Med. (1926) 44:635–51. doi: 10.1084/jem.44.5.635
47. Das RM, Thurlbeck WM. The events in the contralateral lung following pneumonectomy in the rabbit. Lung. (1979) 156:165–72. doi: 10.1007/BF02714007
48. Baker-Zander S, Sell S. A histopathologic and immunologic study of the course of syphilis in the experimentally infected rabbit. Demonstration of long-lasting cellular immunity. Am J Pathol. (1980) 101:387–414.
49. Ludbrook J, Graham WF. The role of cardiac receptor and arterial baroreceptor reflexes in control of the circulation during acute change of blood volume in the conscious rabbit. Circ Res. (1984) 54:424–35. doi: 10.1161/01.res.54.4.424
50. Thomson AB. Defined formula diets alter jejunal and colonic uptake of lipids in rabbits with intact intestinal tract and following ileal resection. Res Exp Med. (1986) 186:413–426. doi: 10.1007/BF01852194
51. Brown RP, Delp MD, Lindstedt SL, Rhomberg LR, Beliles RP. Physiological parameter values for physiologically based pharmacokinetic models. Toxicol Ind Health. (1997) 13:407–84. doi: 10.1177/074823379701300401
52. Hashimoto T, Ishigooka M, Zermann DH, Sasagawa I, Nakada T. Effects of estrogen and progesterone on urinary bladder in female rabbit: evaluation by quantitative morphometric analysis. Urology. (1999) 53:642–6. doi: 10.1016/s0090-4295(98)00528-7
53. Debray L, Le Huerou-Luron I, Gidenne T, Fortun-Lamothe L. Digestive tract development in rabbit according to the dietary energetic source: correlation between whole tract digestion, pancreatic and intestinal enzymatic activities. Comp Biochem Physiol. (2003) 135:443–55. doi: 10.1016/s1095-6433(03)00112-0
54. Ermayanti NGAM, Suaskara IBM, Setyawati I, Suarni NMR, Widhyastini IGAM. Effect of cod liver oil supplementation in commercial feed on reproductive organs weight and ovarian follicles size of local rabbits. Int J Life Sci. (2019) 3:41–51. doi: 10.29332/ijls.v3n2.309
55. Josephson L, Tung CH, Moore A, Weissleder R. High-efficiency intracellular magnetic labeling with novel superparamagnetic-Tat peptide conjugates. Bioconjug Chem. (1999) 10:186–91. doi: 10.1021/bc980125h
56. Wilhelm C, Bal L, Smirnov P, Galy-Fauroux I, Clement O, Gazeau F, et al. Magnetic control of vascular network formation with magnetically labeled endothelial progenitor cells. Biomaterials. (2007) 28:3797–806. doi: 10.1016/j.biomaterials.2007.04.047
57. Wilhelm C, Gazeau F. Universal cell labelling with anionic magnetic nanoparticles. Biomaterials. (2008) 29:3161–74. doi: 10.1016/j.biomaterials.2008.04.016
58. Bhirde A, Xie J, Swierczewska M, Chen X. Nanoparticles for cell labeling. Nanoscale. (2011) 3:142–53. doi: 10.1039/C0NR00493F
59. Kolosnjaj-Tabi J, Wilhelm C, Clement O, Gazeau F. Cell labeling with magnetic nanoparticles: opportunity for magnetic cell imaging and cell manipulation. J Nanobiotechnology. (2013) 11:S7. doi: 10.1186/1477-3155-11-S1-S7
60. Krishnan KM. Biomedical Nanomagnetics: A spin through possibilities in imaging, diagnostics, and therapy. IEEE Trans Magn. (2010) 46:2523–58. doi: 10.1109/TMAG.2010.2046907
61. Estelrich J, Sanchez-Martin MJ, Busquets MA. Nanoparticles in magnetic resonance imaging: from simple to dual contrast agents. Int J Nanomedicine. (2015) 10:1727–41. doi: 10.2147/IJN.S76501
62. Schrepfer S, Deuse T, Reichenspurner H, Fischbein MP, Robbins RC, Pelletier MP. Stem cell transplantation: the lung barrier. Transplant Proc. (2007) 39:573–6. doi: 10.1016/j.transproceed.2006.12.019
63. Gholamrezanezhad A, Mirpour S, Bagheri M, Mohamadnejad M, Alimoghaddam K, Abdolahzadeh L, et al. In vivo tracking of 111In-oxine labeled mesenchymal stem cells following infusion in patients with advanced cirrhosis. Nucl Med Biol. (2011) 38:961–7. doi: 10.1016/j.nucmedbio.2011.03.008
64. Raghuvanshi S, Sharma P, Singh S, Van Kaer L, Das G. Mycobacterium tuberculosis evades host immunity by recruiting mesenchymal stem cells. Proc Natl Acad Sci USA. (2010) 107:21653–8. doi: 10.1073/pnas.1007967107
65. Joshi L, Chelluri LK, Gaddam S. Mesenchymal stromal cell therapy in MDR/XDR tuberculosis: a concise review. Arch Immunol Ther Exp. (2015) 63:427–33. doi: 10.1007/s00005-015-0347-9
Keywords: renal tuberculosis, mesenchymal stem cells, biodistribution, superparamagnetic iron oxide nanoparticles, SPIONs, non-linear magnetic response
Citation: Yudintceva N, Mikhailova N, Bobkov D, Yakovleva L, Nikolaev B, Krasavina D, Muraviov A, Vinogradova T, Yablonskiy P, Samusenko I, Ryzhov V, Deriglazov V, Marchenko Y, Multhoff G, Klapproth AP, Li WB, Nayak B, Sonawane A and Shevtsov M (2021) Evaluation of the Biodistribution of Mesenchymal Stem Cells in a Pre-clinical Renal Tuberculosis Model by Non-linear Magnetic Response Measurements. Front. Phys. 9:625622. doi: 10.3389/fphy.2021.625622
Received: 09 November 2020; Accepted: 29 March 2021;
Published: 28 April 2021.
Edited by:
Zhen Cheng, Stanford University, United StatesReviewed by:
Lionel Gamarra, Albert Einstein Israelite Hospital, BrazilHao Chen, Chinese Academy of Sciences, China
Copyright © 2021 Yudintceva, Mikhailova, Bobkov, Yakovleva, Nikolaev, Krasavina, Muraviov, Vinogradova, Yablonskiy, Samusenko, Ryzhov, Deriglazov, Marchenko, Multhoff, Klapproth, Li, Nayak, Sonawane and Shevtsov. This is an open-access article distributed under the terms of the Creative Commons Attribution License (CC BY). The use, distribution or reproduction in other forums is permitted, provided the original author(s) and the copyright owner(s) are credited and that the original publication in this journal is cited, in accordance with accepted academic practice. No use, distribution or reproduction is permitted which does not comply with these terms.
*Correspondence: Natalia Yudintceva, eXVkaW50Y2V2YUBtYWlsLnJ1; Maxim Shevtsov, bWF4aW0uc2hldnRzb3ZAdHVtLmRl