 Harry W Baxter1,2
 Jie Pang
 Riqing Chen
 Bin Yang
- 1Faculty of Science and Engineering, University of Chester, Thornton Science Park, Chester, United Kingdom
- 2Faculty of Computer and Information Sciences, Fujian Agriculture and Forestry University, Fuzhou, China
- 3Engineering Research Centre of Fujian-Taiwan Special Marine Food Processing and Nutrition, Ministry of Education, Fujian Agriculture and Forestry University, Fuzhou, China
The prospect of being able to move through security without the inconvenience of separating liquids from bags is an exciting one for passengers, and there are important operational benefits for airports as well. Here, two terahertz (THz) systems, 100 GHz sub-THz line scanner and attenuation total reflection-based THz time domain spectroscopy (TDS), have been used to demonstrate the capability of identifying different liquid samples. Liquid samples’ THz complex permittivities are measured and their differences have contributed to the variation of 100 GHz 2D images of volatile liquids with different volumes inside of cannister bottles. The acquired attenuation images at 100 GHz can easily be used to distinguish highly absorbed liquids (Water, Ethanol, Fuel Treatment Chemicals) and low loss liquids (Petrol, Diesel, Kerosene and Universal Bottle Cleaner). The results give a promising feasibility for mm-wave imager and THz spectroscopy to efficiently identify different volatile liquids.
Introduction
In 2019, security restrictions at airports for carry-on luggage have eased significantly since the turbulent response to the 2006 liquid explosives plot. However, one major regulation has endured at most international airports around the world – the requirement that liquids be kept in 100 ml bottles and transferred from baggage into clear plastic bags before being scanned through security [1]. X-ray imaging-based apparatus provides a major tool in checked baggage inspection, as it can detect the form and density of items within luggage as well as other material dependent parameters. Recently, conventional medical computed tomography (CT) scans have been developed and introduced to some European airports, where 3D images of items are computing-processed to combine hundreds of individual X-ray measurements from different angles [2, 3]. The technology offers more detailed and comprehensive image quality; however, it was not able to highlight whether a substance was a solid or a liquid. This limited its ability to flag potentially explosive substances and required much more intervention and analysis from members of staff, which made potentially dangerous substances prone to oversight and human error. The reason this happens is because normal liquids we drink all have densities in the range of around 1.0 g/cc and the average atomic number is similar to the ranges of those major explosives. This is why the airport security system does not allow passengers to carry liquids into an airport checkpoint because they could generate false alarms and slow down the lines.
Because of the limitations of the original x-ray CT, x-ray diffraction, specifically, energy dispersive x-ray diffraction (EDXRD) [4, 5] has now been implemented for performing security checks on luggage and cargo. It is an incredibly powerful non-invasive technique that reports various information regarding the crystalline structure of samples being scanned. This allows it to detect specific materials, as well as identify between solid and liquid substances. It works by incident x-ray beams that interact with the photon matter of the sample materials. Where the beam hits the sample, an electron in an inner shell becomes excited, resulting in its ejection, creating an electron-hole in the electronic structure of the element. This hole is then filled by an electron from a higher energy shell, which expels the difference of energy between the two shells as x-rays which then is picked up the detector. The amount of energy released as x-rays, is unique for different elements, allowing the method to provide information on the elements and substances present within the sample being scanned. Elements and compounds used in explosives can be effectively detected automatically, with minimal need for human intervention. Additionally, the technique can easily detect liquids due to the specific spectra produced by materials in their different forms. Despite this important capability, EDXRD can only cover small, thin areas, making it inefficient as a primary large area screening mechanism. By adding more detectors into the spiral setup, the detection depth could be increased to cover the average luggage size [6].
Making use of X-ray diffraction measurements, however, is a tricky technical problem. To begin with, the diffracted signal is several orders of magnitude weaker than the transmitted signal. So, it’s harder to measure them at all. It’s also much harder to interpret. As a result, even though fingerprinting (more properly called X-ray diffraction tomography) would be pretty promising in identifying threats, the complexity of items in practice has required a more robust and straightforward method to achieve aviation security, precise screening and an acceptable passenger experience. The bulk size and cost of EDXRD are another concern and impediment to widely use the technology.
Millimeter (mm)-waves and Terahertz (THz) radiation, are defined to span frequencies of 30 to 10,000 GHz (10mm–30 µm in wavelength) [7], afford remarkable natural advantages of electromagnetic waves, which are intrinsically safe, non-ionizing and non-destructive, transparent to majority of packaging materials and clothes, and are also sensitive to materials’ microstructural differences [8] and surface properties [9]. The technology has recently been licensed to use for personal security screening at many European and American airports. Whilst identifying contraband items in an airport, for example weapons or firearms, is straightforward, there are many limitations in differentiating between different types of liquids and fluids [10]. As liquids are indistinguishable under most THz and X-ray-based imaging, virtually no airport facilities offer a commercially used THz based imaging system, specifically for determining the identity of different liquids. Due to the nature of strong water absorption to THz radiations, it is an ignored research area to detect volatile liquids by THz radiations. However, THz has many penetration windows in the normal ambient air conditions and also it has different absorption rate to different density of matters [11, 12]. A THz electromagnetic signal can also detect molecular vibrations uniquely, including molecular fingerprints; meanwhile, THz spectroscopy such as Time Domain Spectroscopy (TDS), as a coherent detection system, offers not only absorption information of samples, but also the dielectric permittivity values to uniquely identify different samples [13]. These unique properties mean that THz technology can be used for liquid screening. This paper aims to detect and identify different liquid samples via various THz methods. The first method is the implementation of a 100 GHz (sub-terahertz) Line Scanner to produce high resolution 2D images of sample liquids. This system slides a sample liquid between a THz source and detector in order to produce a plot showing the varying levels of attenuation and penetration throughout a given volume of a variety of liquids. The second method is a THz TDS system, where the attenuation total reflection (ATR) module is applied to operate liquid characterization. The work here demonstrates THz technology an advanced transforming technique for the liquid detection.
Sample Preparation
There were 9 liquid samples prepared for imaging and spectroscopy. The samples were Water(W), Ethanol(E), Petrol 95 Ron Unleaded (P95), Petrol 98 Ron Super-Unleaded (P98), Diesel Oil (DO), 50/50 Petrol & Diesel (PD), Kerosene (KE), Fuel Treatment (FT) and Universal Bottle Cleaner (UC). Each liquid was contained in a Polyvinyl Chloride (PVC) cannister and secured before imaging. All sample liquids were provided by Motrac Ltd., England.
Measurement System and Methodology
100 GHz Line Scanner
The first system used to digitally image the sample liquids is a 2D 100 GHz Line Scanner, shown in Figure 1. The 100 GHz source is an IMPATT diode, and the detector is the GaAs HEMT (high electron mobility) based line scanning array, supplied by Terasense Ltd. The samples are mounted on the 1D sliding plate and the line scanner array is located spatially orthogonally underneath the plate in order to achieve 2D images. The slider speed was 10 cm per second.
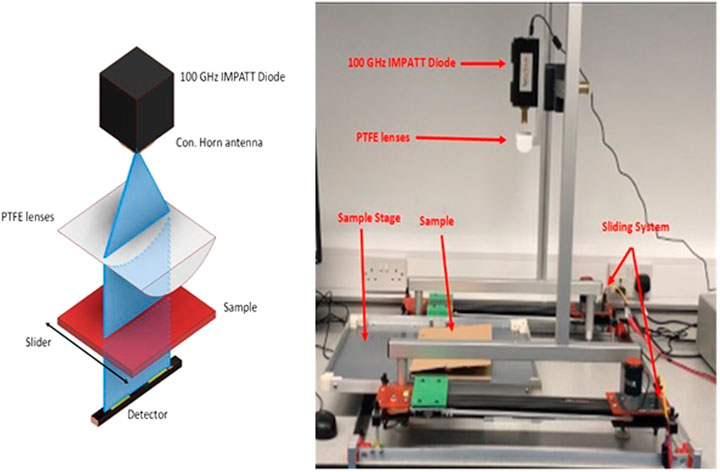
FIGURE 1. (Left) Schematic plot of 100 GHz line scanner (Right) photograph of the Line scanner.
Each liquid was carefully extracted from its source into a general-purpose medical syringe, and the transferred into its corresponding sample plastic cannister. A different syringe was used per liquid and each of the four volumes was measured with a high degree of accuracy. It is important to note that the plastic cannisters were made of PVC in order to get minimum interference between the source and the detector of the imaging system. This was to ensure that the PVC cannisters allowed the THz signal to pass through to the liquids without blocking the signal and swaying the results. The canisters were covered by cardboard to mimic a packaging scenario.
Using the images harvested, it is possible to determine the percentage value of visually clear area taken by the THz line scanner. The clear area represents areas of high penetration, or where the sample liquids have less absorptivity. The clear area fraction was defined by the given equation:
Where w, represents the width of the clear area and l, represents the length of the clear area; and A is the cross-section area of the empty plastic cannister.
THz-TDS ATR Spectroscopy
Per each sample of the ATR experiment, 1 ml of liquid was extracted from its source container into a general-purpose medical syringe. The volume of liquid should have no real impact on the results as the THz signal only passed through the liquid at the apex of the sample prism. The liquid was transferred from the syringe and injected into the top surface of the prism. Before the experiment could begin the test chamber was flooded with nitrogen gas, purging virtually all of the air within. This was done to push all of the air out of the chamber as air has a high humidity percentage, and the water would have high absorptivity of the inputted THz signal. Once each test was done, the liquid was removed via various clean methods, ensuring that no liquid remained in the prism surface, allowing for no contamination between test samples. A new sample liquid was then injected, and the chamber re-flooded with nitrogen. This process was repeated for all of the liquid samples.
The THz-TDS (TeTechS Ltd., Ontario, Canada) was used together with the ATR module and the spectra spans from 0.2 to 1 THz at room temperature, and the humidity in chamber was controlled <0.3% through continuous nitrogen purge. The 3D schematic THz-TDS set-up is presented in Figure 2 (upper) and the beam propagation inside of the ATR module is graphically depicted in the lower part of Figure 2. The parameter extraction involves a transmitted Fourier transformed pulse waveform recording the temporal response of the THz reference pulse as a function of time delay [14]. The THz ATR technique is suitable for measuring liquid samples with high absorption, and also has excellent sample-to-sample reproducibility with minimal operator-induced variations. The core element of an ATR system is a silicon made prism, which is almost transparent and non-dispersive across the THz frequencies. In the ATR system, the THz beam from the emitter is directed into a silicon prism of relatively higher refractive index. The THz wave reflects from the prisms internal surface and produces an evanescent wave, which projects orthogonally into the liquid sample in close contact with the ATR prism. The sample absorbs some of the energy of the evanescent wave and the reflected radiation (some now absorbed by the liquid sample) is returned to the detector.
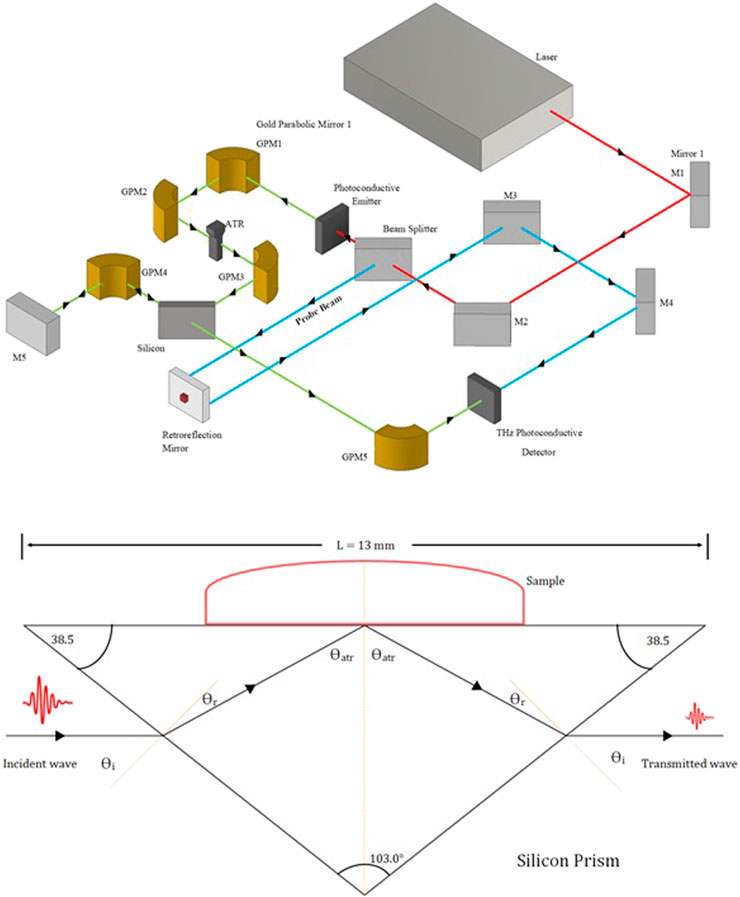
FIGURE 2. Schematic plot of THz TDS (upper) and ATR module (lower).
After harvesting the experimental data, extraction of the sample’s complex permittivity is implemented by the following procedures. At the interface between air and silicon, the THz beam follows the Snell’s law:
Here, n1 is the refractive index of air, known to be 1;n2 is the refractive index of silicon, known to be 3.41; θ1 represents the angle on incidence, which was determined by the ATR prism’s structure, 51.5° and finally, θ2 can be calculated, 13.27°. It is to be noted that the gas inside the TDS chamber is nitrogen, but as nitrogen and air have a virtually identical refractive index with a negligible difference, n1 will be noted as air. Inside of the prism and at the surface between the silicon and the top air surface, the incident angle θatr equals the sum of θ2 and 38.5°.
The complex transmission coefficient is given as:
Where Esample(ω) and Eref(ω) are the electric field Fourier transforms of the sample and background measurements, respectively; and rpprism−sample and rpprism−air are reflection coefficients between two media, silicon prism to the liquid sample and silicon prism to the air, respectively.
The complex refractive index of the sample liquid can be extracted from [15, 16]:
Where ϕ follows the equation:
The refractive index between the prism and the air, rpprism−air must still be calculated, using the given equation:
Where
From this equation,
Where ‘n’ is the real part of refractive index and the term ‘k’ represents the imaginary part of the complex refractive index.
Results and Discussion
The relationship between the percentage of THz penetration area Fclear and the volume of volatile liquid samples is presented in Figure 3. The 2D images acquired from the line scanner and the detailed Fclear are presented in the Supplementary Tables S1–S5. The results have distinguished all liquid samples into two categories: highly absorbed samples and less absorbed liquids. The former is generally water-based, and includes Water, Ethanol and Fuel Treatment. For this group of samples, THz signal has less ability to penetrate the liquids, which is reflected by dark blue colours in the images. From Figure 3, 5 ml, 10ml and 15 ml samples all demonstrated 0 percentage of penetration area. For 1 ml samples, part of THz signals can pass through and this is due to the fact that there physically is less liquid in the sample cannisters, and so some signal passed through the substance and registered on the detector. This idea is supported by the fact that throughout all of the tests done: as the volume increases, the general fraction area of penetration decreases. In contrast, the low loss liquids are generally oil-based samples, with the exception of the water-based sample: Universal Bottle Cleaner. This category of liquids showed good penetration fraction areas and the general trend remains that they had a lower absorptivity than the water-based liquids.
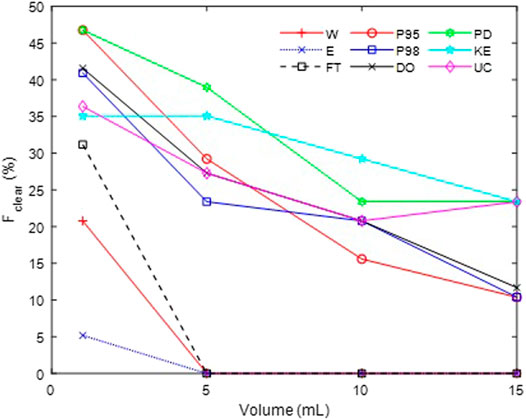
FIGURE 3. Graph plot for clear area percentage against volume for each sample liquid.
The high-loss liquids have shown fast decreasing gradients to become completely opaque to the THz signal once the volume is increased past 5 ml. The Ethanol shows a relatively slow decreasing slope and the Fuel Treatment has the fastest falling rate. For low-loss samples, the fractions of the penetration area are slowly decreased; however, different samples have shown different gradients. For example, petrol and diesel-based samples (P95, P98 and DO) have shown relatively quicker decrease, while the mixed Petrol/Diesel, Kerosene and Universal Bottle Cleaner have shown a slow decreasing slope. In order to further interpret these results, ATR based THz-TDS are used to investigate the reasons. The calculated complex permittivities are presented in Figures 4,5. From Figure 4, the Ethanol has the highest permittivity and lowest loss, which explains why it has the lower degrading attenuation in Figure 3. As the liquid sample is held inside of a cylinder-shaped cannister with a curved surface, the 100 GHz mm-wave source illuminates the curved surface of the sample bottle creating an oblique incident angle into the liquid, causing higher refraction; due to the higher permittivity of the liquid, which results in strayed mm-wave beam into the detect. For the Fuel Treatment and Water samples, they have a relatively low permittivity, inducing less trouble for beam refraction, therefore, they will absorb the weak penetrated mm-wave signal only. Both Fuel Treatment and Water liquid have higher loss properties, to result in higher decreasing gradient. In Figure 5, all oil-based sample liquids and the Universal Bottle Cleaner have relative equal or higher permittivity than water, and most importantly, they all have relatively low loss properties. The higher permittivity and medium loss properties explain why they have better penetration results to the mm-wave, as it is easy to generate a strayed beam and less lost signals.
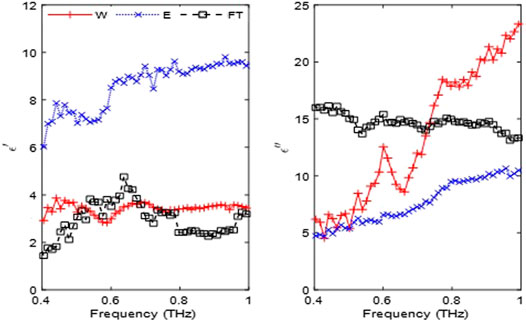
FIGURE 4. the calculated complex permittivity of Water (W), ethanol (E) and Fuel Treatment (FT) (Left) real part of permittivity (Right) imaginary part of the permittivity.
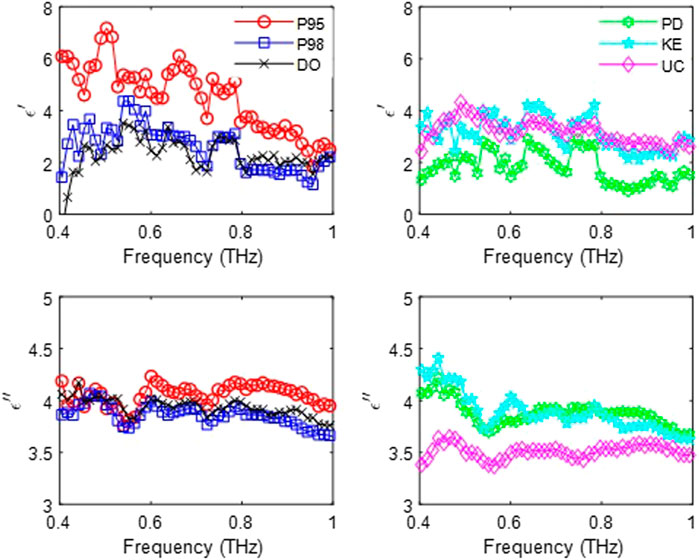
FIGURE 5. the calculated complex permittivity of Petrol 95 (P95), Petrol 98 (P98), Diesel oil (DO), 50/50 mixed Petrol/Diesel (PD), Kerosene (KE) and Universal Bottle Cleaner (UC) (Top) real part of permittivity (Bottom) imaginary part of the permittivity.
The oil-based liquid samples, due to their organic chemicals that they are composed of, e.g. the hydrocarbons in petrol and diesel, generally contain less metallic elements and so therefore should have lower loss properties. The findings here suggest that mm-wave imaging can distinguish the difference of different kinds of liquids, as different liquids have demonstrated distinguishable attenuation rate and diffraction rate at the mm-wave and THz band. The mm-wave line scan imager is compact, poses no-radiation hazard, and could be an efficient method to distinguish different liquid samples.
Conclusion
Combining 100 GHz 2D line scanner and THz ATR module-based TDS, 8 different volatile liquids and water have been imaged with high speed and characterized with their complex permittivities. The liquids’ dielectric permitivities have contributed to the explanation of their mm-wave images. The higher permittivity of liquid can cause stray beams into the mm-wave detector, which can positively assist the detector to receive weak mm-wave beam and enhance the identification of the liquid samples. Through the mm-wave images, the volatile liquids can be subdivided into high loss samples (mainly water-based) and oil-based low loss samples (and the water-based universal Bottle Cleaner), which also are proved by the THz spectroscopy analysis. The work here could give a positive, promising addition to a more precise baggage screening. Integrating these two systems could practically increase safety generally by requiring fewer additional manual bag checks to provide a clear security benefit.
Data Availability Statement
The original contributions presented in the study are included in the article/Supplementary Material, further inquiries can be directed to the corresponding authors.
Author Contributions
HB, AW did the measurement; HB, JP and BY did the analysis; HB, RC and BY wrote the manuscript; RC and BY initiated the project.
Conflict of Interest
The authors declare that the research was conducted in the absence of any commercial or financial relationships that could be construed as a potential conflict of interest.
Supplementary Material
The Supplementary Material for this article can be found online at: https://www.frontiersin.org/articles/10.3389/fphy.2021.639151/full#supplementary-material.
References
1.UK government website. Available from: https://www.gov.uk/hand-luggage-restrictions.
2. Qian W, Ismail KN, Breckon TP. An approach for adaptive automatic threat recognition within 3D computed tomography images for baggage security screening. J X-ray Sci Tech (2020) 28(1):35–58. doi:10.3233/XST-190531
3. Khan SU, Khan IU, Ullah I, Saif N, Ullah I. A review of airport duel energy X-ray baggage inspection techniques: image enhancement and noise reduction. J X-ray Sci Tech (2020) 28(3):451–505. doi:10.3233/xst-200663
4. Song Q, Chen Y, Wang X, Yang B, Xu J, Xiong K, et al. Identification method of EDXRD spectra for illicit substance detection. Opt Express (2019) 27(18):26163–74. doi:10.1364/oe.27.026163
5. Crespy C, Duvauchelle P, Kaftandjian V, Soulez F, Ponard P. Energy dispersive X-ray diffraction to identify explosive substances: spectra analysis procedure optimization. Nucl Instr Methods Phys Res Section A: Acc Spectrometers, Detectors Associated Equipment (2010) 623(3):1050–60. doi:10.1016/j.nima.2010.08.023
6. Chen Y, Wang X, Song Q, Yang B, Xu J, Xiong K, et al. Energy-dispersive X-ray diffraction system with a spiral-array structure for security inspection. AIP Adv (2019) 9(12):125112. doi:10.1063/1.5126051
7. Mittleman DM. Twenty years of terahertz imaging [Invited]. Opt Express (2018) 26:9417. doi:10.1364/oe.26.009417
8. Weng Z, Song C, Xiong Z, Xue H, Sun W, Zhang Y, et al. Microstructure and broadband dielectric properties of Zn2SiO4 ceramics with nano-sized TiO2 addition. Ceramics Int (2019) 45:13251–6. doi:10.1016/j.ceramint.2019.04.011
9. Schecklman S, M Zurk L, Henry S, P Kniffin G. Terahertz material detection from diffuse surface scattering”. J Appl Phys (2011) 109:094902. doi:10.1063/1.3561806
10. Ahi K, Anwar M. “Advanced terahertz techniques for quality control and counterfeit detection”, in Proc. SPIE 9856, terahertz Physics, devices and systems X: advanced applications in industry and defense, 98560G (2016). doi:10.1117/12.2228684
11. Yang Y, Shutler A, Grischkowsky D. Measurement of the transmission of the atmosphere from 02 to 2 THz. Opt Express (2011) 19(9):8830–8. doi:10.1364/oe.19.008830
12. Naftaly M, Miles RE. Terahertz time-domain spectroscopy for material characterization. Proc IEEE (2007) 95(8):1658–65. doi:10.1109/jproc.2007.898835
13. McIntosh AI, Yang B, Goldup SM, Watkinson M, Donnan RS. Terahertz Spectroscopy: a powerful new tool for the chemical sciences?. Chem Soc Rev (2012) 41:2072–82. doi:10.1039/c1cs15277g
14. Zeng Y, Edwards M, Stevens R, Bowen JW, Donnan RS, Yang B. Terahertz characterisation of UV offset lithographically printed electronic-ink. Org Electronics (2017) 48:382–8. doi:10.1016/j.orgel.2017.06.012
15. Soltani A, Jahn D, Duschek L, Castro-Camus E, Koch M, Withayachumnankul W. Attenuated total reflection time-domain spectroscopy: uncertainty analysis and reduction scheme. IEEE Trans Terahertz Sci Tech 6(1):32–9. doi:10.1109/tthz.2015.2505909
Keywords: mm-wave imaging, THz ATR, THz TDS, liquid measurements, security check
Citation: Baxter HW, Worrall AA, Pang J, Chen R and Yang B (2021) Volatile Liquid Detection by Terahertz Technologies. Front. Phys. 9:639151. doi: 10.3389/fphy.2021.639151
Received: 08 December 2020; Accepted: 11 February 2021;
Published: 08 April 2021.
Edited by:
Shuncong Zhong, Fuzhou University, ChinaCopyright © 2021 Baxter, Worrall, Pang, Chen and Yang. This is an open-access article distributed under the terms of the Creative Commons Attribution License (CC BY). The use, distribution or reproduction in other forums is permitted, provided the original author(s) and the copyright owner(s) are credited and that the original publication in this journal is cited, in accordance with accepted academic practice. No use, distribution or reproduction is permitted which does not comply with these terms.
*Correspondence: Riqing Chen, cmlxaW5nLmNoZW5AZmFmdS5lZHUuY24=; Bin Yang, Yi55YW5nQGNoZXN0ZXIuYWMudWs=