 Lan Yu
- 1School of Physics and Optoelectronic Engineering, Xidian University, Xi'an, China
- 2State Key Laboratory of Transient Optics and Photonics, Xi'an Institute of Optics and Precision Mechanics, Chinese Academy of Sciences, Xi'an, China
Fluorescence correlation spectroscopy (FCS) is a powerful technique for quantification of molecular dynamics, and it has been widely applied in diverse fields, e.g., biomedicine, biophysics, and chemistry. By time-correlation of the fluorescence fluctuations induced by molecules diffusing through a focused light, FCS can quantitatively evaluate the concentration, diffusion coefficient, and interaction of the molecules in vitro or in vivo. In this review, the basic principle and implementation of FCS are introduced. Then, the advances of FCS variants are reviewed, covering dual-color FCCS, multi-focus FCS, pair correlation function (pCF), scanning FCS, focus-reduced FCS, SPIM-FCS, and inverse-FCS. Besides, the applications of FCS are demonstrated with the measurement of local concentration, hydrodynamic radius, diffusion coefficient, and the interaction of different molecules. Lastly, a discussion is given by summarizing the pros and cons of different FCS techniques, as well as the outlooks and perspectives of FCS.
Introduction
Molecular dynamics in biological systems are the foundation of life events. Fluorescence correlation spectroscopy (FCS) is a powerful tool for detecting molecular dynamics through analyzing the intensity fluctuation emitted by biomolecules diffusing in and out of a focused light [1–3]. The local concentration, hydrodynamic radius, diffusion coefficient, and the interaction of different proteins, etc. [4–7] can be accurately measured with FCS. Compared with other dynamics orientated approaches, FCS has a broader measurable time range spanning from ∼ns to ∼ s, and a higher sensitivity that can be up to a single-molecule level.
FCS was first proposed by Magde et al. in 1972, which was designed for the measurement of the binding of the fluorescent dye EtBr and DNA [8]. It has become a practical tool for the investigation of molecular dynamics since the 1990s when FCS was firstly implemented with confocal microscopy. Confocal microscopy provides a much-confined observation volume ∼0.5 fl, which enhances the signal-to-noise ratio (SNR) of FCS significantly [9].
When investigating diverse dynamic processes in live biological systems, FCS is inevitably complicated with many factors, such as the movement of cells, the photobleaching of fluorophores, and anomalous dynamics in sub-diffraction regions, etc. To overcome these difficulties, many advances have been initiated to extend the capability of FCS during the past two decades. To name a few, dual-color FCCS [10] was proposed to measure the interaction of different molecules. Space-multiplexing techniques allow FCS to probe dynamics at different locations [11]. Pair correlation function (pCF) based FCS provides information on the directional motion of molecules along a certain direction, i.e., between a pair of points [12]. Parallel/perpendicular line-scanning FCS [13] overcomes the photo-bleaching caused by slow diffusion of molecules on the membranes by swiftly scanning the focus on the membrane or perpendicular to the membrane. Moreover, the perpendicular line-scanning FCS overcomes the artificial fluorescence signal fluctuation caused by membrane movements. The combination of stimulated emission depletion (STED) and FCS [14] reduces the detection volume and consequently enables us to detect anomalous diffusion in the nanoscale regions. Single plane illumination microscopy based FCS (SPIM-FCS) [15] combines light-sheet illumination with FCS to acquire molecular information from thousands of pixels simultaneously and reduce the observation volume along the z-axis effectively. Inverse-FCS [16] measures the particle volume independent of diffusion dynamics by analyzing the fluctuation of unlabeled particles in the context of a densely labeled surrounding medium. Moreover, the extensions arise in data analysis, such as photon counting histogram (PCH) [17] and fluorescence intensity distribution analysis (FIDA) [18], which are capable of obtaining the molecular brightness that not available in FCS. These above advances extend the capability of conventional FCS in different aspects and make it suitable for measuring the biomolecular dynamics and interactions in complex biological environments.
In this review, the basic principle, the implementation schemes, and data analysis of FCS are elaborated at first. Secondly, the advances in FCS, including dual-color FCCS, multi-focus FCS, pair correlation function (pCF) based FCS, scanning FCS, focus-reducing FCS, inverse-FCS, and PCH are elaborated in both conception or implementation. Thirdly, the applications of FCS in chemistry and biology are outlined. Eventually, the comparison among the different FCS approaches, as well as the outlooks and perspectives of FCS, are discussed.
Principle OF Fluorescence Correlation Spectroscopy
Experimental Setup
FCS is based on the analysis of time correlations in fluorescence fluctuation emitted when fluorescently labeled molecules are diffusing in and out of a tiny observation volume [2]. In the implementation, FCS is often performed in a confocal system, as illustrated in Figure 1A. The fluorescence emitted from the fluorescently-labeled molecules in the observation volume is collected by the same objective, and propagate along the opposite direction to that of the excitation/depletion light. After passing through a long-pass dichroic mirror, the fluorescence is focused through a pinhole onto an avalanche photodiode (APD). The fluorescence emitted in the out-of-focus region is rejected by the pinhole, and therefore, it does not reach the detector. Consequently, the pinhole reduces the axial extension of the observation volume. Such confined observation volume enhances the signal-to-noise ratio significantly and also reduces the measurement time needed to obtain a decent correlation curve. Despite a continuous-wave (CW) laser is available for FCS, the usage of pulsed lasers for excitation and time-correlated single-photon counting (TCSPC) for detection is preferable for the rejection of environmental background and also allows performing dual-color FCCS in a pulsed interleaved excitation scheme [19].
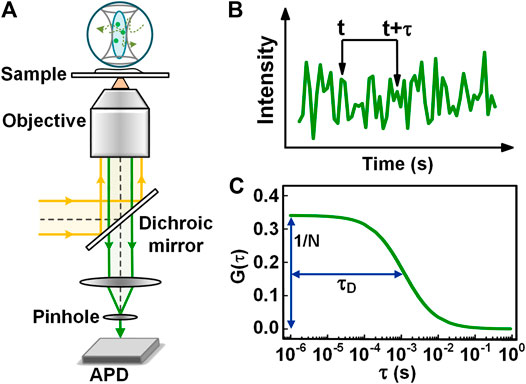
FIGURE 1. Principle, instrumentation, and data analysis of FCS. (A) Schematic view of a confocal based FCS setup. (B) The intensity trace collected from the observation volume. (C) The autocorrelation curve calculated with the intensity trace in Figure 1B.
Data Analysis
To perform dynamics measurement with FCS, a sample of the fluorescently-labeled molecules is placed in the focal plane of the confocal microscope. Due to the free diffusion of molecules by nature, an intensity fluctuation
< > represents the temporal average,
N is the average molecule number in detection volume,
The correlation in Eq. 1 can be calculated with a computer-based software or hardware correlator [20–23]. With the software correlator, photon counts and arrival times are imported into the computer and then correlated with relevant programs. The hardware correlators correlate on board the incoming photon arrival times electronically and feed the correlated data [5]. Both of the two approaches employ the multi-tau algorithm, but there are still some differences [5, 24]. Firstly, the hardware correlator works out in real-time mode, allowing adjusting the experimental setting in time, while the software correlator performs the calculation after experiments. Secondly, the speed of the hardware correlator is much faster than that of the software correlator. Thirdly, the hardware correlator can not reserve the raw data and is not capable of handling the issues of photobleaching, clusters, or other disturbances. By contrast, the software correlator can dispose or compensate for the above-mentioned disturbances and enables us to make other analyses such as pulsed interleaved excitation (PIE) to remove the spectrum-crosstalk and time-gated detection to suppress the background once using pulsed excitation. In short, hardware and software correlator both have their own advantages and disadvantages. The choice of each method is determined by the desired property in experiments. Compared with imaging-based dynamic determination approaches, the temporal resolution of FCS can reach the ns range, so it allows detecting molecular diffusion both in vitro and in vivo [25–27].
Advances in Fluorescence Correlation Spectroscopy
In this section, we will introduce the recent advances on FCS that aim at endowing FCS with new capabilities by concept or adapting FCS for specific applications.
Dual-Color FCCS for Molecular Interaction Investigation
To measure the molecular binding, conventional FCS is only available when the binding lead to a resolvable change in diffusion time, compared to individual molecules. This application will be handicapped when uninteresting molecules are bound to the fluorescently labeled molecules. Compared to conventional FCS, dual-color FCCS is a preferable technique to detect molecular binding without these limitations [4, 10, 28–30]. The concept of dual-color FCCS was first proposed by Eigen and Rigler [30], and was implemented experimentally by Schwille et al. [31] In dual-color FCCS, two species of interest are labeled with two different types of spectrally distinct fluorophores, indicated with the subscript r (red) and g (green) for simplicity. Upon the excitation of the red and green lights (as shown in Figure 2A), the fluorescence from the two-color fluorophores is separated and counted into two detection channels, respectively (Figure 2B shows two intensity traces). The autocorrelations of the intensity traces
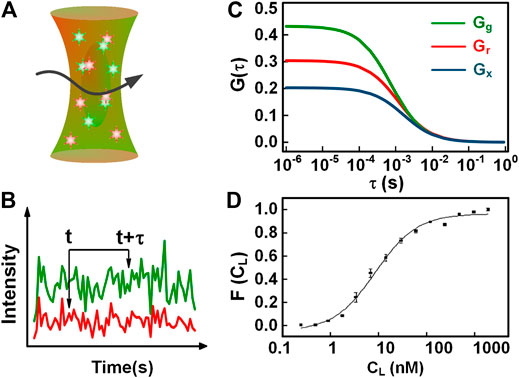
FIGURE 2. Illustration of dual-color FCCS. (A) The detection scheme of dual-color FCCS. (B) Two-color intensity traces generated in the red and green channels. (C) The autocorrelation and cross-correlation curves of the red and green intensity traces in (B). (D) The binding curve of the BNP tracer and Ab-BC203, i.e., the fraction of BNP bound complex varying with the free Ab concentration. The fit provides a KD = 8.9 ± 1.0 nM.
Compared with the method of determining
Dual-color FCCS labels two species of interest with spectrally distinct fluorophores, and the binding of the two species is analyzed with the cross-correlation. Therefore, compared with the single species, dual-color FCCS is neither limited by the relative size change of the complex compared with single species nor susceptible to binding with other species. Hence, it has been widely used to investigate molecular interactions in cells, small organelles, and many other issues [34–37].
However, there are still some factors affecting the accuracy of the dual-color FCCS. Firstly, spectral crosstalk, i.e., the signal of the green species falling in the red channel, often produces a “false-positive” cross-correlation amplitude. There have been some mathematical approaches to correct the cross-talk mathematically. For instance, a simple and reliable correction approach was proposed to compensate for the cross-talk with the bleed-through ratio, the brightness ratio, and the number ratio [10, 38]. Pulsed interleaved excitation (PIE) [19], which excites and detects interleaved two-color fluorescence in separate time windows, provides a solution for this problem (Supplementary Material). Similarly, fluorescence lifetime correlation spectroscopy (FLCS) can also be used to distinguish the fluorescence from two different species that have different fluorescence lifetimes and therefore to remove crosstalk [39].
The second is the imperfect focus-overlap of two excitation lights, which often reduces the cross-correlation amplitude falsely. Fortunately, this artifact reduces the cross-correlation amplitude by a constant ratio. This ratio can be determined by performing dual-color FCCS on one kind of fluorophores with a broad absorption spectrum, and calculating the ratio of the obtained cross-correlation amplitude and the autocorrelation amplitudes. Then, the influence of the imperfect focus-overlap can be compensated by dividing the cross-correlation by this ratio, when measuring the binding of two species. Alternatively, two-photon excitation, which uses one laser to excite two kinds of fluorophores employing respectively single-photon excitation and two-photon excitation regimes, is available to avoid this artifact [40, 41].
The third is the uncorrelated background from the auto-fluorescence of cells, extracellular environment, or stray lights. This uncorrelated background will affect both the autocorrelations and cross-correlation curves. In the general case, the background in the red and green channel, denoted with
The fourth factor is photobleaching. The continual loss of fluorophores in the focus area with time will falsely distort the autocorrelation curves by providing apparently smaller molecule numbers
Dual/Multi-Focus Fluorescence Correlation Spectroscopy and Imaging Fluorescence Correlation Spectroscopy to Acquire Space-Multiplexing Dynamics
Conventional FCS could only detect the dynamics of a single spot. Dual-focus FCS (and multifocal FCS) was developed with their major merit of probing dynamics simultaneously at two separated positions. Meanwhile, in single-focus FCS, the pre-calibration for focus size
In dual-focus FCS, a DIC prism splits two orthogonal linear-polarized pulsed lasers into two laterally shifted foci, as shown in Figure 3A. The fluorescence alternatively excited by the two foci is separated by using a time-correlated single-photon counting (TCSPC) module. By applying a global fit to all correlation curves, including the ACF from each focus, and the CCF between both foci, one can extract the absolute values of the diffusion coefficient D and the focus size r0 when the inter-focal distance is pre-known [45]. Therefore, it is promising for dual-focus FCS to obtain a more accurate diffusion coefficient in experiments [47]. With the dual-focus FCS, Kerstin et al. investigated protein diffusion in black lipid membranes, yielding highly accurate diffusion coefficients [48]. In addition, it is also worthy of mentioning that the inter-focal distance was also influenced by specific experimental settings, such as the thickness of the cover-slip and index mismatch. So a pre-calibration is necessary for most of measurements.
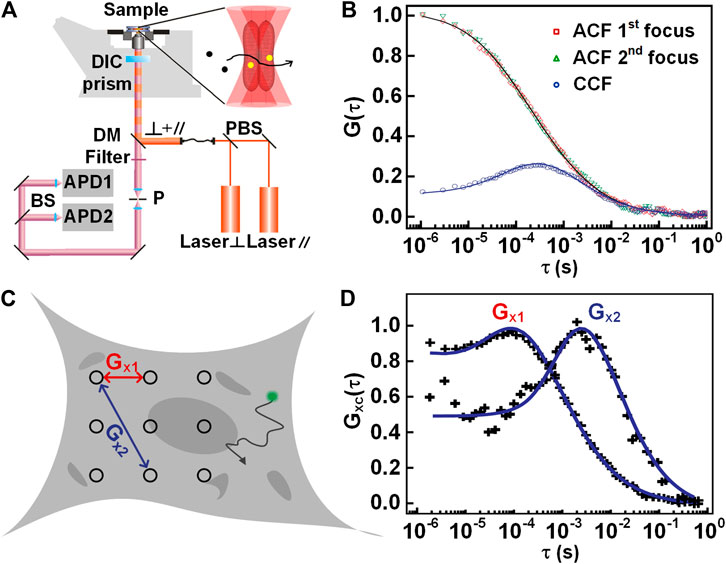
FIGURE 3. Illustration of dual-focus and multi-focus FCS. (A) Schematic setup of dual-focus FCS. (B) Autocorrelation and cross-correlation curves of dual-focus FCS. (C) Schematic view of multi-focus FCS measurement. (D) The correlation curves between two pairs of positions with different distances. Adapted from Refs. [11, 56].
Besides the dual-focus FCS, there exist similar techniques, such as imaging FCS [49], multi-scale FCS [11], and multi-focus FCS [50, 51]. In imaging FCS, a series of images are taken on a certain area of the sample, and then the intensities associated with each pixel are correlated with time. When fitted with a suitable diffusional model, the dynamics at thousands of points can be measured simultaneously [15, 52]. Except for auto- and cross-correlation analysis, spatiotemporal image correlation spectroscopy (STICS) [53, 54] and k-space image correlation spectroscopy (kICS) [55] have been proposed to analyze the dynamics at different locations. STICS allows measurement of diffusion coefficients and velocity vectors of particles by using temporal and spatial correlation on measured image stacks. kICS can quantify molecular dynamics by performing correlation in reciprocal space even in the presence of fluorophore photo-bleaching and blinking. kICS does not rely on nonlinear curve fitting, or the knowledge of the beam radius of the exciting laser. With the advent of fast and sensitive EMCCD cameras, the potential of the imaging FCS will be further exploited for wide applications in biomedical and chemical sciences. Similarly, multi-scale and multi-focus FCS both detect the signals from multi-points in an extended area, as shown in Figure 3C. Then, the spatial information of molecular motion can be analyzed by the autocorrelation or the cross-correlation curves between the different pairs of points (Figure 3D). Multi-focus FCS was implemented recently by using a spinning-disk [51] or beam-splitter array [50]. Multi-scale FCS was proposed by Baum et al. [11] to characterize the intracellular architecture by employing a line for illumination. As the common disadvantages of imaging FCS, multi-scale FCS, and multi-focus FCS, their temporal resolution is low (in the millisecond range) due to the usage of 2D imaging sensors; meanwhile, these three techniques have a larger observation volume than the confocal based FCS due to the lack of pinhole filtering. In addition, by scanning a wide area across the sample and performing a correlation analysis of relevant subregions within the acquired image, the dynamics can be probed by the analysis of raster image correlation spectroscopy (RICS) [57]. Despite the dynamics can be obtained by scanning one frame, RICS often scans a few frames to compensate for the immobile component in the image. In RICS, the correlation data is calculated with a dozen of pixels that are connected with each other along the line scan. Therefore, the spatial resolution of RICS (a few micrometers) is much lower than the above-mentioned techniques.
Pair Correlation Function Analysis for Directional Diffusion
The conventional FCS detects dynamics at one point or two, and lacks the ability to detect path-related anisotropic diffusion. To acquire directional diffusions or to detect obstacles to molecular diffusion, Digman et al. incorporated pair correlation function (pCF) into FCS [12]. pCF was performed by repeatedly scanning a line in a cell (indicated with the white-dash line in Figure 4A), and then assembling the acquired lines into a kymography (Figure 4A-bottom). In the kymography, when the intensities of a specific pixel assembled are correlated with time, an autocorrelation
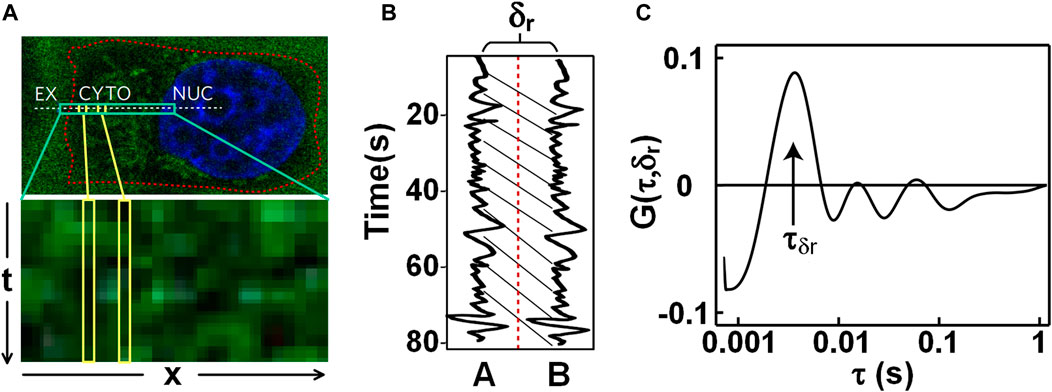
FIGURE 4. Pair correlation function (pCF) analysis on nanoparticles transmitting in live cells. (A) Fluorescence image of nanoparticles and Hoechst-stained nucleus (Top) and the kymograph (Bottom). The dash-line indicates the scanned line across the extracellular space (EX), the cytoplasm (CYTO), and the nucleus (NUC). (B) Fluorescence intensity fluctuations of two pixels with a distance of δr in the sample. (C) Pair correlation curve G (τ, δr) calculated with the two intensity traces in Figure 4B. Adapted from Ref. [60].
There is a certain similarity between pCF and dual-focus FCS [46]. However, dual-focus FCS can only detect dynamics on a fixed pair of points. pCF can obtain information about any pair of points in the detection area or scanned line, which greatly increases the amount of spatial information. In all, pCF is more practical and convenient for biological researchers.
Recently, two-dimensional pair correlation function (2D pCF) was developed as an extension of pCF analysis. 2D pCF probes the anisotropic paths at different spatial locations and maps the intercellular environment [61]. Compared with one-dimension pCF, 2D pCF can provide more information of the intercellular environment. Specifically, correlating the intensity series of each image pixels with its neighboring pixels at a certain distance yields a set of pair correlation functions. Plotting the results of pCFs as a function of time delay and angle, a sub-image for each pixel can be obtained, and then a polar plot for each pixel can be generated. If the molecules move isotropically, the correlation function will be equal in all directions. However, if there are barriers in some directions, a deformed polar plot can be obtained and analyzed by moment analysis [62]. Therefore, the 2D pCF is a fingerprinting tool for the investigation of anisotropic motions and intracellular structures in living cells. Compared with 1D pCF, 2D pCF using a 2D image sensor for the detection trades its temporal resolution for spatial information.
Except for analyzing the fluorescence fluctuation, some researchers applied pCF analysis to sense other parameters such as molecular brightness. For instance, Hinde et al. [63] utilized pCF to quantify molecular brightness (pCOMB) and tracked the mobility of different oligomeric species within living cell nuclear architecture.
Scanning Fluorescence Correlation Spectroscopy Targeting Dynamics on Membranes
For static FCS, the observation volume is kept fixed at a specific location in the sample, and therefore, it is not applicable for the studies of rather slow diffusional dynamics in bio-membranes. The reason lies in that the infrequent appearance of fluorophores in the focal spot poses sampling problems, and meanwhile, their long retention in the focus volume enhances the likelihood of photo-destruction. Scanning FCS was proposed to overcome this difficulty by sweeping the focus rapidly across a sample, calculating the autocorrelation of the assembled intensity trace associated with one or multiple positions, and then obtaining the dynamics after applying a fit model [64, 65]. Sorted by the scanning direction with respect to the membrane position, scanning FCS can be classified into two categories: parallel scanning FCS and perpendicular scanning FCS.
Parallel Scanning Fluorescence Correlation Spectroscopy
Parallel scanning FCS scans a focused light along one line [66], two lines (as shown in Figure 5A), or a circle [67, 68], (as shown in Figure 5B) in the plane of a membrane, acquiring and assembling the photons with pixels and time. After that, the intensities of each pixel from the scanned line or circle are extracted and binned into an intensity trace, the autocorrelation of the intensity trace can provide the concentration and diffusion coefficient of the targeted biomolecules. Furthermore, similar to dual-foci FCS, the intensity of two pixels from the two scanned lines or from the scanned circle, which has a known distance, can be auto-correlated and cross-correlated. A global fit on the obtained autocorrelations and the cross-correlation can provide, the focus size, concentration, and diffusion coefficient of measured biomolecules, as shown in Figure 5C. This method avoids additional procedures for detection volume calibration. Alternatively, in circle-scanning FCS, the photons collected during the whole scanning process are globally assembled with time, yielding a global intensity trace (regardless of the scanning position). The concentration and diffusion coefficient of biomolecules can be obtained from the calculated autocorrelation curve (seeFigure 5D) with a suitable fit model [67, 69, 70].
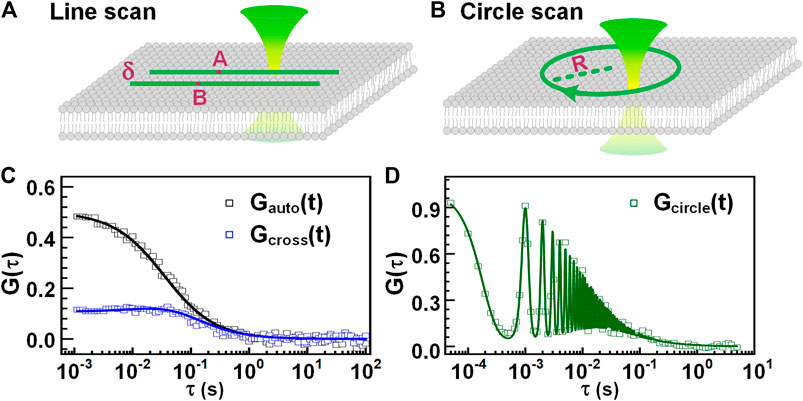
FIGURE 5. Parallel scanning FCS. Scheme of line-scanning FCS (A) and circle-scanning FCS (B). (C) The autocorrelation curve (black) of a specific pixel and the cross-correlation curve (blue) of two pixels separated by a distance of δ. (D) The correlation curve obtained from all the photons assembled with time, regardless of scanning positions.
In general, parallel scanning FCS alleviates the photobleaching of fluorophore by splitting the light exposure among a set of pixels. Equivalently, the time each fluorophore spends in the focus during measurement is reduced. Scanning FCS has been widely used in the study of biomolecular dynamics on membranes. For instance, Ries et al. [66] used line-scanning FCS to measure the diffusion coefficients of lipids accurately, interpreting the diffusion behavior in three phase-separating bilayers and the temperature dependence in several model membranes.
Perpendicular Lateral/Axial Line-Scanning Fluorescence Correlation Spectroscopy
When FCS is used to investigate dynamics on membranes, the movement of the membranes with respect to the observation volume gives rise to strong intensity fluctuations, obscuring those resulting from molecular diffusion in the plane of the membrane. Z-scan FCS tried to solve this problem by measuring a stack of correlation curves at discrete axial positions (“z-scan”) and selecting the correlation curve corresponding to the shortest diffusion time and the minimal number of particles [71, 72]. Alternatively, lateral/axial line-scanning FCS (lsFCS) solves this problem by quickly scanning the observation volume perpendicularly through the membrane or GUV [43, 73], as shown in Figure 6A. For both lateral and axial lsFCS, the fluorescence collected along the direction is binned into a 2D pseudo image (seeFigure 6C). For data analysis, the photons from the membrane, which is identified with the highest photon counts, are selected and binned into an intensity trace. Then, the intensity trace is correlated and analyzed with 2D diffusional model, yielding useful information, including biomolecular concentration, diffusion coefficient, etc. These methods are ideally suited to study dynamics in the membrane [42, 73]. Furthermore, they can be extended to dual-color lateral/axial lsFCS to study the interaction between different molecules, such as ligands and receptors, when tagged with different fluorophores [32].
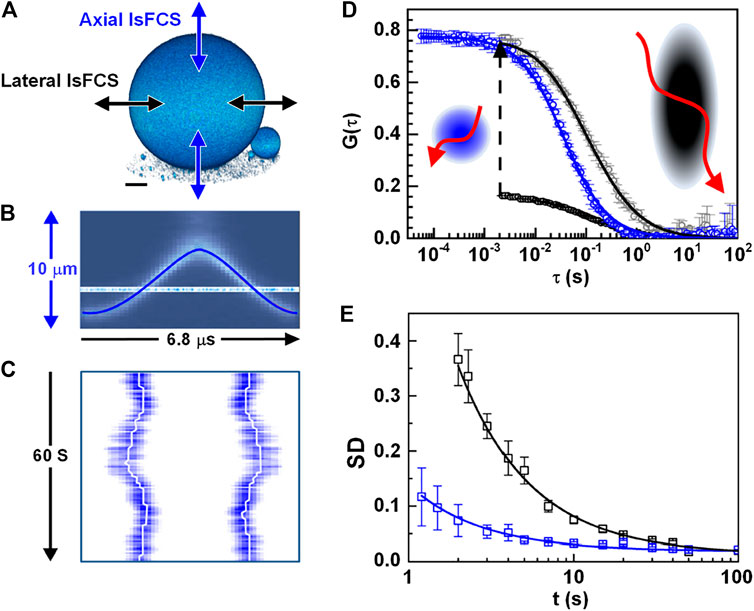
FIGURE 6. Lateral and axial line-scanning FCS (lsFCS). (A) The scanning schemes of lateral and axial lsFCS, which have the observation area A = πω0z0, and A = πω02, respectively. (B) Axial focus position during a single oscillation cycle of 6.8 μs in the axial lsFCS using a TAG lens. (C) The kymograph during 60s of axial line-scanning in the axial lsFCS. White-lines mark the membrane positions. (D) The correlation curve of the lateral (black) and axial (blue) lsFCS. The lateral lsFCS autocorrelation data have also been scaled to the axial ones (gray) for better comparison. (E) Standard deviation (SD) of two groups of seven normalized lateral (black) and axial (blue) lsFCS curves. Adapted from Ref. [43].
For comparison, lateral lsFCS is often performed with a galvo-scanner, which limits the time resolution to ∼ ms [32]. Nevertheless, the recently reported axial lsFCS performed a resonant axial-scan (seeFigure 6B) by using a tunable acoustic gradient index of refraction lens (TAG lens), providing a time resolution of 0.05 ms, 40 times faster than that the time resolution (2 ms) of lateral lsFCS, as shown in Figure 6D [43]. Furthermore, the axial lsFCS has a smaller and more symmetric focal area, and therefore, it can achieve comparable data quality with a remarkably reduced data acquisition time. The reduced measurement time will, in turn, reduces the photobleaching caused. Moreover, compared to the elliptical cross-section in lateral lsFCS, the circular cross-section in the axial lsFCS makes the fit more robust [43].
Reduction of Observation Volume to Probe Nanoscale Dynamics
As we all know, molecules in cells are usually hindered and differ from locations [74]. Also, the anomalous diffusion usually occurs on a small spatial scale with nanoscales [75]. In conventional FCS, due to the limitation of the optical diffraction, the observation volume is limited to ∼ 0.5 fl [76]. Despite being tiny already, this observation volume can also average out the heterogeneous dynamics happening in the diffraction-limited observation volume. Meanwhile, the diffraction-limited observation volume limits the measurable concentration, not exceeding ∼ 100 nM [77]. Otherwise, the fluctuations will be averaged out. However, the concentration of many biomolecules in living cells, especially when induced by an external transfection, is often quite high, usually in the micro-to the millimolar range. Therefore, it is crucial to reduce the detection volume of FCS to measure biomolecular dynamics with much higher concentration or the dynamics happening in the sub-diffraction areas. This section will introduce three techniques that reduce the detection volume, namely, total internal reflection FCS (TIR-FCS), nanofluidic channel-based FCS, SPIM-FCS, and STED-FCS.
Total Internal Reflection-Fluorescence Correlation Spectroscopy and Nanofluidic Channel Based Fluorescence Correlation Spectroscopy
Total internal reflection FCS (TIR-FCS) is a method that can significantly reduce the observation area in the axial direction by utilizing total internal reflection (TIR). TIR-FCS was first proposed by Thompson et al. in the 1980s [78]. In TIR-FCS (seeFigure 7A), a laser beam is totally and internally reflected at the surface-solution interface at an angle greater than the critical angle, forming an evanescent wave in a very thin layer with a thickness typically from tens of nm up to a few hundreds of nm. [79, 80] The excited fluorescence is collected by a microscopic objective and used for correlation analysis, from which the quantitative dynamic parameters of the sample can be obtained [81]. In addition to the setup in Figure 7A, TIR-FCS can also be realized by epi-illumination. [82] Through total internal reflection, the excitation of fluorophores, which are far away from the surface, is avoided. Therefore, compared with confocal based FCS, TIR-FCS has a much smaller focus volume that contributes to measuring high-concentration molecules and reducing the measurement time. On the other side, molecular diffusion investigated with TIR-FCS is handicapped by the binding of the molecules to the solid surface. Another difficulty in using TIR-FCS is the lack of a valid analysis model. Recently, many researchers have studied mathematical models to enhance TIR-FCS [83–85], taking into account the decay of evanescent waves and many other related problems. TIR-FCS has been widely applied to measuring receptor-concentration near membrane surfaces and the ligand-receptor binding occurring on the membrane [86].
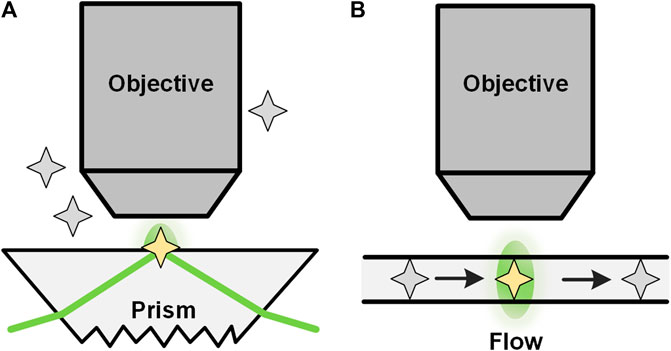
FIGURE 7. TIR-FCS and nano-channel based FCS. Configurations of total internal reflection (TIRF) based FCS (A) and nano-channel based FCS (B).
Another way to reduce the observation volume is to use nanofluidic channels in FCS (Figure 7B). Foquet et al. [87] used nanofabricated channels with dimensions smaller than the diffraction-limit as the container of molecules during FCS studies. With such a nano-channel, an effective detection volume of tens of attoliters was achieved. In addition, non-linear or higher harmonics techniques, 4π-alike excitation, near-field techniques, and surface plasmon can also be used to generate an effective focus volume smaller than the diffraction limit [77]. It should be noted that the detection volume of these methods is inherently adjacent to a surface, and consequently, free diffusion is restricted in at least one direction [77]. Another limitation of FCS in microfluidics is the lack of suitable interpretive models under different conditions, especially when measurements are performed in microchannels in which boundary effects cannot be neglected [24].
Single Plane Illumination Microscopy-Based FCS
Single plane illumination microscopy-FCS (SPIM-FCS) is a multiplexed technology that allows simultaneous FCS measurements on thousands of adjacent observation volumes to provide spatial maps of the diffusion coefficient and concentration [15]. In SPIM, a thin light sheet with a typical thickness of 1 ∼ 1.5 μm is generated by using a projection objective and a conjugated cylindrical lens, and the emitting fluorescence signal is detected in perpendicular (as illustrated in Figure 8A) by a high-speed camera [88]. After that, a series of images are recorded, and the fluorescence intensity trace of each pixel is generated by assembling the intensities of each pixel in the image series (Figure 8B). With ACF of the pixelated intensity traces, the quantitative diffusion coefficient and concentration maps are obtained (Figure 8C).
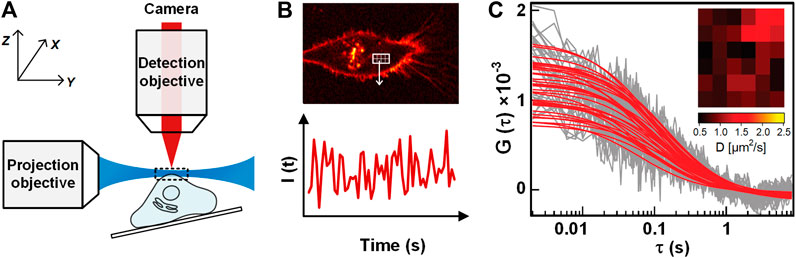
FIGURE 8. Illustration of SPIM-FCS. (A) Schematic of SPIM-FCS measurement on a sample. (B) The sectioned image of the sample when illuminated by a light sheet (Top), and the fluorescence intensity trace from one pixel in the image series (Bottom). (C) The ACFs of different pixels/locations. The Inset shows the Diffusion coefficient map. Adapted from Ref. [89].
Comparing to confocal-based FCS, SPIM-FCS avoids the out-of-focus excitation and hence provides a well-confined observation volume. Moreover, SPIM-FCS can also detect the dynamics of multiple locations simultaneously, providing a diffusion-coefficient map and concentration map [15]. Besides, SPIM-FCS has high flexibility during data analysis. For instance, the observation volume can be controlled during data analysis artificially in SPIM-FCS, which is convenient to adjust the analysis area according to the specific samples. Compared to RICS, which obtains the diffusion coefficient with multiple pixels along the scanning direction, SPIM-FCS excels in the spatial resolution [49]. However, the temporal resolution of SPIM-FCS/FCCS is limited by the performances of cameras. A camera with sufficient quantum efficiency and high speed is needed for SPIM-FCS to measure fast molecular motions with good statics. There are some available cameras such as SPAD, sCMOS, EMCCD, where EMCCD provides the highest quantum efficiency of more than 90% and the relatively low frame rates of 1000 s−1, which is the most suitable detector with a comprehensive consideration yet [49, 90]. In summary, device advances help to further improve the performance of SPIM-FCS.
SPIM-FCS has played an important role in the detection of molecular diffusion within cells and organizations [89, 91]. Besides dynamics measurement, Krieger et al. [92] proposed two-color SPIM-FCS that allows measuring spatially varying molecular interactions. In two-color SPIM-FCS, two light sheets of different wavelengths are used as the excitation, and an image splitter was used to split the detected fluorescence into two separate color channels. Agata et al. [93] utilized this method to study the interactions of the molecules Fos and c-Jun in HeLa cells.
Stimulated Emission Depletion-Fluorescence Correlation Spectroscopy
To study the anomalous dynamics of molecules, in 2005, Kastrup et al. reduced the FCS detection volume to one-fifth of the conventional confocal volume by using stimulated emission depletion (STED) [14]. In the so-called STED-FCS, a red-shifted doughnut-like depletion light depletes the excited fluorescence in the periphery of the excitation focus, yielding an effective focus much smaller than the diffraction limit (see Figure 9) [94]. In principle, the effective focus size of STED-FCS can become infinitely small by increasing the intensity of depletion light, but in actual situations, it is limited by photobleaching of fluorophores and reduction of signal to background ratio. Also, the background fluorescence from the out-of-focus region will directly influence the determination of both the concentration and diffusion coefficient. Recently, stimulated emission double-depletion (STEDD) based FCS (STEDD-FCS) [95] was proposed, which determines the effective fluorescence and background by temporally modulating the effective fluorescence “on” and “off” by applying an additional depletion light and later subtracts the background from the signal in total. Alternatively, time-gated detection was proposed on continuous-wave stimulated emission depletion (CW-STED) to reduce background [96]. As an enhanced approach, Lanzanò et al. [97] separates the effective signal and background photons by lifetime tuning (SPLIT-FCS) for reducing anti-stokes fluorescence emission background in STED-FCS. Compared with the gating method, SPLIT-FCS does not need complex fitting procedures such as fluorescence intensity distribution analysis (FIDA). Compared with STED-FCS in solution or cytosol, STED-FCS is more promising to probe membrane-related dynamics. This is due to the fact that the membrane intrinsically provides perfect axial confinement of the focus, no longer suffering from the out-of-focus fluorescence. In 2009, Eggeling et al. [98] applied STED-FCS to the study of living cell membranes, and proved that STED-FCS is capable of detecting the anomalous or heterogeneous diffusion in the membrane [75, 99]. Also, STED-FCS, which has excellent spatial resolution, can be combined with other techniques to obtain better consequents and facilitates solving more complex biological problems. For instance, Maraspini et al. [69] demonstrated the ability of circle scanning STED-FCS in quantifying spatiotemporal heterogeneities of lipid diffusion in cell membranes.
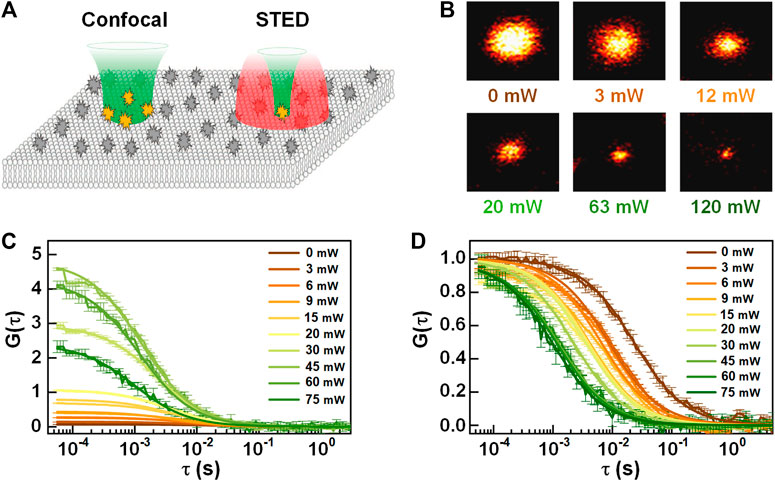
FIGURE 9. Schematic diagram of STED-FCS. (A) The observation volume of confocal (left) and STED (right). Adapted from Ref. [100]. (B) The effective focus size (STED image of a single particle) at the different intensity of the depletion light. (C) Autocorrelation and (D) normalized autocorrelation curves of STED-FCS at different depletion intensity.
Inverse Fluorescence Correlation Spectroscopy
Wennmalm et al. [16] proposed inverse FCS (iFCS), which analyzes the fluctuation of unlabeled particles in the context of a densely labeled surrounding medium. As illustrated by Figures 10A–D, when a nonfluorescent particle transits through the detection volume, a fraction of the fluorescent medium molecules will be replaced by the particle, resulting in a reduction of the fluorescence signal. Therefore, the generated intensity trace F(t) features multiple negative spikes, as shown in Figure 10E. To quantify the molecular density and dynamics of the molecule, the autocorrelation of the intensity trace can be calculated and fitted to the following 3D diffusion model (see Figure 10F) [16]:
where
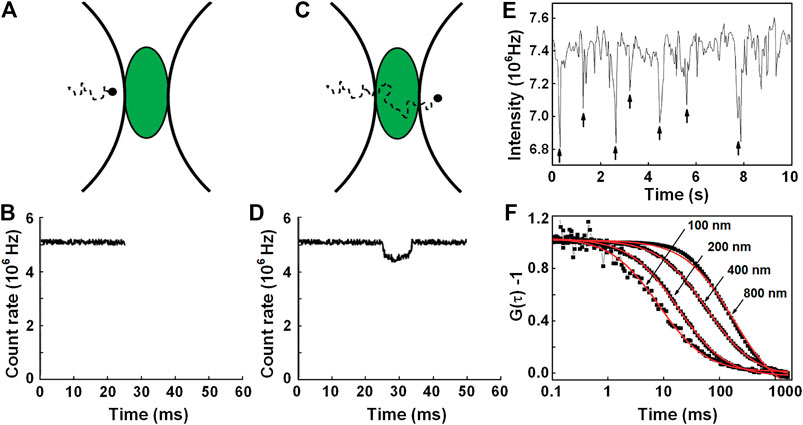
FIGURE 10. Principle illustration of iFCS. (A) ∼ (D) A fluorescence signal is reduced upon the entrance of a non-fluorescent particle into the detection volume. (E) Intensity trace caused by the diffusion of 400-nm beads in 400-μM Alexa 488-medium. (F) Normalized iFCS curves from the diffusion of 100, 200, 400, and 800 nm beads in 400 μM Alexa 488. Adapted from Ref. [16].
iFCS has some advantages above FCS. At first, iFCS provides particle sizes directly from
However, iFCS is limited to the analysis of rather large-volume particles. For instance, Wennmalm’s experiments reveal that the lower limit for the particle size that can be analyzed is ∼ 100 nm diameter with a detection volume of 0.3 fl [16]; in Jiang’s work, the domain which size is five times smaller than the detection area can be detected [101]. To measure the smaller particle, it is necessary for iFCS to perform on the smaller detection volume, such as STED and nanostructured surfaces. The smaller detection volume provides a possibility for iFCS to detect smaller particles. Sandén et al. [105] combined iFCS with subwavelength apertures in plasmonic metal layers, which confines the detection volume to 1.2 × 10⁻⁴ fl, by which they directly examine the volume of a protein molecules allophycocyanin (APC) as 2.5 ± 0.6 × 10⁻⁷ fl in solution. Till yet, iFCS has not been applied in the plasma membranes of living cells [104]. This is mainly because the intercellular environment is very complicated, and different non-labeled cellular organelle are mixed.
Photon Counting Histogram and Fluorescence Intensity Distribution Analysis
In addition to FCS which analyzes the fluorescence fluctuation based on the temporal domain, photon counting histogram (PCH) [17] and fluorescence intensity distribution analysis (FIDA) [18] can extract the molecular brightness (photon counts per second per molecule) and the average number of molecules within the observation volume by analyzing the distribution of fluorescence fluctuation amplitude. In PCH, the fluorescence intensity trace is divided into multiple pieces with equivalent time bins, and the photon counts in each piece (Figure 11A) are integrated, yielding a photon-counting histogram (red curve in Figure 11B). The photon distribution arisen from molecular diffusion in observation volume exhibits a super-Poissonian distribution. The molecular brightness and the average number of molecules can be uniquely extracted by fitting the data with a suitable PCH model, for which Chen et al. derived a model [17]:
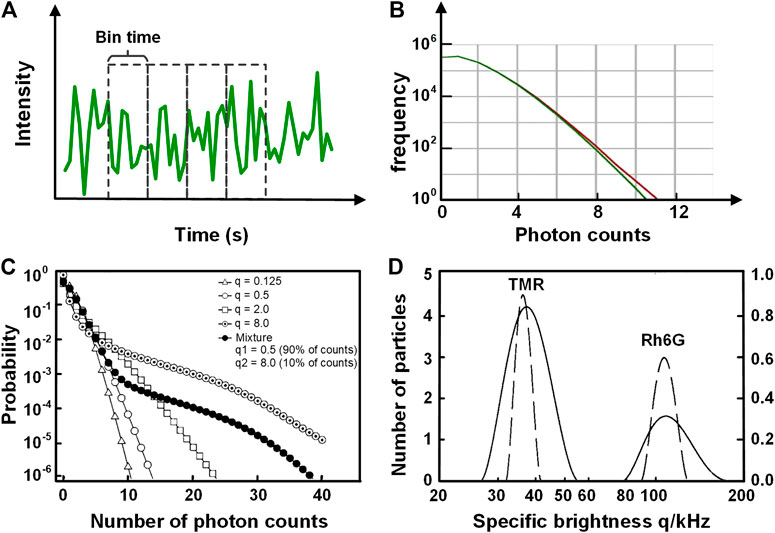
FIGURE 11. Schematic illustration of the principle of PCH and FIDA. (A) The intensity trace used for PCH, which is divided into multiple equivalent time bins. (B) The statistics of the photon number per bin (red) for YFP-tagged beta2-adrenergic proteins within the plasma membrane of HEK293 cells. The histogram (red) is fitted with the PCH model (green). The molecular brightness and the average number of molecules can be acquired from the fitting result. Adapted from [106]. (C) and (D) FIDA analysis on the dyes Rh6G and TMR diffusing in solution (C) The probability distribution for five cases featuring different mean count number q per particle. The open symbols correspond to solutions of single species. The solid line is calculated for a mixture of two species. (D) The brightness histogram of different species obtained from (C) with the inverse transformation with regularization (ITR). The dashed lines correspond to the solutions of single dyes (Rh6G and TMR), and the solid line corresponds to their mixture. Adapted from [18].
Eq. 7 describes the probability of observing k photon counts in an open system for a particle solution with a concentration of
Besides PCH, fluorescence intensity distribution analysis (FIDA), firstly proposed by Kask et al. [18], is also a useful tool that determines the molecular brightness and the concentration by analyzing the distribution of photon counts. In the FIDA analysis, the observation volume is divided into a great number of spatial sections and calculated the distribution of the photon counts in each spatial section:
Both PCH and FIDA analyze the molecular brightness and the average number of molecules within the observation volume. They have both similarities and differences. PCH begins with the calculation of the probability associated with fluctuations for a single particle in a reference volume and then convolutes the histogram of a single particle with n times to generate the histogram for n particles; FIDA begins with the calculation of the histogram for all particle numbers in a small volume and then convolutes it over the whole space, which generates the overall photon counts distribution. However, the theoretical formulations of the two in mathematical have been proved to be equivalence [108]. Meng et al. demonstrated that the numerical efficiency of PCH is faster than FIDA under the condition of power series expansion being used for the PSFs calculation [108].
FCS, PCH, and FIDA are all the methods for analyzing the fluorescence fluctuation within the observation volume. Compared with PCH and FIDA, FCS can acquire information on dynamics such as diffusion coefficients, and it can distinguish two species with different diffusion coefficients. Nevertheless, PCH and FIDA can analyze heterogeneous samples containing multiple species having different molecular brightness.
Applications of Fluorescence Correlation Spectroscopy in Biology
Since its invention, FCS has been extensively demonstrated for various applications in chemistry and life science [4–6], as shown in Figure 12, of which a few representative applications are listed below.
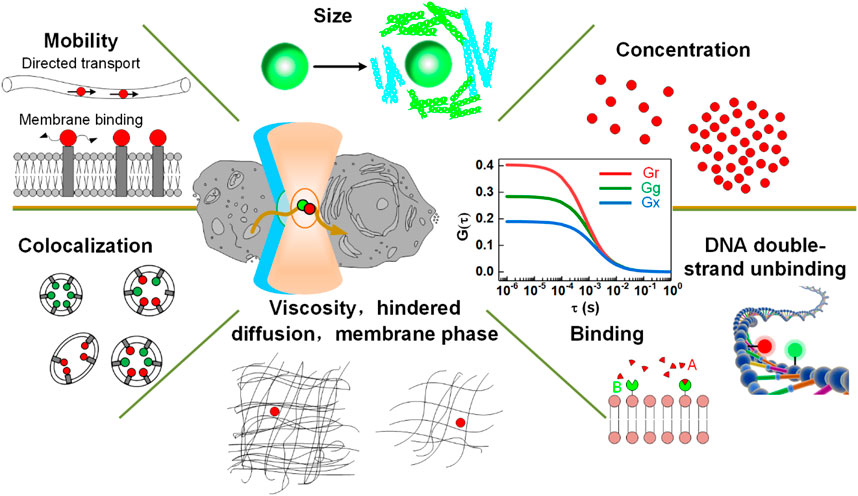
FIGURE 12. Applications of FCS. Adapted from Ref. [114].
Diffusion Coefficient
The first important application of FCS is to measure the diffusion coefficient of biomolecules, which is directly related to the molecular size in a certain surrounding medium. For instance, Priest et al. [109] used FCS to measure the size of an inert fluorescent tracer inside the nucleus of a living cell. Shang et al. [110] utilized FCS to measure the hydrodynamic radius increase of the nanoparticles (NPs) due to protein adsorption. Klapper et al. [111] used FCS to quantify the hydrodynamic radius increase of the lipid-coated quantum dots (QDs) when being adsorbed with blood plasma proteins. Negwer et al. [112] utilized NIR excitation and emission based NIR-FCS to directly monitor the size and the loading efficiency of drug nanocarriers in human blood. Fu et al. [113] implemented multi-photon FCS and detected the dynamics of nanoparticles occurring within the vasculature in the brain of a live mouse. Recently, Struntz et al. [91] utilized SPIM-FCS to derive the diffusion maps of peripheral membrane protein PLC1δ1 in the embryo’s cytoplasm and on the plasma membrane, and the result shows the spatially varying diffusion coefficients of PLC1δ1 across the embryo. Moreover, FCS can be used to quantify shape-related diffusional dynamics. In this regard, Hinde et al. [60] used FCS to quantify the dynamics of four kinds of polymeric nanoparticles with identical surface chemistries but different shapes. The results turned out that these nanoparticles with different shapes behave differently in diffusional rates when moving across various cellular barriers. This finding is potentially useful for defining the site of drug release and optimizing the shape of drugs for effective release.
Rotational Diffusion
Except for the detection of translational diffusions, FCS can also detect rotational diffusion in the nanosecond to the microsecond time range. For the analysis, an exponential term is added to the FCS autocorrelation function considering the contribution of rotational diffusion [115–118]. Then, the rotational diffusion can be quantified from the fitting result. Jerker et al. [118] identified with this method the rotational diffusion of the GFP molecules in the nanosecond time range. Tsay et al. [117] studied the translational and rotational diffusion of peptide-coated semiconductor nanorods (pc-NRs) of various sizes and aspect ratios of the nanorods. The result from polarization-dependent FCS reveals that the pc-NRs with the square length of 12 nm have the translational diffusion constant of 40 ± 10 μm2s-1 and the rotational diffusion constant of (1.5 ± 0.5) × 105 s−1.
Biomolecular Concentration
FCS can also be used to accurately measure the biomolecular concentration in vitro or in vivo by analyzing the amplitude of the correlation curve with a known observation volume. In this pursue, FCS is often used to determine the concentration of dye solutions after being diluted from a stock solution. Ries et al. [42] used dual-color FCCS to determine the concentration of free ligand Fgf8, free receptors (Fgfr1 and Fgfr4), and the ligand-receptor complexes in the cell membrane of living zebrafish embryos.
Viscosity
Moreover, FCS is capable of quantifying the viscosity of a solution, which can be determined from the diffusion coefficient by using the Stokes-Einstein relation. For example, the viscosity of poly (acrylic acid) grafted onto poly (ethylene terephthalate) films was determined by FCS [119].
Binding of Biomolecules
In addition, dual-color FCCS can be used to monitor the binding or unbinding of two kinds of biomolecules labeled with spectrum-distinct fluorophores. For example, Wenger et al. [120] used dual-color FCCS to study the kinetics of enzymatic cleavage reaction at 2-μM DNA oligonucleotide concentration. Verneri et al. [121] used FCS to detect impairment of Oct4-chromatin interactions and measured the dynamics changes in transcription factors Oct4 and Sox2 after differentiation was induced. The results are valuable to the studies of embryo development. Chelladurai et al. [122] used STED-FCS to provide novel insight on the physics/mechanism nanoparticles show enhanced binding tendency on two-component lipid bilayers compared to single-component membranes. This study also revealed how the binding and the diffusion of nanoparticles are linked to sub-diffraction dynamics and structures. Zhang et al. [123] measured by using FCS the degree of the association and dissociation of mRNAs in the different buffer, such as full human serum and human ascitic fluid. Eckert et al. [43] measured the binding of the ligand DKK1 and the receptor LRP6 on cell membranes by utilizing axial lsFCS. In this experiment, the receptor proteins LRP6 were tagged with fluorescent protein mCherry, and the ligand DKK1 with eGFP. Figures 13A, 3B show 3D dual-color images of HEK293T cells with the receptor LRP6-mCherry and the ligand Dkk1 bound on the membrane. Dual-color axial lsFCS were performed at different ligand concentrations spanning from 0.05 to 100 nM. One group of correlation curves are shown in Figure 13C. Using the obtained FCS data, a binding curve can be calculated with Eq. 4, yielding KD = 0.22 ± 0.02 nM for the transiently transfected NCI-H1703 cells expressing LRP6-mCherry. Then, the binding of DKK1-eGFP and LRP6-mCherry on cell membranes were measured for five different cell lines that have different receptor densities. The results in Figure 13D implies that the binding affinity has a strong dependency on the receptor density.
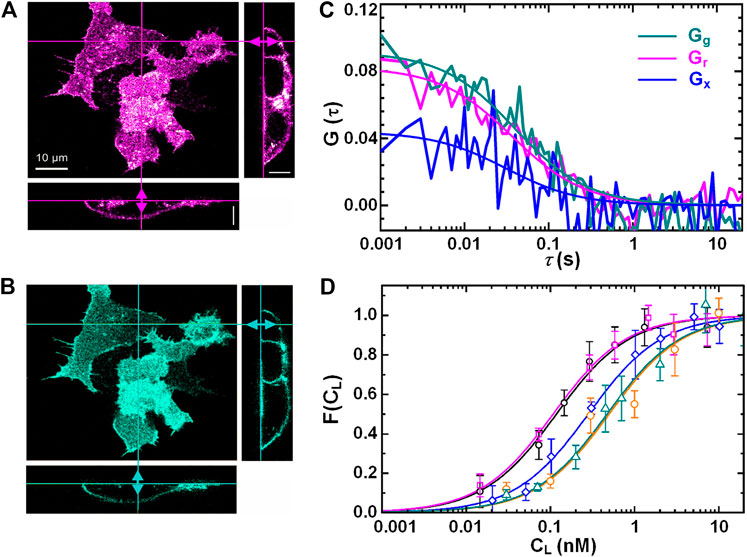
FIGURE 13. Axial line-scanning FCS measurement on the interactions of ligand (DKK1-eGFP) and receptor (LRP6-mCherry) on cell membranes. Dual-color confocal images of live HEK293 T cells in the red channel (A) and the green channel (B). (C) The autocorrelation curves (Gg and Gr) and cross-correlation curve (Gx) on live NCI-H1703 cells. (D) Five binding curves (Fractional occupancies of the receptors) of five different cell-lines with different receptor densities. Adapted from Ref. [43].
Intercellular Obstacles
FCS is also capable of probing the diffusion paths of different directions and mapping the intercellular obstacles. Malacrida et al. [61] applied 2D-pCF to measure EGFP diffusing in MB231 cells. From the connectivity maps (Figures 14A, 4C), they found obstacles inside the nucleus (Figures 14B, 4D). In 2019, Hidde et al. used 2D-pCF to map the environment in cellular synapses perceived by natural killer (NK) cell receptors [62].
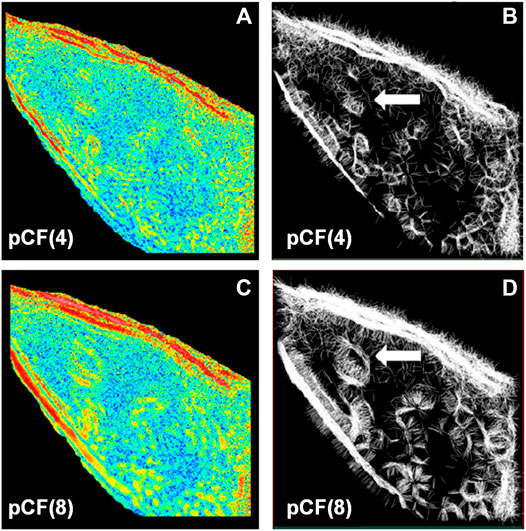
FIGURE 14. .2D-pCF analysis of EGFP diffusing in MB231 cells. (A) and (C) The eccentricity of the diffusion calculated by using a pair of locations having a distance of 4 and 8 pixels. (B) and (D) The connectivity map is calculated by using a pair of locations having a distance of 4 and 8 pixels. The white arrows in (B) and (D) indicate an obstacle that forces the molecules to go around. Adapted from Ref. [61].
Developing Trend in Fluorescence Correlation Spectroscopy Applications
To determine more comprehensive dynamic information, multiple analysis on biomolecular diffusion have been used recently. For instance, Rienzo et al. [124] combined 2D pCF with iMSD to generate a fluorescence-fluctuation-based diffusion tensor that contains information on the speed and directionality of the local dynamical processes. Thus, the results provided a fresh insight into the GFP diffusion in the cytoplasm of E. coli and the dynamics of a protein diffusing on the plasma membrane of eukaryotic cells. Besides, Scipioni et al. [125] combined spot-variation FCS, 2D pCF, and iMSD to provide a comprehensive analysis of free GFP diffusing in live cells at different subcellular compartments.
In recent years, Malengo et al. [126] used FCS and PCH to estimate the diffusion coefficient and oligomerization state of GPI-anchored proteins. They showed that the mobile fractions of the two proteins uPAR-G and D2D3-G have comparable diffusion coefficients despite they are constituted by monomers and dimers, respectively. James et al. [127] implemented PCH and FCS in a confocal system for single-molecule detection. They found that the detection of single α-synuclein amyloid fibrils with this method has improved sensitivity of more than 105-fold over bulk measurements. Scale et al. [128] proposed correlated PCH (cPCH), which reflects the probability to detect both a particular number of photons at the current time and another number at a later time. cPCH unifies FCS and PCH to resolve different fluorescent species using the information of their brightness and diffusion. They demonstrated that two species differing in both their diffusion and brightness can be better resolved with cPCH than with either FCS or PCH.
Summary
Being a powerful tool for detecting molecular concentration, hydrodynamic radius, diffusional dynamics, and the interaction of different biomolecules, FCS has been widely applied to different fields. Except for the applications in biology, FCS also has been applied in other fields [129–131]. For instance, FCS has been applied in physics for the study of dynamics/structure of liquid crystal molecules on silicon wafers [131], as well as anomalous diffusion inside soft colloidal suspensions [130]. We believe that, with further developments of lasers and sensors, FCS will become a more and more powerful tool for the study of molecular dynamics in different fields.
FCS has the advantages of high spatial and temporal resolution, short analysis time, and high sensitivity. Recently, novel techniques have been developed as extensions of FCS. Dual-color FCCS was proposed to quantify molecular interactions without the limitation of molecular size but need to correct incomplete overlap of two-color detection volume. Multi-focus FCS can provide spatial information at several points but is limited in time resolution. pCF is performed by calculating the correlation between a pair of points and thus provides spatial information. Scanning FCS is suitable for measuring membrane-associated dynamics since it avoids photobleaching and the artifact induced by membrane movement. Of note, the recent axial line-scanning FCS has a significantly enhanced time resolution (∼50 μs), targeting the dynamics on time-varying membranes. TIR-FCS measures molecular motion that occurs in the sample surface specifically. SPIM-FCS detects dynamic information from thousands of points simultaneously and avoids the noise from out-of-focus regions. STED-FCS reduces detection volume and allows measuring biomolecular dynamics in nanoscale or with a much higher concentration. Inverse-FCS measures unlabeled particles in a dense fluorescent medium, then provides particle size and concentration independent of the diffusional dynamic. While, this method is only applicable to relatively large particles (preferably with particle radius ≥ 40 nm). While, if being combined with STED, iFCS can detect particles with even smaller diameters. PCH and FIDA, being parallel techniques to FCS, can determine the molecular brightness and is capable of measuring heterogeneous samples with multiple species. The features and capabilities of different FCS technique have been summarized in Table 1.
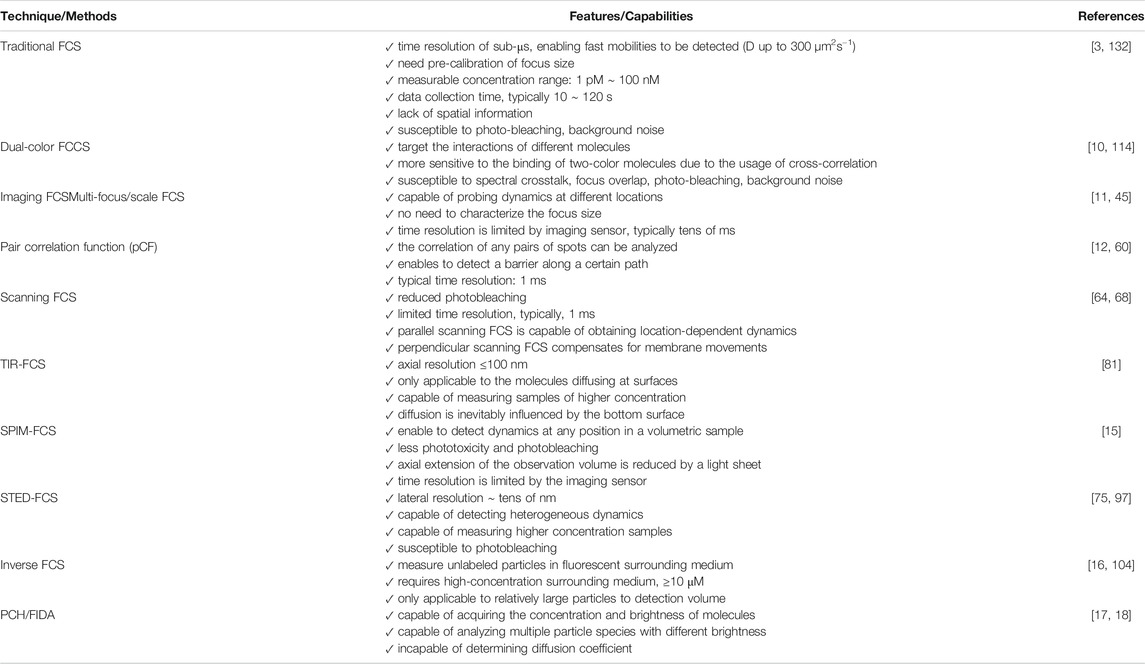
TABLE 1. Overview of different FCS techniques.
It is worthy to point out that FCS also has some drawbacks. The results of FCS are easily handicapped by many factors in the experimental system or sample preparation. First, The observation volume changes with specific experimental settings, such as the cover-slide thickness variation and index mismatch [44]. Second, the focus volumes of two-color excitation pulses are different in dual-color FCCS, which may decrease the amplitude of cross-correlation. So we must correct it during data processing. Third, FCS is not suited for samples with a tendency to aggregate. When FCS is used to measure aggregating samples, the correlation curves become ill-shaped and poorly reproducible because a few very bright aggregates can distort the entire data set [133]. Therefore, a careful selection of an intensity trace is necessary in this case. Fourth, the photobleaching of fluorophores at high excitation powers is usually unavoidable during the measurements. The photobleaching reduces the fluorescence intensity over time and results in a reduction of the concentration and increase of the diffusion coefficient. So the compensation for the effect of photobleaching on both the intensity trace and the measured amplitude of the correlation curves is important [43]. Fifth, the measurable concentration range is limited to 1 pM ∼ 100 nM with FCS. The lower limit is set to guarantee the fluorescence fluctuation is larger than the noise, and the upper limit is set to guarantee the fluctuation is sufficient (more molecules in focus will have a lower fluctuation). Sixth, FCS is, in essence, a statistical method, and the result obtained with FCS presents the average behavior of a large number of molecules. By contrast, single molecular tracking (SMT) enables to provide dynamics for specific molecules by taking image series, leading to insensitivity to single-molecule heterogeneity.
Being driven by the above-mentioned drawbacks of FCS and the existence of essentially complex problems in biology, there is still a need to further improve FCS in the future. First, the experimental setups of FCS can be further improved, e.g., to further enhance the temporal and spatial resolution. Second, the optimization of FCS mathematical models is expected to fit better specific experimental settings. Third, the extension of dual-color FCCS to multi-color FCS is needed to support this scenario where the interactions among multiple species are involved in reality. Fourth, the combination of FCS with other technologies is still in need to fit a complex biological application, considering different methods feature different advantages and limitations.
Author Contributions
PG conceived the manuscript. LY and YL wrote the draft of the manuscript; YM, ML, JZ, and DD organized the manuscript; all the authors edited the article.
Conflict of Interest
The authors declare that the research was conducted in the absence of any commercial or financial relationships that could be construed as a potential conflict of interest.
Acknowledgments
This work was supported by the National Natural Science Foundation of China (NSFC 62075177); the Natural Science Foundation of Shaanxi Province (2020JM-193, 2020JQ-324); China Postdoctoral Science Foundation (2017M610623); the National Natural Science Foundation of China (91750106), and the Research Fund of State Key Laboratory of Transient Optics and Photonics.
Supplementary Material
The Supplementary Material for this article can be found online at: https://www.frontiersin.org/articles/10.3389/fphy.2021.644450/full#supplementary-material.
References
1. Elson EL 40 Years of FCS: how it all began. Meth Enzymol (2013) 518:1–10. doi:10.1016/B978-0-12-388422-0.00001-7
2. Elson EL, Magde D Fluorescence correlation spectroscopy. I. Conceptual basis and theory. Biopolymers (1974) 13:1–27. doi:10.1002/bip.1974.360130102
3. Elson EL Fluorescence correlation spectroscopy: past, present, future. Biophys J (2011) 101:2855–70. doi:10.1016/j.bpj.2011.11.012
4. Moro MM, Silvio DD, Moya SE Fluorescence correlation spectroscopy as a tool for the study of the intracellular dynamics and biological fate of protein corona. Biophys Chem (2019) 253:106218. doi:10.1016/j.bpc.2019.106218
5. Mutze J, Ohrt T, Schwille P,Fluorescence correlation spectroscopy: detecting and interpreting the mobility of transmembrane proteins in vivo. Curr Protoc Toxicol. Chapter 2 (2011) Laser Photonics Rev p. 52–67. doi:10.1002/lpor.20091004110.1002/0471140856.tx0219s48
6. Macháň R, Wohland T Recent applications of fluorescence correlation spectroscopy in live systems. FEBS Lett (2014) 588:3571–84. doi:10.1016/j.febslet.2014.03.056
7. Nienhaus GU, Maffre P, Nienhaus K Studying the protein corona on nanoparticles by FCS. Meth Enzymol (2013) 519:115–37. doi:10.1016/B978-0-12-405539-1.00004-X
8. Magde D, Elson E, Webb WW Thermodynamic fluctuations in a reacting system-measurement by fluorescence correlation spectroscopy. Phys Rev Lett (1972) 29:705–8. doi:10.1103/physrevlett.29.705
9. Rigler R, Mets U Diffusion of single molecules through a Gaussian laser beam. Proc SPIE (1993) 1921:239–48. doi:10.1117/12.146154
10. Bacia K, Schwille P Practical guidelines for dual-color fluorescence cross-correlation spectroscopy. Nat Protoc (2007) 2:2842–56. doi:10.1038/nprot.2007.410
11. Baum M, Erdel F, Wachsmuth M, Rippe K Retrieving the intracellular topology from multi-scale protein mobility mapping in living cells. Nat Commun (2014) 5:4494. doi:10.1038/ncomms5494
12. Digman MA, Gratton E Imaging barriers to diffusion by pair correlation functions. Biophys J (2009) 97:665–73. doi:10.1016/j.bpj.2009.04.048
13. Petersen NO Scanning fluorescence correlation spectroscopy. I. Theory and simulation of aggregation measurements. Biophys J (1986) 49:809–15. doi:10.1016/s0006-3495(86)83709-2
14. Kastrup L, Blom H, Eggeling C, Hell SW Fluorescence fluctuation spectroscopy in subdiffraction focal volumes. Phys Rev Lett (2005) 94:178104. doi:10.1103/PhysRevLett.94.178104
15. Wohland T, Shi X, Sankaran J, Stelzer EH Single plane illumination fluorescence correlation spectroscopy (SPIM-FCS) probes inhomogeneous three-dimensional environments. Opt Express (2010) 18:10627–41. doi:10.1364/OE.18.010627
16. Wennmalm S, Thyberg P, Xu L, Widengren J Inverse-fluorescence correlation spectroscopy. Anal Chem (2009) 81:9209–15. doi:10.1021/ac9010205
17. Chen Y, Müller JD, Berland KM, Gratton E Fluorescence fluctuation spectroscopy. Methods (1999) 19:234–52. doi:10.1016/s0006-3495(99)76912-210.1006/meth.1999.0854
18. Kask P, Palo K, Ullmann D, Gall K Fluorescence-intensity distribution analysis and its application in biomolecular detection technology. Proc Natl Acad Sci USA (1999) 96:13756–61. doi:10.1073/pnas.96.24.13756
19. Müller BK, Zaychikov E, Bräuchle C, Lamb DC Pulsed interleaved excitation. Biophys J (2005) 89:3508–22. doi:10.1529/biophysj.105.064766
20. Dong J, Bi R, Ho JH, Thong PS, Soo KC, Lee K Diffuse correlation spectroscopy with a fast Fourier transform-based software autocorrelator. J Biomed Opt (2012) 17:97004–1. doi:10.1117/1.jbo.17.9.097004
21. Martinez MM, Reif RD, Pappas D Early detection of apoptosis in living cells by fluorescence correlation spectroscopy. Anal Bioanal Chem (2010) 396:1177–85. doi:10.1007/s00216-009-3298-3
22. Li Y, Shivnaraine RV, Huang F, Wells JW, Gradinaru CC Ligand-induced coupling between oligomers of the M2 receptor and the Gi1 protein in live cells. Biophysical J (2018) 115:881–95. doi:10.1016/j.bpj.2018.08.001
23. Zou L, Gao N, Xiao Q Research of photon correlation technology. IOP Conf Ser Mater Sci Eng (2020) 711:012097. doi:10.1088/1757-899x/711/1/012097
24. Tian Y, Martinez MM, Pappas D Fluorescence correlation spectroscopy: a review of biochemical and microfluidic applications. Appl Spectrosc (2011) 65:115A. doi:10.1366/10-06224
25. Günther J-P, Börsch M, Fischer P Diffusion measurements of swimming enzymes with fluorescence correlation spectroscopy. Acc Chem Res (2018) 51:1911–20. doi:10.1021/acs.accounts.8b00276
26. Chojnacki J, Waithe D, Carravilla P, Huarte N, Galiani S, Enderlein J, et al. Envelope glycoprotein mobility on HIV-1 particles depends on the virus maturation state. Nat Commun (2017) 8:545. doi:10.1038/s41467-017-00515-6
27. Wissner RF, Steinauer A, Knox SL, Thompson AD, Schepartz A Fluorescence correlation spectroscopy reveals efficient cytosolic delivery of protein cargo by cell-permeant miniature proteins. ACS Cent Sci (2018) 4:1379–93. doi:10.1021/acscentsci.8b00446
28. Tiwari M, Mikuni S, Muto H, Kinjo M Determination of dissociation constant of the NFκB p50/p65 heterodimer using fluorescence cross-correlation spectroscopy in the living cell. Biochem Biophys Res Commun (2013) 436:430–5. doi:10.1016/j.bbrc.2013.05.121
29. Su D, Hou Y, Dong C, Ren J Fluctuation correlation spectroscopy and its applications in homogeneous analysis. Anal Bioanal Chem (2019) 411:4523–40. doi:10.1007/s00216-019-01884-1
30. Eigen M, Rigler R Sorting single molecules: application to diagnostics and evolutionary biotechnology. Proc Natl Acad Sci USA (1994) 91:5740–7. doi:10.1073/pnas.91.13.5740
31. Schwille P, Meyer-Almes FJ, Rigler R Dual-color fluorescence cross-correlation spectroscopy for multicomponent diffusional analysis in solution. Biophys J (1997) 72:1878–86. doi:10.1016/s0006-3495(97)78833-7
32. Dorlich RM, Chen Q, Hedde PN, Schuster V, Hippler M, Wesslowski J, et al. Dual-color dual-focus line-scanning FCS for quantitative analysis of receptor-ligand interactions in living specimens. Sci Rep (2015) 5:10149. doi:10.1038/srep10149
33. Ruan Q, Tetin SY Applications of dual-color fluorescence cross-correlation spectroscopy in antibody binding studies. Anal Biochem (2008) 374:182–95. doi:10.1016/j.ab.2007.11.007
34. Kaliszewski MJ, Shi X, Hou Y, Lingerak R, Kim S, Mallory P, et al. Quantifying membrane protein oligomerization with fluorescence cross-correlation spectroscopy. Methods (2018) 140-141:40–51. doi:10.1016/j.ymeth.2018.02.002
35. Bleicken S, Hantusch A, Das KK, Frickey T, Garcia-Saez AJ Quantitative interactome of a membrane Bcl-2 network identifies a hierarchy of complexes for apoptosis regulation. Nat Commun (2017) 8:73. doi:10.1038/s41467-017-00086-6
36. Tiwari M, Oasa S, Yamamoto J, Mikuni S, Kinjo M A quantitative study of internal and external interactions of homodimeric glucocorticoid receptor using fluorescence cross-correlation spectroscopy in a live cell. Sci Rep (2017) 7:4336. doi:10.1038/s41598-017-04499-7
37. Padilla-Parra S, Audugé N, Coppey-Moisan M, Tramier M Quantitative study of protein-protein interactions in live cell by dual-color fluorescence correlation spectroscopy. Methods Mol Biol (2014) 1076:683–98. doi:10.1007/978-1-62703-649-8_31
38. Bacia K, Petrášek Z, Schwille P Correcting for spectral cross-talk in dual-color fluorescence cross-correlation spectroscopy. Chemphyschem (2012) 13:1221–31. doi:10.1002/cphc.201100801
39. Padilla-Parra S, Audugé N, Coppey-Moisan M, Tramier M Dual-color fluorescence lifetime correlation spectroscopy to quantify protein-protein interactions in live cell. Microsc Res Tech (2011) 74:788–93. doi:10.1002/jemt.21015
40. Schwille P, Haupts U, Maiti S, Webb WW Molecular dynamics in living cells observed by fluorescence correlation spectroscopy with one- and two-photon excitation. Biophys J (1999) 77:2251–65. doi:10.1016/s0006-3495(99)77065-7
41. Berland KM, So PT, Gratton E Two-photon fluorescence correlation spectroscopy: method and application to the intracellular environment. Biophys J (1995) 68:694–701. doi:10.1016/s0006-3495(95)80230-4
42. Ries J, Yu SR, Burkhardt M, Brand M, Schwille P Modular scanning FCS quantifies receptor-ligand interactions in living multicellular organisms. Nat Methods (2009) 6:643–5. doi:10.1038/nmeth.1355
43. Eckert AF, Gao P, Wesslowski J, Wang X, Rath J, Nienhaus K, et al. Measuring ligand-cell surface receptor affinities with axial line-scanning fluorescence correlation spectroscopy. eLife (2020) 9:e55286. doi:10.7554/eLife.55286
44. Dertinger T, Loman A, Ewers B, Müller CB, Krämer B, Enderlein J The optics and performance of dual-focus fluorescence correlation spectroscopy. Opt Express (2008) 16:14353–68. doi:10.1364/oe.16.014353
45. Pieper C, Weiß K, Gregor I, Enderlein J Dual-focus fluorescence correlation spectroscopy. Meth Enzymol (2013) 518:175–204. doi:10.1016/B978-0-12-388422-0.00008-X
46. Dertinger T, Pacheco V, von der Hocht I, Hartmann R, Gregor I, Enderlein J Two-focus fluorescence correlation spectroscopy: a new tool for accurate and absolute diffusion measurements. Chemphyschem (2007) 8:433–43. doi:10.1002/cphc.200600638
47. Loman A, Dertinger T, Koberling F, Enderlein J Comparison of optical saturation effects in conventional and dual-focus fluorescence correlation spectroscopy. Chem Phys Lett (2008) 459:18–21. doi:10.1016/j.cplett.2008.05.018
48. Weiß K, Neef A, Van Q, Kramer S, Gregor I, Enderlein J Quantifying the diffusion of membrane proteins and peptides in black lipid membranes with 2-focus fluorescence correlation spectroscopy. Biophys J (2013) 105:455–62. doi:10.1016/j.bpj.2013.06.004
49. Krieger JW, Singh AP, Bag N, Garbe CS, Saunders TE, Langowski J, et al. Imaging fluorescence (cross-) correlation spectroscopy in live cells and organisms. Nat Protoc (2015) 10:1948–74. doi:10.1038/nprot.2015.100
50. Otosu T, Ishii K, Tahara T Multifocus fluorescence correlation spectroscopy with spatially separated excitation beams. Bcsj (2019) 92:1495–502. doi:10.1246/bcsj.20190109
51. Needleman DJ, Xu Y, Mitchison TJ Pin-hole array correlation imaging: highly parallel fluorescence correlation spectroscopy. Biophys J (2009) 96:5050–9. doi:10.1016/j.bpj.2009.03.023
52. Capoulade J, Wachsmuth M, Hufnagel L, Knop M Quantitative fluorescence imaging of protein diffusion and interaction in living cells. Nat Biotechnol (2011) 29:835–9. doi:10.1038/nbt.1928
53. Hebert B, Costantino S, Wiseman PW Spatiotemporal image correlation spectroscopy (STICS) theory, verification, and application to protein velocity mapping in living CHO cells. Biophys J (2005) 88:3601–14. doi:10.1529/biophysj.104.054874
54. Di Rienzo C, Gratton E, Beltram F, Cardarelli F Fast spatiotemporal correlation spectroscopy to determine protein lateral diffusion laws in live cell membranes. Proc Natl Acad Sci USA (2013) 110:12307. doi:10.1073/pnas.1222097110
55. Kolin DL, Ronis D, Wiseman PW K-space image correlation spectroscopy: a method for accurate transport measurements independent of fluorophore photophysics. Biophys J (2006) 91:3061–75. doi:10.1529/biophysj.106.082768
56. Maffre P, Nienhaus K, Amin F, Parak WJ, Nienhaus GU Characterization of protein adsorption onto FePt nanoparticles using dual-focus fluorescence correlation spectroscopy. Beilstein J Nanotechnol (2011) 2:374–83. doi:10.3762/bjnano.2.43
57. Rossow MJ, Sasaki JM, Digman MA, Gratton E Raster image correlation spectroscopy in live cells. Nat Protoc (2010) 5:1761–74. doi:10.1038/nprot.2010.122
58. Digman MA, Gratton E Lessons in fluctuation correlation spectroscopy. Annu Rev Phys Chem (2011) 62:645–68. doi:10.1146/annurev-physchem-032210-103424
59. Bianchini P, Cardarelli F, Di Luca M, Diaspro A, Bizzarri R Nanoscale protein diffusion by STED-based pair correlation analysis. PLoS One (2014) 9:e99619. doi:10.1371/journal.pone.0099619
60. Hinde E, Thammasiraphop K, Duong HT, Yeow J, Karagoz B, Boyer C, et al. Pair correlation microscopy reveals the role of nanoparticle shape in intracellular transport and site of drug release. Nat Nanotechnol (2017) 12:81–9. doi:10.1038/nnano.2016.160
61. Malacrida L, Hedde PN, Ranjit S, Cardarelli F, Gratton E Visualization of barriers and obstacles to molecular diffusion in live cells by spatial pair-cross-correlation in two dimensions. Biomed Opt Express (2018) 9:303–21. doi:10.1364/boe.9.000303
62. Hedde PN, Staaf E, Singh SB, Johansson S, Gratton E Pair correlation analysis maps the dynamic two-dimensional organization of natural killer cell receptors at the synapse. ACS Nano (2019) 13:14274–82. doi:10.1021/acsnano.9b07486
63. Hinde E, Pandžić E, Yang Z, Ng IH, Jans DA, Bogoyevitch MA, et al. Quantifying the dynamics of the oligomeric transcription factor STAT3 by pair correlation of molecular brightness. Nat Commun (2016) 7:11047. doi:10.1038/ncomms11047
64. Petrásek Z, Ries J, Schwille P Scanning FCS for the characterization of protein dynamics in live cells. Meth Enzymol (2010) 472:317–43. doi:10.1016/S0076-6879(10)72005-X
65. Petrášek Z, Schwille P Scanning fluorescence correlation spectroscopy. In: R Rigler, and H Vogel, editors. Single molecules and nanotechnology. Berlin, Heidelberg: Springer Berlin Heidelberg (2008). p. 83–105.
66. Ries J, Chiantia S, Schwille P Accurate determination of membrane dynamics with line-scan FCS. Biophys J (2009) 96:1999–2008. doi:10.1016/j.bpj.2008.12.3888
67. Petrášek Z, Derenko S, Schwille P Circular scanning fluorescence correlation spectroscopy on membranes. Opt Express (2011) 19:25006–21. doi:10.1364/oe.19.025006
68. Ruan Q, Cheng MA, Levi M, Gratton E, Mantulin WW Spatial-temporal studies of membrane dynamics: scanning fluorescence correlation spectroscopy (SFCS). Biophys J (2004) 87:1260–7. doi:10.1529/biophysj.103.036483
69. Maraspini R, Beutel O, Honigmann A Circle scanning STED fluorescence correlation spectroscopy to quantify membrane dynamics and compartmentalization. Methods (2018) 140-141:188–97. doi:10.1016/j.ymeth.2017.12.005
70. Gunther G, Jameson DM, Aguilar J, Sánchez SA Scanning fluorescence correlation spectroscopy comes full circle. Methods (2018) 140-141:52–61. doi:10.1016/j.ymeth.2018.01.023
71. Ries J, Schwille P New concepts for fluorescence correlation spectroscopy on membranes. Phys Chem Chem Phys (2008) 10:3487–97. doi:10.1039/b718132a
72. Humpolíčková J, Gielen E, Benda A, et al. Probing diffusion laws within cellular membranes by Z-scan fluorescence correlation spectroscopy. Biophys J (2006) 91:L23–L5. doi:10.1529/biophysj.106.089474
73. Hink MA, Postma M Monitoring receptor oligomerization by line-scan fluorescence cross-correlation spectroscopy. Methods Cel Biol (2013) 117:197–212. doi:10.1016/b978-0-12-408143-7.00011-6
74. Eggeling C STED-FCS nanoscopy of membrane dynamics. In: Y Mély, and G Duportail, editors. Fluorescent methods to study biological membranes. Berlin, Heidelberg: Springer Berlin Heidelberg (2013). p. 291–309.
75. Sezgin E, Schneider F, Galiani S, Urbančič I, Waithe D, Lagerholm BC, et al. Measuring nanoscale diffusion dynamics in cellular membranes with super-resolution STED-FCS. Nat Protoc (2019) 14:1054–83. doi:10.1038/s41596-019-0127-9
77. Blom H, Kastrup L, Eggeling C Fluorescence fluctuation spectroscopy in reduced detection volumes. Curr Pharm Biotechnol (2006) 7:51–66. doi:10.2174/138920106775789629
78. Thompson NL, Burghardt TP, Axelrod D Measuring surface dynamics of biomolecules by total internal reflection fluorescence with photobleaching recovery or correlation spectroscopy. Biophys J (1981) 33:435–54. doi:10.1016/s0006-3495(81)84905-3
79. Grigoriev I, Akhmanova A Microtubule dynamics at the cell cortex probed by TIRF microscopy. In: L Cassimeris, and P Tran, editors. Method cell biol, 97. Academic Press (2010). p. 91–109. doi:10.1016/S0091-679X(10)97006-4
80. Axelrod D Total internal reflection fluorescence microscopy in cell biology. Traffic (2001) 2:764–74. doi:10.1034/j.1600-0854.2001.21104.x
81. Thompson NL, Steele BL Total internal reflection with fluorescence correlation spectroscopy. Nat Protoc (2007) 2:878–90. doi:10.1038/nprot.2007.110
82. Hassler K, Leutenegger M, Rigler P, Rao R, Rigler R, Gösch M, et al. Total internal reflection fluorescence correlation spectroscopy (TIR-FCS) with low background and high count-rate per molecule. Opt Express (2005) 13:7415–23. doi:10.1364/OPEX.13.007415
83. Ries J, Petrov EP, Schwille P Total internal reflection fluorescence correlation spectroscopy: effects of lateral diffusion and surface-generated fluorescence. Biophys J (2008) 95:390–9. doi:10.1529/biophysj.107.126193
84. Starr TE, Thompson NL Total internal reflection with fluorescence correlation spectroscopy: combined surface reaction and solution diffusion. Biophys J (2001) 80:1575–84. doi:10.1016/s0006-3495(01)76130-9
85. Lieto AM, Thompson NL Total internal reflection with fluorescence correlation spectroscopy: nonfluorescent competitors. Biophys J (2004) 87:1268–78. doi:10.1529/biophysj.103.035030
86. Thompson NL, Wang X, Navaratnarajah P Total internal reflection with fluorescence correlation spectroscopy: applications to substrate-supported planar membranes. J Struct Biol (2009) 168:95–106. doi:10.1016/j.jsb.2009.02.013
87. Foquet M, Korlach J, Zipfel W, Webb WW, Craighead HG DNA fragment sizing by single molecule detection in submicrometer-sized closed fluidic channels. Anal Chem (2002) 74:1415–22. doi:10.1021/ac011076w
88. Langowski J Single plane illumination microscopy as a tool for studying nucleome dynamics. Methods (2017) 123:3–10. doi:10.1016/j.ymeth.2017.06.021
89. Ng XW, Teh C, Korzh V, Wohland T The secreted signaling protein Wnt3 is associated with membrane domains in vivo: a SPIM-FCS study. Biophys J (2016) 111:418–29. doi:10.1016/j.bpj.2016.06.021
90. Singh AP, Krieger JW, Buchholz J, Charbon E, Langowski J, Wohland T The performance of 2D array detectors for light sheet based fluorescence correlation spectroscopy. Opt Express (2013) 21:8652–68. doi:10.1364/oe.21.008652
91. Struntz P, Weiss M Multiplexed measurement of protein diffusion inCaenorhabditis elegansembryos with SPIM-FCS. J Phys D: Appl Phys (2015) 49:044002. doi:10.1088/0022-3727/49/4/044002
92. Krieger JW, Singh AP, Garbe CS, Wohland T, Langowski J Dual-color fluorescence cross-correlation spectroscopy on a single plane illumination microscope (SPIM-FCCS). Opt Express (2014) 22:2358–75. doi:10.1364/OE.22.002358
93. Pernuš A, Langowski J Imaging fos-jun transcription factor mobility and interaction in live cells by single plane illumination-fluorescence cross correlation spectroscopy. PLoS One (2015) 10:e0123070. doi:10.1371/journal.pone.0123070
94. Hell SW, Wichmann J Breaking the diffraction resolution limit by stimulated emission: stimulated-emission-depletion fluorescence microscopy. Opt Lett (1994) 19:780–2. doi:10.1364/ol.19.000780
95. Gao P, Prunsche B, Zhou L, Nienhaus K, Nienhaus GU Background suppression in fluorescence nanoscopy with stimulated emission double depletion. Nat Photon (2017) 11:163–9. doi:10.1038/nphoton.2016.279
96. Vicidomini G, Schönle A, Ta H, Han KY, Moneron G, Eggeling C, et al. STED nanoscopy with time-gated detection: theoretical and experimental aspects. PLoS One (2013) 8:e54421. doi:10.1371/journal.pone.0054421
97. Lanzanò L, Scipioni L, Di Bona M, Bianchini P, Bizzarri R, Cardarelli F, et al. Measurement of nanoscale three-dimensional diffusion in the interior of living cells by STED-FCS. Nat Commun (2017) 8:65. doi:10.1038/s41467-017-00117-2
98. Eggeling C, Ringemann C, Medda R, Schwarzmann G, Sandhoff K, Polyakova S, et al. Direct observation of the nanoscale dynamics of membrane lipids in a living cell. Nature (2009) 457:1159–62. doi:10.1038/nature07596
99. Andrade DM, Clausen MP, Keller J, Mueller V, Wu C, Bear JE, et al. Cortical actin networks induce spatio-temporal confinement of phospholipids in the plasma membrane--a minimally invasive investigation by STED-FCS. Sci Rep (2015) 5:11454. doi:10.1038/srep11454
100. Hedde PN, Dörlich RM, Blomley R, Gradl D, Oppong E, Cato AC, et al. Stimulated emission depletion-based raster image correlation spectroscopy reveals biomolecular dynamics in live cells. Nat Commun (2013) 4:2093. doi:10.1038/ncomms3093
101. Jiang Y, Pryse KM, Melnykov A, Genin GM, Elson EL Investigation of nanoscopic phase separations in lipid membranes using inverse FCS. Biophys J (2017) 112:2367–76. doi:10.1016/j.bpj.2017.04.013
102. Wennmalm S, Widengren J Inverse-fluorescence cross-correlation spectroscopy. Anal Chem (2010) 82:5646–51. doi:10.1021/ac1006409
103. Bergstrand J, Rönnlund D, Widengren J, Wennmalm S Scanning inverse fluorescence correlation spectroscopy. Opt Express (2014) 22:13073–90. doi:10.1364/OE.22.013073
104. Wennmalm S Potentials and pitfalls of inverse fluorescence correlation spectroscopy. Methods (2018) 140-141:23–31. doi:10.1016/j.ymeth.2018.01.005
105. Sandén T, Wyss R, Santschi C, Hassaïne G, Deluz C, Martin OJ, et al. A zeptoliter volume meter for analysis of single protein molecules. Nano Lett (2012) 12:370–5. doi:10.1021/nl2036468
106. Herrick-Davis K, Mazurkiewicz JE Fluorescence correlation spectroscopy and photon-counting histogram analysis of receptor-receptor interactions. In: PM Conn, editor. Method cell biol, 117. Academic Press (2013). p. 181–96. doi:10.1016/B978-0-12-408143-7.00010-4
107. Müller JD, Chen Y, Gratton E Resolving heterogeneity on the single molecular level with the photon-counting histogram. Biophys J (2000) 78:474–86. doi:10.1016/S0006-3495(00)76610-0
108. Meng F, Ma H A comparison between photon counting histogram and fluorescence intensity distribution analysis. J Phys Chem B (2006) 110:25716–20. doi:10.1021/jp063845r
109. Priest DG, Solano A, Lou J, Hinde E Fluorescence fluctuation spectroscopy: an invaluable microscopy tool for uncovering the biophysical rules for navigating the nuclear landscape. Biochem Soc T (2019) 47:1117–29. doi:10.1042/BST20180604
110. Shang L, Nienhaus GU In Situ characterization of protein adsorption onto nanoparticles by fluorescence correlation spectroscopy. Acc Chem Res (2017) 50:387–95. doi:10.1021/acs.accounts.6b00579
111. Klapper Y, Maffre P, Shang L, Ekdahl KN, Nilsson B, Hettler S, et al. Low affinity binding of plasma proteins to lipid-coated quantum dots as observed by in situ fluorescence correlation spectroscopy. Nanoscale (2015) 7:9980–4. doi:10.1039/c5nr01694k
112. Negwer I, Best A, Schinnerer M, Schäfer O, Capeloa L, Wagner M, et al. Monitoring drug nanocarriers in human blood by near-infrared fluorescence correlation spectroscopy. Nat Commun (2018) 9:5306. doi:10.1038/s41467-018-07755-0
113. Fu X, Sompol P, Brandon JA, Norris CM, Wilkop T, Johnson LA, et al. In vivo single-molecule detection of nanoparticles for multiphoton fluorescence correlation spectroscopy to quantify cerebral blood flow. Nano Lett (2020) 20:6135–41. doi:10.1021/acs.nanolett.0c02280
114. Bacia K, Kim SA, Schwille P Fluorescence cross-correlation spectroscopy in living cells. Nat Methods (2006) 3:83–9. doi:10.1038/nmeth822
115. Yamamoto J, Oura M, Yamashita T, Miki S, Jin T, Haraguchi T, et al. Rotational diffusion measurements using polarization-dependent fluorescence correlation spectroscopy based on superconducting nanowire single-photon detector. Opt Express (2015) 23:32633–42. doi:10.1364/OE.23.032633
116. Pieper CM, Enderlein J Fluorescence correlation spectroscopy as a tool for measuring the rotational diffusion of macromolecules. Chem Phys Lett (2011) 516:1–11. doi:10.1016/j.cplett.2011.06.091
117. Tsay JM, Doose S, Weiss S Rotational and translational diffusion of peptide-coated CdSe/CdS/ZnS nanorods studied by fluorescence correlation spectroscopy. J Am Chem Soc (2006) 128:1639–47. doi:10.1021/ja056162i
118. Widengren J, Mets Ü, Rigler R Photodynamic properties of green fluorescent proteins investigated by fluorescence correlation spectroscopy. Chem Phys (1999) 250:171–86. doi:10.1016/s0301-0104(99)00255-4
119. Pan X, Aw C, Du Y, Yu H, Wohland T Characterization of poly(acrylic acid) diffusion dynamics on the grafted surface of poly(ethylene terephthalate) films by fluorescence correlation spectroscopy. Biophys Rev Lett (2006) 01:433–41. doi:10.1142/S1793048006000264
120. Wenger J, Gérard D, Lenne PF, Rigneault H, Dintinger J, Ebbesen TW, et al. Dual-color fluorescence cross-correlation spectroscopy in a single nanoaperture : towards rapid multicomponent screening at high concentrations. Opt Express (2006) 14:12206–16. doi:10.1364/OE.14.012206
121. Paula V, Camila VE, Camila O, Stortz M, Alejandra G, Levi V Dynamical reorganization of the pluripotency transcription factors Oct4 and Sox2 during early differentiation of embryonic stem cells. Sci Rep (2020) 10:5195. doi:10.1038/s41598-020-62235-0
122. Chelladurai R, Debnath K, Jana NR, Basu JK Nanoscale heterogeneities drive enhanced binding and anomalous diffusion of nanoparticles in model biomembranes. Langmuir (2018) 34:1691–9. doi:10.1021/acs.langmuir.7b04003
123. Zhang H, De Smedt SC, Remaut K Fluorescence Correlation Spectroscopy to find the critical balance between extracellular association and intracellular dissociation of mRNA complexes. Acta Biomater (2018) 75:358–70. doi:10.1016/j.actbio.2018.05.016
124. Di Rienzo C, Cardarelli F, Di Luca M, Beltram F, Gratton E Diffusion tensor analysis by two-dimensional pair correlation of fluorescence fluctuations in cells. Biophys J (2016) 111:841–51. doi:10.1016/j.bpj.2016.07.005
125. Scipioni L, Lanzanó L, Diaspro A, Gratton E Comprehensive correlation analysis for super-resolution dynamic fingerprinting of cellular compartments using the Zeiss Airyscan detector. Nat Commun (2018) 9:5120. doi:10.1038/s41467-018-07513-2
126. Malengo G, Andolfo A, Sidenius N, Gratton E, Zamai M, Caiolfa VR Fluorescence correlation spectroscopy and photon counting histogram on membrane proteins: functional dynamics of the glycosylphosphatidylinositol-anchored urokinase plasminogen activator receptor. J Biomed Opt (2008) 13:031215. doi:10.1117/1.2940570
127. Brown JWP, Bauer A, Polinkovsky ME, Bhumkar A, Hunter DJB, Gaus K, et al. Single-molecule detection on a portable 3D-printed microscope. Nat Commun (2019) 10:5662. doi:10.1038/s41467-019-13617-0
128. Scales N, Swain PS Resolving fluorescent species by their brightness and diffusion using correlated photon-counting histograms. PLoS One (2020) 14:e0226063. doi:10.1371/journal.pone.0226063
129. Gupta A, Sankaran J, Wohland T Fluorescence correlation spectroscopy: the technique and its applications in soft matter. Phys Sci Rev, 4 (2019) 4. doi:10.1515/psr-2017-0104
130. Li H, Zheng K, Yang J, Zhao J Anomalous diffusion inside soft colloidal suspensions investigated by variable length scale fluorescence correlation spectroscopy. ACS Omega (2020) 5:11123–30. doi:10.1021/acsomega.0c01052
131. T¨auber D, Radscheit K, von Borczyskowski C, Schulz M Fluorescence correlation spectroscopy in thin films at reflecting substrates as a means to study nanoscale structure and dynamics at soft-matter interfaces. Phys Rev E (2016) 94:012804. doi:10.1103/PhysRevE.94.012804
132. Schwille P, Ries J Principles and applications of fluorescence correlation spectroscopy (FCS). In: B Bartolo, and J Collins, editors. Biophotonics: spectroscopy, imaging, sensing, and manipulation. Dordrecht: Springer (2011). p. 63–85.
133. Wang H, Lin Y, Nienhaus K, Nienhaus GU The protein corona on nanoparticles as viewed from a nanoparticle-sizing perspective. WIREs Nanomed Nanobiotechnol (2018) 10:e1500. doi:10.1002/wnan.1500
134. Becker W, Hickl H, Zander C, Drexhage KH, Sauer M, Siebert S, et al. Time-resolved detection and identification of single analyte molecules in microcapillaries by time-correlated single-photon counting (TCSPC). Rev Scientific Instr (1999) 70:1835–41. doi:10.1063/1.1149677
135. Hendrix J, Lamb DC Pulsed interleaved excitation: principles and applications. Meth Enzymol (2013) 518:205–43. doi:10.1016/b978-0-12-388422-0.00009-1
136. Christie S, Shi X, Smith AW Resolving membrane protein-protein interactions in live cells with pulsed interleaved excitation fluorescence cross-correlation spectroscopy. Acc Chem Res (2020) 53:792–9. doi:10.1021/acs.accounts.9b00625
137. Jastrzebska B, Comar WD, Kaliszewski MJ, Skinner KC, Torcasio MH, Esway AS, et al. A G protein-coupled receptor dimerization interface in human cone opsins. Biochemistry (2017) 56:61–72. doi:10.1021/acs.biochem.6b00877
138. Gao X, Gao P, Prunsche B, Nienhaus K, Nienhaus GU Pulsed interleaved excitation-based line-scanning spatial correlation spectroscopy (PIE-lsSCS). Sci Rep (2018) 8:16722. doi:10.1038/s41598-018-35146-4
139. Axelrod D, Koppel DE, Schlessinger J, Elson E, Webb WW Mobility measurement by analysis of fluorescence photobleaching recovery kinetics. Biophys J (1976) 16:1055–69. doi:10.1016/S0006-3495(76)85755-4
140. Selvin P Fluorescence resonance energy transfer. Meth Enzymol (1995) 246:300–34. doi:10.1016/0076-6879(95)46015-2
141. Qian H, Sheetz MP, Elson EL Single particle tracking. Analysis of diffusion and flow in two-dimensional systems. Biophys J (1991) 60:910–21. doi:10.1016/S0006-3495(91)82125-7
142. Lippincott-Schwartz J, Altan-Bonnet N, Patterson GH Photobleaching and photoactivation: following protein dynamics in living cells. Nat Cel Biol (2003) Suppl:S7–14. doi:10.1038/ncb1032
143. Jonkman J, Brown CM, Wright GD, Anderson KI, North AJ Tutorial: guidance for quantitative confocal microscopy. Nat Protoc (2020) 15:1585–611. doi:10.1038/s41596-020-0313-9
144. Ritchie K, Shan XY, Kondo J, Iwasawa K, Fujiwara T, Kusumi A Detection of non-Brownian diffusion in the cell membrane in single molecule tracking. Biophys J (2005) 88:2266–77. doi:10.1529/biophysj.104.054106
145. Müller CB, Loman A, Pacheco V, Koberling F, Willbold D, Richtering W, et al. Precise measurement of diffusion by multi-color dual-focus fluorescence correlation spectroscopy. Europhys Lett (2008) 83:46001. doi:10.1209/0295-5075/83/46001
146. Loman A, Müller CB, Koberling F, Richtering W, Enderlein J Absolute and percise measurements of the diffusion of small fluorescent dye molecules across the visible spectrum. 14th Int Workshop Single Molecule Spectrosc Ultrasensitive Anal Life Sci (2008) 83:1.
147. Peter K, GmbH P Absolute diffusion coefficients: compilation of reference data for FCS calibration (2010) Available from: https://www.picoquant.com/scientific/technical-and-application-notes/category/technical_notes_techniques_and_methods/details/absolute-diffusion-coefficients-compilation-reference-fcs-data.
148. Petrásek Z, Schwille P Precise measurement of diffusion coefficients using scanning fluorescence correlation spectroscopy. Biophys J (2008) 94:1437–48. doi:10.1529/biophysj.107.108811
149. Gendron PO, Avaltroni F, Wilkinson KJ Diffusion coefficients of several rhodamine derivatives as determined by pulsed field gradient-nuclear magnetic resonance and fluorescence correlation spectroscopy. J Fluoresc (2008) 18:1093–101. doi:10.1007/s10895-008-0357-7
150. Culbertson CT, Jacobson SC, Michael Ramsey J Diffusion coefficient measurements in microfluidic devices. Talanta (2002) 56:365–73. doi:10.1016/S0039-9140(01)00602-6
151. Müller CB, Weiß K, Richtering W, Loman A, Enderlein J Calibrating differential interference contrast microscopy with dual-focus fluorescence correlation spectroscopy. Opt Express (2008) 16:4322–9. doi:10.1364/OE.16.004322
152. Kahya N, Scherfeld D, Bacia K, Poolman B, Schwille P Probing lipid mobility of raft-exhibiting model membranes by fluorescence correlation spectroscopy. J Biol Chem (2003) 278:28109–15. doi:10.1074/jbc.M302969200
153. Meacci G, Ries J, Fischer-Friedrich E, Kahya N, Schwille P, Kruse K Mobility of Min-proteins in Escherichia coli measured by fluorescence correlation spectroscopy. Phys Biol (2010) 3:255–63. doi:10.1088/1478-3975/3/4/003
Keywords: fluorescence correlation spectroscopy, biomolecular dynamics, biomolecular interaction, correlation spectroscopy, FCS variants
Citation: Yu L, Lei Y, Ma Y, Liu M, Zheng J, Dan D and Gao P (2021) A Comprehensive Review of Fluorescence Correlation Spectroscopy. Front. Phys. 9:644450. doi: 10.3389/fphy.2021.644450
Received: 21 December 2020; Accepted: 12 February 2021;
Published: 12 April 2021.
Edited by:
Bodo Wilts, Université de Fribourg, SwitzerlandReviewed by:
Stefan Wennmalm, Royal Institute of Technology, SwedenNobuhiko Yokoshi, Osaka Prefecture University, Japan
Copyright © 2021 Yu, Lei, Ma, Liu, Zheng, Dan and Gao. This is an open-access article distributed under the terms of the Creative Commons Attribution License (CC BY). The use, distribution or reproduction in other forums is permitted, provided the original author(s) and the copyright owner(s) are credited and that the original publication in this journal is cited, in accordance with accepted academic practice. No use, distribution or reproduction is permitted which does not comply with these terms.
*Correspondence: Peng Gao, peng.gao@xidian.edu.cn
†These authors have contributed equally to this work