Abstract
We utilize a cost-effective frequency-domain fluorescence lifetime imaging microscope to measure the phase lifetime of mTFP1 in mTFP1-mVenus fluorescence resonance energy transfer (FRET) constructs relevant to the VinTS molecular tension probe. Our data were collected at 15 modulation frequencies ω/2π selected between 14 and 70 MHz. The lifetime of mTFP1 was τD = 3.11 ± 0.02 ns in the absence of acceptor. For modulation frequencies, ω, such that (ω · τD) < 1.1, the phase lifetime of mTFP1in the presence of acceptor (mVenus), , was directly related to the amplitude-weighted lifetime inferred from the known FRET efficiency () of the constructs. A linear fit to a plot of yielded a slope of 0.79 ± 0.05 and intercept of 0.095 ± 0.029 (R2 = 0.952). Thus, our results suggest that a linear relationship exists between the apparent based on the measured phase lifetime and for frequencies such that (ω · τD) < 1.1. We had previously reported a similar relationship between and at 42 MHz. Our current results provide additional evidence in support of this observation, but further investigation is still required to fully characterize these results. A direct relationship between and has the potential to simplify significantly data acquisition and interpretation in fluorescence lifetime measurements of FRET constructs.
Introduction
Förster (or fluorescence) resonance energy transfer (FRET) is the non-radiative transfer of excitation energy from a donor fluorophore to an acceptor chromophore [1]. FRET occurs when the donor and acceptor are within close proximity, typically on the order of 1–10 nm, and depends on the inverse of this distance raised to the sixth power. The efficiency of energy transfer also depends on the physical optical properties of the two fluorophores, the alignment of their dipole moments, and the extent of overlap between the donor's emission spectrum and the acceptor's absorption band. FRET has important applications for measurements made in the biological sciences where one seeks to detect and characterize protein interactions. In addition, a multitude of biological sensors based on FRET have been designed to track cellular function, including intracellular changes to calcium, enzyme activation, or molecular tension [2]. We are interested in mechanical forces, which play an important role in the structure and function of a cell. For this reason, it is important to investigate methods by which these forces can be measured. One method of measuring forces in cells is through the use of the vinculin tension sensor (VinTS), which consists of the tension module TSMod inserted between vinculin's head and tail [3]. TSMod itself consists of the fluorescent protein variants mTFP1 and mVenus acting as a donor-acceptor FRET pair connected by an elastic linker. The FRET efficiency between mTFP1 and mVenus can be related to the distance between the two fluorophores, and therefore, the tension force that the elastic linker is experiencing [3]. This measurement requires measuring absolute FRET efficiency as opposed to a relative FRET index.
Several techniques exist to measure FRET efficiency in living cells, including methods based on intensity measurements, such as the sensitized emission method [4], and fluorescence lifetime imaging microscopy (FLIM), including frequency-domain and time-domain techniques [5, 6]. The sensitized emission method, which can be achieved on a conventional epifluorescence microscope, utilizes intensity measurements in three channels, and requires calibration of the instrument to calculate FRET efficiency based on these measurements. In contrast, FLIM requires measuring the lifetime of the donor in a single imaging channel and does not rely on intensity calibration. FRET efficiency is obtained from the measured lifetimes of the donor in the presence and absence of the acceptor. Nonetheless, FLIM requires specialized instrumentation to resolve fluorescence lifetime. In addition, in the case of FRET sensors, data interpretation can be complex owing to the fact that FRET samples do not exhibit a single exponential decay. Thus, the FRET efficiency is given by the amplitude-weighted average lifetime of multi- or, more typically, bi-exponential decays. Fit-free techniques, which do not rely on fitting a multi-exponential decay model to the lifetime data, have been developed to interpret FLIM-FRET data. One example is the elegant phasor plot technique [7–12]. Methods incorporating deep learning and artificial intelligence to process lifetime data have also been demonstrated [13]. While powerful, the complexity of these methods and their reliance on costly instrumentation still present a barrier for the dissemination of FLIM-FRET measurements in biology.
In a recent study, we measured FRET efficiency by utilizing a cost-effective frequency-domain FLIM instrument operating at a single modulation frequency of 42 MHz [14]. We suggested that the apparent FRET efficiency obtained from phase lifetime measurements could be directly related to true FRET efficiency, which is given by the amplitude-weighted average lifetime, and that such a relationship could be used as a calibration curve to circumvent the need to fit a multi-exponential decay model to the data. In this study, we further, investigate the relationship between apparent FRET and true FRET for different choices of modulation frequencies. We measure the lifetime of the donor fluorophore mTFP1 at several modulation frequencies. We also measure the phase lifetime of mTFP1 in FRET constructs consisting of the mTFP1-mVenus FRET pair linked by peptides of various lengths relevant to the molecular tension probe, VinTS.
Methods
Sample Preparation
Immortalized baby mouse kidney (iBMK) cells [15, 16]were a gift from Dr. Eileen White at the Rutgers Cancer Institute of New Jersey and were cultured on glass coverslips and maintained in Dulbecco's Modified Eagle's Medium (DMEM; Invitrogen) supplemented with 10% fetal bovine serum (FBS; Gemini), 100 U/ml penicillin and 100 μg/ml streptomycin (Invitrogen). The cells were maintained at 38oC in 8.5% CO2. The cells were transfected as described previously [17]. For imaging, each coverslip with the attached cells was mounted on a homemade stainless-steel slide, and the growth medium was switched to Leibowitz L15 medium (Invitrogen) supplemented with FBS and penicillin/streptomycin as above. The imaging medium contained no phenol red. The cells were imaged between 24 and 48 h after transfection. Imaging was conducted at room temperature and room air.
The cells expressed either mTFP1 [18] or one of the following constructs consisting of mTFP1 and mVenus tethered by linkers of increasing lengths: mTFP1-(GGSGGS)1-mVenus (6 amino acids), mTFP1-(GGSGGS)2-mVenus (12 amino acids), mTFP1-(GPGGA)8-mVenus (TSMod, 40 amino acids), and mTFP1-TRAF-mVenus (229 amino acids [19]). The constructs will herein be referred to as GGS1, GGS2, TSMod, and TRAF, respectively. We also note that TRAF typically forms a trimer [19]. TSMod was obtained from Addgene (TS module Plasmid # 26021). All the other plasmids were generously provided by Dr. Brenton Hoffman's laboratory at Duke University [4, 20]. The plasmids were amplified in DH5α competent Escherichia coli. DNA purification was carried out using NucleoBond® Xtra Midi endotoxin-free (Takara Bio USA, Inc.) according to the manufacturer's instructions.
Image Acquisition and Analysis
Fluorescence intensity and lifetime were acquired on a custom-built point scanning frequency-domain FLIM instrument, which was previously described in detail and utilizes sinusoidally modulated laser excitation [14]. Here, fluorescence intensity and phase lifetime images of mTFP1 were acquired using a laser diode with 450 nm excitation sinusoidally modulated at manually selected frequencies ranging between 14 and 70 MHz (Supplementary Table 1). The fluorescence signal was filtered by a 40 nm emission bandpass centered at 479 nm and measured with a photomultiplier tube. We had previously established that the fluorescence emission of mVenus in this acquisition channel is negligible. The microscope was fitted with a Nikon 40X dry objective with NA = 0.75. The excitation power was 20–23 μW at the sample. The images consisted of 1,024 × 1,024 scanned points with a dwell time of 6.8 μs per point. The instrument's phase offset was subtracted using a calibration sample of known lifetime as previously explained [14]. For this, we used a sample of Coumarin 6 (Sigma-Aldrich # 546283, ~0.1 mM) dissolved in 100% ethanol (lifetime of 2.5 ns [21]) sandwiched between a glass slide and a coverslip using an adhesive well (Secure-Seal Spacers, Thermo-Fisher). The thickness of the sample was 0.12 mm. At the beginning of every experiment, the calibration was performed at each of the modulation frequencies used during data acquisition. Once calibration is completed, the instrument measures at each image pixel, the phase difference, ϕ, between the sinusoidally modulated excitation and emission signals and calculates the sample's phase lifetime (or apparent lifetime) from [5]:
ω is the laser modulation frequency in rad/s; f is the frequency in Hz. Before analysis, the images were preprocessed by removing pixels with intensity signal below 0.02 intensity counts and for which an accurate measurement of lifetime cannot be made reliably. We also removed pixels with lifetime above 5 ns from the analysis. Finally, the images were manually segmented to ensure that the analysis was limited to the regions containing cells.
The measured phase lifetime is equal to the true lifetime of the fluorophore when the fluorescence can be modeled as a single exponential decay. This is expected to be the case for mTFP1 [18]. In contrast, the lifetime of mTFP1 within a FRET construct in presence of the mVenus acceptor is expected to exhibit more than one exponential decay [5]. The amplitude-weighted lifetime denoted here as is given by Equation 4.30 in [5]. If the FRET efficiency is known, then the amplitude-weighted lifetime may be inferred from Equation 4.31–4.32 in [5]:
τD is the lifetime of the donor fluorophore in the absence of the acceptor fluorophore. Our donor is mTFP1, and our donor-acceptor FRET pairs are GGS1, GGS2, TSMod, and TRAF. In this paper, the FRET efficiency of all constructs was measured independently in our laboratory using the sensitized emission method with the calibration technique described previously in Menaesse et al. [17] These measurements gave (mean ± standard deviation of N = 3 experiments) = 0.567 ± 0.021 (n = 64 images) for GGS1, 0.524 ± 0.01 (n = 90 images) for GGS2, 0.285 ± 0.006 (n = 90 images) for TSMod, and 0.044 ± 0.01 (n = 90 images) for TRAF (Supplementary Note 2). Each value, together with the value of τD, may be used to obtain for each construct (Supplementary Table 3). We also define here the “apparent” FRET efficiency, , obtained from the measured phase lifetime of the construct, , using the following equation:
is the measured phase lifetime (apparent lifetime) of the donor fluorophore in the FRET construct while it is in the presence of the acceptor fluorophore. For a given modulation frequency ω, Equations 2, 3 may be re-written as:
and
Thus, we are able to compare directly the measurement of and made in our FLIM system to and measured by the intensity-based sensitized emission method. Unlike , which is expected to remain the same to the extent that the FRET efficiency of a given construct remains the same, and are expected to change as a function of modulation frequency [5]. We therefore expect a priori that .
Results
Representative images depicting the measured lifetime and intensity of each of the FRET constructs are shown in Figure 1. An estimate of fluorescence lifetime (τϕ), was obtained from the mode (most frequent value) of the fluorescence lifetime distribution for each imaged field of view. We report the mean and standard deviation of τϕ across N independent experimental repeats. Details of this analysis may be found in Supplementary Note 3. The measured fluorescence lifetime of mTFP1 expressed in the absence of mVenus, , was converted to measured phase using Equation 1 and plotted as a function of modulation frequency (Figure 2). A fit of (ω · τD) to the measured phase as a function of modulation frequency yielded τD= 3.11 ± 0.02ns (χ2 = 0.0699) for mTFP1. The phase lifetime measurements made for the four FRET constructs at the different modulation frequencies are listed in Supplementary Table 4. At f = 42.1875 MHz, we obtained (mean ± standard deviation of n images) 1.72 ± 0.12 (N = 5) for GGS2; 2.13 ± 0.13 ns (N = 4) for TSMod, and 2.59 ± 0.08 ns (N = 4) for TRAF. In addition, we measured here = 1.44 ± 0.07 ns (N = 3) for the GGS1 construct at 42.1875 MHz. Our results corroborate our previous values for TSMod and TRAF [14]. However, the mean GGS2 lifetime at 42.1875 MHz was 0.2 ns longer compared to our previous data.
Figure 1
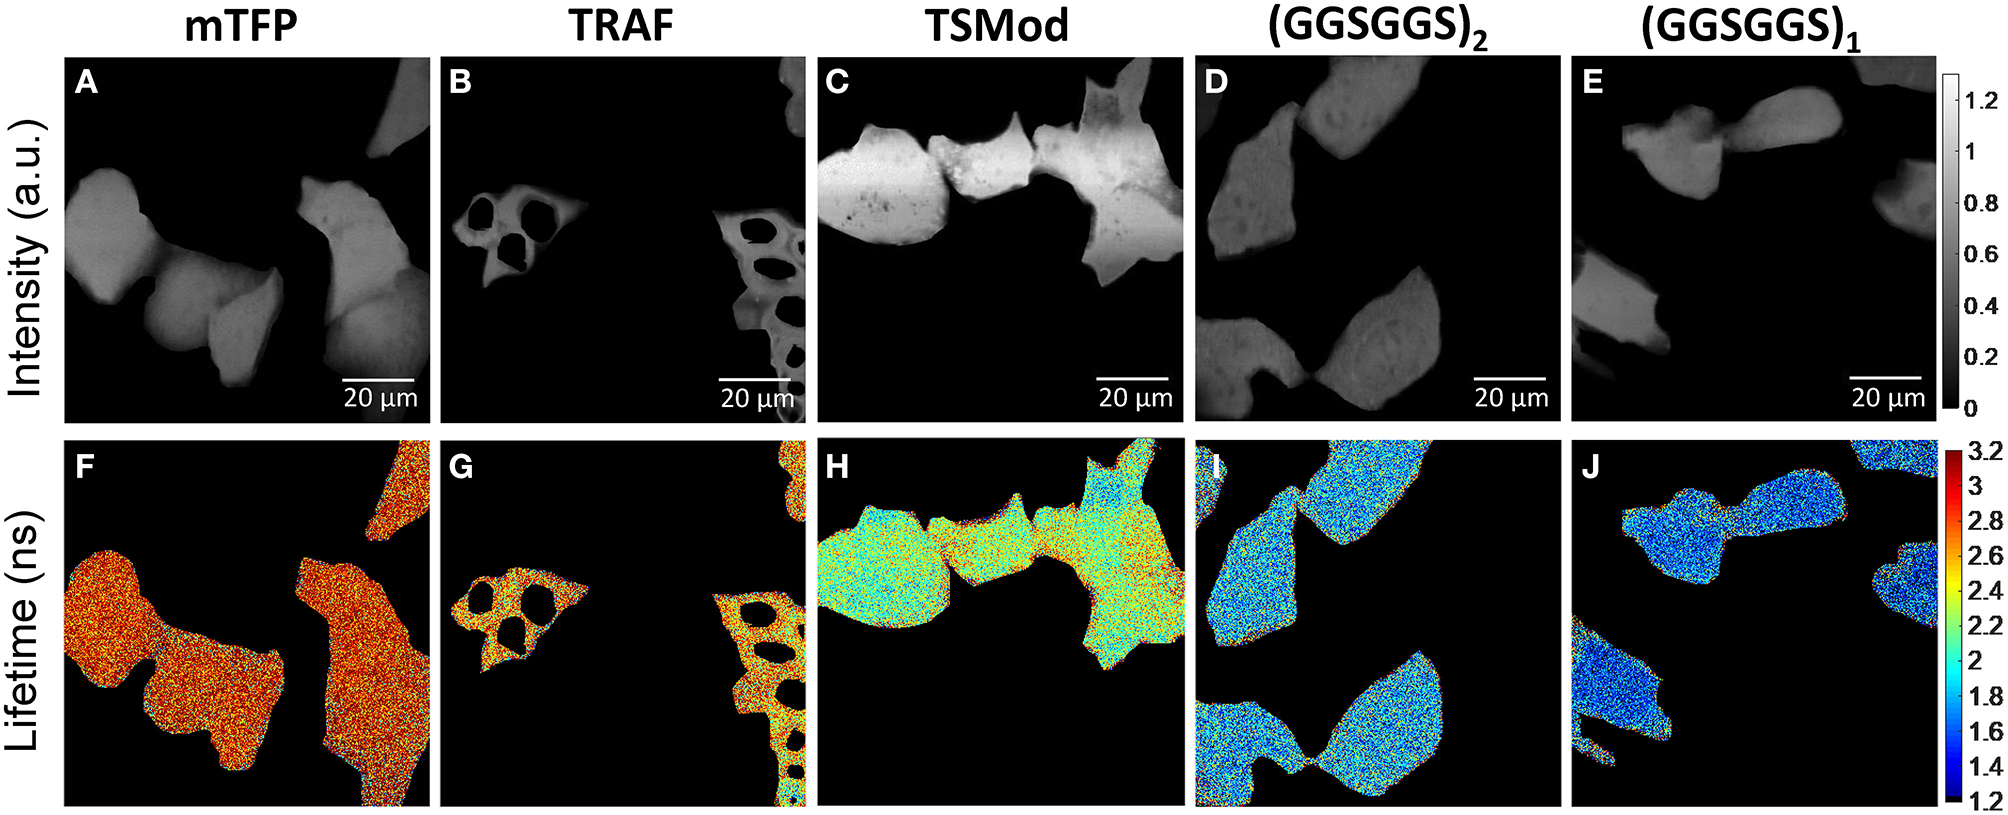
Representative images of iBMK cells expressing mTFP1 and the FRET constructs mTFP1-TRAF-mVenus, mTFP1-TSMod-mVenus, mTFP1-(GGSGGS)2-mVenus, and mTFP1-(GGSGGS)1-mVenus acquired at 450 nm excitation with emission centered at 479 nm. (A–E) Fluorescence intensity in arbitrary units (a.u.). (F–J) Corresponding fluorescence lifetime images (color scale in ns). All images are captured with 1,024 × 1,024 points and 6.8 μs dwell-time per point. The cells were manually segmented.
Figure 2
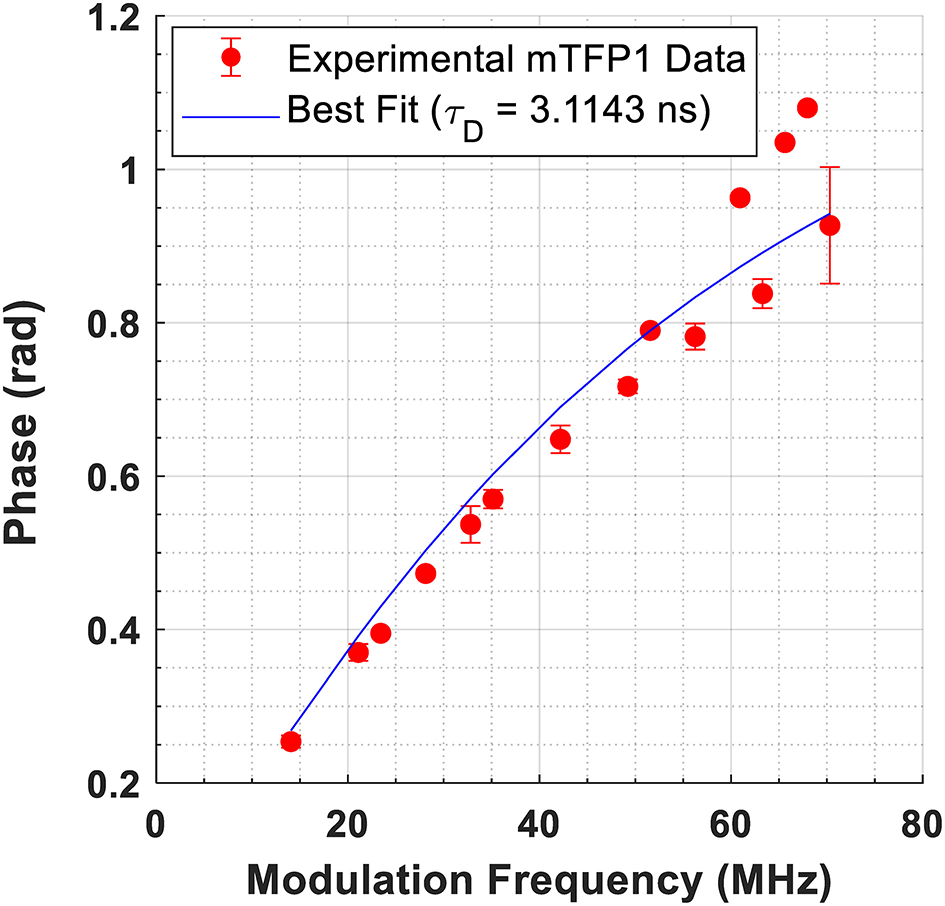
Fit of to data from cells expressing mTFP1 at 15 different modulation frequencies. The measured phase, ϕ, is obtained from Equation 1. The best fit yielded τD = 3.1143 ± 0.017 ns (χ2 = 0.0699).
To investigate the effect of modulation frequency on lifetime and FRET efficiency, we used τD = 3.11 ns and the known true FRET efficiencies to obtain the expected lifetime of the constructs using Equation 2 (Supplementary Table 3). As explained in the Methods section, the FRET efficiency of the constructs was obtained independently using the intensity-based sensitized emission method. A relationship between measured at each frequency and is obtained for all constructs by plotting in Figure 3A. Figure 3A also includes a plot of for mTFP1. The results in Figure 3A suggest that a linear relationship between and holds for all constructs up to for GGS1 or ω = 353.429 · 106rad/s (f = 56.25 MHz). Beyond this modulation frequency, begins to deviate significantly from this linear relationship, especially for the GGS1 and GGS2 constructs, which have short linkers and high FRET efficiency. Referring this value back to the constant lifetime of mTFP1, this frequency limit may be re-defined as A linear fit to the datapoints collected at frequencies up to and including 56.25 MHz is shown in Figure 3B. The slope and intercept of the fit are 0.79 (95% confidence interval ± 0.05) and 0.029 (95% confidence interval ± 0.031), respectively (R2 = 0.952).
Figure 3
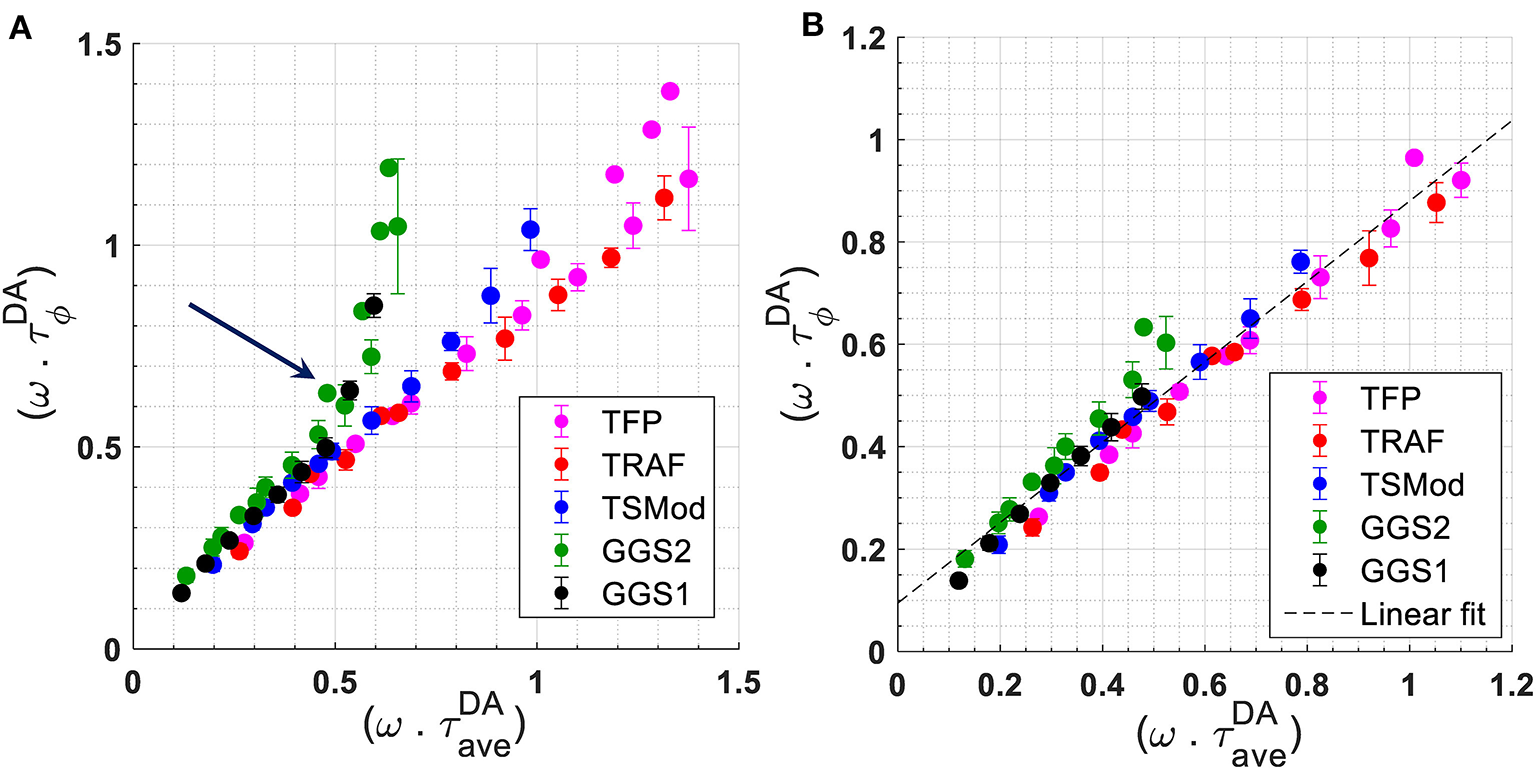
(A): Relationship between for all FRET constructs. For mTFP1, we plotted . For each frequency ω, (or ) is the measured phase lifetime at that frequency. The average lifetime was calculated using the known FRET efficiency of the constructs measured independently with the sensitized emission method, τD = 3.11 ns, and Equation 2. The arrow denotes the point at which the data for GGS1 and GGS2 begin to deviate from a linear relationship. (B) Relationship between for all constructs, and between for mTFP1, up to and including a modulation frequency of 56.25 MHz. The slope of best linear fit to these data is 0.79 (95% confidence interval of ±0.05). The intercept is 0.095 (95% confidence interval of ± 0.029). R2 = 0.952.
As expected from Equations 4, 5, a similar relationship should be obtained if we plot vs. where is calculated using Equation 3 with τD=3.11 ns and the measured phase lifetimes (Supplementary Table 4), while is based on the intensity-based FRET efficiency measurements of the constructs made independently (see Methods). In Figure 4 we plot vs. for modulation frequencies up to and including 56.25 MHz. We note that for mTFP1, a non-zero intercept was taken as , and results from the fluctuations in mTFP1 lifetime measured at each frequency. A linear fit is obtained at each modulation frequency (Figure 4 top inset). As the modulation frequency increased, so did the y-intercept of the line of fit. However, the slope of the line of fit was consistently around 0.65, no matter the modulation frequency. The best fits occurred for modulation frequencies between 35 and 49 MHz with an R2 > 0.97. In comparison, the slope of the linear fit in Figure 3B was 0.79. However, the difference between the slopes of Figures 3B, 4 is within experimental error.
Figure 4
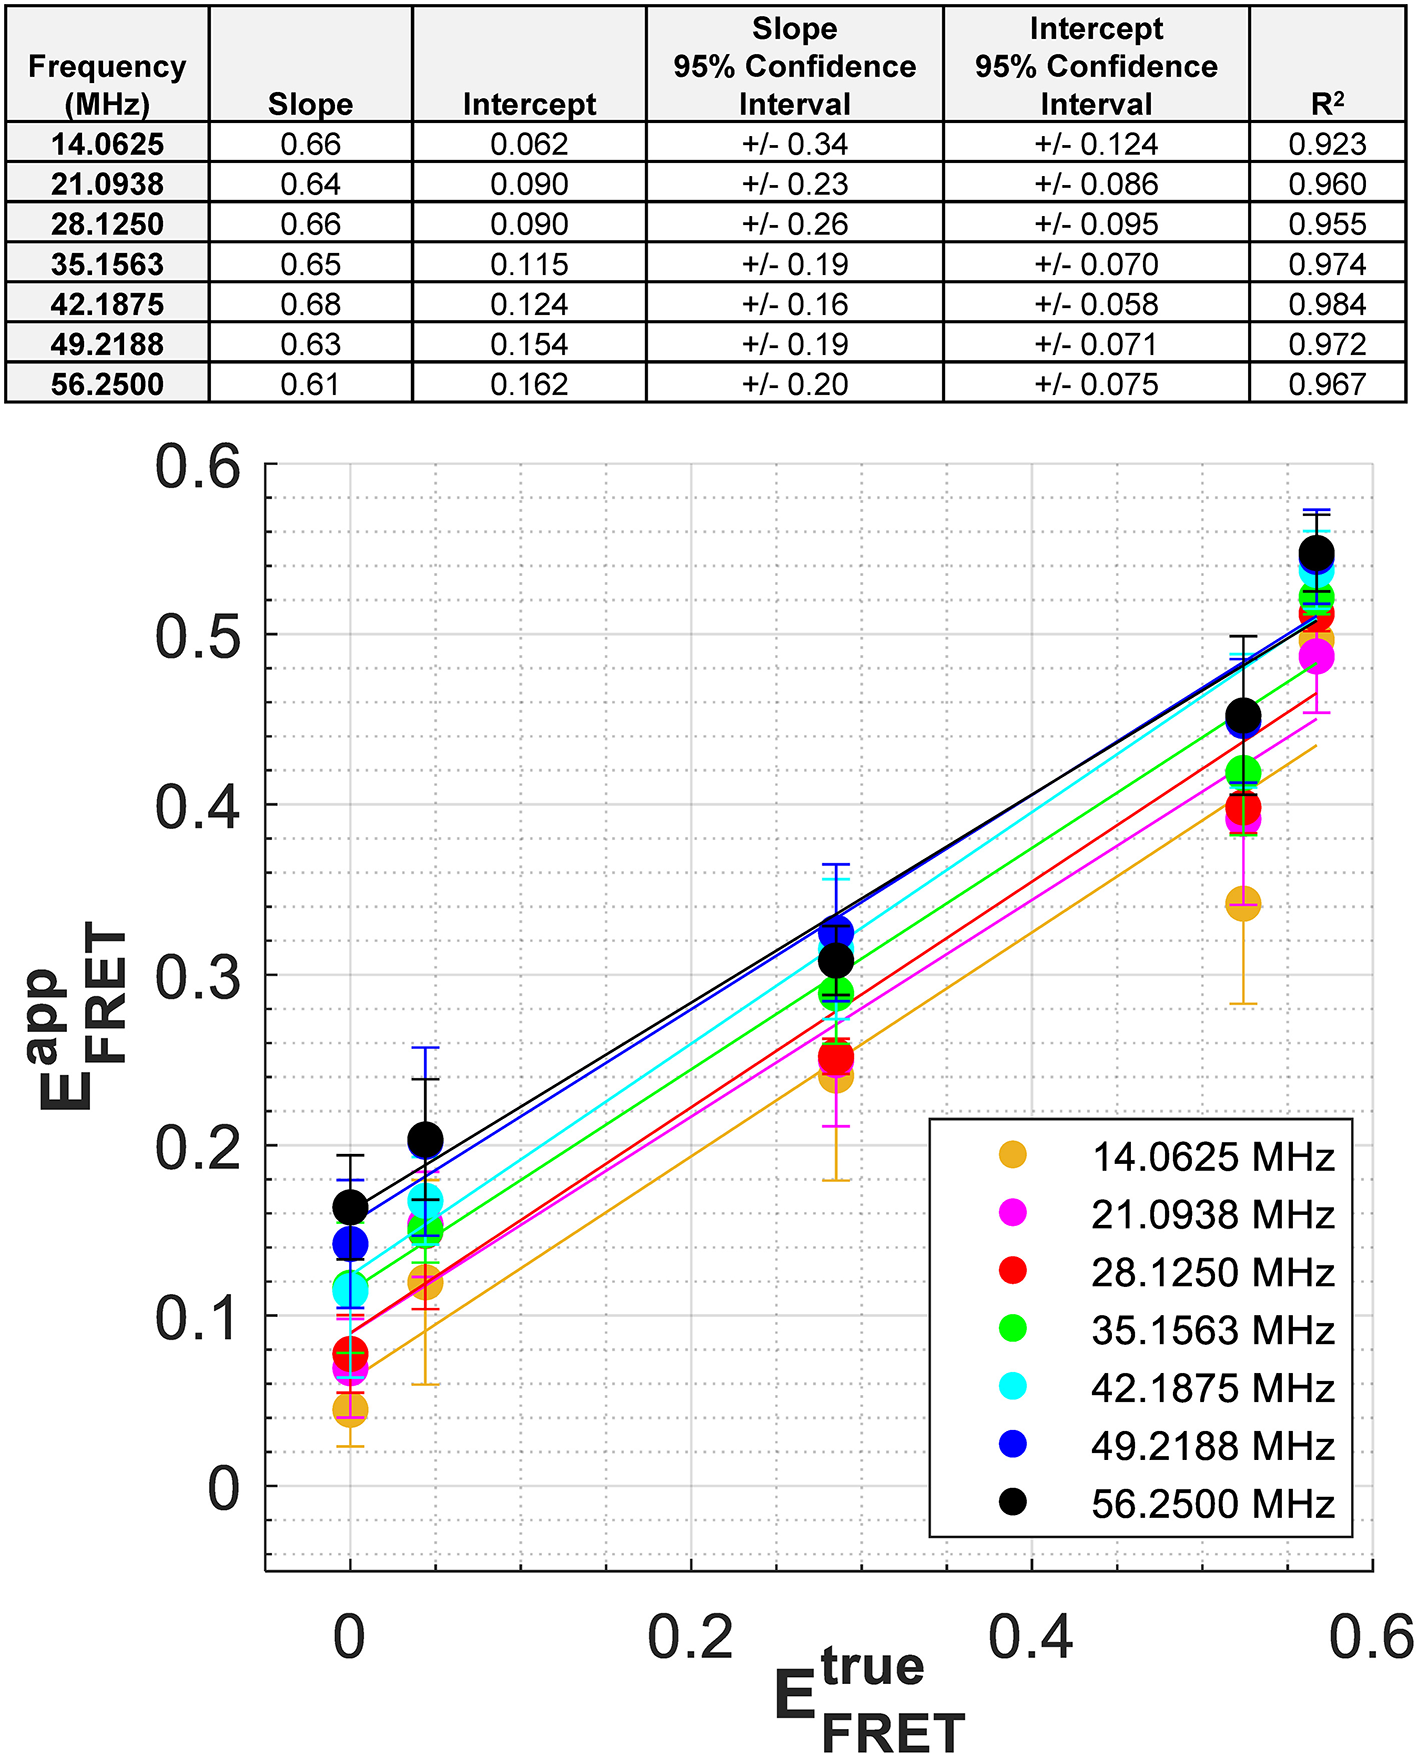
Relationship between and for the protein constructs at each modulation frequency. was calculated at each modulation frequency using the measured , τD = 3.11 ns, and Equation 3. For mTFP1, a non-zero intercept was taken as , and results from the slightly different mTFP1 lifetime measurements, , that were made at each frequency While the slopes related to each modulation frequency are similar, the intercepts generally increase with increasing modulation frequency. Exact parameters of these linear fits are found in the top inset.
Discussion
In this report, we use frequency-domain FLIM to measure the phase lifetime of mTFP1 expressed alone or within mTFP1-mVenus FRET fusion constructs at different modulation frequencies. To calibrate our set up we used the 2.5 ns lifetime of Coumarin 6 in ethanol previously reported by Sun et al. [21] using frequency-domain FLIM. With this calibration value, the lifetime of Coumarin 6 in methanol (2.29 ns) was in close agreement with reported values [22] (Supplementary Figure 3). Still, variations in the measured lifetime of Coumarin 6 exist. For example, a lifetime of 2.4 ns was reported for Coumarin 6 in ethanol using time-domain FLIM [22]. Thus, a systematic error on the order of 0.1 ns may be attributed to the reference lifetime of the calibration sample. Such an error, however, would not affect the nature of the relationships in Figures 3,4.
A fit to the phase modulation data for mTFP1 between 14 and 70 MHz yielded a lifetime of τD = 3.11 ± 0.02 ns (Figure 2), which is slightly lower than the previously reported lifetime of 3.2 ns for mTFP1 in buffer [18]. In living cells, published measurements of mTFP1 yielded a lifetime of 2.98 ns based on a single exponential decay [3], phase and modulation lifetimes of 2.7 and 2.8 ns, respectively [23], or 2.65 ± 0.12 ns in the cytosol and 2.61 ± 0.11 ns in the nucleus based on a single exponential decay [24]. In that study, a bi-exponential model yielded a better fit to the data. However, the difference between the values of τ1 and τ2 obtained from the bi-exponential fits was <0.1 ns (τ1 = 2.60 ns, τ2 = 2.67 ns in the cytosol, and τ1 = 2.61 and τ2 = 2.64 ns in the nucleus) [24]. Taken together, published reports point to the fact that mTFP1 lifetime is monoexponential. A double exponential fit to our data in Figure 2 results in two indistinguishable lifetimes (τ1D = τ2D = 3.088e−9 ns, α1: 0.5, χ2: 0.0683) (Supplementary Figure 4) and corroborates those previous results.
Our results for the FRET constructs suggest that for modulation frequencies such that (ω · τD) ≲ 1, the behavior of the measured phase lifetime of mTFP1 as a function of average lifetime was close to linear (Figure 3B). As explained in Methods, the average lifetime was determined using Equation 2 and the FRET efficiency measured separately with the intensity-based sensitized emission method. Based on the relationship in Figure 3B, we hypothesize that the apparent FRET efficiency, , may be linearly related to for frequencies, ω, such that (ω · τD) ≲ 1.1 or f ≲ 56.25 MHz for our mTFP1-mVenus FRET constructs. These relationships are empirical and require further theoretical characterization. We had previously observed this linear behavior at f = 42 MHz [14]. Here, we show that such a relationship may hold at additional frequencies chosen such that (ω · τD) ≲ 1.1. Within this range, a linear fit to the experimental relationship between and at each modulation frequency resulted in slight differences in slope that are within the measurements' experimental error, while the intercept varied with fluctuations in mTFP1 lifetime measurements. These differences in slope and fluctuations in the measured lifetime of mTFP1 may explain the difference between the slope of the linear fits in Figures 3B, 4. We also note here that the choice of frequency in frequency-domain FLIM can be based on a “best” frequency determined to optimize lifetime resolution and given by [7]. Thus, (ωbest · τD) = 1.17 and slightly exceeds the value of ~1.1 under which the linear relationships shown in this study would hold. This, however, suggests choosing the higher frequencies within our range of (ω · τD) ≲ 1.1 is expected to lead to a more precise characterization of the relationship between and .
For (ω · τD) ≲ 1.1, the relation between and may be used as a calibration curve to convert the measured phase lifetime at a single modulation frequency to a measurement of FRET efficiency and therefore, circumvent the need for fitting lifetime data to bi- or multi-exponential decay models or the need for more complex interpretation of the phase and demodulation data. Applications of frequency-domain FLIM in FRET experiments have extensively relied on the relationship between the phase and demodulation of the emission signal. Data fitting techniques applied to the phase and demodulation measurements have been used to infer the fractional contributions of bi-exponential decays using single [25–27] or multiple [28] modulation frequencies. Phase and demodulation measurements have also been used to follow “FRET trajectories” by locating individual image pixels on the phasor plot to infer a FRET index [7–12]. By comparison, a direct relationship between and has the potential to simplify significantly acquisition and interpretation of FLIM-FRET data. Our studies are specifically relevant to the vinculin tension sensor, VinTS, which consists of TSMod inserted between the head and tail of vinculin [3]. We expect TSMod to stretch in the range of FRET efficiencies tested here. Therefore, we expect to be able to determine VinTS' FRET efficiency in an unknown sample using the measured phase lifetime at a single modulation frequency and the vs. relationship as we had previously suggested [14]. However, FRET sensors that operate outside this range or that have a different donor-acceptor pair would need to be recalibrated.
Deviations in the relationship between based on the sensitized emission method and based on FLIM could be due to the presence of unpaired donors or errors in the calibration of . We had previously estimated the fraction of paired donors to be 1–1.03 or close to 1 in our constructs (Supplementary Note 2 in [17]). This is achieved by choosing an acceptor (mVenus) with short maturation time [29, 30] and observing cells at least 24 h post-transfection. Furthermore, the value of ETSMod = 0.286 that we used to find the calibration factor G to infer (See Supplementary Note 2) is based on the value reported by Gates et al. obtained with an error of 0.015 after pixel-based measurements from several hundred cells [4]. Such an error would result in <0.13 uncertainty in the G factor. We believe that a more significant source of variation in EFRET values is the variation in the local cellular environment and biological variations across different cells. A limitation of our studies was, therefore, the use of a single global value of measured in a separate set of cells and taken as representative of all the pixel data for a given construct. As such, we did not compare the relationship between and on a same-cell or even on a same-pixel basis. Still, our current results provide additional evidence to further investigate the validity of the linear relationships suggested by our data and the frequency regime in which they apply.
Statements
Data availability statement
The raw data supporting the conclusions of this article will be made available by the authors, without undue reservation.
Author contributions
DS collected and analyzed data, produced all the figures in this article, and wrote and reviewed the manuscript. JJ designed, built and adapted the FLIM instrument for this study, collected and analyzed data, and reviewed and edited the manuscript. AM and MA collected data. TM analyzed FRET intensity-based data and provided cell samples. MP, MC-L, and BF provided purified plasmids and critical resources. AM, MA, TM, MP, MC-L, and BF reviewed and edited the manuscript. NB conceived the study, consulted on instrument design, provided cell samples and purified plasmids, collected and analyzed data, wrote and reviewed the manuscript, and managed the project. All authors contributed to the article and approved the submitted version.
Funding
This study was partially supported by a NSF GOALI grant under award CMMI-1825433 to NB and BF. Any opinions, findings, and conclusions or recommendations expressed in this material are those of the author(s) and do not necessarily reflect the views of the National Science Foundation. MC-L was supported by a Pre-doctoral Fellowship from the Coordination for the Improvement of Higher Education Personnel (CAPES), and MP was supported by NJCBIR Predoctoral Fellowship #CBIR15FEL009.
Acknowledgments
We wish to thank Dr. Brenton Hoffman at Duke University for the plasmids used in this study, Dr. Eileen White at the Rutgers Cancer Institute of New Jersey for the iBMK cells, and the Université Paris-Saclay for internship support for AM.
Conflict of interest
JJ was employed by Thorlabs Inc. The remaining authors declare that the research was conducted in the absence of any commercial or financial relationships that could be construed as a potential conflict of interest.
Supplementary material
The Supplementary Material for this article can be found online at: https://www.frontiersin.org/articles/10.3389/fphy.2021.648016/full#supplementary-material
References
1.
CleggR. Fluorescence resonance energy transfer. Curr Opin Biotechnol. (1995) 6:103–10. 10.1016/0958-1669(95)80016-6
2.
GreenwaldECMehtaSZhangJ. Genetically encoded fluorescent biosensors illuminate the spatiotemporal regulation of signaling networks. Chem Rev. (2018) 118:11707–94. 10.1021/acs.chemrev.8b00333
3.
GrashoffCHoffmanBDBrennerMDZhouRBParsonsMYangMTet al. Measuring mechanical tension across vinculin reveals regulation of focal adhesion dynamics. Nature. (2010) 466:263–6. 10.1038/nature09198
4.
GatesEMLaCroixASRothenbergKEHoffmanBD. Improving quality, reproducibility, and usability of FRET-based tension sensors. Cytometry A. (2019) 95A:201–13. 10.1002/cyto.a.23688
5.
LakowiczJR. Principles of Fluorescence Spectroscopy. 3rd ed. New York, NY: Springer (2006). 10.1007/978-0-387-46312-4
6.
PeriasamyACleggRM. FLIM Microscopy in Biology and Medicine. Boca Raon, FL: CRC Press (2009). 10.1201/9781420078916
7.
RedfordGICleggRM. Polar plot representation for frequency-domain analysis of fluorescence lifetimes. J Fluoresc. (2005) 15:805–15. 10.1007/s10895-005-2990-8
8.
DigmanMACaiolfaVRZamaiMGrattonE. The phasor approach to fluorescence lifetime imaging analysis. Biophys J. (2008) 94:L14–6. 10.1529/biophysj.107.120154
9.
ChenSJSinsuebphonNRudkouskayaABarrosoMIntesXMichaletX. In vitro and in vivo phasor analysis of stoichiometry and pharmacokinetics using short-lifetime near-infrared dyes and time-gated imaging. J Biophotonics. (2019) 12:e201800185. 10.1002/jbio.201800185
10.
HindeEDigmanMAWelchCHahnKMGrattonE. Biosensor Forster resonance energy transfer detection by the phasor approach to fluorescence lifetime imaging microscopy. Microsc Res Tech. (2012) 75:271–81. 10.1002/jemt.21054
11.
StringariCCinquinACinquinODigmanMADonovanPJGrattonE. Phasor approach to fluorescence lifetime microscopy distinguishes different metabolic states of germ cells in a live tissue. Proc Natl Acad Sci U S A. (2011) 108:13582–7. 10.1073/pnas.1108161108
12.
RanjitSMalacridaLJamesonDMGraftonE. Fit-free analysis of fluorescence lifetime imaging data using the phasor approach. Nat Protoc. (2018) 13:1979–2004. 10.1038/s41596-018-0026-5
13.
SmithJTYaoRYSinsuebphonNRudkouskayaAUnNMazurkiewiczJet al. Fast fit-free analysis of fluorescence lifetime imaging via deep learning. Proc Natl Acad Sci U S A. (2019) 116:24019–30. 10.1073/pnas.1912707116
14.
DumasJPJiangJYGatesEMHoffmanBDPierceMCBoustanyNN. FRET efficiency measurement in a molecular tension probe with a low-cost frequency-domain fluorescence lifetime imaging microscope. J Biomed Opt. (2019). 24:1–24. 10.1117/1.JBO.24.12.126501
15.
MathewRDegenhardtKHaramatyLKarpCMWhiteE. Immortalized mouse epithelial cell models to study the role of apoptosis in cancer. In: KhosraviFarRet al. editors. Programmed Cell Death, the Biology Therapeutic Implications of Cell Death, Part B. London: Methods in Enzymology, Elsevier Inc., (2008). p. 77–106. 10.1016/S0076-6879(08)01605-4
16.
MathewRKarpCMBeaudoinBVuongNChenGHChenHYet al. Autophagy suppresses tumorigenesis through elimination of p62. Cell. (2009) 137:1062–75. 10.1016/j.cell.2009.03.048
17.
MenaesseASumetskyDEmanuelyNSteinJLGatesEMHoffmanBDet al. Simplified instrument calibration for Wide-Field Fluorescence Resonance Energy Transfer (FRET) measured by the sensitized emission method. Cytometry A. (2021) 99:407–16. 10.1002/cyto.a.24194
18.
AiHWHendersonJNRemingtonSJCampbellRE. Directed evolution of a monomeric, bright and photostable version of Clavularia cyan fluorescent protein: structural characterization and applications in fluorescence imaging. Biochem J. (2006) 400:531–40. 10.1042/BJ20060874
19.
ThalerCKoushikSVBlankPSVogelSS. Quantitative multiphoton spectral imaging and its use for measuring resonance energy transfer. Biophys J. (2005) 89:2736–49. 10.1529/biophysj.105.061853
20.
LaCroixASLynchADBerginskiMEHoffmanBD. Tunable molecular tension sensors reveal extension-based control of vinculin loading. Elife. (2018) 7:e33927. 10.7554/eLife.33927
21.
SunYSHaysNMPeriasamyADavidsonMWDayRN. Monitoring protein interactions in living cells with fluorescence lifetime imaging microscopy. In: ConnPM, editor. Methods in Enzymology. Vol. 204. London: Methods in Enzymology, Elsevier Inc. (2012). p. 371–91. 10.1016/B978-0-12-391857-4.00019-7
22.
KristoffersenASErgaSRHamreBFretteØ. Testing fluorescence lifetime standards using two-photon excitation and time-domain instrumentation: rhodamine B, coumarin 6 and lucifer yellow. J Fluoresc. (2014) 24:1015–24. 10.1007/s10895-014-1368-1
23.
GoedhartJVan WeerenLHinkMAVischerNOEJalinkKGadellaTWJ. Bright cyan fluorescent protein variants identified by fluorescence lifetime screening. Nat Meth. (2010) 7:137–9. 10.1038/nmeth.1415
24.
DayRNBookerCFPeriasamyA. Characterization of an improved donor fluorescent protein for Forster resonance energy transfer microscopy. J Biomed Opt. (2008) 13:031203. 10.1117/1.2939094
25.
VerveerPJSquireABastiaensPIH. Global analysis of fluorescence lifetime imaging microscopy data. Biophys J. (2000) 78:2127–37. 10.1016/S0006-3495(00)76759-2
26.
ClaytonAHAHanleyQSVerveerPJ. Graphical representation and multicomponent analysis of single-frequency fluorescence lifetime imaging microscopy data. J Microsc. (2004) 213:1–5. 10.1111/j.1365-2818.2004.01265.x
27.
EspositoAGerritsenHCWoutersFS. Fluorescence lifetime heterogeneity resolution in the frequency domain by lifetime moments analysis. Biophys J. (2005) 89:4286–99. 10.1529/biophysj.104.053397
28.
SchlachterSElderADEspositoAKaminskiGSFrankJHVan GeestLKet al. mhFLIM: resolution of heterogeneous fluorescence decays in widefield lifetime microscopy. Opt Express. (2009) 17:1557. 10.1364/OE.17.001557
29.
NagaiTIbataKParkESKubotaMMikoshibaKMiyawakiA. A variant of yellow fluorescent protein with fast and efficient maturation for cell-biological applications. Nat Biotechnol. (2002) 20:87–90. 10.1038/nbt0102-87
30.
KremersGJGoedhartJvan MunsterEBGadellaTWJ. Cyan and yellow super fluorescent proteins with improved brightness, protein folding, and FRET Forster radius. Biochemistry. (2006) 45:6570–80. 10.1021/bi0516273
Summary
Keywords
fluorescence lifetime, imaging microscopy, live cell assays, fluorescence resonance energy transfer, frequency domain, mTFP1
Citation
Sumetsky D, Jiang JY, Ayad MA, Mahon T, Menaesse A, Cararo-Lopes MM, Patel MV, Firestein BL and Boustany NN (2021) Linear Behavior of the Phase Lifetime in Frequency-Domain Fluorescence Lifetime Imaging of FRET Constructs. Front. Phys. 9:648016. doi: 10.3389/fphy.2021.648016
Received
31 December 2020
Accepted
16 April 2021
Published
28 May 2021
Volume
9 - 2021
Edited by
Klaus Suhling, King's College London, United Kingdom
Reviewed by
Theodorus Gadella, University of Amsterdam, Netherlands; Alessandro Esposito, University of Cambridge, United Kingdom
Updates
Copyright
© 2021 Sumetsky, Jiang, Ayad, Mahon, Menaesse, Cararo-Lopes, Patel, Firestein and Boustany.
This is an open-access article distributed under the terms of the Creative Commons Attribution License (CC BY). The use, distribution or reproduction in other forums is permitted, provided the original author(s) and the copyright owner(s) are credited and that the original publication in this journal is cited, in accordance with accepted academic practice. No use, distribution or reproduction is permitted which does not comply with these terms.
*Correspondence: Nada N. Boustany nboustan@rutgers.edu
This article was submitted to Optics and Photonics, a section of the journal Frontiers in Physics
Disclaimer
All claims expressed in this article are solely those of the authors and do not necessarily represent those of their affiliated organizations, or those of the publisher, the editors and the reviewers. Any product that may be evaluated in this article or claim that may be made by its manufacturer is not guaranteed or endorsed by the publisher.