 Liwen Chen
 Longfang Yao
 Li Zhang3
 Jiong Ma
- 1Institute of Biomedical Engineering and Technology, Academy for Engineer and Technology, Fudan University, Shanghai, China
- 2Key Laboratory of Micro and Nano Photonic Structures (Ministry of Education), Department of Optical Science and Engineering, Shanghai Engineering Research Center of Ultra-Precision Optical Manufacturing, Green Photoelectron Platform, Fudan University, Shanghai, China
- 3Shanghai Engineering Research Center of Industrial Microorganisms, School of Life Sciences, Multiscale Research Institute of Complex Systems, Fudan University, Shanghai, China
Super-resolution microscopy includes multiple techniques in optical microscopy that enable sub-diffraction resolution fluorescence imaging of cellular structures. Expansion microscopy (EXM) is a method of physical expansion to obtain super-resolution images of a biological sample on conventional microscopy. We present images of yeast organelles, applying the combination of super-resolution and ExM techniques. When preparing pre-expanded samples, conventional methods lead to breakage of dividing yeast cells and difficulties in studying division-related proteins. Here, we describe an improved sample preparation technique that avoids such damage. ExM in combination with Airyscan and structured illumination microscopy (SIM) collected sub-cellular structural images of nuclear pore complex, septin, and a-tubulin in yeast. Our method of expansion in yeast is well-suited for super-resolution imaging study of yeast.
Introduction
Optical microscopy is one of the most important tools in the fields of biology and medicine. However, owing to diffraction limits, the resolution of conventional optical systems is limited to roughly 250 nm. In recent years, different methods have emerged to achieve optical super-resolution imaging, breaking the limits of diffraction. These super-resolution microscopy techniques can be divided into two categories—light source modulation and single-molecule modulation.
A classic example of the former is stimulated emission depletion (STED) [1], in which a physical process is used to reduce the spot size of the excitation light, thereby directly reducing the half-height width of the spot diffusion function to improve resolution. However, compared to general optical microscopes, STED causes more damage to the sample owing to the higher excitation light power used [2]. Super-resolution microscopes belonging to this type of technology also include structured illumination microscopy (SIM) [3–5] and Airyscan microscopy [6]. SIM applies a modulated illumination light to the sample to obtain images with different phases and orientations, which are then reconstructed to a super-resolution image. An obvious advantage of SIM is the improved imaging speed, and the technique has been applied for measuring gene sizes with high precision [7]. Airyscan microscopy is a new detector design that optimizes classic components, consisting of 32 elements acting as its own small pinhole in an Airyscan with positional information. This design increases the contrast of the high spatial frequency information but extends the imaging time [8]. Single-molecular-based techniques such as STORM [9], can achieve multicolor super-resolution images. But STORM method requires random activation of single fluorophores, making experiments difficult to perform. Each of the aforementioned super-resolution techniques have its own advantages and disadvantages, which are applicable to different types of samples for increased resolution.
In addition to microscopy, resolution can be improved from the perspective of the sample. For example, the sample can be magnified by expansion microscopy (ExM) to visualize the finer cellular sub-organ structures [10]. By immobilizing the fluorescent molecules of a labeled protein in a polyacrylamide hydrogel, the molecular structure of the sample is also spatially amplified as the hydrogel physically expands isotopically, thus indirectly improving resolution. In just a few years, many studies have optimized the ExM from the Edward S. Boyden's group to obtain a series of new expansion technologies based on different experimental needs. For example, combined with existing super-resolution microscopy systems, protein-retention expansion microscopy (proExM) [11] has been validated in different cells and tissues to achieve imaging at the nanoscale by retaining the target molecule (e.g., antibody tags, fluorescent proteins) [12]. The magnified analysis of the proteome (MAP), partially optimizes the experimental procedure to control the distance between proteins in the gel for expansion of tissue [13]. Additional methods include ExFISH, with in situ hybridization labeled probes for fluorescent RNA imaging [14], iExM, which further expands the resolution through iterative sample swelling [15], and ExPath, for the medical study of human specimen expansion [16]. The combination of ExM and different super-resolution techniques such as SIM and Airyscan has made an outstanding contribution to the study of biological structures and provides good examples of the compatibility of ExM [17–19].
There are many techniques available to apply ExM to different types of cells and tissues, even to bacterial and fungal spores [18, 20]. However, it has not been described in yeast. Yeast has many similarities with some of the functional structures of mammalian cells, and it is convenient to cultivate as a model microorganism, although the smaller size of its functional structures hinders imaging at the nanoscale. Fortunately, ExM is suited for super-resolution imaging of yeast. As a classical model microorganism, many studies have reported on the various functional structures of yeast. The integrated structure of the yeast nuclear pore complex (NPC) was determined by electron microscopy (EM) [21], with the diameter of rings and the distance between the bilayer being observed. However, few articles ever collected the dimensional data directly on single nuclear pores via light microscopy. In addition, septins are essential GTP-binding proteins that are found in almost all eukaryotes and are involved in the process of cytokinesis. From polarization data, it is inferred that septins polymerize into filaments and form an ordered array that can polymerize into long filaments and bundle laterally [22, 23]. Previous studies indirectly speculated that septin is linearly aligned [24]. Finally, α-tubulin plays a crucial role in a variety of cellular processes including cell division, motility, and vesicle transport [25].
In conventional yeast immunofluorescence methods [26], the fixed yeast walls are usually processed into individual protoplasts by special digestion and then collected by centrifugation. Next, the protoplasts are adhered to slides coating with poly-L-lysine, followed by the conventional immunofluorescence steps. The protoplasts obtained by this method may break up the dividing cell, thereby destroying the division-related structures. Therefore, although this approach enables fluorescent labeling of proteins in yeast, it is not suitable for studying the relevant proteins located at the division site. For this reason, we improved the immunofluorescence procedure by immobilizing cells on concanavalin A (ConA) coated slides prior to digestion [27]. Combined with ExM and super-resolution microscopy, our methods allow for the study of a wider range of protein structures.
In this study, we applied our improved ExM method to the structural components of NPCs, septin and α-tubulin, of yeast using an expansion Airyscan imaging database of Nup84, an essential scaffolding component of the NPC containing 16 copies and two rings [21], a GFP fusion protein of CDC12, an indispensable part of septin filament formation [24, 28], and z-stack images of antibody-labeled α-tubulin with 3D-SIM. Our results indicate that ExM technology can be applied for imaging of different structures in yeast.
Materials and Methods
Materials
The Saccharomyces cerevisiae strains of Nup84-GFP used were generated by Huh et al. [29]. The septin CDC12-GFP yeast strain was a gift from the Juntao Gao group. The GFP-tag was added at the C-terminus of the target protein [30].
Cultivation of Yeast Cells
In the first pre-culture, cells were incubated in a fresh YPD Agar media (YPD Agar, A507023, Sangon Biotech, Shanghai, China) for 16 h at 30°C. Cells were then inoculated in a second pre-culture in 6 mL YPD-media (YPD broth, A507022, Sangon Biotech, Shanghai, China) and cultured to the logarithmic phase of growth at 30°C and 220 rpm of agitation. Yeast cell culture was centrifuged at 3,000 × g for 5 min, followed by washing three times with sorbitol buffer and resuspending in sorbitol culture medium (1 M sorbitol solution in YPD broth). The sorbitol buffer was composed of 1.2 M sorbitol solution (D-Sorbitol, A100691, Sangon Biotech, Shanghai, China) in 0.1 M KH2PO4 (Potassium dihydrogen phosphate, A100781, Sangon Biotech, Shanghai, China).
Preparation of Coverslips
Coverslips were sonicated in acetone at 30°C for 30 min, washed more than three times with double-distilled H2O (ddH20), and dried to remove residual solvents. Next, coverslips were washed in 10 mg/mL ConA (ConA, 11028-71-0, Sigma-Aldrich, St. Louis, MO, USA) more than three times and then submerged in the same solution for 10 min. After drying for 2 h, coverslips were washed in nuclease-free water (Water nuclease-free, B300591, Sangon Biotech, Shanghai, China) and dried again to uniformly distribute the ConA.
Cell Fixing and Digesting
Yeast culture in sorbitol medium was placed on ConA-coated coverslips and incubated for 30 min at room temperate. After washing with PBS, the coverslip with the sample was fixed for 30 min in 4% formaldehyde (157-8, Electron Microscopy Sciences, Hatfield, PA) at 4°C and unbound cells were removed by washing more than three times with phosphate-buffered saline (PBS, 311-010-CL, Wisent, Quebec, Canada). Add 50 μL of digestion solution containing Lyticase (Lyticase, L2524, Sigma-Aldrich, St. Louis, MO, USA), 1 M sorbitol, and 50 mM Tris-buffer (Tris, A610195, Sangon Biotech, Shanghai, China) to each sample, and the mixture was incubated for 30 min at 30°C with gentle shaking. Next, the samples were immersed in cold methanol for 5 min to stop the reaction and then incubated in acetone for 30 s. At each step, the sample was gently washed more than three times in PBS. All samples were inspected with microscopy to confirm the number of attached yeast cells before labeling.
Immunofluorescence Staining
Digested cells were immersed in 0.5% v/v Triton X-100 (Triton X-100, A110694, Sango Biotech, Shanghai, China) for 5 min and blocked with 1% bovine serum albumin (BSA, 001-000-161, Jackson ImmunoResearch Laboratories, West Grove, PA) and 0.5% v/v Triton X-100 for 30 min. The blocked cells were carefully washed 3–5 times for 10 min in PBS, taking care not to dry out the cover plate. Samples were incubated with primary anti-GFP antibody (ab13970, Abcam, Cambridge, MA, USA) for 1 h and then with secondary antibody (ab150173, Abcam, Cambridge, MA, USA) for 1 h. After removing the unbounded secondary antibody, the samples were inspected with microscopy. All staining treatments were performed at room temperature.
ExM
Gelation was performed as previously described [31]. Before polymerization, the sample was incubated with 0.25% glutaraldehyde (A600875-0025, BBI Life Sciences, Shanghai, China) for 10 min at room temperature and washed several times in PBS. A monomer solution [8.625% sodium acrylate (w/w) (408220, Sigma-Aldrich), 2 M NaCl (S5886, Sigma), 2.5% acrylamide (w/w) (A4058, Sigma-Aldrich), 0.15% N, N, -methylenbisacrylamide (w/w) (M7279, Sigma-Aldrich), and 1 × PBS] was added with 0.2% (w/w) tetramethylethylenediamine (TEMED, 17919, Thermo Fisher Scientific, Waltham, MA) and 0.2% (w/w) ammonium persulfate (APS, 17874, Thermo Fisher Scientific, Waltham, MA) to the coverslip with fixed yeast cells. After 2 h of polymerization, the size of the gelated samples was measured. The gel was digested in 8 U/mL proteinase K (EO0491, Thermo Fisher Scientific, Waltham, MA) in digestion buffer (50 mM Tris pH 8.0, 0.5% Triton X-100, 1 mM EDTA, and 0.8 M guanidine HCl) for isotopical expansion. Digested gels were completely submerged in fresh ddH20 every 0.5 h 3–5 times unless the gel size did not increase. An additional fixation process may be performed for better imaging. This method used 3% agarose (Agarose, A620014, Sango Biotech, Shanghai, China) to immobilize the sample.
Imaging
Wide-field images were collected using an EMCCD camera (Evolve 512 Delta Photometrics) equipped with an oil-immersed objective (150×/1.45, Olympus). The pixel size of wide-field images was ~106 nm and the exposure time was set at 50 ms. Emissions were passed through the same objective and filtered by a 520 nm band-pass filter (FF01-520/35-25, Semrock) for Alexa 488. Samples stained with Alexa488 were excited using a 488 nm laser. Airyscan imaging was captured with a confocal microscope (ZEISS, LSM880, Germany) and a Plan-Apochromat 63×/1.4NA oil objective (Zeiss; Plan-Apochromat 63×/1.4 Oil DIC M27). Emissions were passed through a 495–550 nm band-pass filter, then through a 570 nm long-pass filter, and collected with a 32-Channel GaAsP area detector. Sim imaging was performed using a SIM Black system (Zeiss ELYRA S.1 SR-SIM) equipped with a 63×/1.4NA oil objective (Zeiss; Plan-Apochromat 63×/1.4 Oil DIC M27).
Image Processing and Analysis
Airyscan and SIM images of the high-resolution acquisition were applied automatically for Alexa Fluor 488 Channel using ZEN software. To correct for imaging drift, the StackReg plugin of the ImageJ software was used to align an image stack with the target image. Next, processed images were measured and analyzed using ImageJ and Origin. The stack of 2D α-tubulin SIM images was reconstructed into a three-dimensional model using Avizo (Version 2019.1), the solution for 3D visualization and analysis of scientific and industrial data.
Results
Optimization of the ExM Method in Yeast
Using ExM, many researchers obtained outstanding outcomes in various organisms except yeast. In this study, we firstly applied ExM to yeast and analyzed some of its structures. The traditional immunofluorescence approach may result in structures such as septin being severely damaged during the preparation of spheroplasts and centrifugation. To solve this problem, we developed an improved method for yeast immunofluorescence combined with ExM as shown schematically in Figure 1A. Yeast in a logarithmic growth phase was attached to slides specially treated with ConA, and continued to grow and divide on coated slides. After a period of growth, all samples are fixed and wall-digested so that some dividing yeast cells were captured on the slide. Finally, our samples were immunostained and then swelled, and the expansion factor range from 4.0 to 4.1.
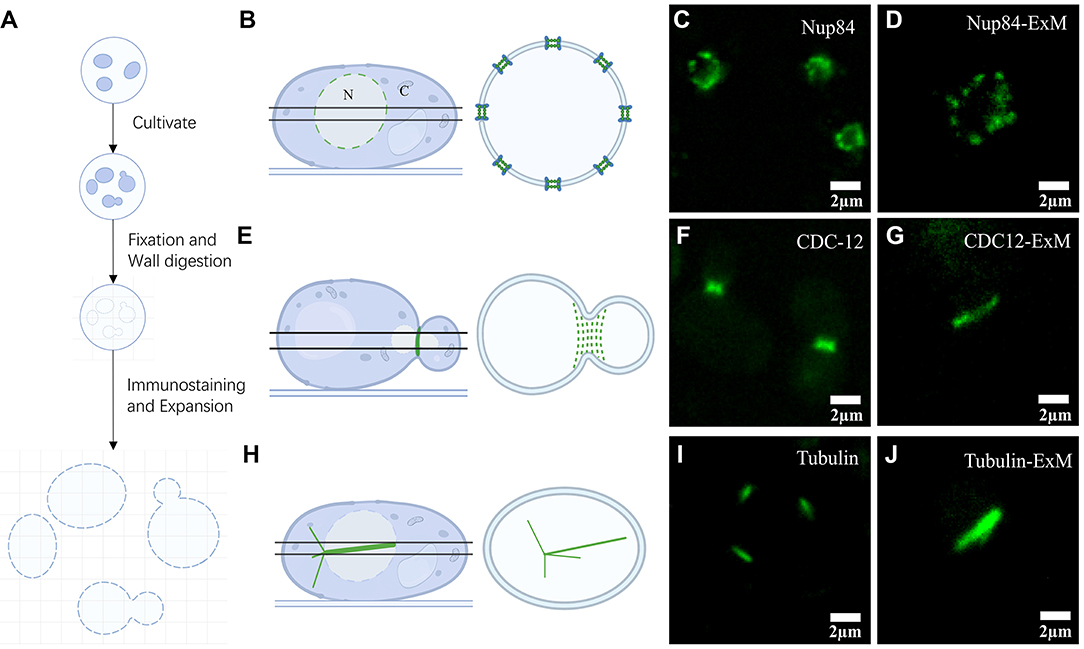
Figure 1. Expansion microscopy of yeast. (A) Schematic diagram of the steps in the yeast expansion protocol. (B) Illustration representing axial imaging with views of Nups located at the equator. (C) Pre-expansion wide-field imaging of Nup84. (D) Post-expansion wide-field imaging of Nup84. (E) Diagram of septin structural illumination during division. (F) Pre-expansion wide-field imaging of septin CDC12. (G) Post-expansion wide-field imaging of septin CDC12. (H) Graphical demonstration of α-tubulin in yeast. (I) Pre-expansion wide-field imaging of α-tubulin. (J) Post-expansion wide-field imaging of α-tubulin. Scale bars, 2 μm (C, D, F, G, I, J). All bars were physical scales before correction with expansion factor.
ExM Results in Yeast
Using this method, we collected images of three structures: NPC, septin, and α-tubulin (Figures 1B,E,H). We illuminated the NPCs located on the equator of the yeast nucleus, which display a circular distribution of nuclear pore spots (Figure 1B). Wide-field imaging of GFP-labeled Nups was recognized well by antibodies (Figure 1C). The results show that the NPCs' axial view, located at the equator under Nup84 labeling, was observed as a roughly circular pre-expansion. The circular structure of the nucleus in cross-sectional shots post-expansion was more obvious under the same imaging conditions (Figure 1D). Using GFP-labeled septin targeted by antibodies, we observed linear septin structures at the junctions of cell divisions (Figure 1F). Although the septin size was enlarged after swelling (Figure 1G), no further structural information was visible and therefore required imaging in combination with higher resolution microscopy such as Airyscan. Afterwards, we proceeded in the same way with α-tubulin of yeast. After expansion, the needle-like structures with uneven tips observed in the α-tubulin images were more visible than before (Figures 1I,J).
Analysis of the NPC
The structure of NPC was analyzed using ExM and Airyscan microscopy. A diagram shows the bottom structure of the nuclear envelope and the radial view of a single NPC (Figure 2A). From this view, the yeast NPC complexes normally consist of eight spokes arranged around a central channel. The top view of yeast NPC at the bottom of the cell nucleus was imaged using Airyscan microscopy, which shows some nuclear pores as hollow spaces (Figure 2B). Using the Airyscan images, we chose single nuclear pores observed with a clear hollow structure and five points (Figure 2C). After center positioning, these nuclear holes with distinct hollow structures were measured and counted. The statistical measurement of the ring diameter data yields a histogram shown in Figure 2D. Analysis of the statistical data results in an average diameter of ~67 ± 15 nm for the Nup 84-GFP fusion protein labeled with antibody after correction with expansion factor. The axial view of the NPC at the equator of the nuclear envelope was illustrated in a diagram in Figure 2E, and two-layer images should be observed in theory [32]. Based on the collected images, two parallel line structures were observed on some nuclear pores (Figure 2F). Likewise, the individual nuclear pores with two linear structures clearly apart and arranged in parallel (Figure 2G) were selected from the lateral images. From the statistical results, the absolute distance between the two parallel rings was recorded, with an average value of 45 ± 12 nm (Figure 2H). We measured 81 pores for diameter and 109 pores for the distance between the two rings.
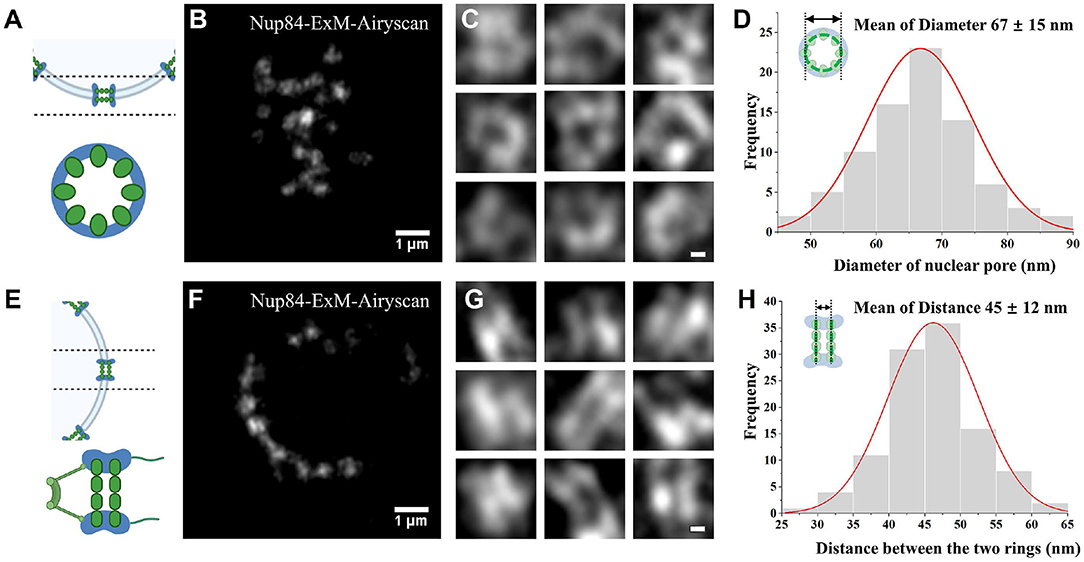
Figure 2. NPC visualized by Airyscan microscopy. (A) Diagram of a radial distribution. (B) Bottom surface imaging of the expansion in Nup84. (C) Images of a radial individual nuclear pore. (D) Diameter histogram of the number of Nup84 molecules. (E) Schematic diagram of the radial view. (F) Post-expanded Nup84 images in the axial view at the equator. (G) Images of single nuclear pore in the axis. (H) Histogram of the separation between rings. Scale bars, 1 μm (B,F) and 0.1 μm (C,G). All bars were physical scales before correction with expansion factor. The expansion factor is 4.0.
Different Septin Stages
As the septin structure (Figure 3A) obtained before expansion imaging by wide-field microscopy did not show more detail compared to the pre-expansion sample, the post-expansion sample was photographed in Airyscan mode. From the Airyscan images, septin labeled with CDC12 was found to have a punctuated distribution, which provides additional structural information (Figure 3B). The structure of septin is arranged differently depending on the period of division based on EM studies [33]. From the EM results, there are three different periods of yeast budding: (1) the early hourglass stage (Figure 3C), (2) the transition stage (Figure 3E), and (3) the double-ring stage (Figure 3G). In the early stage of yeast division (Figure 3C), we found that the fluorescence signals of septin structures were arranged as short parallel lines perpendicular to the division interface (Figure 3D). During this period, the short septin filaments supporting the buds appeared to be arranged in parallel. In the transition stage prior to ring splitting (Figure 3E), the septin structures were arranged in a grid-like pattern during yeast division (Figure 3F), which are supposed to be composed of intersected filaments. The transitional septin complex structure seemed to be made up of horizontally and vertically interwoven septin filaments. At the later, double-ring stage (Figure 3G), the signals were also arranged in lines, but parallel to the division interface (Figure 3H). Compared with the first stage, septin filaments were reoriented by 90 degrees during the whole transition. This observation is in agreement with the model based on polarized fluorescence microscopy studies [22, 23].
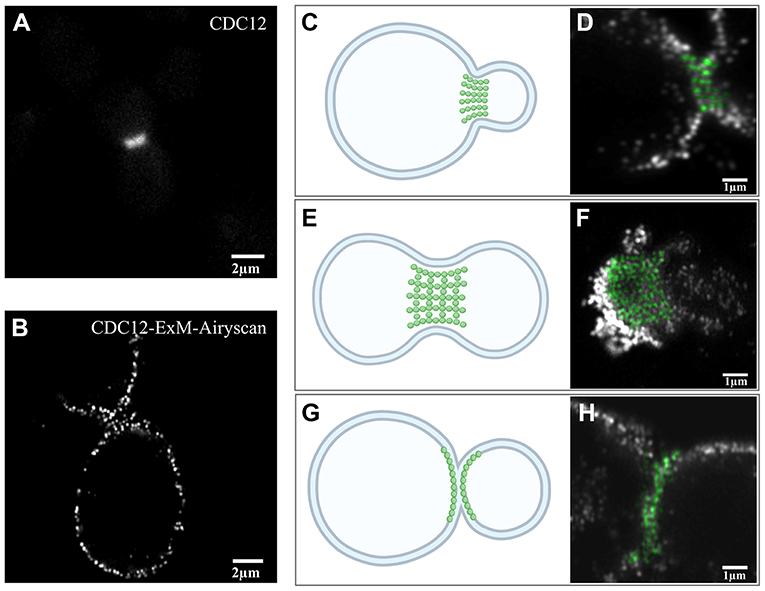
Figure 3. Expansion images of septin-CDC12 in three different stages. (A) Pre-expansion wide-field imaging of septin CDC12. (B) Post-expansion Airyscan imaging of septin CDC 12. Diagram (C) and Airyscan image (D) of the early stages of yeast cell division. Graph (E) and image via Airyscan (F) of septin in the transition stage prior to ring splitting. Illustration (G) and Airyscan image (H) represented septin during the double-ring stage. The green dots in this figure (D,H) were pseudo-colors stand for the cdc12 at the division interface. Scale bar, 2 μm (A,B) and 1 μm (D,F,H). All bars were physical scales before correction with expansion factor. The expansion factor is 4.1.
Three-Dimensional Reconstruction of α-Tubulin
After labeling the yeast α-tubulin, we observed the expansion map of the α-tubulin structure. In SIM mode, we obtained images at different z-axis positions. These images represent the same xy interface with z-axis heights of 0, 0.77, 1.54, 2.31, and 3.19 μm (Figure 4A). All z-axis heights and bars of Figure 4 were physical scales. A single long α-tubulin can be seen connecting multiple branches that were indistinguishable with wide-field imaging (Figures 1I,J and Supplementary Figure 2). However, in SIM imaging, five more clearly detailed branches were visible after inflation (Figure 4A). This observation is consistent with previously reported fluorescence images and EM results of yeast α-tubulin [25]. The α-tubulin structure was analyzed using graphs from different levels, and its three-dimensional view was reconstructed using Avizo software (Figure 4B).
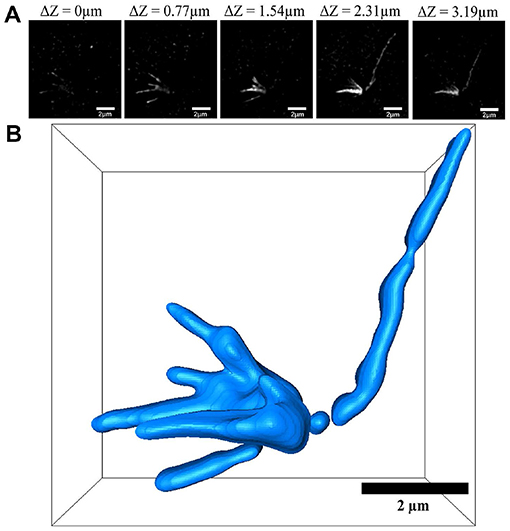
Figure 4. Three-dimensional reconstruction of α-tubulin. (A) SIM images views at different z-levels. (B) Three-dimensional reconstruction using Avizo software. Scale bar, 2 μm (A,B). All bars were physical scales before correction with expansion factor. The expansion factor is 4.0.
Discussion
Advances in super-resolution microscopy have overcame the limits of optical resolution, and offer researchers more visual information [34, 35]. However, super-resolution strategies are not based on a single optical technology, and the combination of different methods allowed us to gain insight into the function of the cell. The ExM technology is simple to operate, with a wide range of applications and compatibility with a wide range of super-resolution microscopy systems. As a result, numerous groups have made great strides in their fields by merging ExM with other super-resolution techniques. Here we show that the application of expansion technology is suitable for use in yeast, and that biological structures can be imaged at the single nuclear pore size level using expansion Airyscan and SIM microscopy. Combined with ExM, the standard Airyscan and SIM microscopy achieved an up to 4-fold improvement in resolution, from 120 to 30 nm (Supplementary Figure 1). Our method is designed to physically expand the yeast cell by immobilizing it and then digesting its cell walls, followed by conventional sample swelling methods. Using this technique, we carried out a structural analysis of the NPC, septin, and α-tubulin in yeast.
Conventional immunofluorescence procedures, which may lead to rupture of dividing yeast cells or even destruction of associated structures, have been optimized in our method. Typical yeast immunofluorescence methods use poly-L-lysine, a cellular non-specific attachment factor that immobilizes cells onto the slide by enhancing the electrostatic interaction between the cell membrane and the slide surface. However, it does not work for all cells, including yeast. Therefore, in the traditional method, the yeast cell walls need to be digested to obtain spheroplasts before it can be adhered to the slide. In these cases, ConA, a coagulant used as an immobilizer, was tried in our approach. Importantly, it also allows yeast to germinate in these conditions and in the presence of sorbitol. After the yeast cell was successfully attached to the ConA-coated slide and cultured in YPD growth medium with sorbitol for a short time, the structure of dividing yeast cells was harvested from dividing cells. This approach allowed us to successfully apply the swelling super-resolution technique to septin in yeast to study the structure of the relevant proteins in the splitting position (shown in the schematic diagram of Figure 1E). This optimization enabled us to apply ExM to some structures in yeast, including septin, which is a structure located at the division site.
We applied our method to the molecular organization of the yeast NPC scaffold, which is generally assumed to be similar to the organization of the human subcomplex [36]. With ExM, the hollow and double-ring structure of individual yeast nuclear pores was observed via Airyscan microscopy. We measured nuclear pores that had a distinctly hollow structure and obtained a mean pore diameter of 67 ± 15 nm. In the same way, the absolute distance between two pore rings in the lateral view was 45 ± 12 nm. More than one factor should be considered regarding the deviation. As resolution increases, the error caused by the size of the antibody itself increases. The error close to the size of the GFP protein and the antibodies is ~15 nm. However, we located the position of the center of the pore with intensity information over five points from the same nuclear pore, which reduces the error to below 7 nm [37]. For further improvements in resolution, small tags such as nanobody or snap [38] can be used in the future to obtain more accurate data in combination with our protocol.
Applying the ExM method to yeast, we showed that septin had different morphologies at the three stages of the cell cycle when imaged with Airyscan. This observation is consistent with models based on EM studies [33]. According to many traditional optical microscopy studies, the septin organization is presented as a long bar in the side-view throughout the period of division, and a detailed distribution of its structure cannot be visualized. In contrast, our Airyscan imaging of septin enabled us to determine that it was linearly aligned both at the early budding and double-ring stages, but with a 90-degree change of direction (Figures 3D,H). This result is consistent with previous polarized fluorescence microscopy studies [22, 39]. In the transition period, however, we observed a grid-like arrangement (Figure 3F). Moreover, our protocol allowed for tagging of multiple proteins, and thus it is potentially valuable to address other issues such as septin order. Admittedly, the distance between two septin proteins is hard to measure accurately owing to the loss of fluorescence during expansion processing [11]. The structure of septin could be further explored if the labeling density were increased.
Conclusions
In summary, the combination of the ExM technique with Airyscan or SIM was suitable to study different yeast structures. As a demonstration, we applied ConA to allow yeast cells to divide on a slide and collected structural images of NPC, septin, and α-tubulin. Our improved method provides access to the analysis of division-related structures located at the placement of the division site, and therefore extends the range of ExM applications in yeast. Compared to conventional optical microscopy, the combination of ExM and super-resolution imaging techniques increase the resolution for observing sub-cellular structures. Because ExM is independent and compatible with many super-resolution microscopes, cutting-edge imaging techniques such as STED and STORM can also be used to solve even smaller biological structural questions in yeast. In addition, ExM can be used flexibly in combination with various techniques, such as small molecule labeling or multiple labeling, to further examine the layout of protein complexes in yeast. Based on our method, other optimized yeast ExM protocols will allow further advances in yeast research.
Data Availability Statement
The original contributions generated in the study are included in the article/Supplementary Material, further inquiries can be directed to the corresponding authors.
Author Contributions
LC and JM conceived the project. LC performed the experiments, wrote the manuscript and performed imaging processing, and data analysis. LY, LZ, YF, LM, and JM revised the manuscript. All authors contributed to the article and approved the submitted version.
Funding
This research was financially supported by the National Natural Science Foundation of China (NSFC; Grants Numbers 11574056 and 61575046), the Ministry of Science and Technology of the People's Republic of China, (China-Serbia Bilateral Project SINO-SERBIA2018002), the Fudan University–CIOMP Joint Fund (Grant Numbers FC2017-007 and FC2018-001), the Pioneering Project of Academy for Engineering and Technology, Fudan University (Grants Numbers gyy2018-001 and gyy2018-002), the Shanghai Key Discipline Construction Plan (2020-2022) (Grant Number GWV-10.1-XK01), and the Shanghai Natural Science Foundation (Grant Numbers 20ZR1405100 and 20ZR1403700).
Conflict of Interest
The authors declare that the research was conducted in the absence of any commercial or financial relationships that could be construed as a potential conflict of interest.
Acknowledgments
The authors wish to thank LZ for help with the experiments, LY, Baoju Wang, and Yueyue Jing for help in revising the manuscript, the Juntao Gao group for providing us with the septin CDC12-GFP yeast strain, and Editage (www.editage.cn) for English language editing.
Supplementary Material
The Supplementary Material for this article can be found online at: https://www.frontiersin.org/articles/10.3389/fphy.2021.650353/full#supplementary-material
References
1. Hell SW, Wichmann J. Breaking the diffraction resolution limit by stimulated emission: stimulated-emission-depletion fluorescence microscopy. Optics Lett. (1994) 19:780–2. doi: 10.1364/OL.19.000780
2. Jahr W, Velicky P, Danzl JG. Strategies to maximize performance in stimulated emission depletion (STED) nanoscopy of biological specimens. Methods. (2020) 174:27–41. doi: 10.1016/j.ymeth.2019.07.019
3. Hausmann M, Schneider B, Bradl J, Cremer C. High-precision distance microscopy of 3D-nanostructures by a spatially modulated excitation fluorescence microscope. Proc SPIE. (1997) 3197:217–22. doi: 10.1117/12.297969
4. Gustafsson MG. Surpassing the lateral resolution limit by a factor of two using structured illumination microscopy. J Microsc. (2000) 198:82–7. doi: 10.1046/j.1365-2818.2000.00710.x
5. Schermelleh L, Carlton PM, Haase S, Shao L, Winoto L, Kner P, et al. Subdiffraction multicolor imaging of the nuclear periphery with 3D structured illumination microscopy. Science. (2008) 320:1332–6. doi: 10.1126/science.1156947
6. Huff J. The Airyscan detector from ZEISS: confocal imaging with improved signal-to-noise ratio and super-resolution. Nat Methods. (2015) 12:i–ii. doi: 10.1038/nmeth.f.388
7. Hildenbrand G, Rapp A, Spöri U, Wagner C, Cremer C, Hausmann M. Nano-sizing of specific gene domains in intact human cell nuclei by spatially modulated illumination light microscopy. Biophys J. (2005) 88:4312–8. doi: 10.1529/biophysj.104.056796
8. Korobchevskaya K, Lagerholm BC, Colin-York H, Fritzsche M. Exploring the potential of airyscan microscopy for live cell imaging. Photonics. (2017) 4:41. doi: 10.3390/photonics4030041
9. Rust MJ, Bates M, Zhuang X. Sub-diffraction-limit imaging by stochastic optical reconstruction microscopy (STORM). Nat Methods. (2006) 3:793–5. doi: 10.1038/nmeth929
10. Chen F, Tillberg PW, Boyden ES. Optical imaging. Expans Microsc Sci. (2015) 347:543–8. doi: 10.1126/science.1260088
11. Tillberg PW, Chen F, Piatkevich KD, Zhao Y, Yu CC, English BP, et al. Protein-retention expansion microscopy of cells and tissues labeled using standard fluorescent proteins and antibodies. Nat Biotechnol. (2016) 34:987–92. doi: 10.1038/nbt.3625
12. Artur CG, Womack T, Zhao F, Eriksen JL, Mayerich D, Shih W-C. Plasmonic nanoparticle-based expansion microscopy with surface-enhanced Raman and dark-field spectroscopic imaging. Biomed Opt Express. (2018) 9:603–15. doi: 10.1364/BOE.9.000603
13. Ku T, Swaney J, Park JY, Albanese A, Murray E, Cho JH, et al. Multiplexed and scalable super-resolution imaging of three-dimensional protein localization in size-adjustable tissues. Nat Biotechnol. (2016) 34:973–81. doi: 10.1038/nbt.3641
14. Wang G, Moffitt JR, Zhuang X. Multiplexed imaging of high-density libraries of RNAs with MERFISH and expansion microscopy. Sci Rep. (2018) 8:4847. doi: 10.1038/s41598-018-22297-7
15. Chang J-B, Chen F, Yoon YG, Jung EE, Babcock H, Kang JS, et al. Iterative expansion microscopy. Nat Methods. (2017) 14:593–9. doi: 10.1038/nmeth.4261
16. Zhao Y, Bucur O, Irshad H, Chen F, Weins A, Stancu AL, et al. Nanoscale imaging of clinical specimens using pathology-optimized expansion microscopy. Nat Biotechnol. (2017) 35:757–64. doi: 10.1038/nbt.3892
17. Cahoon CK, Yu Z, Wang Y, Guo F, Unruh JR, Salughter BD, et al. Superresolution expansion microscopy reveals the three-dimensional organization of the Drosophila synaptonemal complex. PNAS. (2017) 114:E6857–66. doi: 10.1073/pnas.1705623114
18. Halpern AR, Alas G, Chozinski TJ, Paredez AR, Vaughan JC. Hybrid structured illumination expansion microscopy reveals microbial cytoskeleton organization. ACS Nano. (2017) 11:12677–86. doi: 10.1021/acsnano.7b07200
19. Tsai A, Muthusamy AK, Alves MR, Lavis LD, Singer RH, Stern DL, et al. Nuclear microenvironments modulate transcription from low-affinity enhancers. eLife. (2017) 6:e28975. doi: 10.7554/eLife.28975
20. Götz R, Panzer S, Trinks N, Eilts J, Wagener J, Turrà D, et al. Expansion microscopy for cell biology analysis in fungi. Front Microbiol. (2020) 11:574. doi: 10.3389/fmicb.2020.00574
21. Aitchison JD, Rout MP. The yeast nuclear pore complex and transport through it. Genetics. (2012) 190:855–83. doi: 10.1534/genetics.111.127803
22. Vrabioiu AM, Mitchison TJ. Structural insights into yeast septin organization from polarized fluorescence microscopy. Nature. (2006) 443:466–9. doi: 10.1038/nature05109
23. McMurray MA, Bertin A, Garcia G III, Lam L, Nogales E, Thorner J. Septin filament formation is essential in budding yeast. Dev Cell. (2011) 20:540–9. doi: 10.1016/j.devcel.2011.02.004
24. Bertin A, McMurray MA, Grob P, Park SS, Garcia G III, Patanwala I, et al. Saccharomyces cerevisiae septins: supramolecular organization of heterooligomers and the mechanism of filament assembly. Proc Natl Acad Sci USA. (2008) 105:8274–9. doi: 10.1073/pnas.0803330105
25. Keck JM, Jones MH, Wong CC, Binkley J, Chen D, Jaspersen SL, et al. A cell cycle phosphoproteome of the yeast centrosome. Science. (2011) 332:1557–61. doi: 10.1126/science.1205193
26. Senic-Matuglia F, Visintin R. Localizing MEN components by indirect immunofluorescence analysis of budding yeast. Methods Mol Biol. (2017) 1505:135–49. doi: 10.1007/978-1-4939-6502-1_11
27. Syga Ł, Spakman D, Punter CM, Poolman B. Method for immobilization of living and synthetic cells for high-resolution imaging and single-particle tracking. Sci Rep. (2018) 8:13789. doi: 10.1038/s41598-018-32166-y
28. Garcia G III, Bertin A, Li Z, Song Y, McMurray MA, Thorner J, et al. Subunit-dependent modulation of septin assembly: budding yeast septin Shs1 promotes ring and gauze formation. J Cell Biol. (2011) 195:993–1004. doi: 10.1083/jcb.201107123
29. Huh WK, Falvo J, Gerke L, Carroll AS, Howson RW, Weissman JS, et al. Global analysis of protein localization in budding yeast. Nature. (2003) 425:686–91. doi: 10.1038/nature02026
30. Zhanghao K, Chen L, Yang XS, Wang MY, Jing ZL, Han HB, et al. Super-resolution dipole orientation mapping via polarization demodulation. Light Sci Appl. (2016) 5:e16166. doi: 10.1038/lsa.2016.166
31. Chozinski TJ, Halpern AR, Okawa H, Kim H-J, Tremel GJ, Wong ROL, et al. Expansion microscopy with conventional antibodies and fluorescent proteins. Nat Methods. (2016) 13:485–8. doi: 10.1038/nmeth.3833
32. Mi L, Goryaynov A, Lindquist A, Rexach M, Yang W. Quantifying nucleoporin stoichiometry inside single nuclear pore complexes in vivo. Sci Rep. (2015) 5:9372. doi: 10.1038/srep09372
33. Ong K, Svitkina T, Bi E. Visualization of in vivo septin ultrastructures by platinum replica electron microscopy. Methods Cell Biol. (2016) 136:73–97. doi: 10.1016/bs.mcb.2016.03.011
34. Coltharp C, Xiao J. Superresolution microscopy for microbiology. Cell Microbiol. (2012) 14:1808–18. doi: 10.1111/cmi.12024
35. Schermelleh L, Ferrand A, Huser T, Eggeling C, Sauer M, Biehlmaier O, et al. Super-resolution microscopy demystified. Nat Cell Biol. (2019) 21:72–84. doi: 10.1038/s41556-018-0251-8
36. Szymborska A, de Marco A, Daigle N, Cordes VC, Briggs JA, Ellenberg J. Nuclear pore scaffold structure analyzed by super-resolution microscopy and particle averaging. Science (New York, NY). (2013) 341:655–8. doi: 10.1126/science.1240672
37. Ma J, Kelich JM, Junod SL, Yang W. Super-resolution mapping of scaffold nucleoporins in the nuclear pore complex. J Cell Sci. (2017) 130:1299–306. doi: 10.1242/jcs.193912
38. Sun DE, Fan X, Shi Y, Zhang H, Huang Z, Cheng B, et al. Click-ExM enables expansion microscopy for all biomolecules. Nat Methods. 18:107–13 (2021). doi: 10.1038/s41592-020-01005-2
Keywords: expansion super-resolution, yeast, nuclear pore complex, septin, tubulin
Citation: Chen L, Yao L, Zhang L, Fei Y, Mi L and Ma J (2021) Applications of Super Resolution Expansion Microscopy in Yeast. Front. Phys. 9:650353. doi: 10.3389/fphy.2021.650353
Received: 07 January 2021; Accepted: 02 March 2021;
Published: 29 March 2021.
Edited by:
Vicente Micó, University of Valencia, SpainReviewed by:
Yongxin Zhao, Carnegie Mellon University, United StatesMichael Hausmann, Heidelberg University, Germany
Jae-Byum Chang, Korea Advanced Institute of Science and Technology, South Korea
Copyright © 2021 Chen, Yao, Zhang, Fei, Mi and Ma. This is an open-access article distributed under the terms of the Creative Commons Attribution License (CC BY). The use, distribution or reproduction in other forums is permitted, provided the original author(s) and the copyright owner(s) are credited and that the original publication in this journal is cited, in accordance with accepted academic practice. No use, distribution or reproduction is permitted which does not comply with these terms.
*Correspondence: Lan Mi, bGFubWlAZnVkYW4uZWR1LmNu; Jiong Ma, amlvbmdtYUBmdWRhbi5lZHUuY24=