 Sevgi Onal
 Maan M. Alkaisi
 Volker Nock
- 1Electrical and Computer Engineering, University of Canterbury, Christchurch, New Zealand
- 2MacDiarmid Institute for Advanced Materials and Nanotechnology, Wellington, New Zealand
- 3Biomolecular Interaction Centre, University of Canterbury, Christchurch, New Zealand
Evidence continues to emerge that cancer is a disease not only of genetic mutations, but also of altered mechanobiological profiles of the cells and microenvironment. This mutation-independent element might be a key factor in promoting development and spread of cancer. Biomechanical forces regulate tumor microenvironment by solid stress, matrix mechanics, interstitial pressure, and flow. Compressive stress by tumor growth and stromal tissue alters cell deformation and recapitulates the biophysical properties of cells to grow, differentiate, spread, or invade. Such solid stress can be introduced externally to change the cell response and to mechanically induce cell lysis by dynamic compression. In this work, we report a microfluidic cell culture platform with an integrated, actively modulated actuator for the application of compressive forces on cancer cells. Our platform is composed of a control microchannel in a top layer for introducing external force and a polydimethylsiloxane (PDMS) membrane with monolithically integrated actuators. The integrated actuator, herein called micro-piston, was used to apply compression on SKOV-3 ovarian cancer cells in a dynamic and controlled manner by modulating applied gas pressure, localization, shape, and size of the micro-piston. We report fabrication of the platform, characterization of the mechanical actuator experimentally and computationally, and cell loading and culture in the device. We further show the use of the actuator to perform both repeated dynamic cell compression at physiological pressure levels and end point mechanical cell lysis, demonstrating suitability for mechanical stimulation to study the role of compressive forces in cancer microenvironments. Finally, we extend cell compression applications in our device to investigating mechanobiologically related protein and nuclear profiles in cyclically compressed cells.
1 Introduction
Extensive efforts have been made to study the role of gene mutations in cancer, and an accumulation of multiple mutations has been proposed as being necessary for cancer development. Recently however, evidence has been accumulated indicating that cancer is not only a disease of genetic mutations but also that the micro- and nano-environments of cells may be essential factors in triggering tumor growth [1]. For example, the dysfunctional collagen cross-linking in the extracellular matrix (ECM) have been found to lead to breast tumorigenesis and modulate the ECM stiffness to force focal adhesions, integrin expression, and, in turn, breast malignancy [2]. Inevitably, tumors can initiate due to an induction either from the tumor microenvironment or genetic and epigenetic background of the cells [1]. However, metastasis is the main cause of deaths in cancer patients; thus, recent research is elaborating on the basis of metastasis and potential treatments [3]. Tumorigenic and metastatic events are induced by mechanical forces from the altered cell and ECM mechanics [1, 4–6]. Biomechanical forces regulate the tumor microenvironment by solid stress, matrix mechanics, interstitial pressure, and flow [4]. Cancer cells alter their own biophysical properties and exert physical forces during primary tumor growth and then to spread, invade, or metastasize [6, 7]. All these examples point that phenotypes may become dominant over genotypes of the tumor cells depending on the microenvironment [1]. Thus, an altered mechanobiological profile of the cells and microenvironments (a mutation-independent element) is proposed to be necessary to promote development and spread of cancer [8]. However, there are no coherent quantitative data on the nature and level of mechanical forces that influence the interactions between the physical micro- and nano-environment and cancer cells [7].
As a result, the application of mechanical compression on living cells, such as cancerous [5, 9–19], noncancerous and stromal cells [20–22], neurons [23], and chondrocytes [24], has gained importance in recent years. Compression applied on cancer types, such as breast [5, 16, 18, 19], brain [13], pancreatic [9], and ovarian [17, 25] cancer cells, resulted in more invasive and metastatic forms. While indicative, previous studies all point out the need for further investigations to understand the effect of compressive mechanical stimuli in metastasis of different cancer types, for example, ovarian cancer [17, 25, 26]. Ovarian cancer cells are exposed to compressive stress mainly by tumor growth, native tissue, and hydrostatic pressure from ascites [25, 26]. SKOV-3 is among the ovarian cancer cell lines tested to be responsive to compressive stimuli and has a metastatic phenotype. Thus, SKOV-3 cells can be used as a model to understand the impact of the compression in epithelial ovarian cancer with intraperitoneal metastatic dissemination induced by direct extension of cells and multicellular aggregates into the peritoneal cavity [27]. Understanding these compressive forces may eventually help with the development of pharmaceuticals for the signal transduction mechanisms associated with the mechanical stimulation [9] and mechanical treatment [12, 28] or mechanoceuticals.
From a cell biology perspective, mechanical compressive stress can induce the necrosis mode of cancer cell death, resulting in autolysis. Such phenomena play important roles in the recruitment of immune cells to the site of cancer through the release of danger-associated molecular patterns during necrosis [12]. Compression also alters the cell deformation and causes mechanical lysis of the cells. In general, controlled mechanical lysis of adherent cells in vitro has advantages over chemical lysis by lytic agents or electrical lysis by applied electrical fields. Intracellular contents can be retained in the sample after mechanical lysis, and rapid cell-based assays can be run after compression [10]. Compressive force induction in vitro further allows to study stromal cell differentiation and their activation to cancer-associated form (e.g., fibroblast-to-myofibroblast differentiation) depending on the magnitude of the applied stress [4, 22]. Controlled compression in particular can be readily achieved in microfluidic settings. Microfluidic systems can be designed to have integrated physical structures introducing static and dynamic physical inputs, as well as gradients, and enabling real-time imaging, thus providing very useful tools to study biomechanics of the living cells.
While force application systems capable of inducing compressive stress on living cells exist in the literature [5, 10, 23, 24, 29], only a very limited number have yet been used to apply compression on cancer models in a localized, flexible, and dynamic manner. Tse et al. developed a transmembrane pressure device applying compression on cancer cells; however, this is a bulk system that can apply constant force, lacking automation of modulation of the applied pressure [5]. Similar static setups in bulk systems were used more recently by Kim et al. [18] and Li et al. [19] on cancer-associated stromal cells. Compression can also be applied on cells indirectly with the usage of multicellular spheroids (MCSs) and methods that can restrict the volume of the MCSs. Delarue et al. [30] added dextran, a biopolymer that does not penetrate single cells, to the culture medium of the MCSs. This change in the media exerted a moderate osmotic stress on the outermost layer of the cells in spheroids. This osmotic stress was mechanically transmitted to the rest of the spheroid as a compressive stress, which in turn resulted in a reduction of the MCS volume. Thus, the compressive stress transmission on the cells inside the spheroids has an osmotic origin but not a contacting physical surface by more rigid polymers such as polydimethlysiloxane and an actively applied pressure, although this osmotic effect does not refer to high osmolarity, such as of salts, acting at a single cell level. This type of compression was also applied in a static and bulk manner in 48-well plates with the resultant compression at 5 and 10 kPa based on the concentration of the dextran added to the culture medium, unlike a controlled manner that can be achieved in microfluidic devices. Although compression effects on other cell types, such as fibroblasts, neurons, and chondrocytes, have been shown using microfluidic devices, compression effects in cancer on-chip need more investigation. Lee et al. mentioned dynamic compression; however, their study did not expand on the dynamic compression capability of their devices [24]. While crucial to the latter, retraction and position recovery of the compressed compartment of the device were not shown. Similarly, none of the previous studies demonstrated well-defined pressure supply and sensing methods for automation, readability, and portability of the pressure application, or showed live compression on cells in real time.
Asem et al. [25] and Klymenko et al. [27] applied static compression at ∼3 kPa and at 3.18–3.53 kPa, respectively, on ovarian cancer models in off-chip settings. On the other hand, a recent work by Novak et al. remains the only study to date using a bioreactor device, which is yet at millimeter scale, to investigate the effect of compressive mechanical stress on ovarian cancer [17]. OVCAR ovarian cancer cells were exposed to both static and cyclic compression, leading to increases in proliferation, invasive morphology, and chemoresistance. When compared to cyclic loading, static compressive stimulation enhanced the aspect ratio of OVCAR3 cells, but no difference in cellular proliferation could be observed. This result is of particular interest as chronic mechanical loading has been postulated to aid in ovarian cancer progression, forming a positive feedback loop [26]. Clearly, the effects of cyclic compression require further study, and applied cyclic pressures need to be expanded from the range of 3.9 to 6.5 kPa used by Novak et al. [17] to the physiologically relevant 3.7–18.9 kPa and above estimated to occur in human tumors [26, 28].
Our system achieves the flexible, localized, and dynamic control of such compression by use of a polydimethylsiloxane (PDMS) actuator monolithically fabricated as attached to a membrane. The integrated flexible actuator, herein called micro-piston, can be used to apply compression on cells in a dynamic and controlled manner by modulating the amount and duration of the applied gas pressure, shape and size of the actuator, and its localization at the x–y–z plane as suspended in the microchannel (Figure 1). Localized compression of the culture can be achieved by applying compression on cells under the micro-piston as the test group, while leaving the cells around the micro-piston nontreated as the control group (Figure 1A). This provides the flexibility of having the test and control groups in the same microchannel with a spatial and temporal control on the groups. For instance, the same device can be first control and then both test and control by applying dynamic compression, as well as that stains or antibodies can be loaded to do further analysis on the cell groups at the same time. Thus, the control group in this work refers to the cells under and around the static (noncompressed) micro-piston before dynamic compression and the cells in the control regions around the micro-piston after compression. Further, the dimensions of the compartments do not rely on each other by photoresist master fabrication as each PDMS layer is fabricated separately and then assembled together (see Supplementary Figure S1). Thus, when a compartment of the micro-piston device needs to be changed, it is enough to change the dimension of one layer while keeping the others as the same.
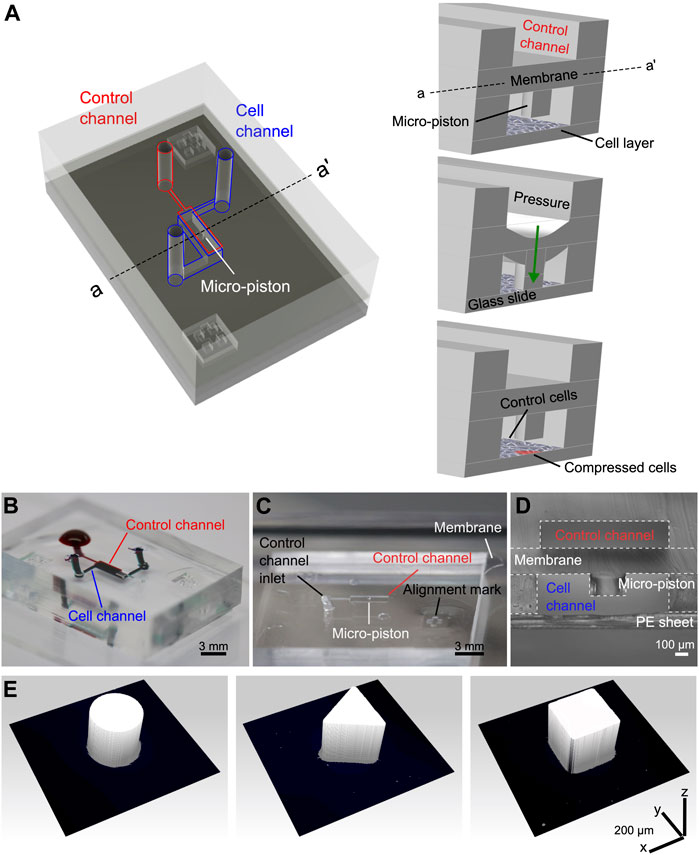
FIGURE 1. Device design, concept of compression on cells, and fabricated devices. (A) Assembly design of the chip composed of the control channel (outlined in red) for introducing gas pressure and cell channel (outlined in blue) for cell culture. The concept of applying compression on cells is illustrated by the membrane deflection and micro-piston brought onto the cells by the pressure applied through the control channel and retracted back after compression. Thus, the localized part of the cell monolayer under the micro-piston was compressed, while the rest acted as control (Figure not drawn to scale). (B) Top view of the PDMS layers of the micro-piston device (scale 3 mm). The devices were vacuumed for 3 h, and channels were passively filled with dye solutions for visualization. (C) Top view of the PDMS micro-piston with the membrane bonded to control layer before bonding to bottom open channels (scale 3 mm). (D) Cross-sectional view of the micro-piston device (scale 100 µm). (E) 3D profilometer scans of circular, triangle, and square micro-pistons sitting on PDMS membranes bonded to control channel layers as in (C) (x–y–z scale 200 µm each).
In this study, we report the development of the microfluidic platform, a detailed fabrication method, and mechanical characterization of the actuation mechanism by optical imaging methods and computational simulations. We use mechanical modeling which is in a good agreement with the experimental data obtained from the vertical displacement measurements to predict the actual pressure inside the device based on the externally applied pressure. We further show evaluation of the platform with SKOV-3 ovarian cancer cells for mechanical stimulation and lysis under dynamic compression. We investigate the cell viability response to varying pressures in ascending order. We prove the ability of our platform to apply cyclic and varying compression profiles sequentially so that it can be used to mimic the chronic mechanical stimuli the cells are exposed to in ovarian cancer metastasis. We also show the temporal evolution of the dynamic pressure control on cell compression and deformation with different pressure amounts, time length and cyclic mode. We further extend the applicability of the cyclic compression with our platform by capturing the actin and nuclear deformation in the cyclically compressed cells. Our results demonstrate suitability of the micro-piston device for mechanical stimulation with various physiological pressures based on live-and-dead cell assay and mechanobiologically related protein profile to study cell biomechanics and compressive forces in cancer microenvironments.
2 Materials and Methods
2.1 Device Design and Fabrication
To demonstrate localized and dynamically controlled compression of cancer cells, we fabricated a microfluidic platform with flexible actuators composed of PDMS [31]. Main components of the platform are control channel in the top layer, membrane and micro-piston in the middle, and the cell culture chamber in the bottom layer enclosed with a glass substrate (see Figure 1A). The control channel was designed to introduce external pressure [32], the membrane to enable micro-piston actuation, and the micro-piston itself to apply compressive forces on the cells cultured on the glass surface in the bottom layer channel. Photolithographic masks were designed using L-Edit (v2019, Mentor Graphics) and written onto photomask blanks (Nanofilm, United States) using a laser mask writer (µPG101, Heidelberg Instruments). Silicon wafers were dehydrated at 185°C in an oven overnight. After cooling down, the wafers were plasma cleaned at 100 W with O2 gas flow at 5 sccm for 10 min (Tergeo, PIE Scientific). As shown in Supplementary Figure S1A, dry film lamination of negative-tone photoresist on silicon wafers was used to fabricate masters [33]. For the lamination setup, we used 500-µm-thick metal shims for a total thickness of Si wafer plus 200-µm or 300-µm SUEX films (DJMicrolaminates) and PET sheets. The films were laminated to the substrate at 65°C at 1 ft/min using a roll laminator (Sky 335R6, DSB). Post-lamination bake was applied at 65°C for 15 min, and the laminates were left to cool down for 2–3 h before UV exposure on a mask aligner (MA-6, SUSS). Filtered doses (PL-360-LP, Omega Optical) of 1800 mJ/cm2 for 200-µm-thick film and 2,300 mJ/cm2 for 300-µm-thick film were used in multiple cycles of 20-s exposures with 60-s cooldown intervals between cycles. Postexposure bake (PEB) was applied at 65°C for 5 min and at 95°C for 15 min for 200-µm films and 20 min for 300-µm films with a ramp up of 100°C/h and ramp down of 15°C/h. The masters were developed 24 h after cooling down from PEB. Developer was applied with the SUEX master face-down in propylene glycol methyl ether acetate (PGMEA, Sigma) until fully developed. Hard-bake was applied at 125°C for 60 min with a ramp up of 100°C/h and ramp down of 15°C/h on a hot plate.
Before replication, master molds were treated with 1H, 1H, 2H, 2H-perfluorodecyltriethoxysilane (PFDTES, Sigma-Aldrich) for 3 h. All flexible layers of the micro-piston device were fabricated from a 10:1 w/w mixture of PDMS (Sylgard 184, Dow) base and curing agent. Micro-pistons, monolithically integrated onto a PDMS membrane, were obtained by spin-coating (Laurell WS-650) PDMS pre-polymer onto 200-µm-thick photoresist masters. After spinning, PDMS was baked for 1 h at 80°C for initial curing. Similarly, bottom layer channels and the control layer were fabricated by exclusion molding [34], modified for our work, and replica molding of PDMS [35] of 300- and 200-µm-thick photoresist masters, respectively. For the exclusion molding, the PDMS poured on the master was first vacuumed for 2 h, and then, a PE sheet was rolled on the PDMS, and most of the excess PDMS was excluded out. Finally, a rubber sheet and heavy metal block were placed on the PDMS on master for complete exclusion out of the photoresist mold, and the construct was baked at 80°C for 2 h, as shown in Supplementary Figure S1A. Allowing it to cool down overnight, the PDMS stamp with open channels and open frame alignment marks were peeled off. Alignment marks designed to fit each other were used to align the layers while bonding (see Figures 1A–C, Supplemenatary Figure S1). After plasma surface treatment at 15 W with O2 gas flow at 3 sccm for 1 min (Tergeo, PIE Scientific), devices were assembled by manual alignment, and bonding of the membrane with micro-piston to the control layer and bottom channels (see Figures 1C,D). PDMS layer alignment was checked using a light microscope and, if necessary, corrected for fine matching the edges of top and bottom microchannels before the plasma-treated surfaces were permanently bonded. After every alignment and bonding of the layers, the construct was baked for 2 h at 80°C. These fabrication steps were applied for different diameters and shapes including the circular, triangle, and square micro-pistons, as shown in Figure 1E. Those reference geometries were used to test our fabrication method for the resolution of the structures at high dimensions of our device and high fidelity of the spin-coating method to obtain the micro-pistons as monolithically attached to the membrane at these high dimensions of the micro-piston to be fitting and suspending in a bottom channel height at mammalian cell culture standards and the thickness of the attached membrane itself.
2.2 Mechanical Modeling of Micro-Piston Actuator
Actuation by the micro-piston device as a function of applied gas pressure was modeled as a symmetrical 3D geometry using COMSOL Multiphysics (V5.5, COMSOL). PDMS was modeled as hyperelastic material using a Saint Venant–Kirchhoff model. The Lame parameters λ and μ of PDMS were set at 4.66 and 460 kPa, respectively [36]. Borosilicate from the materials library was used to model the glass substrate as linear elastic material. External gas pressure was applied as a boundary load and varied from 0 to 700 mbar in 40 steps using a parametric sweep. The standard stationary solver was used with a physics-controlled mesh. Pressure under the piston was visualized as a surface plot, and piston displacement and maximum piston pressure were exported as a function of applied gas pressure.
2.3 Pressure Supply Unit and Operation of the Force Application System
The membrane and thus micro-piston were actuated by a syringe pump (NE-1000, New Era Pump Systems) or pressure controller (OB1 Mk3+, Elveflow) coupled with pressure sensors (MSP4, 7 bar, Elveflow) and sensor readers (MFR and MSR, Elveflow) operated via ESI software (v3.02, Elveflow Smart Interface) to address the air or N2 gas pressure amount required to deflect the membrane and actuate the micro-piston. While indicating the units of the pressure values in this work, mbar was used for the externally applied pressures as per the settings and calibrations on the pressure pump and sensor readers, while kPa was used for the piston contact pressure as conversion from pascal by N/m2 computed on mechanical modeling. PDMS devices were fixed through a custom-designed, 3D-printed (MoonRay, SprintRay) sample holder stage so that the devices do not move while applying pressure.
2.4 Optical Profilometer Measurements
The membrane deflection and micro-piston movements were quantified using a Profilm3D optical profilometer (Filmetrics Inc. United States) by scanning the total height of the vertical displacement of the deflected membrane and micro-piston during actuation. The data were further processed and analyzed using ProfilmOnline software. For each applied pressure amount, average step heights of the vertical displacements were calculated from different regions of interest (ROIs) on the membrane at each side of the micro-pistons. For the full view of a micro-piston per cell-culture chamber, 3D optical profile series were scanned and stitched on an area of 7 mm height × 9 mm width with 20% overlap between individual scans (see Supplementary Figure S2C).
2.5 Cell Culture and Preparation
SKOV-3 ovarian cancer cells (supplied by the Laboratory for Cell and Protein Regulation at the University of Otago) were cultured in Earle’s salts and l-glutamine-positive MEM (GIBCO®) supplemented with 10% fetal bovine serum (FBS, Life Technologies), 1% of penicillin/streptomycin (Life Technologies), and 0.2% fungizone (Life Technologies) in a humidified atmosphere of 5% CO2 at 37°C. Cell seeding densities of 0.5, 1, 1.5, and 1.8 M cells/ml for ovarian cancer cells were tested for optimization of the cell number in the microfluidic channel to form a cell monolayer and capture cells under the micro-piston. To promote cell adhesion by enhancing electrostatic interactions between the cell membrane and the glass substrate, the cell culture channels of the microfluidic devices were coated with 0.01% (w/v in H2O) poly-l-lysine (PLL) solution (Sigma).
2.6 Confocal Imaging of the Micro-Piston Device
For confocal imaging of the compression application with the PDMS micro-piston, PDMS cell culture channels with the suspended micro-piston inside were stained with DiD (lipophilic carbocyanine DiIC18(5) solid) (Vybrant, Thermo Fisher, 1:300) for 48 h. The DiD solution on-chip was replenished 24 h after staining started. The stained micro-pistons and microchannels were imaged using a confocal laser scanning microscope (Leica TCS SP5) with PMT detectors. DiD was excited using the HeNe laser at 633 nm with 46% intensity with an emission at 665 nm. The distance between the bottom glass surface and suspended micro-piston in the cell culture channel was 3D-scanned at static state (before compression) and then at compressed state of the micro-piston (see Figure 2D) by taking the outmost upward z-position of the × 20 objective (NA 0.70; PL-APO IMM CORR) as reference for the start level of each scan by the physical restraint of the mechanical knob at an inverted microscope setup. The length of each 3D scan was taking up to 5 min by 5-µm step size for a ∼300 µm total z-volume with the DiD and bright-field channels at 1,024 × 1,024 resolution, due to the dimensions of the micro-piston device. In between the static and compressed states, the xyt (time-lapse) imaging mode of the laser scanning was applied to capture the displacement of the actuated micro-piston while approaching the focal plane of the cells at the bottom surface. Data were processed using the 3D Viewer plug-in of ImageJ (Fiji) [37].
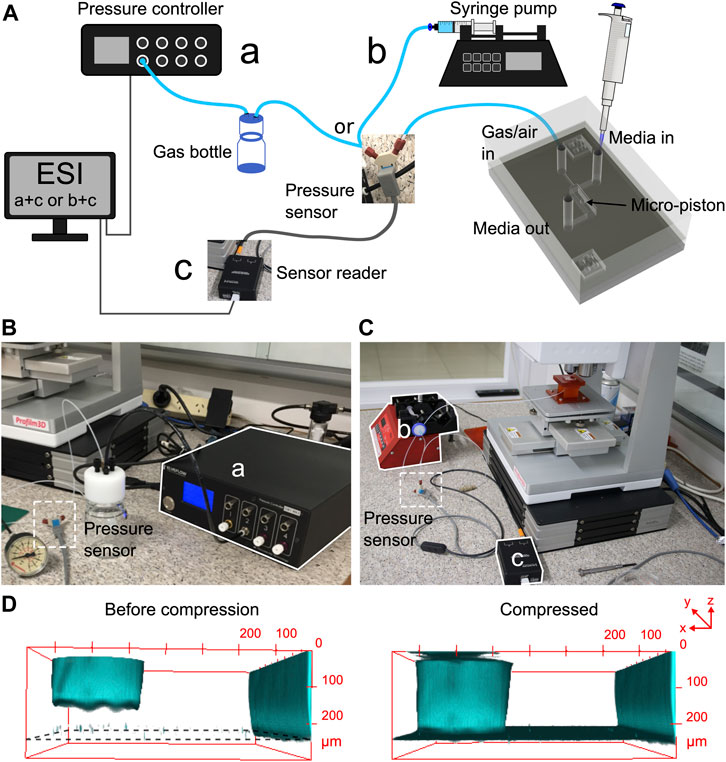
FIGURE 2. Pressure supply, sensing setup, and confocal imaging of the micro-piston device compression. (A) Schematic of the experimental setup showing the ways of pressure supply into the control channel and cell seeding. Cells within media were introduced into the cell channel through the inlet labeled as “media in,” and gas or air pressure was supplied through the inlet of the control channel labeled as “gas/air in.” The pressure sensor was located just before the gas flow into the control channel. (B) Experimental setup with the pressure controller system. (C) Experimental setup with the syringe pumping system. (D) Confocal images illustrating the concept of applying compression with an integrated PDMS micro-piston in a microfluidic channel. PDMS was stained with DiD for visualization.
2.7 Device Operation for Cell Culture and Compression Experiments
Before the cell culture on-chip started, micro-piston devices were sterilized under UV light in a biological cabinet for 30 min. Different cell-seeding densities were tested to improve cell density on-chip and the chance of capturing cells under the micro-pistons, as described above. For the homogeneity of cell distribution on-chip and capture under micro-piston, the way of loading cells into the microchannels with those hanging structures was further optimized. Cells were introduced into the culture channels while the micro-piston was either at static state or further driven up (retracted) toward the control channel. In our piston-retracted method, the micro-pistons were retracted by applying negative pressure by 2 cm3 air sucked over 4 min using the syringe pumping system. Cells were introduced into the bottom channel, and the micro-piston was kept retracted for 5 min to let the cells sink to the PLL-coated glass surface. Then, the micro-piston was released to recover its position by applying positive (increasing) pressure. Cells were cultured in the micro-piston devices for at least 2 days, and their growth and spread around and under the micro-pistons were monitored and recorded during culture until mechanical compression was applied.
Mechanical compression was applied to cells in their growth culture media to eliminate any nonmechanical stresses such as impact of variable protein concentrations on cells. The microscopy focal plane was kept on the cells while applying the compression and during movement of the micro-piston toward the cells. Micro-piston movement, compression on cells, and mechanical lysis of the cells were recorded with time-lapse imaging. Data of the pressure sensor read were recorded during the compression experiments to monitor the pressure profile in the devices and ensure the devices were working properly. Compression was applied up to 640 mbar over 6 min. Cells were kept compressed for 1 h, and the withdraw rate applied for the position recovery of the micro-piston was the same as the compression rate. For cell viability imaging, the cells were incubated with 2 µM EthD-1 and 4 µM calcein AM solution of a cell viability/cytotoxicity kit (Invitrogen) for 20 min. After the compression experiments, cells were fixed on-chip with 4% paraformaldehyde (Alfa Aesar) for 30 min, and nuclei were stained with 1 µg/ml Hoechst solution (Thermo Scientific, 33,342) for 20 min. Cell actin was stained with CF 488 A phalloidin (Biotium, 1:40) for 1.5 h.
2.8 Green Fluorescent Protein Solution Displacement by Membrane Deflection in the Micro-Piston Device
Green fluorescent protein (GFP) was expressed in-house in E. coli bacteria. Micro-piston devices were loaded with GFP solution (6.83 mg/ml), and compression was repeated as described for the cell experiments. Thus, first, cells were cultured in the channel. Then, culture media was replaced with GFP solution for fluorescence imaging at the time of the compression. Micro-piston movement and membrane dynamics were visualized for inference of the physical state from fluorescence intensity change (Supplementary Figure S3A). Using an inverted microscope, the GFP time-lapse fluorescence images were taken under constant light exposure at 1-min intervals of the actuation by the applied pressure amounts in Supplementary Figure S3B,C. An A–A′ line was drawn at the region under the micro-piston, and the plot profile of the GFP intensity change at each time-lapse frame was shown for the A–A′ line at the applied pressures (Supplementary Figure S3B). The plot profile for the GFP intensity change under the membrane was shown along a representative line B-B’ on each frame taken at the corresponding pressure amount (Supplementary Figure S3C) similar to the work of Kim et al. on characterization of PDMS membrane deflection with fluorescein [10]. Further, ROIs were drawn at different regions adjacent to the micro-piston under the membrane. Mean gray values were measured from the GFP intensity at those ROIs on the frames taken under the pressures of 0 and 640 mbar for the ratio of the mean gray value at static state (noncompressed) to the one at the compressed form (see Supplementary Table S1). This ratio was used for further correlation of the change in GFP intensity with the change in compartmental heights of the micro-piston device during membrane deflections. At least 3 independent experiments with different devices were performed to measure fluorescent intensity change as a result of the displacement of GFP during actuation of the micro-piston in a typical cell experiment setup.
2.9 Imaging and Data Analysis
Images of cells were taken as phase-contrast time-lapse image series using a diascopic and epifluorescence inverted microscope (Nikon ECLIPSE Ts2) equipped with a digital camera (Tucsen USB2.0 H Series) and TCapture imaging software. For cell growth, alignment, and spread analyses, cells were imaged day-to-day starting from the cell seeding time using 10X (NA 0.25; Ph1 ADL) and 20X (NA 0.45; Plan-Fluor OFN22 Ph1 ADM) objectives. For dynamic cell compression experiments, data recording was started at the same time as the pumping for applying the gas pressure, and time-lapse images were captured at every 10 s. Cells in the control regions where there was no micro-piston were also imaged before and after compression application. Cell viability images for the cells under micro-piston and at control regions in the channel were taken with calcein AM and ethidium homodimer-1 (EthD-1) epifluorescence.
Recorded images were processed and analyzed using ImageJ (Fiji) [37]. For cell viability analysis, the cells under a micro-piston were determined according to the images with calcein AM and EthD-1 and cross-checked with the phase-contrast images taken before the deflection and the time-lapse frames recorded during the deflection. Calcein AM stains the live cells all over the cell membrane and cytoplasm, while EthD-1 dye stains the dead cell nuclei only. With exception of the cells with strong signals of calcein AM or EthD-1, further analysis was done as follows: If the cell body was under the micro-piston before compression, but totally burst after compression, and had no stain of calcein AM with or without traces of EthD-1, those cells were counted dead. If any cell had calcein AM signal and traces of EthD-1 signal at the same time, such cells were counted as damaged but alive, as well as the cells with traces of calcein AM and without any EthD-1 signal. Video frames recorded during deflection and retraction of the membrane were used to track the cells bursting due to compression, as well as the changes in their morphologies. In this correlation, if there are cells that do not give signal at the fluorescence images captured after compression but exist on the phase-contrast images captured before compression and during time-lapse imaging of the compression, those cells were also added to the analysis during the validation process. Cells that were detached from the culture by attaching to the micro-piston surface during compression were counted into the analysis by taking maximum intensity of the Z-projection of fluorescence images from the glass and PDMS surfaces that came into contact. Two hundred-fold magnification images of EthD-1 epi-fluorescence contained the most information for the stained nuclei of the dead cells fitting the region under micro-pistons, and were thus used in the cell viability analysis. Thus, cell viability analysis relied on cell counting by the fluorescence imaging with calcein AM and ethidium homodimer-1 (EthD-1) dyes. Nuclear staining was also convenient to cell counting with Hoechst staining for total cell nuclei and EthD-1 staining for dead cell nuclei. ImageJ (Fiji) was used for counting cells by analyzing particles function applied on the threshold images with EthD-1 and Hoechst signals, or after adjusting the threshold of the calcein AM signal. Regions of interest (ROIs) were drawn around the micro-piston, and cells that remain within that ROI were counted as under micro-piston, and the rest were counted as control as noncompressed cells all over the region adjacent to the micro-piston. All the cells in the field of view (FoV) were counted as total cells. The cell count at the region adjacent to the micro-piston was determined by the subtraction of the cell count under the micro-piston from the total cell count. The percentages of the live and dead cells were calculated according to the cell counts.
In the next set of experiments with sequential cyclic compression on cells, the cell viability state determination was slightly different than the discrete counting as live and dead cells, such that it was done comparatively as a function of the applied pressure in ascending order within the same device. Cells were categorized as live, damaged, highly damaged, and dead. For this comparative analysis, shape descriptors, such as square, triangle, line, and circle, were assigned to cell viability categories of live, damaged, highly damaged, and dead, respectively. They were drawn and tracked manually across the frames acquired at each applied pressure and determined depending on the extent to which the cells were stained with calcein AM or EthD-1, as explained above. Manual tracking for determination of the cell viability state was applied to the cells under the micro-piston only.
For the analysis of cell nuclear deformation, ImageJ (Fiji) was used to extract the regions of interest (ROIs) for the cell nuclear boundaries by analyzing particle functions applied on the threshold images with Hoechst epi-fluorescence signals. Then, the ROIs obtained from the Hoechst-stained cell nuclei were checked with the corresponding phase-contrast image for validation of the nuclei segmentation. Area, circularity, and aspect ratio of the cell nuclei were measured from the ROIs. Two hundred-fold magnification images were used during the analysis of Hoechst-stained nuclei in control (noncompressed) cells under the micro-piston and control regions (CRs) around the micro-piston vs. in compressed cells under the micro-piston.
One-way analysis of variance (ANOVA) and Student’s t-test were used to determine significances for the comparisons of cell viability between multiple groups and between two groups, respectively. Student’s t-test was also used to determine the statistical significance of cell nuclear deformations. The two-sample t-test between percents (StatPac) was used to compare the percentages of individual groups in on-chip cell distribution data. Statistical significance was taken as p
3 Results and Discussion
The phenotype of cancerous cells changes in response to applied dynamic compressive stress. Parameters such as cell growth, morphology, viability, and mechanobiologically related protein profile are all affected by mechanical stimulation and compression. Compression is unique for ovarian cancer and caused by several primary sources. Both growth-induced stress from the aberrant cell proliferation, displacing the native cell populations, and external stress, stemming from the native tissue, have been identified as noteworthy contributors to the compressive stress [26, 28]. Moreover, hydrostatic pressure by the excess fluid and ascites exposes ovarian cancer cells to additional compressive forces [38], although this factor, depending on the volume of ascitic fluid, largely varies among ovarian cancer patients. Collectively, these stresses evidence that compression has a paramount importance in shaping the mechanobiology of ovarian cancer. To study the role of compression in detail, compressive stress needs to be applied to cells in a localized, flexible, and controlled manner. The lab-on-a-chip platform introduced in this work achieves this by use of a PDMS membrane actuator with an attached micro-piston. PDMS is well-suited for mechanical actuators due to its high elasticity and the very low drift of its properties with time and temperature [39]. Our platform is composed of a control microchannel in a top layer for introducing external force and a PDMS membrane with monolithically integrated micro-pistons suspended in a bottom microchannel. This piston was used to apply mechanical compression on ovarian cancer cells cultured on the glass surface enclosing the bottom layer (Figure 1). Dynamic cell compression in this work points out the capability of the micro-piston device to dynamically compress the cells at various profiles and durations for a wide range of applications. At each application, the duration and mode of the dynamic compression were given at the associated figure and writing. Before use with cells, mechanical parameters of the device were characterized via micro-piston actuation to ensure repeatability of compression. A summary of the characterization of different compression profiles is given in Figure 3. The characterization of the micro-piston actuation was done using optical imaging methods and two different external pressure system types, adding flexibility based on the laboratory requirements. The mechanical modeling in a good agreement with the experimental data obtained from the vertical displacement measurements was used to predict the actual pressure inside the device based on the externally applied pressures. Bottom channel loading with cells and the culture of cancer cells in the micro-piston device was optimized experimentally. This was followed by the use of the device to study compression at physiologically relevant pressure levels and mechanical lysis of cells. Cell viability response was investigated at sequentially applied profiles and varying pressures in ascending order. The proven ability of our platform to simulate cyclic and varying compression profiles shows that it can be used to mimic the chronic mechanical stimuli the cells are exposed to in ovarian cancer metastasis. Detailed time-lapse live cell imaging showed the temporal evolution of the dynamic pressure control on cell compression and deformation with different pressure amounts, time length, and cyclic mode. The applicability of the cyclic compression with our platform was further demonstrated by capturing the actin and nuclear deformation in the cyclically compressed cells. Actin stress fibers showed distinct deformation in the samples with applied pressures in ascending order. While the compressed cell nuclei were changed for their circularity at different pressures, their areal and axial deformation were not permanent at milder pressures such as 12.5 and 17.9 kPa, unlike at higher pressures such as 20.7 kPa, for 1-h-long cyclic compression.
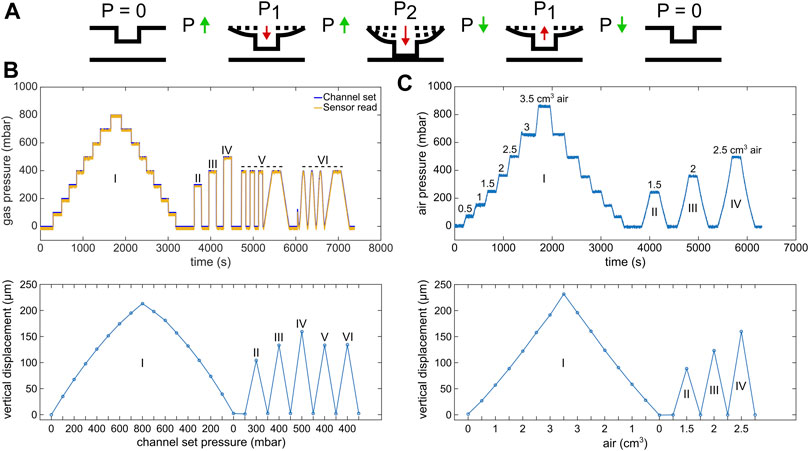
FIGURE 3. Circular micro-piston actuation using two different pressure application systems. (A) Schematic of membrane deflection and micro-piston actuation by the applied pressure. At static state of the device, there was no external pressure (p), p = 0. Vertical displacement of the membrane and micro-piston was measured, while the pressure was kept constant at p = 0, P1 or P2. Membrane and micro-piston were actuated step-by-step by positive (increasing) pressure. Then, the applied pressure was decreased in the same manner step by step, and the displacement was measured at each decreased pressure for position recovery. Green arrows indicate when the pressure increased or decreased in between the states. Red arrows indicate the direction membrane and micro-piston moved. (B) Micro-piston actuation with various pressure magnitudes and loading profiles (I–VI) for the 215-µm membrane attached to 300-µm-diameter piston, generated by the pressure controller system. In profile “I,” the pressures were positively or negatively applied step by step by 100 mbar increments, and the displacement was scanned at each step. In profiles “II,” “III,” and “IV,” the pressures were applied suddenly and the displacement was scanned for each sudden pressure amount. In profiles “V” and “VI,” cyclic compression where the membrane was deflected and retracted repeatedly was applied by an automated pressure application with (V) or without (VI) time intervals. On the pressure profile graph, “channel set” is the pressure that was set through the pressure controller of the system, while the “sensor read” is the pressure that was read through the pressure sensor connected to the gas flow into the control channel of the micro-piston device. (C) Micro-piston actuation with various air amounts leading to corresponding pressure magnitudes in the profiles I-IV for 215 µm membrane attached to 300-µm-diameter piston, generated by a syringe pumping system. In profile “I,” the pressures were positively or negatively applied step-by-step by 0.5 cm3 increments in air amount. The resulting pressures were read through the pressure sensors and the displacement was scanned at each step. In profiles “II,” “III,” and “IV,” the pressures were applied suddenly and the displacement was scanned for each sudden pressure amount.
3.1 Characterization of the Micro-Piston Actuation
Characterization of PDMS device geometries, membrane deflection, and thus micro-piston actuation was performed by 3D profilometry and confocal microscopy (Figure 2). For 3D profilometry, the devices were not covered by a glass surface to enable formation of the optical interference on PDMS surfaces. Also, no cells and media were included in the measurements. For confocal microscopy, the devices were bonded to glass, and bottom channels with micro-pistons were loaded and stained with DiD solution. The confocal measurements were performed either with or without cells and their culture media. Vertical displacement was measured as a function of applied pressure for membranes of different thicknesses. These were obtained by varying PDMS spin-coating and vacuum conditions to better understand the impact process variability may have on piston actuation and ultimately, cell compression. We found that the time length the PDMS mixture was kept under vacuum after mixing (until spin-coating) affected the thickness of the membrane, in particular when slower spin speeds were used (see Supplementary Figure S4). Membrane thickness increased observably for a spin speed of 500 rpm when the vacuum time after mixing was extended from 35 to 90 and 150 min. This effect was not observed for a higher spin speed of 1,000 rpm, even after 150 min of degassing, which indicates a correlation with the pot life (the time required for viscosity to double after mixing the base and curing agent) of Sylgard 184 being > 120 min [40]. It is also important to note that when the vacuum duration after mixing was kept as little as 25–35 min, not all of the micro-pistons could be recovered from the 200-µm-height photoresist master on a 4-inch Si wafer due to insufficient degassing time. In contrast, a 100% yield could be regularly obtained when spin-coating at more than 1-h vacuum durations from the time of mixing.
To characterize membrane deflection and micro-piston actuation, vertical displacement measurements, obtained via optical profilometry, were used to quantify the deflection of 100-, 215-, and 345-µm-thick membranes selected from the spin-coatings with thickness ranges of 102 ± 4.3, 211 ± 14.8, and 343 ± 27.4 (mean ± σ), respectively, as monolithically fabricated with 300-µm-diameter pistons (Supplementary Figure S5). The pressure applications and membrane deflections were applied by using two independent pressure systems, pressure controller system (Figures 2A,B, Supplementary Figure S5A,B) or syringe pumping system (Figures 2A,C, Supplementary Figure S5C,D). By the two application systems, the vertical displacements of the micro-pistons with thicker, 215 and 345 μm, membranes were linear compared to thinner, 100 μm, membrane with 50 mbar or 0.5 cm3 air increments up to 250 mbar applied pressure. In essence, this novel micro-piston device allows using a wide range of membrane thicknesses. However, the vertical displacement amount depends on the applied pressure magnitudes, and in a final shape of the device, it is also restricted by the gap between the micro-piston and bottom surface. Additionally, the pressure magnitudes that can be applied and sensed during the micro-piston actuation still rely on the pressure controller capability and readability of the pressure sensors in use. Thus, in design, the bottom channel total height and the micro-piston height determine the gap which also needs to suit cell culture needs. Membrane thickness to be used in the micro-piston device can be selected based on the designed gap and the range of external pressure application and precise sensing. Taking all into account, for the devices used for cancer cell compression experiments in this study, the average membrane thickness was measured as 211 ± 14.8(mean ±σ) µm (n = 164 optical profiles from 7 spin-coatings), where the PDMS was kept under vacuum at 650–700 mmHg for 1.5 h from mixing (including the 1 h while PDMS is on the photoresist master) and spun at 500 rpm for 30 s (Supplementary Figure S4). In addition to characterizing the dimensional fidelity of fabricated masters and PDMS replicas (Supplementary Table S2), compartmental heights of the assembled micro-piston devices were measured for the channel total height and micro-piston heights before the device was bonded to glass. To facilitate this, the gap between the micro-piston and bottom surface was calculated for each device by measuring the step height from the leveled surface of the sides of the channel to the surface of the suspended micro-piston in 3D optical profiles (see Supplementary Figure S2). Values of the difference between the total height and gap showed close agreement with measured micro-piston height values, illustrating the reliability of the measurements and data analysis for the characterization of the compartments of the micro-piston devices.
Next, characterization of the 215-µm-thick membrane deflection with applied higher pressures was followed by micro-piston actuation in an open device to demonstrate position recovery. Figure 3A shows the actuation sequence used to measure deflection. Pressure loading profiles were applied using either a pressure controller system (Figure 3B) or syringe pumping system (Figure 3C), and the membrane and micro-piston position were found to fully recover to the starting position within measurement limits. This demonstrates that our device can be used for automated dynamic compression and cyclic compression with a pressure controller system. Figure 3C in particular shows that if no pressurized gas supply is available or a more portable solution is required, semi-automated compression can be performed with a syringe pumping system with an almost identical membrane displacement behavior.
The concept of applying compression in a fully enclosed device was illustrated using confocal imaging of the PDMS micro-piston stained with DiD cell tracker. This stain was chosen as it allows for simultaneous imaging of PDMS structures and cells [41]. Images were taken before compression and while the micro-piston was compressed with the cell experiment settings, as shown in (Figure 2D). Staining and confocal imaging were able to visualize the micro-piston position inside the device; however, we found the process too slow to capture the dynamic compression on cells, mainly due to the large dimensions of the micro-piston compartment (Supplementary Figure S2A,B). This result is in agreement with others in the literature on confocal microscopy being slow for the real-time volumetric capture of the dynamic compression [24]. Thus, to facilitate the use of wide-field microscopy for imaging the dynamic processes in the device, membrane and micro-piston movement were monitored via the displacement of green fluorescent protein (GFP) reporter solution in the micro-piston chamber, as shown in Supplementary Figure S3. Again, the same compression profile was applied as in the cell experiment settings, and fluorescence intensity change during deflection of the membrane was recorded via time-lapse images. As illustrated by the images in Supplementary Figure S3A, micro-piston touchdown could be tracked (also see Supplementary Movie S1) and related to device areas where no GFP was present, such as chamber and channel walls. Residual fluorescence signal observed under high pressures (640–1,415 mbar, Supplementary Figure S3B) was attributed to the cells cultured on the glass surface, whereas no cells and no GFP solution were present for the background region corresponding to the PDMS sides of the channels. In Supplementary Figure S3A, the indicated PDMS sides adjacent to the microchannels were used for background measurements. While the vertical displacement of the micro-piston in the channel was controlled via the membrane, little change in the GFP signals under the micro-piston was observed for pressures above 640 mbar (Supplementary Figure 3B). Thus, at higher pressures, the micro-piston was no longer displaced vertically, and the mechanical load was being stored in the compression of the micro-piston itself. On the other hand, the flexible membrane attached to the micro-piston continued to be displaced downward as evidenced by the GFP solution volume, and hence, fluorescence signal under the membrane around the micro-piston decreases with increasing applied pressure (Supplementary Figure S3C). Up to 860 mbar, the pressure values in Supplementary Figure S3B,C, which were read in the fully enclosed devices through the sensory feedback connected within the air flow circuit, were matching the pressure values read during the membrane deflections within the open devices, where the optical profilometry was used (Figure 3C). Optical profilometry and fluorescence solution displacement data were further cross-correlated for three independent devices, as shown in Supplementary Table S1, demonstrating measurement consistency among devices and between techniques. While recording the GFP images, the focal plane was kept fixed on the cells, as would be the case in cell compression experiments. The average mean gray value ratio obtained in this way was 1.39. If the same experiments were run with images taken at different focal planes of the GFP solution for maximum intensity of a z-stack of fluorescence images, this ratio would be closer to the average height ratio of the devices, which is 1.57. Nonetheless, the data demonstrate that in lieu of ultrafast confocal imaging, fluorescent reporter displacement could be used to track piston movement in real time during cell compression experiments.
3.2 Cancer Cell Loading and Culture in Micro-Piston Device
Following mechanical characterization, cancer cell growth and cell viability on the microfluidic platform were investigated by running control and test experiments, either on separate devices or sequentially on a single device. For the optimizations of cell distribution on-chip and cell capture under micro-pistons, devices were loaded with cells either while the micro-pistons were in static state with no external pressure or driven up (retracted) toward the control channel with an applied negative pressure of 342 mbar (−342 mbar) as read by the pressure sensor (Supplementary Figure S6A). Cell capture under micro-pistons was determined to be on average 9 cells per 0.07 mm2 for piston in static-state loading and increased more than 3-fold to 28 cells per 0.07 mm2 for piston-retracted loading. Thus, due to favorable flow conditions in the piston-retracted loading method, more cells were captured under the micro-pistons. Cell distribution on-chip was further analyzed for piston-retracted loading. At zero time of the culture, 11.4% of the loaded cells per field of view (FoV) of the microscopy images were under the micro-piston of 14.4% area of the FoV adjusted with the micro-piston at the center (Supplementary Figure S6B, Supplementary Table S3). The rest of the cells, 88.6%, were around the micro-piston in the 85.6% area of the FoV. The percentages of the cell number under and around micro-piston were not significantly different than the percentages of the corresponding area (p = 0.1417). Thus, homogenous cell distributions could be obtained in the micro-piston chamber from the beginning of the cell culture. The cell number under micro-pistons increased on average 83% from Day 0 to Day 1 and 44% from Day 1 to Day 2, providing a confluent cancer cell monolayer under the micro-pistons. Thus, cells grew under and around the micro-pistons at static state of the device, regardless of the height difference by the gap between the micro-piston and bottom surface compared to rest of the channel (see Supplementary Movie S2, Supplementary Figure S6B).
The lesser gap under the micro-pistons than the total height in the rest of the culture channel (Supplementary Figure S2) may impact on nutrient supply to the cells. To account for this during mechanical stimulation experiments, cells were kept in their cell-culture growth media to prevent any relative stress that might emerge due to nutrient factors. Moreover, the heights of the cell culture channel (on average 313 µm) and the gap between the bottom of the micro-piston and the cells on the glass surface (on average 108 µm) were designed so that cells had access to nutrients in cell-culture growth media at static state by including appropriate cell channel geometries [42]. In particular, the design is expected to allow for passive diffusion of the nutrients over time. In further applications, aim-specific biomolecular gradients can be created from the ports of the bottom layer of the device toward the micro-piston inside the culture channel to study the effect of the generated gradients on cells [43].
As shown in Figure 4A, in static culture conditions, cell viability was found to be 99.3% in the culture channels, 99.2% in chambers for cells adjacent to the micro-pistons, and 99.5% for those under the suspended micro-pistons. These results demonstrate that the device has a cell-safe design, and operation until cells under the micro-pistons are compressed by application of high pressures (>300 mbar) to the control layer.
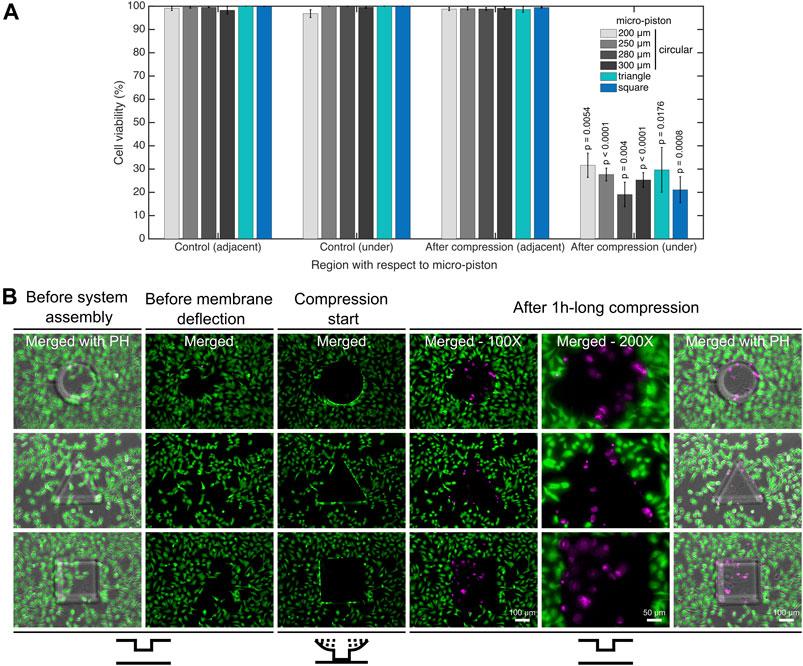
FIGURE 4. Cell viability for mechanical compression and lysis. (A) Cell viability decreased from on average 99.4% to 25.8% under the micro-pistons of 200, 250, 280, and 300 µm diameter circular, triangle, and square shapes (1 h compression, 640 mbar) compared to noncompressed (control) devices (n = 25 devices at static state (noncompressed); n = 25 devices with dynamic compression). The cells within the periphery of the micro-piston, which had part of their body under the micro-piston area, were counted into the group of “under the micro-piston”. All other cells in the field of view (FoV), outside of the micro-piston periphery, were counted as “adjacent to micro-piston”. (B) Dynamic compression on SKOV-3 cancer cells, mechanical cell lysis and an illustration for patterning the cell monolayer by stamping the particular shape of the micro-piston as circular, triangle or square. Cells and their viability were monitored before the device was connected to the pressure supply unit of the compression system (1st column); before membrane deflection (2nd column); when membrane was deflected and compression started at 640 mbar (3rd column); after 1-h-long compression was applied with different shapes of micro-pistons on SKOV-3 cells and micro-piston position was recovered (4–6th columns). After system assembly, and before membrane deflection and compression were started, the cell viability solution was replaced with cell culture media. Live cells retained their calcein AM signal since the dye entered the cells and was hydrolyzed inside. Once the compression was complete and the micro-piston was retracted to its initial position, the cell culture chamber was reloaded with cell viability solution for staining the dead cells. Live cells (green) and dead cells (magenta) were imaged with calcein AM and ethidium homodimer-1 (EthD-1) epi-fluorescence and merged with phase-contrast images. Merged: merged form of the calcein AM and EthD-1 epi-fluorescence images; merged with PH: merged form of the epi-fluorescence images with the corresponding phase-contrast (PH) image.
3.3 Compression Application and Mechanical Deformation and Lysis of the Cells
Dynamic application of compression on cell monolayers was demonstrated by deforming and lysing the cells under the micro-pistons and comparing cell viability to control areas on the same device. Cell viability was analyzed for control (noncompressed) devices and after compression with various micro-piston shapes and dimensions. An example of a typical cell compression experiment is shown in Supplementary Movie S3, where a cell monolayer was first compressed and the micro-piston then retracted. All pressure values during the compression were recorded using a pressure sensor located within the flow circuit before the gas flows into the control microchannel to monitor the micro-piston position feedback in response to the applied pressure. Sensor readings for the micro-pistons were consistent with each other over the length of the experiments, and all micro-pistons, including different diameters and different shapes, exhibited reliable position recovery in cell experiments (see Supplementary Figure S7).
For in-depth analysis of cell viability on-chip, a calcein AM/EthD-1 cell viability/cytotoxicity kit was used to monitor all the viable and dead cells. Figure 4B shows the dynamic compression on SKOV-3 cancer cells and mechanical lysis by the stained cell monolayers in control (noncompressed or before compression) and compressed areas under micro-pistons of different shapes. When the membrane was deflected and the micro-piston moved down onto the cells and burst them by compression, majority of the cells lost their calcein AM at the beginning of the 1-h-long compression. Efflux of calcein AM shows that those cells were highly damaged as no fluorescence signal was gained and hence could not be accepted as viable anymore. The main reason the micro-piston was kept compressed for 1 h is to show how good the device is in operation of the long mechanical compressions, which was also recorded by the pressure sensor in these cell compression experiments (Supplementary Figure S7). Cell counting for cell viability analysis on-chip was achieved by optimizing a method of fluorescent label–dependent automated cell counting for adherent cells by dead cell and total cell nuclear staining with ethidium homodimer-1 (EthD-1) and Hoechst dyes, respectively (Supplementary Figure S8A). Although cell counting was achieved in parallel with viability testing, by staining both live and dead cells and adjusting the threshold on the images for calcein AM and EthD-1 signals, respectively (Supplementary Figure S8B), this was further automated by counting the adherent cells via their stained nuclei after validating the correct segmentation of the nuclei.
As shown in Figure 4A, in all groups, including control and after compression, cell viability in the channel was calculated for the regions adjacent and under the micro-piston. In doing so, no significant differences in cell viability were observed in control devices between the groups adjacent and under micro-pistons. Additionally, in the regions adjacent to the micro-pistons, no significant difference in cell viability in control (noncompressed) and after compression was observed. However, after compression, the cell viability under micro-pistons became significantly different (p
Although the cell viability dyes are considered nontoxic at the low concentrations used [44], we also performed experiments to control for any possible effect of live/dead cell staining and phototoxicity might have besides the mechanical compression. To do so, we compressed the cells after staining them with cell viability dyes and checked the viability during the dynamic compression experiments (see Figure 4B), while on the other hand, we directly compressed nonstained cells and checked for the viability after the compression (see Supplementary Figures S9, S10). Results showed that at 2 µM calcein AM and 4 µM EthD-1 concentrations, there was no significant effect of the dyes on the cells which were also treated with the mechanical compression (p
Furthermore, we computationally modeled the actuation of the micro-piston device, where we established a good agreement of the simulations with the experimental data obtained from the vertical displacement measurements of the micro-piston with a pressure controller and syringe pump systems (Figure 5A). This model guided us on predicting the actual pressures inside the device based on the externally applied pressures (Figure 5B). We experimentally conducted dynamic cell compression to establish to which extend cells were affected by the amount of applied pressure and the application time. For this, we applied a sequence of cyclic compression profiles on SKOV-3 cancer cells at mild and then higher pressures in a continuous manner (Figure 6, Supplementary Movie S4). The pressure controller system was used for automation of this cyclic compression application. First, a pressure amount ladder was formed up to 354 mbar, during which the cells showed distinct deformation. Subsequently, cells were set to being chronically compressed for 5 min at 354 mbar, followed by a rest for 5 min at 0 mbar, as indicated by the steps “1 b–i, 2 b–h” in Figure 6A. This cyclic compression was applied for a total of 1 h. As can be seen from the image sequence in Figure 6A, cells were physically deformed under the micro-piston when being cyclically compressed throughout the cycles “1a–i” (cells at rest) and “2a–h” (cells compressed) (also see Supplementary Movie S4). The morphology of the compressed cells changed in response to micro-piston contact, with the nuclei and membrane expansion observably different to that of the state before compression at “1a” of Figure 6A. In the following compression profiles shown in Figure 6B, the application was continued with increasing pressures from 370 to 400, to 640 mbar, respectively. Cells were compressed for up to 2 min at each of the higher pressures, which was much shorter than the compression times used in Figure 4. Cell lysis formed at higher pressures, as expected (see Supplementary Movie S4), and cell viability was monitored 10–15 min after every pressure application profile was complete, allowing for an incubation time for the viability assay. Results shown in “1i” of Figure 6A and “1j–l” in Figure 6B demonstrate that cells were mostly alive after the first cyclic compression profile was complete (“1i”), despite being deformed distinctly throughout the 1-h-long cyclic compression. Simulation of the mechanical actuation (see Figure 5B, Supplementary Figure S11, Supplementary Movie S5) indicated that an actuation with 354 mbar gas pressure corresponded to a contact pressure of 15.6 kPa. While the gap of 109 µm between the piston and glass surface was closing, piston contact pressure started at 1.4 kPa by the applied pressure of 325.9 mbar. In next two of additional 1 mbar, it reached physiological values of 3.6 and 4.5 kPa, and then, the piston distinctly deformed cells at 15.6 kPa (Figure 5B). This value fell within the physiological ranges estimated for growth-induced (4.7–18.9 kPa) and external (3.7–16.0 kPa) compression [28]. The latter has been suggested to be a more noteworthy contributor to the total perceived stress [26] and estimated to exceed 20 kPa based on the experimental data from murine tumors [28]. Following this cycle, more cells were permanently damaged, appearing as dead after step “1j” at 370 mbar (contact pressure of 23.8 kPa from simulation in Figure 5B). Other cells with traces of calcein AM but no trace of EthD-1 was considered as damaged but alive, while the cells with traces of the both stains were considered as highly damaged. After step “1k” at 400 mbar (contact pressure of 37.8 kPa from simulation in Figure 5B), only few cells remained alive, with the rest dead. These results were expected as this and following pressure levels exceeded the upper limits of both estimated growth-induced and external stresses. Finally, apart from a few cells at the micro-piston periphery, all cells directly underneath were dead after step “1l” at 640 mbar (contact pressure of 140 kPa from simulation in Figure 5B). These viability results for short compression times at higher pressures complement results of the 1-h-long compression at 640 mbar in Figure 4. As observed for this overall long compression experiment, cells in control regions around the micro-piston remained alive at all times during application of the cyclic compression profiles (Figure 6). Responses of the cells under the micro-piston to varying applied pressures in ascending order from Mild (15.6–15.9 kPa) to Intermediate 1 (23.8–26.8 kPa) to Intermediate 2 (37.8–51 kPa) to Severe (127.8–140 kPa) are summarized in Figure 7. Additionally, the vertical displacement from the position that the piston applied mild pressures on cells until severe pressures bursting the cells, as shown in the plateau of the main plot in Figure 5B, is matching the height of the SKOV-3 cells, which is typically extending to around 3 µm [46]. Overall, the ability of our platform to simulate cyclic and varying compression profiles shows that it can be used to further mimic the chronic mechanical stimuli the cells are exposed to in ovarian cancer metastasis [26].
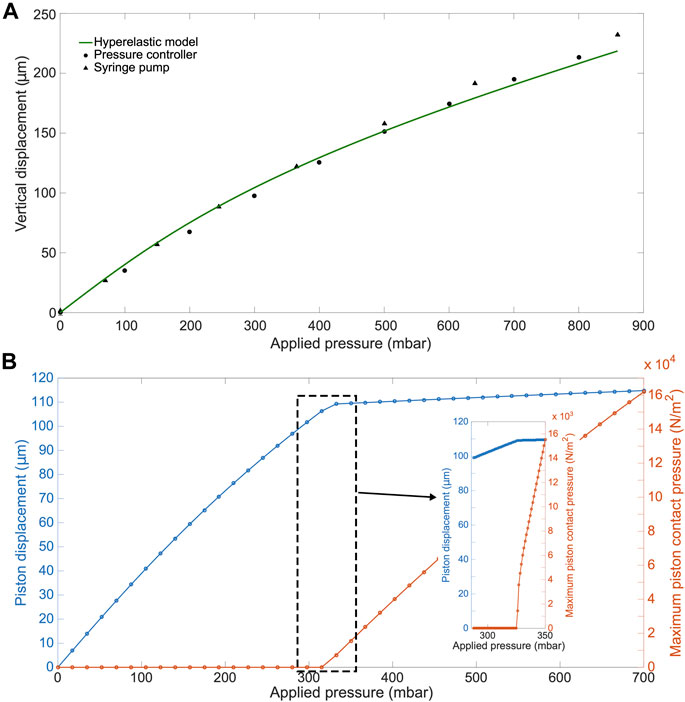
FIGURE 5. COMSOL simulation results for the actuation of the micro-piston device. (A) Experimental (•,
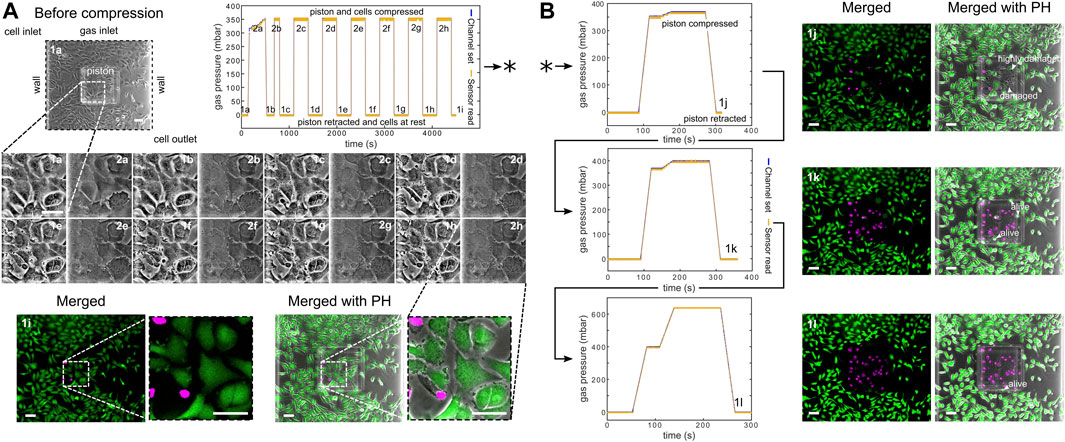
FIGURE 6. Continuous sequence of cyclic compression profiles applied to a monolayer of SKOV-3 cancer cells in a continuous manner. (A) Before compression image of the cells corresponds to step “1a” of the cyclic compression. In the first pressure profile, at step “2a,” a pressure amount ladder was formed up to 354 mbar, during which cells showed distinct deformation. Subsequently, cells were chronically compressed for 5 min at 354 mbar and then rested for 5 min at 0 mbar (1b-i, 2b-h). This cyclic compression was applied for 1 h. The close-up image sequence shows example cell shapes/deformations under the micro-piston, while cells were compressed/rested throughout the cycles, with steps “1a-i” and “2a-h” corresponding to cells at rest and cells compressed, respectively. Cell viability was monitored 10–15 min after the pressure application profile was completed (1i). Live cells (green) and dead cells (magenta) were imaged with calcein AM and ethidium homodimer-1 (EthD-1) epi-fluorescence, respectively, and merged with phase-contrast images. (B) Continuation (*) of the pressure application, with pressure increased to 370, 400, and 640 mbar, respectively. Cells were compressed for up to 2 min at each higher pressure. Arrow heads (in white) show the representative cells for viability state and cell damage as a result of gradually increasing compression during each corresponding pressure profile (all scale bars 100 µm). Merged: merged form of the calcein AM and EthD-1 epi-fluorescence images; merged with PH: merged form of the epi-fluorescence images with the corresponding phase-contrast (PH) image.
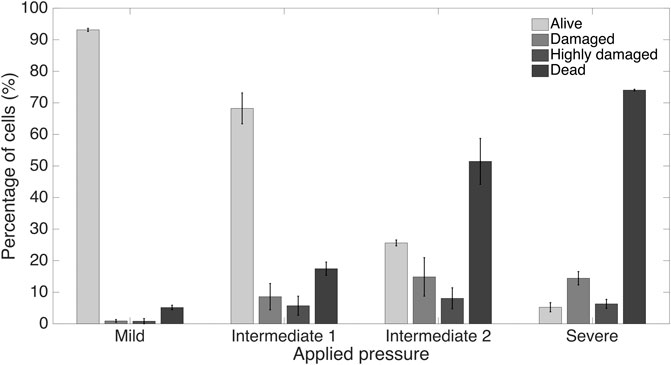
FIGURE 7. Summary of cancer cell response under the micro-piston to varying applied pressures in ascending order from Mild (15.6–15.9 kPa) to Intermediate 1 (23.8–26.8 kPa) to Intermediate 2 (37.8–51 kPa) to Severe (127.8–140 kPa) out of at least 3 independent experiments of cyclic compression using micro-piston devices which were operated at a continuous manner of the applied pressure sequence.
We further showed the applicability of the cyclic compression with our platform by capturing the actin and nuclear deformation in the cyclically compressed cells. In contrast to the control group, actin stress fibers showed distinct deformation in the samples with applied pressures in ascending order. At 20.7 kPa (an upper limit of physiological range), the signal for actin was gained mostly at the edge of the cells, indicating exposure to a higher stress that distinctly deformed the cell cytoskeleton. Given the more regular shape of nuclei, further analysis was conducted for cell nuclear deformations. Areal and axial cell nuclear deformation after 1-h-long cyclic compression at 20.7 kPa at live cell conditions were significant between the compressed cells under micro-piston and noncompressed cells under the control micro-piston and in the control region adjacent to the micro-piston (Figure 8). No significant change was observed between the compressed and control cells at 12.5 kPa (a mild physiological value) and at 17.9 kPa (an intermediate physiological value) for areal and axial cell nuclear deformation (Figures 8B,D). Circularity of the cell nuclei however was significantly less in the compressed cells at all the applied pressures (12.5, 17.9 and 20.7 kPa) than in the control group (Figure 8C). These results propose that while the compressed cell nuclei were changed for their circularity at different pressures, their areal and axial deformation were not permanent at milder pressures such as 12.5 and 17.9 kPa, unlike at higher pressures such as 20.7 kPa, for 1-h-long cyclic compression. The nucleus is a mechanosensitive organelle capable of responding to solid stresses, and the nuclear deformations we observed for the cells exposed to compression can impact the activity of nuclear pore complexes and associated proteins, which in turn modulate the nuclear import of transcription factors. Such nuclear perturbations can alter gene expression and induction of DNA repair programs [47]. A detailed time-lapse live cell imaging of the compression recorded for a ladder pressure increase from 0 up to 17.9 kPa (piston contact pressure from simulation) and a short cycle at 17.9 kPa with a gradual increase (from 0 to 17.9 kPa) and decrease (from 17.9 to 0 kPa) in 30 s for each, which then sequentially followed by 1-h-long cyclic compression at 17.9 kPa, showed the temporal evolution of the dynamic pressure control on cell compression and deformation (see Supplementary Movie S6). This dynamic control points that although the deformed cells did not seem much affected at the very first cycles by the beginning of the pressure ladder and mild compression, the time length and number of the cycles of the dynamic compression made the cells morphologically different throughout the application. The cell actin and nuclear deformations explained here were as a result of the end point assay by such dynamic compression control at the indicated pressures. Our study findings add to the results on plastic deformation of the cells by Ho et al. who applied cyclic compression between 10 and 15 psi (68.9 and 103.4 kPa) by the pressure of the control valve at 0.5 Hz for 6 min and did not observe permanent plastic deformation of the MCF10A normal breast epithelial cells [21]. Different pressure amounts, time length, and cyclic mode altogether affect the degree of plastic deformation cells can experience when exposed to compression.
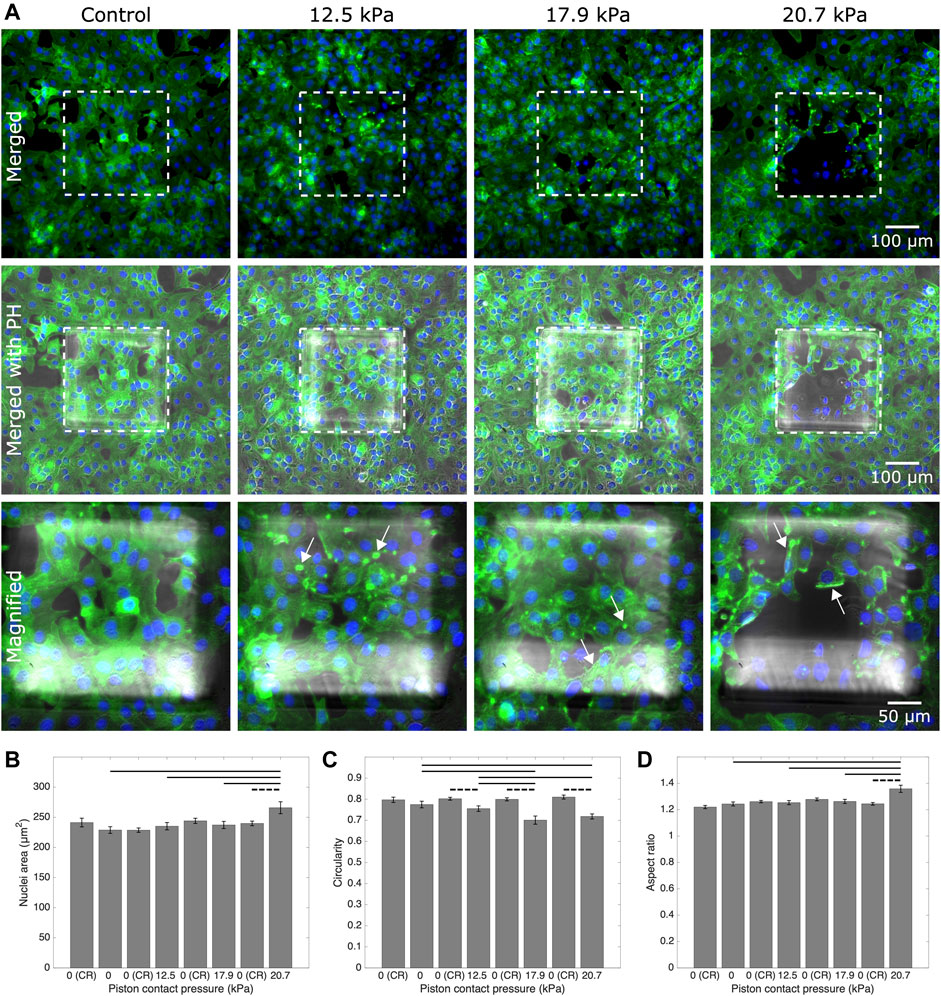
FIGURE 8. Representative fluorescent microscopy images and analysis for actin and nuclei of cancer cells which experienced 1-h-long cyclic compression in the micro-piston device. (A) Control and compressed cell groups stained for actin (green) and nuclei (blue). Dashed areas are under the micro-piston, while the surrounding is the control region (CR). Merged: merged form of the phalloidin (stain for actin) and Hoechst (stain for nuclei) epi-fluorescence images; merged with PH: merged form of the epi-fluorescence images with the corresponding phase-contrast (PH) image; magnified: two hundred-fold magnification images of the region under micro-piston indicated with the dashed area in the row of “merged with PH.” Representative arrows (white) show the distinct actin deformation by the increased fluorescence signals at the edges of the cells in the compressed groups under the micro-piston. Nuclear deformation in control (noncompressed) cells under the static micro-piston and control region (CR) around the micro-piston vs. in compressed cells under the micro-piston measured for area (B), circularity (C), and aspect ratio (D) of the cell nuclei (mean
In summary, the platform was able to dynamically compress cell monolayers up to the mechanical lysis of cells at actuation pressures above 300 mbar. By enabling similar experiments to be performed in a more integrated fashion, our study results add to the previous work by Tse et al., which showed that mechanical compression can enhance the invasive phenotype of cancer cells and stimulate their migration [5]. While pressure magnitudes obtainable with our system are comparable to those in work by Kim et al., who applied up to 35 kPa external compressive stress on MCF7 cancer cells up to lysis [10]; the use of micro-pistons for compression in our system adds the advantage of noncompressed regions for direct control on-chip. The importance of control was most recently demonstrated by Lee et al., who observed no significant difference in cell viability between compressed and control groups when 14 kPa of pressure was used to mechanically stimulate alginate–chondrocyte constructs [24]. We further showed the capability of the platform to dynamically stimulate cancer cell monolayers with various intermediate actuation pressures in a continuous, cyclic manner with an order of Mild (15.6–15.9 kPa) to Intermediate 1 (23.8–26.8 kPa) to Intermediate 2 (37.8–51 kPa) to Severe (127.8–140 kPa). As such, the results shown here expand on the work by Hosmane et al., who used intermediate pressures applied statically by micro-pads to study the mechanics of neuronal cell damage [23]. Their results showed single axon mild injury and regrowth at <55 kPa, moderate levels of injury from 55 to 95 kPa, and severe levels of injury for pressures >95 kPa.
Finally, while cell compression with our micro-piston device was shown using an ovarian cancer cell monolayer mimicking the impact of compression on direct extension of cells into peritoneal cavity in a metastatic dissemination of epithelial ovarian cancer, the overall device concept can readily be adapted for use with cell-laden hydrogels or by loading a spheroid solution for compression of cells in 3D. The device can be further used in its current form to apply external compression on an endothelial cell monolayer to study the basics of the vessel compression existing in cancer patients, as shown in ex vivo tumor sections [28, 48]. In the future, we hope to expand this work to the extended tumor microenvironment including stromal cells, such as fibroblasts and macrophages. These have been reported as sensitive to compressive forces, for example, fibroblast-to-myofibroblast differentiation, and there are known biochemical interactions between cancer cells and stromal cells, which might be triggered by the solid stress in the microenvironment [4].
4 Conclusion
We have introduced a flexible multilayer microdevice with a micro-piston suspended into the cell culture chamber for dynamic mechanical cell stimulation and compression. Fabrication of the device was described, and actuation by a monolithic membrane controlled by a gas channel on the top layer was demonstrated. We showed the characterization of the micro-piston actuation using optical imaging methods and two different external pressure system types, adding flexibility based on the laboratory requirements. The actual pressures inside the cell channel were computationally modeled based on the applied pressures and device dimensions. Hence, our device is optimized to apply a whole range of physiological pressure levels, as well as milder and severe pressures. Applicability of the device was demonstrated via the quantification of the response of ovarian cancer cell monolayers to mechanical stimulation in the micro-piston device. Cell viability before and after mechanical compression was used to illustrate the suitability of the platform for cyclic cell compression and lysis. Circular, square, and triangular micro-piston outlines and different diameters were successfully propagated into the cell layer. Using different micro-pistons, the results by cell viability response suggest that our cell stimulation and compression application rely on the membrane thickness and externally applied pressure amount; thus, it is repeatable for a desired geometry of the actuator. The proven ability of our platform to apply cyclic and varying compression profiles sequentially shows that it can be used to mimic the chronic mechanical stimuli the cells are exposed to in ovarian cancer metastasis. Detailed time-lapse live cell imaging showed the temporal evolution of the dynamic pressure control on cell compression and deformation with different pressure amounts, time length, and cyclic mode. The applicability of the cyclic compression with our platform was further demonstrated by capturing the actin and nuclear deformation in the cyclically compressed cells. Actin stress fibers showed distinct deformation in the samples with applied pressures in ascending order. While the compressed cell nuclei were changed for their circularity at different pressures, their areal and axial deformation were not permanent at milder pressures compared to higher pressures for 1-h-long cyclic compression.
Based on current studies and future perspectives, our platform provides a useful mechanical tool to study the direct effect of compressive forces on cancer cells and the tumor microenvironment. It can be used to investigate responses of cancerous and healthy cells to applied stress with regard to changes in cell morphology, viability, and mechanobiologically related protein profile. Surface-coating solutions of natural ECM such as fibronectin, laminin, or type 1 collagen can be used to enhance cell adhesion to the culture surface in the microchannels by mimicking the native microenvironments. The platform is potentially suitable for automated creation of wound healing assays on-chip as the spacing between the micro-piston and cell culture surface, together with the cell number captured under the micro-piston, can be tightly controlled. Having different micro-piston shapes available will also be of interest in this application and in tissue engineering in general. Overall, our platform constitutes a promising tool for studies of cell–mechanical force interaction, as well as cell–cell, cell–microenvironment, and cell–drug interactions, where single or cocultured cell types need to be patterned and controlled.
Data Availability Statement
The raw data supporting the conclusions of this article will be made available by the authors, without undue reservation.
Author Contributions
SO conceived the study, designed and fabricated the device, carried out experiments, analyzed data, prepared figures, and wrote the manuscript. MA co-supervised the study and reviewed the manuscript. VN conceived and supervised the study, acquired funding, ran simulations, edited figures, and wrote the manuscript.
Funding
The work was financially supported by the MacDiarmid Institute for Advanced Materials and Nanotechnology and the Biomolecular Interaction Centre.
Conflict of Interest
The authors declare that the research was conducted in the absence of any commercial or financial relationships that could be construed as a potential conflict of interest.
Acknowledgments
We thank Helen Devereux, Gary Turner, and Nicole Lauren-Manuera for technical assistance. We also thank Serena Watkin for gifting the green fluorescent protein (GFP) solution used, James Davies for measurement of GFP concentration, and Mathieu Sellier for help with COMSOL.
Supplementary Material
The Supplementary Material for this article can be found online at: https://www.frontiersin.org/articles/10.3389/fphy.2021.654918/full#supplementary-material
References
1. Bissell MJ, Hines WC. Why Don’t We Get More Cancer? A Proposed Role of the Microenvironment in Restraining Cancer Progression. Nat Med (2011) 17:320. doi:10.1038/nm.2328
2. Levental KR, Yu H, Kass L, Lakins JN, Egeblad M, Erler JT, et al. Matrix Crosslinking Forces Tumor Progression by Enhancing Integrin Signaling. Cell (2009) 139:891–906. doi:10.1016/j.cell.2009.10.027
3. Mehlen P, Puisieux A. Metastasis: a Question of Life or Death. Nat Rev Cancer (2006) 6:449–58. doi:10.1038/nrc1886
4. Shieh AC. Biomechanical Forces Shape the Tumor Microenvironment. Ann Biomed Eng (2011) 39:1379–89. doi:10.1007/s10439-011-0252-2
5. Tse JM, Cheng G, Tyrrell JA, Wilcox-Adelman SA, Boucher Y, Jain RK, et al. Mechanical Compression Drives Cancer Cells toward Invasive Phenotype. Proc Natl Acad Sci (2012) 109:911–6. doi:10.1073/pnas.1118910109
6. Polacheck WJ, Li R, Uzel SG, Kamm RD. Microfluidic Platforms for Mechanobiology. Lab Chip (2013) 13:2252–67. doi:10.1039/c3lc41393d
7. Wang K, Cai L-H, Lan B, Fredberg JJ. Hidden in the Mist No More: Physical Force in Cell Biology. Nat Methods (2016) 13:124. doi:10.1038/nmeth.3744
8. Evans JJ, Alkaisi MM, Sykes PH. Tumour Initiation: a Discussion on Evidence for a “Load-trigger” Mechanism. Cel Biochem Biophys (2019) 77:293–308. doi:10.1007/s12013-019-00888-z
9. Kalli M, Minia A, Pliaka V, Fotis C, Alexopoulos LG, Stylianopoulos T. Solid Stress-Induced Migration Is Mediated by Gdf15 through Akt Pathway Activation in Pancreatic Cancer Cells. Sci Rep (2019a) 9:978. doi:10.1038/s41598-018-37425-6
10. Kim YC, Kang JH, Park S-J, Yoon E-S, Park J-K. Microfluidic Biomechanical Device for Compressive Cell Stimulation and Lysis. Sens Actuators B (2007) 128:108–16. doi:10.1016/j.snb.2007.05.050
11. Cheng G, Tse J, Jain RK, Munn LL. Micro-environmental Mechanical Stress Controls Tumor Spheroid Size and Morphology by Suppressing Proliferation and Inducing Apoptosis in Cancer Cells. PLoS One (2009) 4:e4632. doi:10.1371/journal.pone.0004632
12. Takao S, Taya M, Chiew C. Mechanical Stress-Induced Cell Death in Breast Cancer Cells. Biol Open (2019) 8:bio043133. doi:10.1242/bio.043133
13. Kalli M, Voutouri C, Minia A, Pliaka V, Fotis C, Alexopoulos LG, et al. Mechanical Compression Regulates Brain Cancer Cell Migration through Mek1/erk1 Pathway Activation and Gdf15 Expression. Front Oncol (2019b) 9:992. doi:10.3389/fonc.2019.00992
14. Kim BG, Gao M-Q, Kang S, Choi YP, Lee JH, Kim JE, et al. Mechanical Compression Induces Vegfa Overexpression in Breast Cancer via Dnmt3a-dependent Mir-9 Downregulation. Cel Death Dis (2017) 8:e2646. doi:10.1038/cddis.2017.73
15. Chen Q, Yang D, Zong H, Zhu L, Wang L, Wang X, et al. Growth-induced Stress Enhances Epithelial-Mesenchymal Transition Induced by Il-6 in Clear Cell Renal Cell Carcinoma via the Akt/gsk-3β/β-Catenin Signaling Pathway. Oncogenesis (2017) 6:e375. doi:10.1038/oncsis.2017.74
16. Luo M, Ho KK, Tong Z, Deng L, Liu AP. Compressive Stress Enhances Invasive Phenotype of Cancer Cells via Piezo1 Activation. bioRxiv (2019) 51, 3218. doi:10.1101/513218
17. Novak CM, Horst EN, Lin E, Mehta G. Compressive Stimulation Enhances Ovarian Cancer Proliferation, Invasion, Chemoresistance, and Mechanotransduction via Cdc42 in a 3d Bioreactor. Cancers (2020) 12:1521. doi:10.3390/cancers12061521
18. Kim BG, Sung JS, Jang Y, Cha YJ, Kang S, Han HH, et al. Compression-induced Expression of Glycolysis Genes in Cafs Correlates with Emt and Angiogenesis Gene Expression in Breast Cancer. Commun Biol (2019) 2:313. doi:10.1038/s42003-019-0553-9
19. Li Y, Mao AS, Seo BR, Zhao X, Gupta SK, Chen M, et al. Compression-induced Dedifferentiation of Adipocytes Promotes Tumor Progression. Sci Adv (2020) 6:eaax5611. doi:10.1126/sciadv.aax5611
20. Paggi CA, Venzac B, Karperien M, Leijten JCH, Le Gac S. Monolithic Microfluidic Platform for Exerting Gradients of Compression on Cell-Laden Hydrogels, and Application to a Model of the Articular Cartilage. Sens Actuators B (2020) 315:127917. doi:10.1016/j.snb.2020.127917
21. Ho KK, Wang Y-L, Wu J, Liu A. Advanced Microfluidic Device Designed for Cyclic Compression of Single Adherent Cells. Front Bioeng Biotechnol (2018) 6:148. doi:10.3389/fbioe.2018.00148
22. Kalli M, Papageorgis P, Gkretsi V, Stylianopoulos T. Solid Stress Facilitates Fibroblasts Activation to Promote Pancreatic Cancer Cell Migration. Ann Biomed Eng (2018) 46:657–69. doi:10.1007/s10439-018-1997-7
23. Hosmane S, Fournier A, Wright R, Rajbhandari L, Siddique R, Yang IH, et al. Valve-based Microfluidic Compression Platform: Single Axon Injury and Regrowth. Lab Chip (2011) 11:3888–95. doi:10.1039/c1lc20549h
24. Lee D, Erickson A, You T, Dudley AT, Ryu S. Pneumatic Microfluidic Cell Compression Device for High-Throughput Study of Chondrocyte Mechanobiology. Lab Chip (2018) 18:2077–86. doi:10.1039/C8LC00320C
25. Asem M, Young A, Oyama C, ClaureDeLaZerda A, Liu Y, Ravosa MJ, et al. Ascites-induced Compression Alters the Peritoneal Microenvironment and Promotes Metastatic Success in Ovarian Cancer. Sci Rep (2020) 10:1–14. doi:10.1038/s41598-020-68639-2
26. Bregenzer ME, Horst EN, Mehta P, Novak CM, Repetto T, Mehta G. The Role of Cancer Stem Cells and Mechanical Forces in Ovarian Cancer Metastasis. Cancers (2019) 11:1008. doi:10.3390/cancers11071008
27. Klymenko Y, Wates RB, Weiss-Bilka H, Lombard R, Liu Y, Campbell L, et al. Modeling the Effect of Ascites-Induced Compression on Ovarian Cancer Multicellular Aggregates. Dis Models Mech (2018) 11:dmm034199. doi:10.1242/dmm.034199
28. Jain RK, Martin JD, Stylianopoulos T. The Role of Mechanical Forces in Tumor Growth and Therapy. Annu Rev Biomed Eng (2014) 16:321–46. doi:10.1146/annurev-bioeng-071813-105259
29. Hsieh HY, Camci-Unal G, Huang TW, Liao R, Chen TJ, Paul A, et al. Gradient Static-Strain Stimulation in a Microfluidic Chip for 3d Cellular Alignment. Lab Chip (2014) 14:482–93. doi:10.1039/c3lc50884f
30. Delarue M, Montel F, Vignjevic D, Prost J, Joanny J-F, Cappello G. Compressive Stress Inhibits Proliferation in Tumor Spheroids through a Volume Limitation. Biophysical J (2014) 107:1821–8. doi:10.1016/j.bpj.2014.08.031
31. Onal S, Alkaisi MM, Nock V. A Microfluidic Platform for Applying Localized and Dynamically-Controlled Compression on Cancer Cells. Proc 23rd Int Conf Miniaturized Syst Chem Life Sci (MicroTAS 2019) (2019) 28:638–9. doi:10.1158/1538-7445.tim2013-a47
32. Unger MA, Chou H-P, Thorsen T, Scherer A, Quake SR. Monolithic Microfabricated Valves and Pumps by Multilayer Soft Lithography. Science (2000) 288:113–6. doi:10.1126/science.288.5463.113
33. Sun Y, Tayagui A, Garrill A, Nock V. Fabrication of In-Channel High-Aspect Ratio Sensing Pillars for Protrusive Force Measurements on Fungi and Oomycetes. J Microelectromechanical Syst (2018) 27:827–35. doi:10.1109/JMEMS.2018.2862863
34. Jo B-H, Van Lerberghe LM, Motsegood KM, Beebe DJ. Three-dimensional Micro-channel Fabrication in Polydimethylsiloxane (Pdms) Elastomer. J Microelectromechanical Syst (2000) 9:76–81. doi:10.1109/84.825780
35. Qin D, Xia Y, Whitesides GM. Soft Lithography for Micro-and Nanoscale Patterning. Nat Protoc (2010) 5:491–502. doi:10.1038/nprot.2009.234
36. Li W, Yu M, Sun J, Mochizuki K, Chen S, Zheng H, et al. Crack Engineering for the Construction of Arbitrary Hierarchical Architectures. Proc Natl Acad Sci (2019) 116:23909–14. doi:10.1073/pnas.1915332116
37. Schindelin J, Arganda-Carreras I, Frise E, Kaynig V, Longair M, Pietzsch T, et al. Fiji: an Open-Source Platform for Biological-Image Analysis. Nat Methods (2012) 9:676–82. doi:10.1038/nmeth.2019
38. Netti PA, Berk DA, Swartz MA, Grodzinsky AJ, Jain RK. Role of Extracellular Matrix Assembly in Interstitial Transport in Solid Tumors. Cancer Res (2000) 60:2497–503. doi:10.1016/b978-0-12-775170-2.50007-x
39. Schneider F, Fellner T, Wilde J, Wallrabe U. Mechanical Properties of Silicones for Mems. J Micromechanics Microengineering (2008) 18:065008. doi:10.1088/0960-1317/18/6/065008
41. Kajzar A, Cesa C, Kirchgessner N, Hoffmann B, Merkel R. Toward Physiological Conditions for Cell Analyses: Forces of Heart Muscle Cells Suspended between Elastic Micropillars. Biophysical J (2008) 94:1854–66. doi:10.1529/biophysj.107.115766
42. Young EW, Beebe DJ. Fundamentals of Microfluidic Cell Culture in Controlled Microenvironments. Chem Soc Rev (2010) 39:1036–48. doi:10.1039/b909900j
43. Keenan TM, Folch A. Biomolecular Gradients in Cell Culture Systems. Lab Chip (2008) 8:34–57. doi:10.1039/B711887B
44. Probes IM. Live/dead Viability/cytotoxicity Kit for Mammalian Cells. Prod Inf Catalog number: MP (2005) 3224:1–7. doi:10.1038/protex.2018.063
45. Shehadul Islam M, Aryasomayajula A, Selvaganapathy PR. A Review on Macroscale and Microscale Cell Lysis Methods. Micromachines (2017) 8:83. doi:10.3390/mi8030083
46. Mann CJ, Yu L, Lo C-M, Kim MK. High-resolution Quantitative Phase-Contrast Microscopy by Digital Holography. Opt Express (2005) 13:8693–8. doi:10.1364/OPEX.13.008693
47. Nia HT, Munn LL, Jain RK. Physical Traits of Cancer. Science (2020) 370:eaaz0868. doi:10.3410/f.738942894.793581819
Keywords: microfluidics, mechanical actuation, polydimethylsiloxane micropiston, cell compression, cancer biomechanics, SKOV-3
Citation: Onal S, Alkaisi MM and Nock V (2021) A Flexible Microdevice for Mechanical Cell Stimulation and Compression in Microfluidic Settings. Front. Phys. 9:654918. doi: 10.3389/fphy.2021.654918
Received: 27 January 2021; Accepted: 03 May 2021;
Published: 25 May 2021.
Edited by:
Francisco Monroy, Complutense University of Madrid, SpainReviewed by:
Sangjin Ryu, University of Nebraska-Lincoln, United StatesAurora Hernandez-Machado, University of Barcelona, Spain
Copyright © 2021 Onal, Alkaisi and Nock. This is an open-access article distributed under the terms of the Creative Commons Attribution License (CC BY). The use, distribution or reproduction in other forums is permitted, provided the original author(s) and the copyright owner(s) are credited and that the original publication in this journal is cited, in accordance with accepted academic practice. No use, distribution or reproduction is permitted which does not comply with these terms.
*Correspondence: Sevgi Onal, c2V2Z2kub25hbEBwZy5jYW50ZXJidXJ5LmFjLm56; Volker Nock, dm9sa2VyLm5vY2tAY2FudGVyYnVyeS5hYy5ueg==