 Gaëtan Poulen1
 Yannick N Gerber2
 Jean-Christophe Perez2
 Khadidja Oubarrahou3Nicolas Lonjon1Florence Vachiery-Lahaye4
 Hassan Boukhaddaoui3
 Florence E. Perrin2,5*
- 1Department of Neurosurgery, MMDN, EPHE, INSERM, University de Montpellier, Montpellier, France
- 2MMDN, University de Montpellier, EPHE, INSERM, Montpellier, France
- 3Institute for Neurosciences of Montpellier, INSERM, Montpellier, France
- 4Department of Coordination Hospitalière des Dons pour La Greffe, Montpellier, France
- 5Institut Universitaire de France (IUF), Montpellier, France
Many histological techniques are used to identify and characterize myelin in the mammalian nervous system. Due to the high content of lipids in myelin sheaths, coherent anti-stokes Raman scattering (CARS) microscopy is a label-free method that allows identifying myelin within tissues. CARS excites the CH2 vibrational mode at 2845 cm−1 and CH2 bonds are found in lipids. In this study, we have used CARS for a new biological application in the field of spinal cord analysis. We have indeed compared several parameters of spinal cord myelin sheath in three different species, i.e., mouse, lemur, and human using a label-free method. In all species, we analyzed the dorsal and the lateral funiculi of the adult thoracic spinal cord. We identified g-ratio differences between species. Indeed, in both funiculi, g-ratio was higher in mice than in the two primate species, and the myelin g-ratio in lemurs was higher than in humans. We also detected a difference in g-ratio between the dorsal and the lateral funiculi only in humans. Furthermore, species differences between axon and fiber diameters as well as myelin thickness were observed. These data may reflect species specificities of conduction velocity of myelin fibers. A comparison of data obtained by CARS imaging and fluoromyelin staining, a method that, similar to CARS, does not require resin embedding and dehydration, displays similar results. CARS is, therefore, a label-free alternative to other microscopy techniques to characterize myelin in healthy and neurological disorders affecting the spinal cord.
Introduction
Myelin is a lipid-rich protective cover formed by oligodendrocytes that surround and protect axons. Lipids account for about 70% of the myelin and myelin sheaths are characterized by a high lipid-to-protein ratio. Furthermore, myelin displays different lipid compositions when compared to typical plasma membranes [1,2]. Myelin sheaths permit to increase the propagation speed of action potentials along axons [3,4]. Moreover, myelin is a dynamic structure spatially organized in heterogeneous functional domains that provide metabolic support to neurons [5].
Loss and alteration of myelin that results in the reduction of nerve conduction velocity and in the altered transfer of energy metabolites to neurons are reported in various diseases [6,7]. Damage to myelin sheaths in humans is observed in severe neurological conditions such as multiple sclerosis, idiopathic inflammatory demyelinating diseases, acute disseminated encephalomyelitis, and neuromyelitis optica [4,8].
To identify myelin on tissues, on the one hand, classical staining based on the specific lipid composition of myelin, such as Luxol fast blue [9], Sudan Black B [10], Baker’s acid hematin method [11], and silver staining [12], had been originally developed. However, these stainings do not always reach a sufficient resolution and contrast to visualize individual fibers [13]. On the other hand, immunochemical methods permit to characterize myelin structure with single fiber resolution and a high reproducibility. Antimyelin protein antibodies most commonly used are myelin basic protein (MBP), proteolipid protein (PLP), myelin oligodendrocyte glycoprotein (MOG), myelin protein zero (MPZ), and myelin-associated glycoprotein [14]. As for all immunohistochemistry approaches, drawbacks are the potential lack of specificity and background noise. Moreover, they only permit a semiquantitative quantification.
Coherent anti-Stokes Raman scattering (CARS) microscopy is a nonlinear optical technique using the endogenous contrast provided by molecules present in the sample [15–17]. The major advantage of this technique is to be done directly on tissues without staining, dehydration, and embedding steps that are detrimental to myelin preservation [18]. Lipid-rich myelinated tissues, such as the spinal cord and brain, appeared to be good samples for CARS imaging [19]. CARS had been used to develop an automated method for the segmentation and morphometric analysis of nerve fibers of spinal cord tissue [20]. CARS had also been used to monitor live myelinated fibers [21], in vivo mouse brain [22], and to carry out a longitudinal in vivo follow-up of demyelination and remyelination in the injured rats' spinal cord [23]. CARS also permitted to characterize demyelination in mouse models of diseases such as amyotrophic lateral sclerosis [24], experimental autoimmune encephalomyelitis [25], and brain tissues of multiple sclerosis patients [26].
This is the first study using a label-free method to compare myelin sheaths of two separated spinal cord tracts in three different species, i.e., mice, lemurs, and humans. Direct comparison of myelin characteristics between species will not only provide basic data on their similarities but also open the way to compare myelin alterations in animal models and human diseases.
Methods
Study approval: Experiments were approved by the Veterinary Services Department of Hérault, the regional ethic committee n°36 for animal experimentation, and the French Ministry of National Education, Higher Education and Research (authorizations; mice: n°34118 and non-human primates n° APAFIS#16177-2018071810113615v3). Experiments followed the European legislative, administrative, and statutory measures for animal experimentation (EU/Directive/2010/63) and the ARRIVE guidelines. Human samples collection was done under the approval of the “Agence de la Biomédecine” (PFS-ssNUM-BAUCHET).
Spinal Cord Samples
Animals were injected with a lethal dose of tribromoethanol (rodent; 500 mg/kg, Sigma Aldrich Darmstadt, Germany) or ketamine (non-human primates; 150 mg/kg, Merial, Lyon, France). Animals were perfused intracardially with cold phosphate saline buffer (PBS, 0.1 M, pH 7.2) followed by cold 4% paraformaldehyde (PFA, pH7.2, Sigma Aldrich, Darmstadt, Germany) in 0.1 M PBS. Spinal cords were post-fixed for 2 h in 4% PFA and then incubated in 30% sucrose in 0.1 M PBS, frozen in OCT (Sakura, Alphen aan den Rijn, Netherlands) and stored at −20 °C.
Mice: Three C57BL6/6J male mice of 3 months of age (Charles River, Wilmington, United States) were used. Non-human primates: three adult male lemurs (Microcebus murinus, 2 years old) were used. They were born and bred in the animal facility (the University of Montpellier, France (license approval 34-05-026-FS) and housed in cages equipped with wooden nests and an enriched environment. The temperature of the animal facility was constantly kept between 24–26°C with 55% of humidity. All Microcebus murinus were fed 3 times a week with fresh fruits and a mixture of cereal, milk, and eggs. Water was given ad libitum.
Human: Low thoracic (T11—T12) spinal cords were obtained from three brain-dead organ-donor patients (2 males 45 and 51 years and 1 female 68 years) under the approval of the French Institution for Organ Transplantation. One patient died from cardiac arrest and two from a ruptured aneurysm. Body temperature was lowered and blood circulation and ventilation were maintained until 4 h before spinal cord removal. This short-time interval permitted good preservation of the tissue, as already reported [27]. After organs removal for therapeutic purposes, T8–L5 vertebral bloc was isolated and spinal cord segments were removed and immediately fixed in 4% paraformaldehyde.
Luxol Fast Blue and Neutral Red Staining
14-µm-thick axial spinal cord cryosections (Microm HM550, Thermofisher Scientific, Waltham, United States) were collected on Superfrost Plus© slides. Luxol fast blue staining was done as previously described [28,29]. Briefly, sections were placed 5 min in 95% ethanol and then incubated in 0.1% Luxol fast blue under mild shaking (12 h, room temperature). Slides were then rinsed for 1 min in milli-Q water, then placed for 1 min in lithium carbonate (0.05%), and finally washed in tap water (1 min). Subsequently, slides were incubated for 10 min in 0.5% neutral red solution, 5 min in 100% ethanol, and washed twice for 10 min in xylene. All slides were cover-slipped using Eukitt (Sigma Aldrich, Darmstadt, Germany).
Coherent Anti-Stokes Raman Scattering and Quantifications
We used LSM 7 MP optical parametric oscillator (OPO) multiphoton microscope (Zeiss, Oberkochen, Germany) with an upright Axio Examiner Z.1 optical microscope associated with a femtosecond Ti: sapphire laser (680–1,080 nm, 80 MHz, 140 fs, Chameleon Ultra II, Coherent, France) pumping a tunable OPOs (1,000–1,500 nm, 80 MHz, 200 fs, Chameleon Compact OPO, Coherent, France) to acquire CARS images. We imaged axial spinal cord sections (14 µm) in all species. A x20 water immersion lens (W Plan Apochromat DIC VIS-IR) with the following characteristics: 1024 x 1024 pixels frame size, scan speed of 6 (zoom x1.2) and 8 (mosaic, zoom x3, PixelDwell 3.15 and 1.27 μs/scan, respectively) and either a zoom x1.2 or x3 was used. CARS excites the CH2 vibrational mode at 2845 cm−1 and CH2 bonds are found in lipids and thus in myelin sheath [30]. Excitation wavelengths are 836 and 1,097 nm (synchronized Ti-sapphire and OPO, respectively) and the signal is detected at 675 nm (filter from 660-685 nm).
The non-resonant background is reduced due to the use of femtoseconds impulsions [31,32] and EPI-detection [33] [for review see [34]]. We collected CARS signaling in the near-infrared (670 nm) since this wavelength produces rather limited autofluorescence when using biological tissue. Moreover, and as previously reported, before getting a simultaneous scan of both lasers, we switch off sequentially one of the laser beams (either OPO or Ti : sapphire) to confirm a robust intensity decay when compared to the CARS signal [30].
Pictures are a stack of 3 µm (3 slices) and were taken in six locations within the lateral funiculus and three locations in the dorsal funiculus (Figure 1C). In each picture, a square of 100 µmX100 µm located in the center of the image was quantified. Imaris 9.6.0 software was used (Bitplane AG, Zurich, Switzerland) for quantifications using numeric x3 zoom applied to the original image (Figure 1G). Only fully identifiable fibers were quantified, and diameters were randomly selected and measured through unidirectional length, without selection criteria (shortest or longest diameter). For some acquisitions, a quick fluoromyelin (20 min, 1:200, Invitrogen Carlsbad, United States), (rinsed 3 × 10 min in PBS) staining was added to observe eventual co-localization.
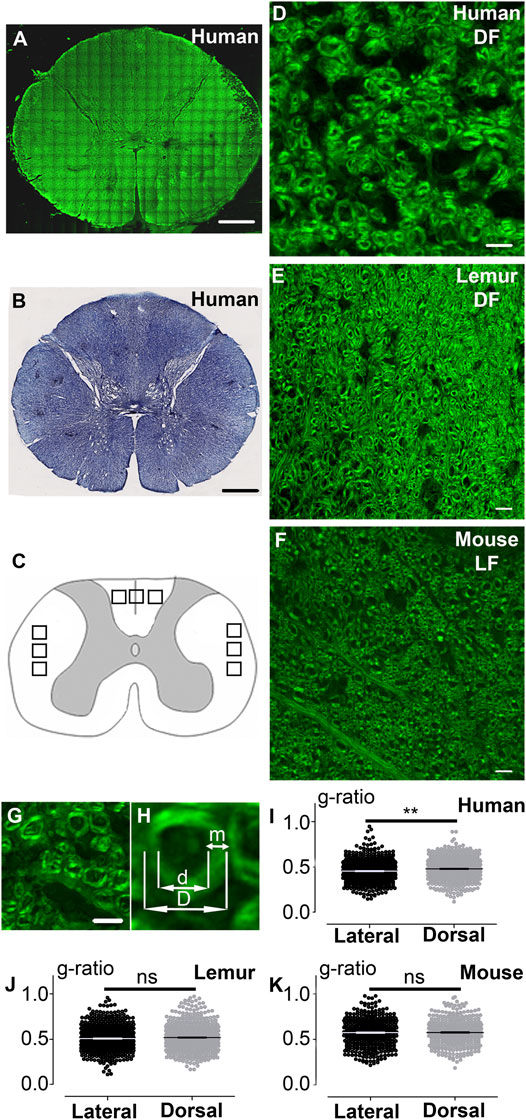
FIGURE 1. CARS microscopy, a label-free method to visualize myelin and analyze myelin g-ratio in the spinal cord of humans, lemurs, and mice. Fast scanning mosaic of axial thoracic section of a human spinal cord imaged with CARS (A); this acquisition allows to locate where higher quality zoomed images were taken for further analysis. Human thoracic spinal cord stained with Luxol fast blue (B). Schematic drawing of a spinal cord, black squares represent locations in the dorsal and lateral funiculi of quantified images in all species (C). Humans (D) and lemurs (E) dorsal funiculus (DF), as well as mouse lateral funiculus (LF) (F), were imaged with CARS. Human dorsal funiculus(G). Higher magnification of G and method used to measure the g-ratio (H). Comparison of the g-ratio in lateral and dorsal funiculi in humans (I), lemurs (J), and mice (K). Data are mean ± SEM per fibers. **p < 0.005; paired t-test. The number of fibers analyzed: n is at least 432 and up to 681 per group; however, in a given species, the number of fibers in LF and DF is similar. In all graphs, quantification in the lateral funiculus is in black and the dorsal funiculus is in light grey. Scale bars: (A, B) 1 mm, (D–G) 10 µm.
Fluoromyelin Staining
We imaged 14 µm-thick axial spinal cord cryosections of the same individuals as for CARS analysis for all species. Sections were incubated 20 min with fluoromyelin (1:200, Invitrogen, Carlsbad, United States), rinsed 3 × 10 min in PBS and mounted with fluorosave (Dako, Glostrup, Denmark). Images were acquired with THUNDER Imager 3D (Leica, Wetzlar, Germany; lens x 63). For all species, one field of 600 µmX400 µm was acquired in the lateral funiculus and one field of 600 µmX200 µm in the dorsal funiculus. In each field, a picture of 200 µmX200 µm located in the center of the image was taken for quantification, and 40 fibers were randomly selected and measured per location and sample. ImageJ software was used (National Institutes of Health, United States) for quantifications using numeric zoom to reach 300% of the original image. Diameter measurements were done for CARS analysis.
Three-Dimensional Illustration
3D image processing software Imaris x64 7.2.2 (Bitplane AG, Zürich, Switzerland) was used for illustration (Supplementary Figure S1).
Statistics
For CARS analysis, at least 432 fibers were quantified per anatomical location and species (3 individuals per species) [number of fibers analyzed: mice (DF = 432; LF = 481); Microcebus murinus (DF = 643; LF = 681); human (DF = 544; LF = 580)]. Significance was accepted at p ≤ 0.05. Results are expressed as mean ± standard error of the mean. Student’s paired (comparison within a given species) or unpaired (comparison between species) t-tests with Welch’s correction were used. For fluoromyelin analysis, 120 fibers (40 for each individual) per anatomical location and species were quantified.
Results
Coherent Anti-Stokes Raman Scattering Imaging Allows Discriminating Myelin Across Species Through G-Ratio Measurement
We first compared coherent anti-stokes Raman scattering (CARS) imaging (Figure 1A, fast scanning mosaic) with standard histological methods to detect myelin, including Luxol fast blue staining (Figure 1B). The dorsal (Figures 1C–E) and lateral (Figures 1C, F) funiculi were analyzed on axial sections of the thoracic spinal cord of humans (Figures 1A, D; Supplementary Figure S1A–D), lemurs (Microcebus murinus) (Figure 1E), and mice (Figure 1F). We then calculated the g-ratio on numerically zoomed images (ratio of the inner-to-outer myelinated fiber diameter, Figures 1G–H) in the lateral (LF) and in dorsal (DF) funiculi in each species. No significant difference in between funiculi was observed in lemurs (p = 0.0565; Figure 1J) nor in mice (p = 0.34; Figure 1K). Conversely, in humans, the g-ratio was higher in dorsal than in lateral funiculus (p = 0.0029, mean g-ratio DF = 0.48 ± 0.005; mean g-ratio LF = 0.45 ± 0.005; Figure 1I), that may reflect differences in conduction speed in between funiculi. For each species, no major difference in the distribution of the g-ratio between the lateral and the dorsal funiculi was observed (Figure 2). However, g-ratio between 0.4 and 0.5 (0.45) was the most prevalent in both funiculi in humans (Figures 2A,B) and lemurs (Figures 2C,D) contrariwise to mice (Figures 2E,F) where the peak was observed for g-ratio between 0.5 and 0.6 (0.55).
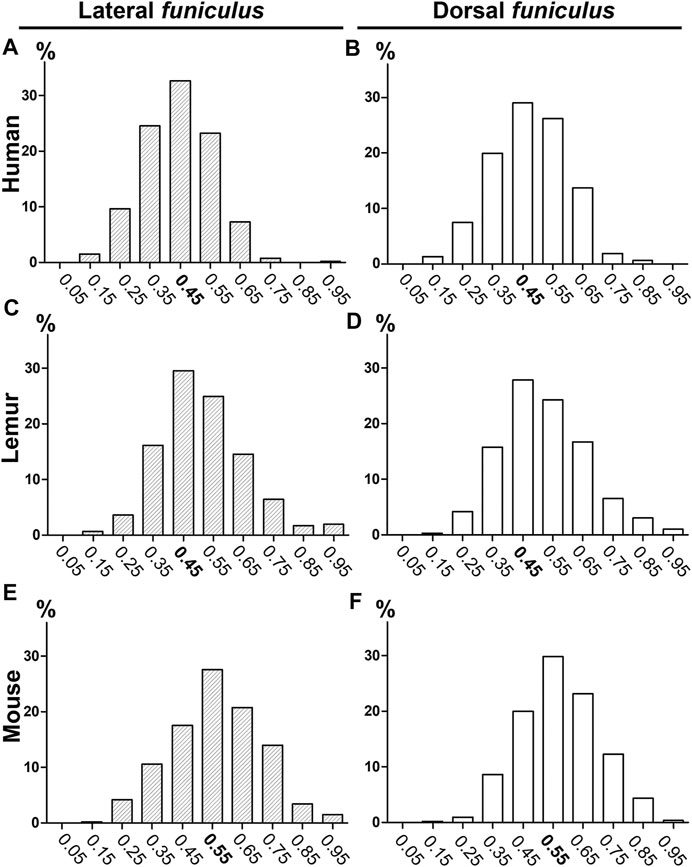
FIGURE 2. Histograms of g-ratio distribution in humans, lemurs, and mice using CARS microscopy. Distributions of g-ratio in lateral (A, C, E) and dorsal (B, D, F) funiculi were quantified in humans (A–B), lemurs (C–D), and mice (E–F). The number of fibers analyzed: n is at least 432 and up to 681 per group.
Spectra of G-Ratio, Fiber Diameter, Axon Diameter, and Myelin Thickness in the Three Species
Comparison of g-ratio, fibers, and axons diameters (Figure 1J) in the lateral and dorsal funiculi (Figure 3) also highlighted species specificities. In both funiculi, g-ratio was lower in humans than in lemurs than in mice (Figure 3A, p < 0.001 for all comparisons); that may reflect differences in conduction speed in between species. Moreover, in humans, fiber and axon diameters, as well as myelin thickness, were higher in the dorsal (fiber diameter: 6.99 ± 0.09 µm, axon diameter: 3.47 ± 0.07 µm and myelin thickness: 1.77 ± 0.03 µm) as compared to the lateral funiculus (fiber diameter: 5.78 ± 0.10 µm, axon diameter: 2.69 ± 0.06 µm and myelin thickness: 1.54 ± 0.03 µm) (Figures 3B-D, p < 0.001 for all parameters). In mice, all parameters were lower in the dorsal funiculus (fiber diameter: 4.03 ± 0.07 µm, axon diameter: 2.35 ± 0.06 µm and myelin thickness: 0.85 ± 0.02 µm) as compared to the lateral funiculus (fiber diameter: 4.52 ± 0.09µm, axon diameter: 2.59 ± 0.07 µm and myelin thickness: 0.91 ± 0.018 µm) (Figures 3B-D, p < 0.001 for all parameters). In lemurs, fiber diameter (DF: 3.75 ± 0.05 µm and LF: 4.04 ± 0.06 µm) and myelin thickness (DF: 0.87 ± 0.014 µm and LF: 1.00 ± 0.02 µm) were lower in the dorsal as compared to the lateral funiculus; no difference was detectable in axon diameter between funiculi (DF: 2.01 ± 0.04 µm and LF: 2.09 ± 0.04 µm) (Figures 3B-D).
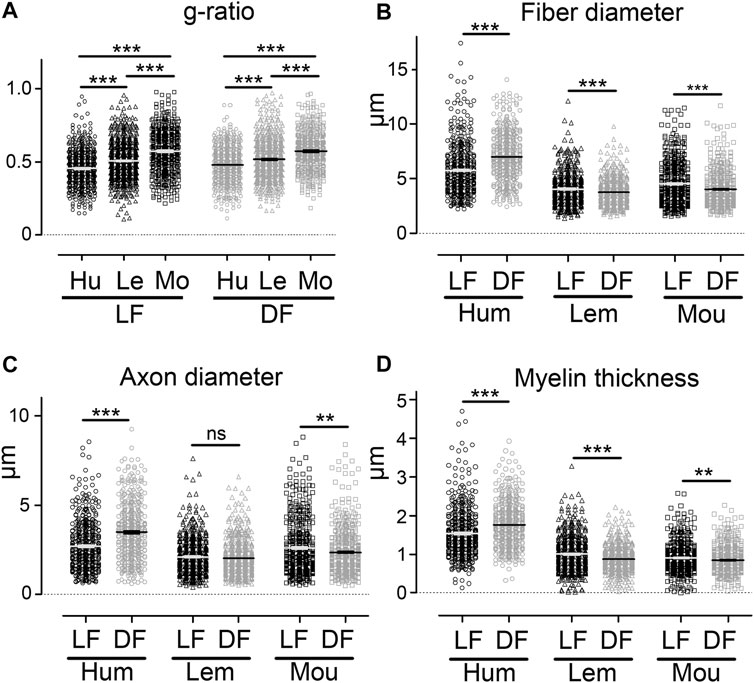
FIGURE 3. Comparison of g-ratio, fiber diameter, axon diameter, and myelin thickness between species using CARS microscopy. Comparison of g-ratio in the lateral and dorsal funiculi in between humans, lemurs, and mice (A). Comparison of fiber diameter in the lateral and dorsal funiculi in humans, lemurs, and mice (B). Comparison of axon diameter in the lateral and dorsal funiculi in humans, lemurs, and mice (C). Comparison of myelin thickness in the lateral and dorsal funiculi in humans, lemurs, and mice (D). Hu: human, Le: lemurs, and Mo: mice. Data are mean ± SEM per section. ***p < 0.001, **p < 0.01 ns: non-significant; unpaired t-test with Welch’s correction. Number of fibers analyzed: n is at least 432 and up to 681 per group.
Taken together, these data demonstrate that using CARS to compare fiber and axon diameters as well as myelin thickness allows interspecies discrimination of three healthy mammal spinal cords.
Fluoromyelin Analysis Display Similar G-Ratio Values as Coherent Anti-Stokes Raman Scattering Imaging
To confirm the accuracy of CARS imaging, we then carried out in the same samples, g-ratio analysis using fluoromyelin staining; another method that, similar to CARS, does not require resin embedding and dehydration and permits to visualize myelin (Figure 4). In the first step, we acquired simultaneously CARS (Figure 4A) and fluoromyelin staining (Figure 4B), both signals partly co-localized (Figure 4C). We then used a Thunder imager with computational clearing to obtain images without out-of-focus blur (Figures 4D,E; Supplementary Figures 1E–H) and to measure g-ratio in the same samples used for CARS analysis. We confirmed for each species the absence of difference in g-ratio distribution between both funiculi (Figures 4F, G, humans; J&K; lemurs and N&O; mice). Moreover, similarly to CARS quantifications, a g-ratio in between 0.4 and 0.5 (0.45) was the most prevalent in both funiculi in humans (Figures 4F, G); for lemurs, the g-ratio in both funiculi was predominantly at 0.55 (however, the proportion of fibers presenting a g-ratio of 0.45 was almost identical) (Figures 4J, K); finally, in mice, the peak was observed for g-ratio at 0.55 (Figures 4). Linear regression curves of g-ratio against axon’s diameter highlighted that lemurs display characteristics (Figures 4L–M; LF R2 = 0.313 and DF R2 = 0.349) in between human (Figures 4H–I; LF R2 = 0.166 and DF R2 = 0.289) and mice (Figures 4P–Q; LF R2 = 0.426 and DF R2 = 0.510). Taken together, these data demonstrate that CARS is a label-free alternative to other microscopy techniques that allow to discrimination of myelinated fibers across species in the mammal spinal cord funiculi.
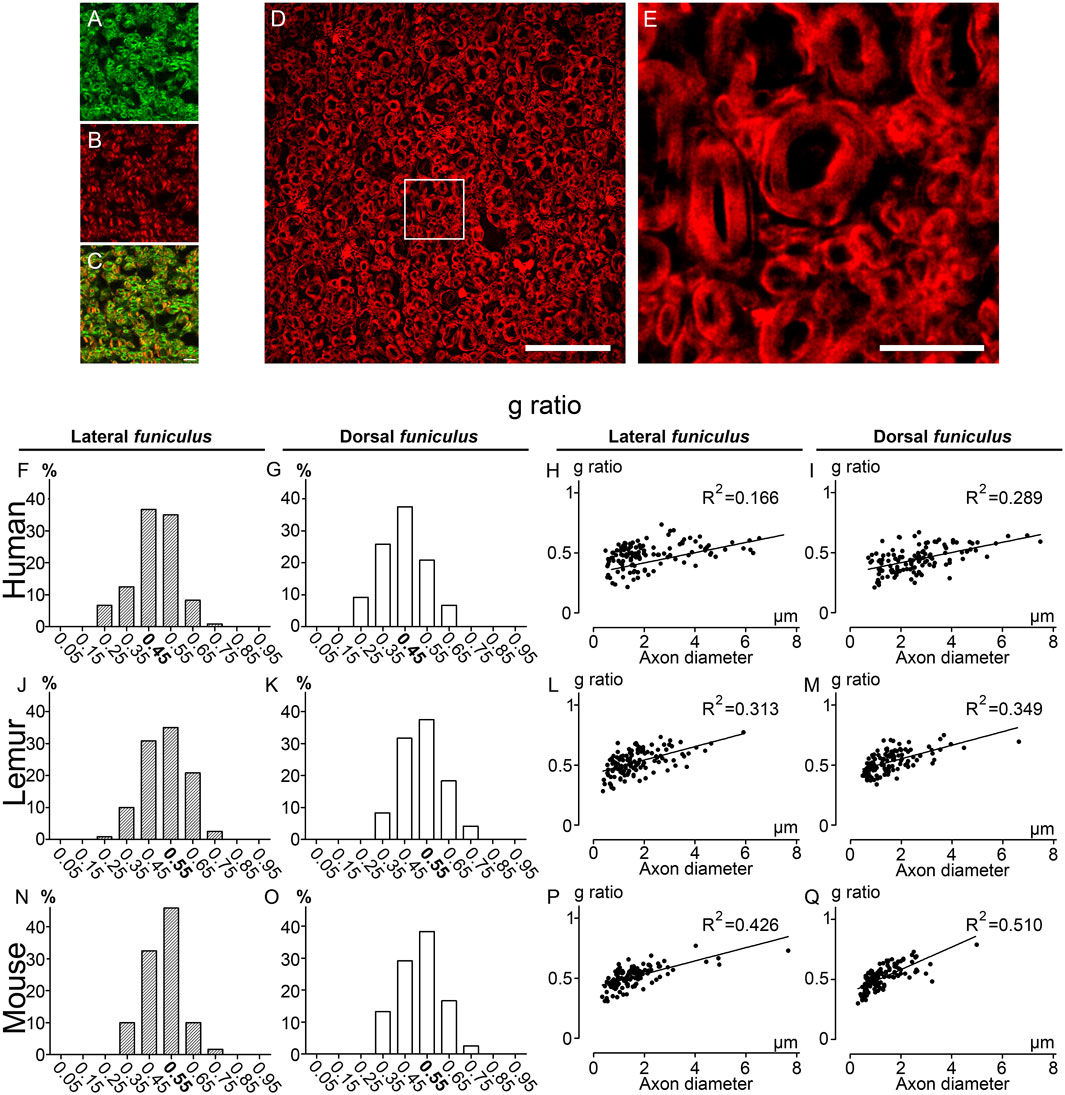
FIGURE 4. g-ratio distribution in humans, lemurs, and mice using fluoromyelin staining CARS image of an axial section of the human thoracic spinal cord showing the lateral funiculus(A) stained with fluoromyelin (B). Merge of both signals (C). Axial section of the human thoracic spinal cord showing the lateral funiculus stained with fluoromyelin and imaged with Thunder Imager (D). Higher magnification of the white box presented in D (E). Distributions of g-ratio in lateral (F, J, N) and dorsal (G, K, O) funiculi were quantified in humans (F, G), lemurs (J–K), and mice (N-O). Scatter plots of g-ratio against axon diameter in the lateral (H, L, P) and dorsal (I, M, Q) funiculi in humans (H-I), lemurs (L–M), and mice (P–Q). Correlation between g-ratio and axon diameter is expressed by the linear correlation coefficient (R2) of the linear regression curve. Each group included three individuals. The number of fibers analyzed: 120 per group. Scale bars: (A-C, E) 10 μm, (D) 50 µm.
Discussion
Here, we present the first CARS analysis of spinal cord myelin in two white matter tracts (lateral and dorsal funiculi) of three different species, i.e., mice, lemurs, and humans. We identified species specificities in particular regarding values of the g-ratio and thus confirmed the accuracy of CARS imaging as an alternative to other microscopy techniques to assess and compare myelin across species.
G-Ratio Coincides with Species Evolution and Myelin Fibers Differ within the Same Species According to Their Location
Myelin fibers g-ratio of both funiculi was higher in mice than in lemurs than in humans and thus inversely coincides with species evolution. This may partly reflect differences in fiber conduction speed across species. Indeed, a few studies have demonstrated that the g-ratio is not only a key determinant for the conduction velocity of a fiber [3,35,36] but also optimized for speed of signal conduction, cellular energetics, and spatial constraints [37]. The distribution of the g-ratio within lateral or dorsal funiculi in the three species highlighted a similar repartition in humans and in lemurs by opposition to mice. Moreover, we identified a higher g-ratio in dorsal as compared to the lateral funiculus only in humans. Conversely, no difference in g-ratio is observed between the lateral and the dorsal funiculus in mice and lemurs. Fibers and axons diameters, as well as myelin thickness, are higher in the dorsal funiculus in humans. This observation certainly mirrors anatomical differences in fiber tracts displaying sensory motor functions and may reflect species-specificities of conduction velocity of myelin fibers.
Taken together, structural similarities between humans and lemurs central nervous system confirms the necessity to develop non-human primate models to study CNS diseases such as demyelinating disease, traumatic brain injury, and spinal cord injury. This is particularly important when studying spinal cord disorders since closer anatomical and functional characteristics of the motor systems, including the corticospinal tract, is observed between human and non-human primate as opposed to rodent [38].
Coherent Anti-Stokes Raman Scattering Microscopy, an Alternative Method to Analyze Myelin
A neuroimaging method, termed multi-component-driven equilibrium single-pulse observation of T1 and T2 (mcDESPOT), allows to examine myelin water fraction (MWF) as an in vivo metric of myelin integrity and content [39,40]. It has been demonstrated that a combination of magnetic resonance (MR) markers that are sensitive to the myelin volume fraction (MVF) and to the intra-axonal volume fraction (AVF) is sufficient to compute a g-ratio for each voxel (aggregate g-ratio). However, it does not allow estimating axon diameter, myelin sheath thickness, and pitfalls of g-ratio imaging such as MR artifacts, lack of specificity, low spatial resolution, and long acquisition times remain [37]. Thus, as suggested recently [18], the emergence of exhaustive databases of myelin fibers structure using several modalities of investigation tools will facilitate further validation of non-invasive methods such as magnetic resonance imaging.
The overall lower g-ratio values (about 0.5) that we obtained using both CARS and fluoromyelin staining as compared to those obtained using electron microscopy may result from variation in factors such as fixative, embedding, and dehydration steps. As recently reviewed, methods that do not require staining, embedding, and dehydration, which are all critical steps for myelin damage, may provide accurate measurement of parameters such as g-ratio and myelin sheath thickness [for review see [18]]. Slight differences in g-ratio repartition that we observed when using CARS imaging and fluoromyelin; in particular with lemurs, may thus also reflect differences in tissue processing. Indeed, even if both techniques do not require resins embedding and dehydration, conversely to CARS, fluoromyelin is not a label-free method and requires mounting.
In conclusion, this study compared the first-time spinal cord myelin sheath in three different species using a label-free method and thus represents a new biological application of a label-free method in the field of spinal cord analysis. We identified species differences between axon and fiber diameters, myelin thickness, and g-ratio that may reflect species-specificities of conduction velocity of myelin fibers. The combination of several imaging techniques, including CARS, will thus permit to better characterize myelin structure in healthy conditions and its alterations in diseases.
Data Availability Statement
The raw data supporting the conclusion of this article will be made available by the authors without undue reservation.
Ethics Statement
The studies involving human samples collection were reviewed and approved by the “Agence de la Biomédecine” (PFS-ssNUM-BAUCHET). Written informed consent for participation was not required for this study in accordance with the national legislation and the institutional requirements. The animal study was reviewed and approved by the Veterinary Services Department of Hérault, the regional ethic committee n°36 for animal experimentation, and the French Ministry of National Education, Higher Education and Research (authorizations; mice: n°34118 and non-human primates n° APAFIS#16177-2018071810113615v3). Experiments followed the European legislative, administrative, and statutory measures for animal experimentation (EU/Directive/2010/63) and the ARRIVE guidelines.
Author Contributions
GP participated in the design of the project and in human samples collection, analyzed the data, and contributed to the writing of the manuscript; YG contributed to the design of the project as well as acquisition and analysis of the data; J-CP participated in the acquisition and analysis of the data; KO participated in the quantification of the data; NL participated in human samples collection; FV-L coordinated human samples collection; HB designed CARS acquisition and participated in the analysis, and FP conceptualized the research, designed the project, participated in the analysis and data interpretation, drafting the work and final approval.
Funding
This work was supported by the patient organizations “Demain Debout Aquitaine” (to YG and FP) and “Verticale” (to YG and FP). The funding sources were not involved in study design, collection, analysis, and interpretation of data and the writing of the report and in the decision to submit the article for publication.
Conflict of Interest
The authors declare that the research was conducted in the absence of any commercial or financial relationships that could be construed as a potential conflict of interest.
Publisher’s Note
All claims expressed in this article are solely those of the authors and do not necessarily represent those of their affiliated organizations, or those of the publisher, the editors and the reviewers. Any product that may be evaluated in this article, or claim that may be made by its manufacturer, is not guaranteed or endorsed by the publisher.
Acknowledgments
We thank the “Agence de la Biomédecine” for organization of human samples collection. We thank Fabrice Bardin and the “Montpellier Ressources Imagerie” for advices in CARS acquisition. We also thank Nadine Mestre-Frances for her expertise in non-human primates.
Supplementary Material
The Supplementary Material for this article can be found online at: https://www.frontiersin.org/articles/10.3389/fphy.2021.665650/full#supplementary-material
References
1. O'brien JS, Sampson EL. Lipid composition of the normal human brain: gray matter, white matter, and myelin. J Lipid Res (1965) 6:537–44. doi:10.1016/s0022-2275(20)39619-x
2. Harayama T, Riezman H. Understanding the diversity of membrane lipid composition. Nat Rev Mol Cel Biol (2018) 19:281–96. doi:10.1038/nrm.2017.138
3. Rushton WAH. A theory of the effects of fibre size in medullated nerve. J Physiol (1951) 115:101–22. doi:10.1113/jphysiol.1951.sp004655
4. Marangon D, Boccazzi M, Lecca D, Fumagalli M. Regulation of Oligodendrocyte Functions: Targeting Lipid Metabolism and Extracellular Matrix for Myelin Repair. J Clin Med (2020) 9(2):470. doi:10.3390/jcm9020470
5. Saab AS, Nave K-A. Myelin dynamics: protecting and shaping neuronal functions. Curr Opin Neurobiol (2017) 47:104–12. doi:10.1016/j.conb.2017.09.013
6. Morrison BM, Lee Y, Rothstein JD. Oligodendroglia: metabolic supporters of axons. Trends Cel Biol (2013) 23:644–51. doi:10.1016/j.tcb.2013.07.007
7. Micu I, Plemel JR, Caprariello AV, Nave KA, Stys PK. Axo-myelinic neurotransmission: a novel mode of cell signalling in the central nervous system. Nat Rev Neurosci (2017) 19:58. doi:10.1038/nrn.2017.128
8. Stimmer L, Fovet C-M, Serguera C. Experimental Models of Autoimmune Demyelinating Diseases in Nonhuman Primates. Vet Pathol (2018) 55:27–41. doi:10.1177/0300985817712794
9. Klüver H, Barrera E. A method for the combined staining of cells and fibers in the nervous system. J Neuropathol Exp Neurol (1953) 12:400–3. doi:10.1097/00005072-195312040-00008
10. Meier C. Some observations on early myelination in the human spinal cord. Light and electron microscope study. Brain Res (1976) 104:21–32. doi:10.1016/0006-8993(76)90644-2
11. Hori SH. A Simplified Acid Hematein Test for Phospholipids. Stain Tech (1963) 38:221–5. doi:10.3109/10520296309061182
12. Gallyas F. Silver staining of myelin by means of physical development. Neurol Res (1979) 1:203–9. doi:10.1080/01616412.1979.11739553
13. Thetiot M, Freeman SA, Desmazières A. Immunohistochemical Analysis of Myelin Structures. Methods Mol Biol (2018) 1791:15–23. doi:10.1007/978-1-4939-7862-5_2
14. Fluri F, Ferracin F, Erne B, Steck AJ. Microheterogeneity of anti-myelin-associated glycoprotein antibodies. J Neurol Sci (2003) 207:43–9. doi:10.1016/s0022-510x(02)00359-3
15. Zumbusch A, Holtom GR, Xie XS. Three-Dimensional Vibrational Imaging by Coherent Anti-Stokes Raman Scattering. Phys Rev Lett (1999) 82:4142–5. doi:10.1103/physrevlett.82.4142
16. Evans CL, Xie XS. Coherent anti-stokes Raman scattering microscopy: chemical imaging for biology and medicine. Annu Rev. Anal. Chem. (2008) 1:883–909. doi:10.1146/annurev.anchem.1.031207.112754
17. Bégin S, Bélanger E, Laffray S, Vallée R, Côté D. In vivooptical monitoring of tissue pathologies and diseases with vibrational contrast. J Biophoton (2009) 2:632–42. doi:10.1002/jbio.200910071
18. Saliani A, Perraud B, Duval T, Stikov N, Rossignol S, Cohen-Adad J. Axon and Myelin Morphology in Animal and Human Spinal Cord. Front Neuroanat (2017) 11:129. doi:10.3389/fnana.2017.00129
19. Brideau C, Poon KWC, Colarusso P, Stys PK. Excitation parameters optimized for coherent anti-Stokes Raman scattering imaging of myelinated tissue. J Biomed Opt (2019) 24:1–8. doi:10.1117/1.jbo.24.4.046502
20. Bégin S, Dupont-Therrien O, Bélanger E, Daradich A, Laffray S, De Koninck Y, et al. Automated method for the segmentation and morphometry of nerve fibers in large-scale CARS images of spinal cord tissue. Biomed Opt Express (2014) 5:4145–61. doi:10.1364/boe.5.004145
21. Wang H, Fu Y, Zickmund P, Shi R, Cheng J-X. Coherent anti-stokes Raman scattering imaging of axonal myelin in live spinal tissues. Biophysical J (2005) 89:581–91. doi:10.1529/biophysj.105.061911
22. Fu Y, Huff TB, Wang H-W, Cheng J-X, Wang H. Ex vivo and in vivo imaging of myelin fibers in mouse brain by coherent anti-Stokes Raman scattering microscopy. Opt Express (2008) 16:19396–409. doi:10.1364/oe.16.019396
23. Shi Y, Zhang D, Huff TB, Wang X, Shi R, Xu X-M, et al. Longitudinal in vivo coherent anti-Stokes Raman scattering imaging of demyelination and remyelination in injured spinal cord. J Biomed Opt (2011) 16:106012. doi:10.1117/1.3641988
24. Picardi G, Spalloni A, Generosi A, Paci B, Mercuri NB, Luce M, et al. Tissue degeneration in ALS affected spinal cord evaluated by Raman spectroscopy. Sci Rep (2018) 8:13110. doi:10.1038/s41598-018-31469-4
25. Fu Y, Frederick TJ, Huff TB, Goings GE, Miller SD, Cheng J-X. Paranodal myelin retraction in relapsing experimental autoimmune encephalomyelitis visualized by coherent anti-Stokes Raman scattering microscopy. J Biomed Opt (2011) 16:106006. doi:10.1117/1.3638180
26. Poon KWC, Brideau C, Klaver R, Schenk GJ, Geurts JJ, Stys PK. Lipid biochemical changes detected in normal appearing white matter of chronic multiple sclerosis by spectral coherent Raman imaging. Chem Sci (2018) 9:1586–95. doi:10.1039/c7sc03992a
27. Perrin FE, Gerber YN, Teigell M, Lonjon N, Boniface G, Bauchet L, et al. Anatomical study of serotonergic innervation and 5-HT1A receptor in the human spinal cord. Cell Death Dis (2011) 2:e218. e218. doi:10.1038/cddis.2011.98
28. Gerber YN, Saint-Martin GP, Bringuier CM, Bartolami S, Goze-Bac C, Noristani HN, et al. CSF1R Inhibition Reduces Microglia Proliferation, Promotes Tissue Preservation and Improves Motor Recovery after Spinal Cord Injury. Front Cel Neurosci (2018) 12:368. doi:10.3389/fncel.2018.00368
29. Noristani HN, Saint-Martin GP, Cardoso M, Sidiboulenouar R, Catteau M, Coillot C, et al. Longitudinal MRI analysis and histological characterization after spinal cord injury in two mouse strains with different functional recovery: gliosis as a key factor. J Neurotrauma (2018).
30. Mytskaniuk V, Bardin F, Boukhaddaoui H, Rigneault H, Tricaud N. Implementation of a Coherent Anti-Stokes Raman Scattering (CARS) System on a Ti:Sapphire and OPO Laser Based Standard Laser Scanning Microscope. J Vis Exp (2016). doi:10.3791/54262
31. Dudovich N, Oron D, Silberberg Y. Single-pulse coherently controlled nonlinear Raman spectroscopy and microscopy. Nature (2002) 418:512–4. doi:10.1038/nature00933
32. Lim S-H, Caster AG, Nicolet O, Leone SR. Chemical imaging by single pulse interferometric coherent anti-stokes Raman scattering microscopy. J Phys Chem B (2006) 110:5196–204. doi:10.1021/jp057493k
33. Volkmer A, Cheng J-X, Xie XS. Vibrational Imaging with High Sensitivity via Epidetected Coherent Anti-Stokes Raman Scattering Microscopy. Phys Rev Lett (2001) 87. doi:10.1103/physrevlett.87.023901
34. Cheng J-X, Xie XS. Coherent Anti-stokes Raman Scattering Microscopy: Instrumentation, Theory, and Applications, 108 (2004). doi:10.1021/jp035693v
35. Goldman L, Albus JS. Computation of impulse conduction in myelinated fibers; theoretical basis of the velocity-diameter relation. Biophysical J (1968) 8:596–607. doi:10.1016/s0006-3495(68)86510-5
36. Chomiak T, Hu B. What is the optimal value of the g-ratio for myelinated fibers in the rat CNS? A theoretical approach. PLoS One (2009) 4:e7754. doi:10.1371/journal.pone.0007754
37. Campbell JSW, Leppert IR, Narayanan S, Boudreau M, Duval T, Cohen-Adad J, et al. Promise and pitfalls of g-ratio estimation with MRI. Neuroimage (2018) 182:80–96. doi:10.1016/j.neuroimage.2017.08.038
38. Friedli L, Rosenzweig ES, Barraud Q, Schubert M, Dominici N, Awai L, et al. Pronounced species divergence in corticospinal tract reorganization and functional recovery after lateralized spinal cord injury favors primates. Sci Transl Med (2015) 7:302ra134. 302ra134. doi:10.1126/scitranslmed.aac5811
39. Deoni SCL, Rutt BK, Arun T, Pierpaoli C, Jones DK. Gleaning multicomponent T 1 and T 2 information from steady-state imaging data. Magn Reson Med (2008) 60:1372–87. doi:10.1002/mrm.21704
Keywords: myelinated fibers, g-ratio, CARS, spinal cord, human, lemur, mice
Citation: Poulen G, Gerber YN, Perez J-C, Oubarrahou K, Lonjon N, Vachiery-Lahaye F, Boukhaddaoui H and Perrin FE (2021) Coherent Anti-Stokes Raman Scattering Microscopy: A Label-Free Method to Compare Spinal Cord Myelin in Different Species. Front. Phys. 9:665650. doi: 10.3389/fphy.2021.665650
Received: 08 February 2021; Accepted: 21 July 2021;
Published: 30 September 2021.
Edited by:
Peng Gao, Xidian University, ChinaReviewed by:
Nirmal Mazumder, Manipal Academy of Higher Education, IndiaSha AnXian, Institute of Optics and Precision Mechanics (CAS), China
Copyright © 2021 Poulen, Gerber, Perez, Oubarrahou, Lonjon, Vachiery-Lahaye, Boukhaddaoui and Perrin. This is an open-access article distributed under the terms of the Creative Commons Attribution License (CC BY). The use, distribution or reproduction in other forums is permitted, provided the original author(s) and the copyright owner(s) are credited and that the original publication in this journal is cited, in accordance with accepted academic practice. No use, distribution or reproduction is permitted which does not comply with these terms.
*Correspondence: Florence E. Perrin, ZmxvcmVuY2UucGVycmluQGluc2VybS5mcg==