 Lijuan Zhang
 Jianjian Zhang
 Guowen Sun
 Zhiyong Liu
- 1Foundational Subjects Department, Shijiazhuang TieDao University SiFang College, Shijiazhuang, China
- 2School of Civil Engineering, Harbin Institute of Technology, Harbin, China
- 3School of Materials Science and Engineering, Shijiazhuang Tiedao University, Shijiazhuang, China
- 4Jiangsu Key Laboratory for Construction Materials, Southeast University, Nanjing, China
Chloride transport in marine concrete under loading is the main cause of its structural deterioration. The traditional numerical simulation assumes that the coefficient of chloride transport is constant, resulting in a large deviation in the prediction results. Based on the porous medium theory, micromechanics theory, and the idea of equivalent homogenization, a multi-scale model of the effective diffusion variable coefficient of chloride transport under bending load was established, which was calculated and programmed by the numerical analysis. The results show that the prediction values of the two-dimensional variable coefficient model are basically consistent with those in the literature, and the prediction accuracy is significantly improved. In addition, the theoretical simulation proves that the bending load affects the porosity of the cement matrix, and then the diffusion coefficient of chloride is changed in concrete. The compression zone can slow down the chloride transport process, while tension zone will accelerate it. The chloride concentration under tension zone is 42.1% higher than that under compression zone when the diffusion time is 200 days and the concrete depth is 15 mm.
Introduction
Traditionally, it is mainly through soak test or sampling the samples, and then testing the distribution of chloride concentration for regression test [1, 2]. Researchers have been exploring to combine the coefficient of chloride transport with the microstructure characteristics of the concrete composite [3] so that the accuracy of prediction results is significantly improved. Tegguer et al. [4] considered the damage variable of specimens showed relationship with gas permeability and chloride diffusion of concrete. Wang et al. [5] indicated that the chloride concentration and apparent chloride diffusion coefficient decreased with the increase of the compressive stress, up to 55% of the compressive strength, and they increased with the increase of the flexural stress. Gowripalan et al. [6] considered the crack width/cover ratio (Wcr/C) can be a suitable parameter to study in relation to the durability performance of a cracked reinforced concrete.
Xi et al. [7] established a mathematical model of chloride transport in saturated concrete, which regarded concrete materials as a mortar phase and an aggregate phase. Liu et al. [8] presented a mesoscale model by various parameters to examine the effects of aggregates of shapes and volume fractions on chloride transport. In comparison, Cao et al. [9] established a more systematic model considering the changes of the water-to-binder ratio (w/c), the hydration degree, the tortuosity of the transport path caused by the cement matrix, and aggregate morphology. In fact, the concrete has typical porous, multiphase, and multi-scale characteristics, with each phase and each scale having different transport and mechanical properties. Garboczi and Bentz [10] used the multi-scale scheme and the theory to link the ion diffusion with the concrete microstructure, where the model mainly considered the ITZ volume fraction. Zhang et al. [11] achieved the diffusion coefficient of the low-density and high-density C-S-H gel based on a multi-scale scheme. Based on the theory of porous medium and micromechanics, Sun et al. [12] systematically established a model to predict the effective diffusion coefficient of chloride in concrete, starting from the C-S-H gel, the smallest scale unit of concrete, and ranging from the nanoscale to the microscale, mesoscale, and macroscale. This result has a very good guidance for the prediction of concrete transport performance and is also the study idea of this article.
In fact, the concrete is subjected to dual or multiple effects of mechanical and environmental loading in the service environment. Bending load is one of the loading types of large-scale infrastructure, and it is also the focus of the study [9, 13–15]. In the normal service environment, the loading is generally not enough to cause the deterioration of concrete performance [16], but with the passage of time, the loading will change the distribution of pores and microcracks in concrete.
Xu and Li [13–16] indicated that the diffusion coefficient of chloride and current porosity of concrete decreased with the increase in compressive stress and increased with the increase in tensile stress at low deformation levels. Li and Guo [16] developed a coupled mechanical-diffusive model to simulate chloride diffusion under various loading in saturated concrete.
In the above model, the diffusion coefficient of chloride predicted under loading and without loading is regarded as constant [5, 6]. In fact, under the action of loading, the internal pores, microcracks, and even macrocracks in the structural concrete are constantly changing, and the corresponding chloride transport coefficient is also constantly changing.
Aiming at the chloride transport under loading in saturated concrete, this article established the diffusion model of chloride transport predicted under without loading in concrete. On this basis, the two-dimensional (2D) diffusion model of chloride with variation coefficient under loading was established based on the three-phase sphere model of concrete and elastic mechanics theory. It should be noted that the study objective of this article is that the structural marine concrete is still in the normal service environment, so the bending load stress is relatively small, and there are no obvious macrocracks on its internal structure.
Representation of Multi-Scale Microstructure in Concrete Under Load
Compared with single material, concrete material has more complex mechanical properties and size effect, and its internal structure presents high heterogeneity [17]. From the main hydration product C-S-H of cement to aggregate, their size from nanometer to centimeter, the size span is relatively large, and its internal pore size can also be from nanometer to millimeter. The concrete has typical porous, multiphase, and multi-scale characteristics, and each phase has independent mechanical properties and diffusion properties [12], so the study of concrete performance also needs to use the multi-scale method.
On the mesoscale, concrete is regarded as a three-phase composite material made up of ellipsoidal aggregate, cement matrix, and ITZ between them, as shown in Figure 1A. The hardened cement matrix is considered as a two-phase composite material made up of the hydration product solid phase (various hydration products and unhydration particles) and the pore phase (capillary pores and microcracks), as shown in Figure 1B. It needs to be indicated that chloride is mainly diffused in the capillary pores, and only a small amount are transported in gel pores with larger pore sizes [12]. Considering the percolation threshold of pores, which will be given in the next section, the gel pores of C-S-H are also basically contained. In the corresponding theoretical simulation, the solid phase can be regarded as an isotropic medium, as shown in Figure 1D. The ITZ composition is essentially the same as that of the cement matrix, but the porosity of the interface zone is relatively high, so it is also considered to be composed of the solid phase of the cement production and the pores (the scale reaches to the capillary pores and cracks), as shown in Figure 1C. The theoretical simulation is similar to that of Figure 1D, except that the ITZ volume fraction and its corresponding diffusion performance need to be calculated separately. On the microscale, the cement matrix is composed of hydrated products, pore water, pore, and unhydrated cement particles [18, 19].
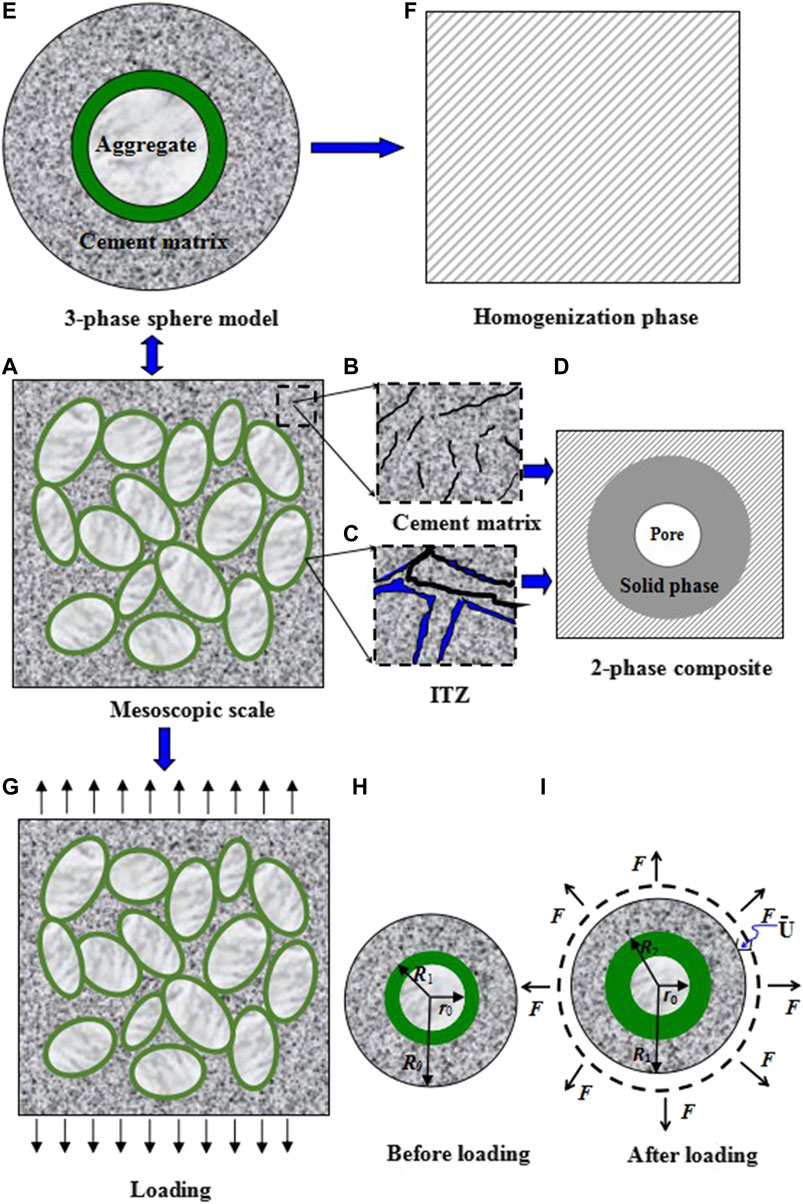
FIGURE 1. Diagram of multi-scale in concrete under load.
In the theoretical simulation of concrete diffusion performance, the concept of equivalent diameter (Deq) is introduced to deal with the size distribution of aspheric aggregate particle [20]. In this way, the concrete composed of ellipsoidal aggregate adopts the three-phase sphere model, as shown in Figure 1E. According to the mean-field theory of micromechanics, the homogenized equivalent medium is shown in Figure 1F. The diffusion performance of equivalent medium is the macroscopic diffusion performance of the concrete [21].
When the concrete is under loading (tensile as shown in Figure 1G), the main deformation occurs in the cement matrix and ITZ. Due to the relatively large elastic modulus of the aggregate, the self-deformation is very small, which can be ignored. Under tensile loading, the volume unit of the concrete is selected, as shown in Figure 1H, and its volume changes after being subjected to the external loading (indicated by the radial forced displacement u) as shown in Figure 1I. It should be pointed out that there are no obvious macrocracks in the concrete after it is loaded, so the difference between the total volume strain of the concrete before and after deformation is used to represent the change of the total pore of the concrete. The relationship between the change process of the specific total strain and the porosity is given in Diffusion Coefficient Model of Chloride in Concrete Under Bending Load.
Multi-Scale Prediction of the Diffusion Coefficient of Chloride in Concrete Under Bending Load
Diffusion Coefficient Model of Chloride in Concrete Without Loading
Aggregate is an important part of structural concrete, which accounts for more than 70% of the unit volume of concrete. In addition, the random distribution of aggregate and the overlapping phenomenon of the ITZ around aggregate make the diffusion prediction of chloride in structural concrete have certain complexity [22]. Based on the micromechanics theory and the idea of equivalent homogenization, Sun et al. [12] proposed a Mori–Tanaka scheme to predict the effective diffusion coefficient of chloride in concrete, considering the morphology characteristics of ellipsoidal aggregate. It can be expressed as
where Da, DITZ, Dcp, and De are the diffusion coefficients of aggregate, ITZ, cement matrix, and equivalent spherical particles composed of aggregate and ITZ, respectively. VITZ and Va are the volume fractions of the ITZ and aggregate, respectively.
The aggregate is dense and has very low porosity. It is assumed that the aggregate has no permeability; that is, the diffusion coefficient of chloride is zero (Da = 0) in the aggregate, modifying Eq. 1b to obtain the following result:
The following gives the determination of the parameters in Eq. 2.
Diffusion Coefficient of Chloride in Cement Matrix Pore Solution (Dcp)
As mentioned above, the process of chloride diffusion in concrete is essentially the migration of charged particles or molecules in the pore solution of the porous medium. In the hardened cement paste, the channels of chloride diffusion are mainly capillary pores, followed by a small amount of gel pores with slightly larger pore sizes [12]. The size and quantity of these two types of pores are related to the w/c and hydration degree of the cement. The relationship between the porosity and diffusion coefficient (Dcp) can be expressed as [23]
where p0 cp and pcp are the initial porosity and current porosity of cement matrix, respectively, including capillary pores and gel pores. When the concrete is predicted without loading, pcp = p0 cp, n is 14.44. α is the hydration degree of cement, t is the cement hydration time (s), and Dp is the diffusion coefficient of chloride ions in the pore solution (m2/s), which is given separately below.
It should be emphasized that the chloride diffusion in cement paste pore solution is also affected by the types and concentrations of ions in the pore solution. Considering the factor, Zuo et al. [24] established the model of chloride diffusion in the pore solution based on the theory of electrolyte solution in concrete, which can be expressed as
where R is the universal gas constant (R = 8.314 J/Kmol), T0 is the ambient temperature (T = 298.15 K), F is the Faraday constant (F = 9.648 × 10⁴ C/mol), I is the ionic strength (mol/m3), ccl− is the chloride concentration in the pore solution (mol/L), αcl− is the atomic radius of chloride ions (αcl− = 1.81 × 10⁻¹⁰ m), and Λcl− is the molar conductivity of chloride ions in the electrolyte solution (Sm2/mol); the detailed calculation process is shown in reference [25].
By substituting the results of Eq. 4 into Eq. 3, the diffusion coefficient of chloride ions in the pore solution of cement matrix (Dcp) can be determined. This prediction model comprehensively considers the influence of w/c, hydration age, hydration degree, and ion type, and concentration in pore solution.
Diffusion Coefficient of Chloride in ITZ (DITZ)
Based on the study of Garboczi and Bentz [26], Sun et al. [25] gave the diffusion coefficient of the ITZ, which can be expressed as
where D0 is the diffusion coefficient of chloride in free water and D0 = 2.032 × 10⁻⁹ m2/s at 25°C; p0ITZ and pITZ are the initial porosity and current porosity of ITZ, respectively; when the prediction in concrete is without loading, pITZ = p0 ITZ. H is the Heaviside function; when p(x) > ϕcri, H (p(x)-ϕcri) = 1; otherwise, it is 0; ϕcri is the percolation threshold of capillary pores, which is 0.18; tITZ represents the ITZ thickness; x is the distance from the aggregate surface, and dx is the infinitesimal interval of the distance from the aggregate surface; p(x) represents the porosity at the distance x from the aggregate surface, and its derivation and numerical calculation are shown in reference [25].
Volume Fraction of ITZ (VITZ)
Based on the study of ITZ around the spherical aggregate of Garboczi and Bentz [27], Zhang et al. [20] gave the numerical model of volume fraction of ITZ around the ellipsoid aggregate, where they assumed that a certain thickness of the interface layer is uniformly distributed around the aggregate. Comprehensively, considering the random distribution of the aggregate in concrete and the overlapping phenomenon between the interfaces, the expression of volume fraction of ITZ around the ellipsoid aggregate is as follows:
where
Diffusion Coefficient Model of Chloride in Concrete Under Bending Load
It is assumed that under external loading, the concrete is still under loading in service, and the main internal cracks are microcracks without obvious macrocracks. The microcracks under loading are equivalent to the change of the internal porosity of the concrete caused by the loading [28]; that is, the change of the porosity is an important link between the changes of the concrete before and after the loading. Generally, the aggregate is relatively dense, and the channel of chloride diffusion in the concrete is located in the cement matrix and ITZ. In this way, under the saturated state, the concrete composed of three-phase composite materials can be further simplified as a two-phase composite material composed of solid matrix phase (including coarse and fine aggregates and cement particles, the porosity of which is zero) and pore water phase. The main difference between the cement matrix and ITZ is its high porosity. As shown in Figure 2A, the pore water phase in this representative unit is the water content of the gel pores, capillary pores, microcracks, and bubble pores. This mechanical model is the widely used Hansen model [17].
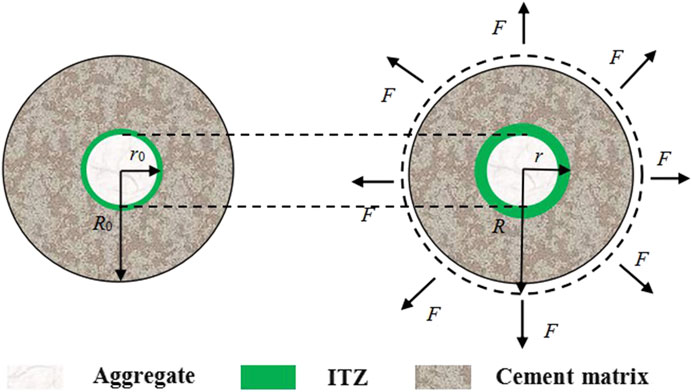
FIGURE 2. implified spherical mechanical model of three-phase concrete.
In the above three-phase sphere model, before the external loading is applied, that is, before deformation, the radius of the ITZ sphere is r0, and the radius of the mortar phase sphere is R0. After the loading is applied, that is, after deformation, the radius of the ITZ sphere is r, and the radius of the solid matrix phase sphere is R. Based on the theory of elasticity and material mechanics, Jin and Du [17] deduced the quantitative relationship between the current porosity p and the initial porosity p0, and the volume strain εV in concrete under the action of external loading. The results are as follows:
where Km is the bulk modulus (GPa) of the solid phase, um is the shear modulus (GPa) of the solid phase, and Kw is the bulk modulus of pore water in the liquid phase (GPa).
When the structural concrete is subjected to the bending load, it is divided into compression zone and tension zone, as shown in Figure 3. The change of concrete under loading is usually characterized by the total volume strain of concrete (εV). The loading is also commonly used to express the effect of stress on concrete. If the concrete is considered to be isotropic macroscopically, the relationship among compressive stress, tensile stress, and strain is [29]
where σ is the stress of concrete under the external loading (MPa), fc is the uniaxial compressive strength of the concrete (MPa), ft is the uniaxial tensile strength of the concrete (MPa), ε is the strain under stress, and ε0 is the strain, which is 0.002, corresponding to the peak stress of the concrete.
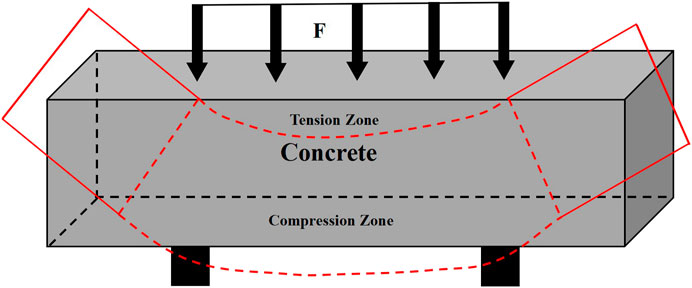
FIGURE 3. Concrete structure under the blending load.
According to Eqs. 8 Eqs. 9, the strains εx, εy, and εz of each point of concrete material can be obtained, and the volume strain εv of concrete structure under loading is as follows:
The above constitutive relation requires that the external loading should be less than the uniaxial compressive or tensile strength; that is, the concrete does not appear to have macrocracks when it is under loading. Through Eqs. 7–10, the quantitative relationship among p, p0, and σ is established in concrete.
Loading will also affect the current porosity of cement matrix and ITZ in concrete, but how to quantify this effect? Based on the study of Jin and Du [17], the relationship between σ and p of the cement matrix and ITZ can be obtained, as shown in Eq. (11).
where X means the cement matrix or ITZ, and K and u are the bulk modulus (GPa) and shear modulus (GPa) of cement matrix and ITZ, respectively. Kw is the bulk modulus of pore water in the liquid phase (GPa).
The initial porosity p0 cp and p0 ITZ of the ITZ and cement matrix can be calculated by Eq. 3b and Eq. 5b, respectively. Based on Eq. 7a and Eq. 11a, the current porosity p, pcp, and pITZ of concrete, cement matrix, and ITZ, respectively, can be calculated. When the above parameters are substituted into Eq. 3a and Eq. 5a under loading, the diffusion coefficients of chloride DLcp and DLITZ can be obtained in cement matrix and ITZ under loading, and then the effective diffusion coefficient DLeff of chloride can be obtained from Eq. 2 in concrete under loading.
The mechanical parameters of materials required for the calculation model are shown in Table 1 and Table 2.

TABLE 1. Mechanical parameters of materials.
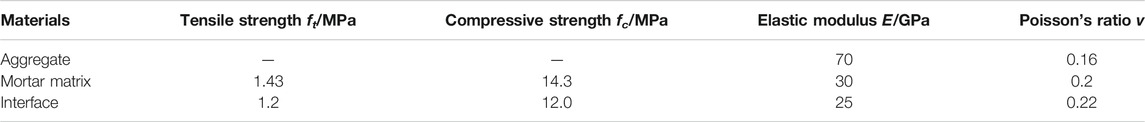
TABLE 2. Mechanical parameters of concrete micro-component materials.
It should be noted that the above theoretical derivation is a diffusion model of chloride variation coefficient in concrete under loading based on elastic deformation conditions; that is, the external loading has not reached its strength limit, and no new cracks have occurred in the concrete.
Therefore, the calculation flowchart of chloride diffusion coefficient is as shown in Figure 4.
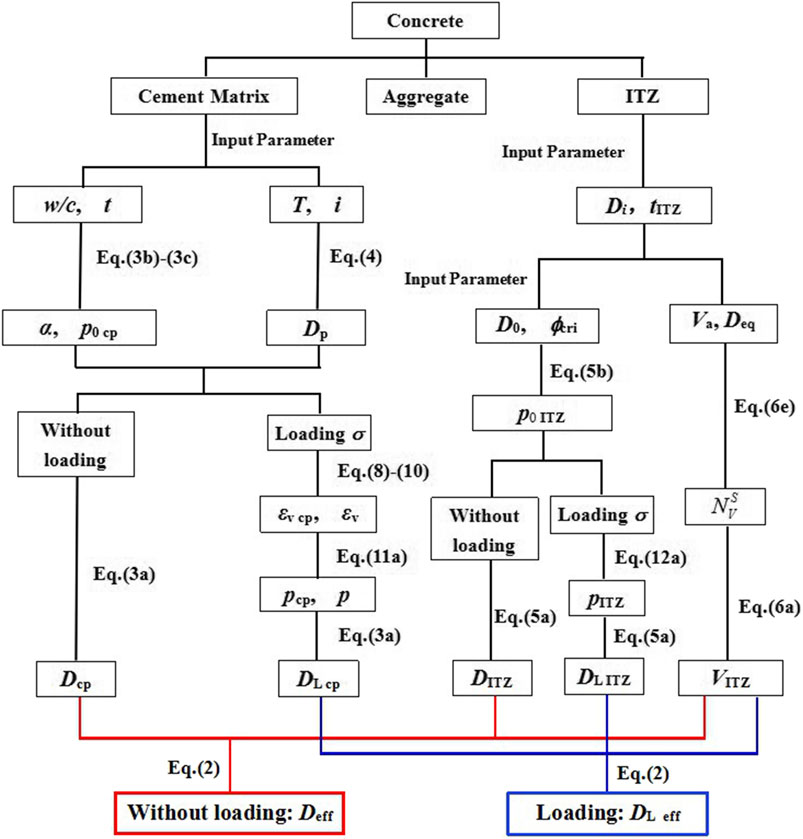
FIGURE 4. Calculation flowchart of effective diffusion coefficient of chloride under bending load.
By inputting different parameters and bringing them into the corresponding calculation equation, the chloride diffusion coefficient is obtained in cement paste and ITZ. Finally, combined with the ITZ content, the chloride diffusion coefficient is obtained. Red and blue represent the effective chloride diffusion coefficient predicted under without loading and loading, respectively.
Prediction of Chloride Concentration Distribution With Variable Diffusion Coefficient in Concrete Under 2D Erosion
The diffusion flux of chloride is a function that changes with time and space, and its diffusion process is called the unsteady diffusion process. When the structure is eroded, its 2D diffusion model is as shown in Figure 5.
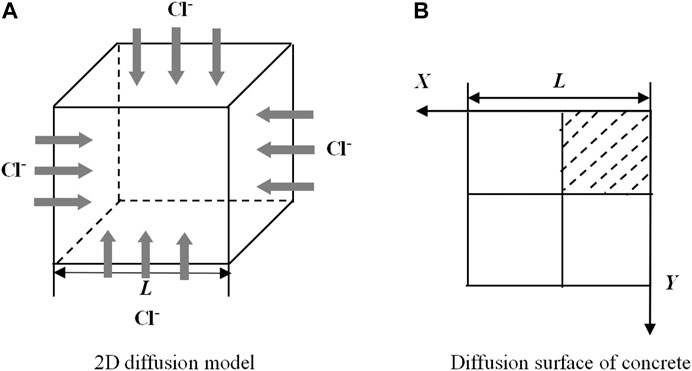
FIGURE 5. 2D diffusion model of chloride.
Therefore, modified Fick’s second law is often employed to describe the distribution of Cl− concentration in the 2D direction. The specific 2D diffusion variable coefficient equation and boundary conditions are as follows:
where C and D are the Cl− concentration (C=C (x,y,t) mol/m3) and diffusion coefficient of chloride (D = D (x,y,t) m2/s) at the point (x,y) in concrete at the time of t, respectively. CS is the Cl− concentration on the surface in concrete (mol/m3), x is the distance from a point in concrete along the X direction to the concrete surface (m), y is the distance from a point in concrete along the Y direction to the concrete surface (m), t is the diffusion time of chloride (s), L is the sample thickness, and Deff determined by Figure 4 is the diffusion initial coefficient of chloride in concrete (m2/s).
It is relatively difficult to solve the variable coefficient in Eq. 12, where the numerical analysis is used to calculate, and the alternating direction implicit format (ADI) is adopted, which is not only unconditionally stable but also can be solved by the catch-up method. First, ∂2C/∂x2 is placed on the k+1/2 layer, and ∂2C/∂y2 is superseded by the second-order central difference quotient on the k layer. Second, ∂2C/∂y2 is placed on the k+1 layer, and ∂2C/∂x2 is superseded by the second-order central difference quotient on the k+1/2 layer. The two steps belong to the implicit format in one dimension; the implicit format is used in the X or Y direction. Through the above steps, the solution of a time layer from k to k+1 can be completed by using the two-time catch-up method.
As shown in Figure 6, the parallel line cluster formula of grid division is expressed as follows:
where h and Δt can be calculated from M, K, L, and T assumed by the model. The grid nodes are (xi, yi, tk). The solution of the differential equation (
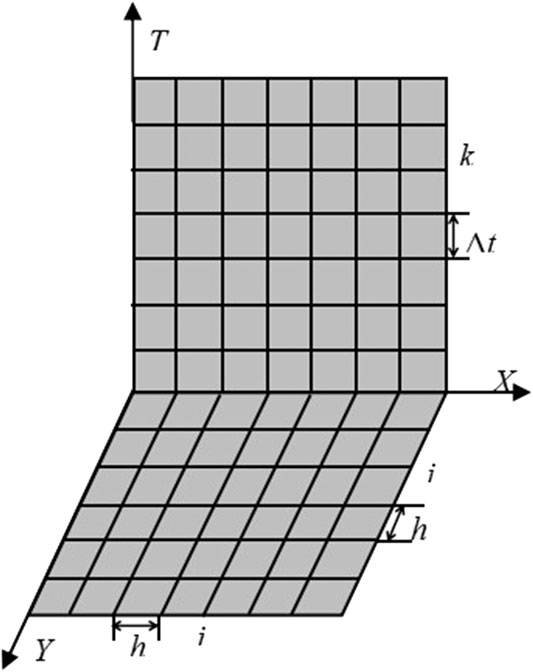
FIGURE 6. Mesh generation of 2D solution region.
The solution process is divided into two steps.
First, the implicit format and explicit format are used in the X direction and the Y direction from the k to k+1/2 layer, respectively, as follows:
Substitution of Eqs. 15–17 into Eq. 12 yields
In Eq. 16, the diffusion coefficient of the k+1/2 layer is half of the sum of the diffusion coefficients of the two points in the same direction, and the implicit format is used for the difference quotient. Eq. 17 represents the diffusion coefficient of the k+1/2 layer in the X direction, and Eq. 18 represents the diffusion coefficient of the k+1/2 layer in the Y direction.
Substituting Eqs. 19–20 into Eq. 18, moving the unknown item of the k+1/2 layer to the one side and the known item of the k layer on the other in the equation, marking r = Δt/h2, and by rewriting into matrix form, a linear equation system in the X direction can be obtained. Its expression is
The initial
Second, the explicit format and implicit format are used in the X direction and the Y direction from the k+1/2 to k+1 layer, respectively. In other words, ∂C/∂x and ∂2C/∂x2 are substituted by the difference quotient of the k+1/2 layer; ∂C/∂y and ∂2C/∂y2 are substituted by the difference quotient of the k+1 layer. The calculation process is the same as the first step. So far, the ADI has been used to completely solve the 2D diffusion equation with variable coefficient of chloride.
Validation of the Chloride Transport Model
Generally, the validation of the chloride transport model under loading is to directly test the results of the transport coefficient, but some literature works give the results of chloride concentration distribution [30, 31], so this section gives the comparison of their validation results.
Validation of Chloride Diffusion Coefficient
In the 2D experiment of chloride diffusion, a nonstandard sample with the size of 100 mm × 100 mm×300 mm was used. Ordinary Portland cement (referred to as cement hereafter) with a strength grade of 42.5R I and Blaine fineness of 369 m2/kg was produced by China United Cement Group. The chemical compositions of the cement and slag were measured with the German S4 EXPLORER X-ray fluorescence spectrometer and are shown in Table 3. It is alkaline with the basicity coefficient [Kb = (CaO + MgO)/(SiO2 + Al2O3)] of 1.07, as can be seen from Table 3.

TABLE 3. Chemical composition of cement (%).
The sample group C1, C2, and C3 represented the w/c of 0.4, 0.5, and 0.6, respectively, and the mix proportion is shown in Table 4. The test temperature and humidity are 25°C and 95%, respectively. The NaCl concentration is wt. 5% (850 mol/m3). The sample predicted with loading and without loading was placed in NaCl solution for 30 days, and the whole diffusion test chamber was placed in the curing chamber. The loading mode of concrete is the same as that of Zhang et al. [30, 31].
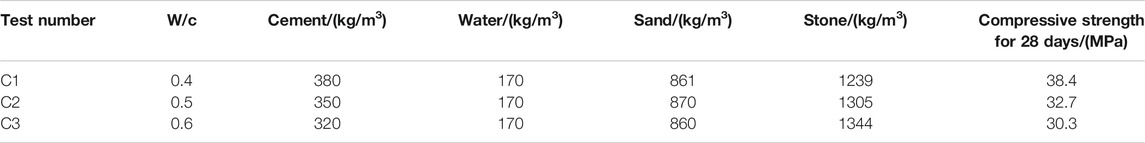
TABLE 4. Mix proportion of concrete.
The chloride diffusion coefficient of the sample is detected by the chloride diffusion coefficient tester of concrete. The samples are cut into a cylinder with a diameter of 100 mm and a height of 50 mm, and put it into the bottom of the rubber bucket, in which there is 300 ml KOH solution, so that both the anode plate and the sample surface are immersed in the solution. Finally, it is placed in KOH + NaCl solution. The schematic diagram of the RCM test device is shown in Figure 7.
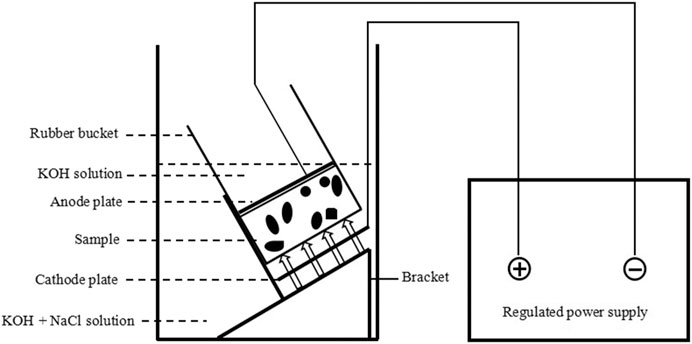
FIGURE 7. Schematic diagram of the RCM test device.
Based on the chloride diffusion model determined in Figure 4, the initial parameters such as curing time, immersed time, water binder ratio, loading, and aggregate content are input into Eqs. 2–11 to obtain the diffusion coefficient of chloride. All experimental data are measured from three samples and averaged. The experimental results are compared with the simulation results, and the results are shown in Figure 8.
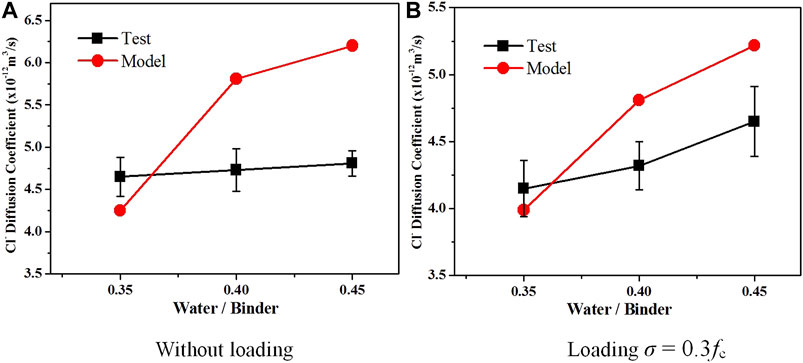
FIGURE 8. Chloride diffusion coefficient of concrete immersed for 30 days.
Figure 8 shows the test and model comparison of chloride diffusion coefficients at different water binder ratios. The results show that the chloride diffusion coefficient of concrete predicted under loading (compressive stress) is lower than that of concrete predicted under without loading, and the maximum error of test is 14.5%. The variation trend of chloride diffusion coefficient between the model value and the test value is consistent and that increases with the increase of the water binder ratio. The difference is that when the water binder ratio is low, the test value is higher than the model value, but when it is higher than 0.4, the result is opposite. Under the same water binder ratio, the maximum error between the test and the model is 28.7%, and the numerical fitting is in good agreement with the experimental results. The chloride diffusion variable coefficient model established is more reasonable.
The chloride diffusion coefficient depends on the change of concrete microstructure under loading and without loading in concrete, such as the amount of hydration products, ITZ volume fraction, pore structure distribution, and cracks. This article also systematically predicted the key microstructure parameters that affect the transport of concrete. Second, the accuracy of predicting chloride diffusion was improved by solving the constitutive relation of diffusion with the variable coefficient. It can be seen from Figure 8 that the overall prediction accuracy of diffusion coefficient is high under loading and without loading. In Figure 8A, there is a large error when w/b = 0.45. This is because the concrete is a heterogeneous material. According to the research of Care [22], Yang [32], and Sun [33] et al., the prediction accuracy of diffusion coefficient is within 30% for concrete, which is considered reasonable.
Verification of the Chloride Concentration Distribution Model
The verification methods of chloride diffusion coefficient are different, so it is necessary to verify the chloride concentration distribution in concrete. The verification of the 2D chloride concentration is more meaningful in practical engineering.
The two different diffusion directions for each of the samples were taken, and holes from the outside to the inside for sampling were drilled. The range was 2.5–27.5 mm, the distance interval was 5 mm, and the number of sampling points was 5. The powder obtained from the sampling points was mixed, and the Cl− concentration test was performed by using a portable chloride tester.
The experimental data and simulation results were compared when the loading σ is 0.3fc and the results are as follows:
(a) 3D figure of w/c=0.5
(b) Cl- concentration in different w/c
Figure 9A shows the 3D distribution of Cl− concentration of concrete with the w/c of 0.5 under the action of loading σ is 0.3fc after 30 days diffusion in two different directions. Figure 9B shows the comparison between the test value and the model value of the w/c of 0.4, 0.5, and 0.6 when the σ is 0.3fc. It can be seen from the figure that the distribution trend of Cl− concentration of the test value agrees with the model value. Due to the limitation of the simulation conditions and the measurement error, there is an error between the model value and test value, but it is basically within 40% when x < 10 mm. Therefore, the model with the diffusion variable coefficient of chloride established can predict the distribution of Cl− concentration in concrete scientifically.
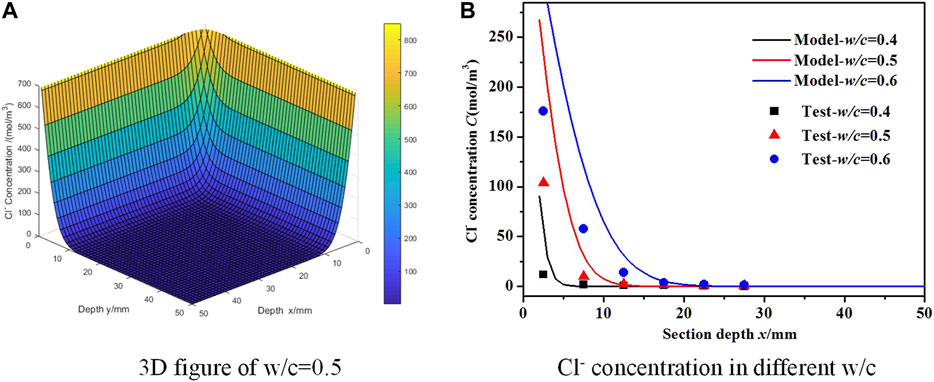
FIGURE 9. Comparison between experimental and theoretical Cl− concentration.
Zhang [30, 31] carried out 2D diffusion test of chloride in concrete under loading and without loading. In the test, the w/c is 0.35, and the sample size without loading and bending load is 100 mm × 100 mm×100 mm and 70 mm × 70 mm × 250 mm, respectively. The stress ratio is 0.35, the NaCl concentration in the environment is 350 g/L (5.98 × 10³ mol/m3), and the distribution of Cl− concentration is measured after soaking for 365 days in NaCl solution. The above parameters are introduced into the diffusion model (Eqs. 2–12) established to simulate the distribution of Cl− concentration after 365 days, and the results are shown in Figure 10A. The theoretical values are basically the same as the experimental results, and the maximum error is 20%, indicating that the numerical fitting of the model is highly consistent with the experimental results, and the model established has high reliability in this article.
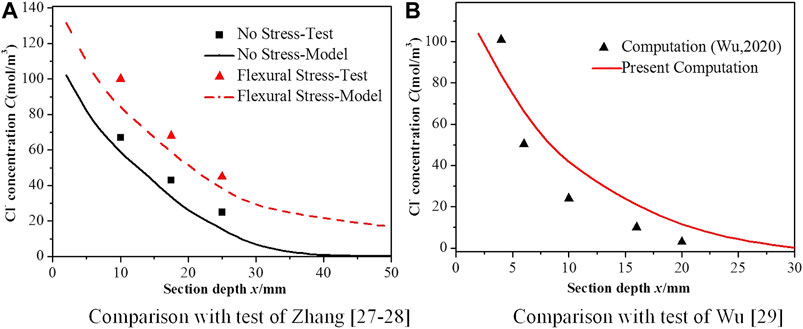
FIGURE 10. Experimental verification of 2D diffusion variable coefficient of chloride.
In addition, Wu et al. [34] have also conducted a host of experiments to characterize the distribution of Cl− concentration in 2D direction. In the test, the w/c is 0.54; the size of the sample is 100 mm × 100 mm×400 mm, the NaCl concentration is 3.5% in the environment, and the distribution of Cl− concentration is measured after soaking for 180 days in concrete. The above test parameters are introduced into the diffusion model in this article, and the simulation results are shown in Figure 10B. The theoretical values are basically the same as the experimental results, and the maximum error is 18%, further indicating that the model established is more reliable in this article.
Influence of Loading on Chloride Concentration Distribution
Model parameters are w/c = 0.45, σ = 0, 0.3fc and −0.3fc, L = 100 mm, C0 = 20 mol/m3, T = 200 days, and the step length of depth and time is 2 mm and 1 day, respectively. The selected point is as follows: A (5 mm, 5 mm), B (15 mm, 15 mm), C (25 mm, 25 mm), and D (35 mm, 35 mm).
It indicates that the Cl− concentration at the same depth is the same at different directions in Figure 11A, and when the depth is greater than 30 mm, there is a concentration-level surface. Among (a), (b), and (c), the concentration level of (b) is larger and the concentration level of (c) is smaller, and the smaller the concentration level, the greater the Cl− concentration in Figure 11.
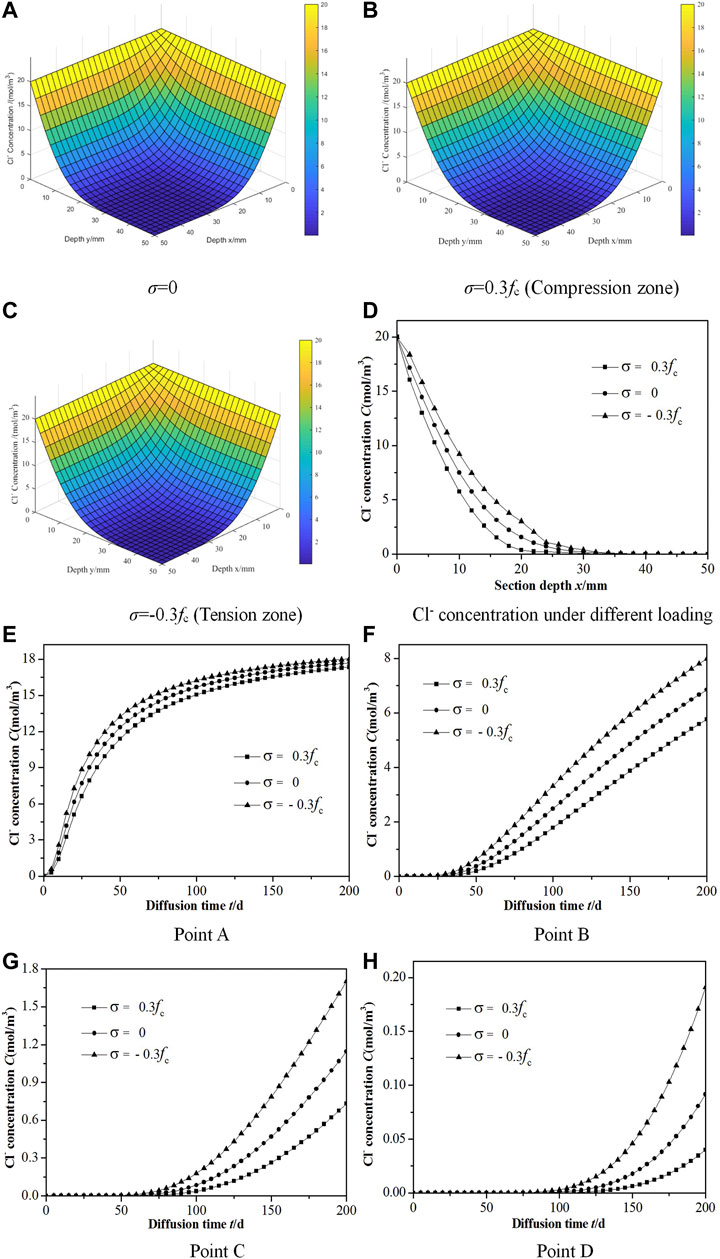
FIGURE 11. Distribution of Cl− concentration in concrete under different loading.
In Figure 11D, the Cl− concentration in concrete under different loading decreases with the increase of depth. At the same depth, the Cl− concentration is smaller in the compression zone, while that in the tension zone is larger, and that in the without loading zone is between the two. For example, when x = 10 mm and σ = 0.3fc, 0, and −0.3fc, the Cl− concentration is 5.7 mol/m3, 7.4 mol/m3, and 9.2 mol/m3, respectively. It is because the loading will affect the change of the porosity in the concrete. For example, under the bending load, the porosity p in the tension zone of the concrete increases (see Eq. 7a), resulting in a larger diffusion coefficient (Dcp) in cement matrix (see Eq. 3a), and the final effective diffusion coefficient (Deff) will also be greater (see Eq. 2).
It indicates that the distribution trend of Cl− concentration is the same under different loading, but the diffusion rate is different in Figure 11E. For example, when T = 0–100 days, the diffusion rate is about 0.15, while when T = 100–200 days, the diffusion rate is about 0.01, which is a huge difference. Compared with no stress, the results of chloride diffusion are quite different in the tension zone and the compression zone. For example, when T = 150 days and σ = 0.3fc, 0, and –0.3fc, the Cl− concentration is 16.4 mol/m3, 17.1 mol/m3, and 17.6 mol/m3, respectively.
Compared with (f) and (e) in Figure 11, the diffusion rate of chloride is stable after 50 days, and the relationship between Cl− concentration and diffusion time is approximately linear. In Figure 11, the distribution trend of Cl− concentration in (g) and (h) is the same as that in (f), but the difference is the occurrence time and rate of diffusion. The diffusion of point C and point D occurs at T = 75 days and 100 days, and the diffusion rate of the two gradually increases, which is different from the diffusion rate of point B that is approximately fixed, and point A gradually decreases. Because the greater the depth x, the greater the number of cycles at the same depth step, that is, the greater the M value (see Eq. 13). The chloride concentration under σ = -0.3fc is 42.1% higher than that under σ = 0.3fc when the diffusion time is 200 days and the concrete depth is 15 mm. When chloride is continuously diffusing into the concrete, there will be chloride accumulation at the place where x is smaller. In the 2D diffusion progress of chloride, the diffusion rate of chloride is different at the intersection point with the same distance from the adjacent diffusion surface. The smaller the depth x, the higher the increasing rate of Cl− concentration. The trend of Cl− concentration under different loading is the same as that under without loading, but the Cl− concentration in the tension zone is significantly higher than that in the compression zone.
Conclusion
1) Based on micromechanics theory and porous medium theory, the effective diffusion coefficient model of chloride was established in concrete, considering the significant factors such as the w/c, hydration degree, ITZ volume fraction, porosity, and diffusion coefficient. The quantitative relationship among p, p0, and σ was determined, and the 2D diffusion equation of chloride was solved in concrete based on the theory of elasticity and material mechanics. The 2D diffusion model of chloride with a variable coefficient was proposed based on Fick's second law.
2) Based on the 2D parabolic partial differential equation formed by Fick’s second law, the 2D diffusion variable coefficient of chloride was systematically solved. The ADI of numerical analysis was used to deduce the numerical solution of the 2D diffusion equation of chloride. The distribution of Cl− concentration was obtained by programming in concrete. The model reliability was verified by the experiments and literatures. The simulation results were basically consistent with the experimental results.
3) The results of variable coefficient showed that the concrete eroded by chloride and the distribution of Cl− concentration was stepwise, which was decreasing from outside to inside along the concrete surface. The bending load affected the porosity of the cement matrix, and then the diffusion coefficient of chloride was changed in concrete. The compression zone and tension zone were formed in the concrete, and the Cl− concentration under tension zone was 42.1% higher than that under compression zone when the diffusion time was 200 days and the concrete depth was 15 mm.
Data Availability Statement
The original contributions presented in the study are included in the article/Supplementary Material; further inquiries can be directed to the corresponding author.
Author Contributions
LZ have made contributions to the conception or design of the work; or the acquisition, analysis, or interpretation of data for the work. JZ have contributed to the building of the model. GS have drafted the substantial work or revised it for important intellectual content. ZL have made an important contribution to the theoretical calculation of the article.
Funding
This work was supported by the Fundamental Research Funds for the Central Universities and the National Natural Science Foundations of China (No. 51778378).
Conflict of Interest
The authors declare that the research was conducted in the absence of any commercial or financial relationships that could be construed as a potential conflict of interest.
References
1. Zhang W-M., Ba H-J., Chen S-J. Effect of Fly Ash and Repeated Loading on Diffusion Coefficient in Chloride Migration Test. Construction Building Mater (2011) 25(5):2269–74. doi:10.1016/j.conbuildmat.2010.11.016
2. Yang L, Ma Q, Yu B. Analytical Solution and Experimental Validation for Dual Time-dependent Chloride Diffusion in Concrete. Construction Building Mater (2018) 161:676–86. doi:10.1016/j.conbuildmat.2017.11.176
3. Jin WL, Yan YD, Wang HL. Research Progress on the Chloride Transportation in Stressed Concrete[J]. Chin Silicate Soc (2010) 38(11):2217–24. doi:10.14062/j.issn.0454-5648.2010.11.035
4. Tegguer AD, Bonnet S, Khelidj A, Bouny VB. Effect of Uniaxial Compressive Loading on Gas Permeability and Chloride Diffusion Coefficient of Concrete and Their Relationship[J]. Cement Concrete Res (2013) 52:131–9. doi:10.1016/j.cemconres.2013.05.013
5. Wang H, Lu C, Jin W, Bai Y. Effect of External Loads on Chloride Transport in Concrete. J Mater Civ Eng (2011) 23(7):1043–9. doi:10.1061/(asce)mt.1943-5533.0000265
6. Gowripalan N, Sirivivatnanon V, Lim CC. Chloride Diffusivity of Concrete Cracked in Flexure. Cement Concrete Res (2000) 30(5):725–30. doi:10.1016/s0008-8846(00)00216-7
7. Xi Y, Bažant ZP. Modeling Chloride Penetration in Saturated Concrete. J Mater Civil Eng (1999) 11(1):58–65. doi:10.1061/(asce)0899-1561(1999)11:1(58)
8. Liu Q-f., Feng G-l., Xia J, Yang J, Li L-y. Ionic Transport Features in Concrete Composites Containing Various Shaped Aggregates: a Numerical Study. Compos Structures (2018) 183(1):371–80. doi:10.1016/j.compstruct.2017.03.088
9. Cao TN, Zhang LJ, Sun GW, Wang CH, Zhang Y, Wang PS, et al. Simulation of Chloride Ion Transport in Concrete under the Coupled Effects of a Bending Load and Drying–Wetting Cycles[J]. Construction Building Mater (2020) 241:118045. doi:10.1016/j.conbuildmat.2020.118045
10. Garboczi EJ, Bentz DP. Computer Simulation of the Diffusivity of Cement-Based Materials. J Mater Sci (1992) 27(8):2083–92. doi:10.1007/bf01117921
11. Zhang Y, Liu C, Liu Z, Liu G, Yang L. Modelling of Diffusion Behavior of Ions in Low-Density and High-Density Calcium Silicate Hydrate. Construction Building Mater (2017) 155(30):965–80. doi:10.1016/j.conbuildmat.2017.08.128
12. Sun G, Zhang J, Zhang L, Cao T, Wang P, Zhang Y, et al. M-T Scheme for Predicting Effective Diffusion Coefficient of Chloride Ions in Cement-Based Materials. J Wuhan Univ Technol.-Mat Sci Edit (2020) 35(3):520–7. doi:10.1007/s11595-020-2288-3
13. Xu J, Li FM. Analytical Model for Load Dependence of Chloride Penetration into Concrete[J]. J Mater Civil Eng ASCE (2017) 29(5):04016279. doi:10.1061/(asce)mt.1943-5533.0001823
14. Xu J, Li F. A Meso-Scale Model for Analyzing the Chloride Diffusion of Concrete Subjected to External Stress. Construction Building Mater (2017) 130(1):11–21. doi:10.1016/j.conbuildmat.2016.11.054
15. Xu J, Li F, Zhao J, Huang L. Model of Time-dependent and Stress-dependent Chloride Penetration of Concrete under Sustained Axial Pressure in the Marine Environment. Construction Building Mater (2018) 170(3):207–16. doi:10.1016/j.conbuildmat.2018.03.077
16. Li W, Guo L. A Mechanical-Diffusive Peridynamics Coupling Model for Meso-Scale Simulation of Chloride Penetration in Concrete under Loadings. Construction Building Mater (2020) 241:118021. doi:10.1016/j.conbuildmat.2020.118021
17. Jin L, Du X, Ma G. Macroscopic Effective Moduli and Tensile Strength of Saturated Concrete. Cement Concrete Res (2012) 42(12):1590–600. doi:10.1016/j.cemconres.2012.09.012
18. Xu W, Zhang Y, Jiang J, Liu Z, Jiao Y. Thermal Conductivity and Elastic Modulus of 3D Porous/fractured Media Considering Percolation. Int J Eng Sci (2021) 161:103456. doi:10.1016/j.ijengsci.2021.103456
19. Liu Z, Xu D, Gao S, Zhang Y, Jiang J. Assessing the Adsorption and Diffusion Behavior of Multicomponent Ions in Saturated Calcium Silicate Hydrate Gel Pores Using Molecular Dynamics. ACS Sustain Chem. Eng. (2020) 8:3718–27. doi:10.1021/acssuschemeng.9b06817
20. Zhang J, Zhang L, Sun G, Wang C. Modeling and Software Development of the Interfacial Transition Zone of Ellipsoidal Aggregate in Cement-Based Composites. J Wuhan Univ Technol.-Mat Sci Edit (2019) 34(3):648–55. doi:10.1007/s11595-019-2099-6
21. Liu C, Liu Z, Zhang Y. A Multi-Scale Framework for Modelling Effective Gas Diffusivity in Dry Cement Paste: Combined Effects of Surface, Knudsen and Molecular Diffusion. Cement Concrete Res (2020) 131:106035. doi:10.1016/j.cemconres.2020.106035
22. Caré S. Influence of Aggregates on Chloride Diffusion Coefficient into Mortar. Cement Concrete Res (2003) 33(7):1021–8. doi:10.1016/s0008-8846(03)00009-7
23. Zhang JJ, Zhou XZ. Analytical Solution for the Chloride Diffusivity of Hardened Cement Paste[J]. J Mater Civil Eng ASCE (2008) 20(5):384–91. doi:10.1061/(ASCE)0899-1561(2008)20:5(384)
24. Zuo XB, Sun W, Li H, Zhou WJ. Calculation of Ion Diffusion Coefficient Related to Concrete Deterioration Based on Debye-Huckel-Onsager Theory[J]. J Southeast University(English Edition) (2010) 26(4):569–73. doi:10.14062/j.issn.1003-7985.2010.4.026
25. Sun GW, Sun W, Zhang YS, Liu ZY. Prediction of the Effective Diffusion Coefficient of Chloride Ions in Cement-Based Composite Materials. J Mater Civ Eng (2012) 24(9):1245–53. doi:10.1061/(asce)mt.1943-5533.0000477
26. Garboczi EJ, Bentz DP. Multiscale Analytical/Numerical Theory of the Diffusivity of Concrete. Adv Cement Based Mater (1998) 8(2):77–88. doi:10.1016/s1065-7355(98)00010-8
27. Garboczi EJ, Bentz DP. Analytical Formulas for Interfacial Transition Zone Properties [J]. Adv Cement Based Mater (1997) 6(3-4):99–108. doi:10.1016/s1065-7355(97)90016-x
28. Du X, Jin L, Ma G. A Meso-Scale Numerical Method for the Simulation of Chloride Diffusivity in Concrete. Finite Elem Anal Des (2014) 85(8):87–100. doi:10.1016/j.finel.2014.03.002
29. Guo A, Li H, Ba X, Guan X, Li H. Experimental Investigation on the Cyclic Performance of Reinforced Concrete Piers with Chloride-Induced Corrosion in Marine Environment. Eng Structures (2015) 105(11):1–11. doi:10.1016/j.engstruct.2015.09.031
30. Zhang Y, Sun W, Chen S, Guo F. Two- and Three-Dimensional Chloride Ingress into Fly Ash Concrete. J Wuhan Univ Technol.-Mat Sci Edit (2011) 26(5):978–82. doi:10.1007/s11595-011-0348-4
31. Zhang Y-s., Sun W, Liu Z-y., Chen S-d. One and Two Dimensional Chloride Ion Diffusion of Fly Ash Concrete under Flexural Stress. J Zhejiang Univ Sci A (2011) 12(9):692–701. doi:10.1631/jzus.a1100006
32. Yang CC, Su JK. Approximate Migration Coefficient of Interfacial Transition Zone and the Effect of Aggregate Content on the Migration Coefficient of Mortar. Cement Concrete Res (2002) 32(10):1559–65. doi:10.1016/s0008-8846(02)00832-3
33. Sun G, Zhang Y, Sun W, Liu Z, Wang C. Multi-scale Prediction of the Effective Chloride Diffusion Coefficient of Concrete. Construction Building Mater (2011) 25(10):3820–31. doi:10.1016/j.conbuildmat.2011.03.041
Keywords: concrete, chloride transport, variable coefficient, bending load, numerical simulation
Citation: Zhang L, Zhang J, Sun G and Liu Z (2021) Multi-Scale Simulation of Two-Dimensional Chloride Transport Under the Effect of Bending Load in Concrete. Front. Phys. 9:673764. doi: 10.3389/fphy.2021.673764
Received: 28 February 2021; Accepted: 28 April 2021;
Published: 21 May 2021.
Edited by:
Wenxiang Xu, Hohai University, ChinaReviewed by:
Zhigang Zhu, Jiangsu University, ChinaKaterina Ioannidou, UMR5508 Laboratoire de mécanique et génie civil (LMGC), France
Copyright © 2021 Zhang, Zhang, Sun and Liu. This is an open-access article distributed under the terms of the Creative Commons Attribution License (CC BY). The use, distribution or reproduction in other forums is permitted, provided the original author(s) and the copyright owner(s) are credited and that the original publication in this journal is cited, in accordance with accepted academic practice. No use, distribution or reproduction is permitted which does not comply with these terms.
*Correspondence: Zhiyong Liu, bGl1emhpeW9uZzA3MjhAMTYzLmNvbQ==