 Suresh Kumar
 Sonia Sharma1
 Sandeep Dahiya
- 1Department of Electronics and Communication Engineering, University Institute of Engineering and Technology, Maharshi Dayanand University, Rohtak, India
- 2Department of Electronics and Communication Engineering, Bhagat Phool Singh Women University Khanpur-Kalan, Sonipat, India
The demand for data transmission is rising expensively for the applications of biomedical sensors data, multimedia technologies, and ultrahigh-definition online video streaming. Such applications require larger bandwidth with minimum latency and seamless service delivery. Radio-over-fiber (RoF), integrated with wavelength division multiplexing (WDM) technology, is being considered one of the promising technologies. However, the integration of optical fiber and wireless communication also generates non-linear effects as and when the number of users increases. That results in the introduction of signal noise, unwanted frequencies, low quality of signals, and increased latency. In this paper, a 16-channel 160 Gbps data rate WDM-based RoF system has been simulated and evaluated for optimum performance at a variable input power level, from 5 to −15 dBm, with the application of dispersion compensation fiber (DCF) and fiber Bragg grating (FBG), with channel spacing of 50 and 100 GHz. The performance of the system is evaluated with the existing WDM-RoF system. The performance metrics parameters chosen for evaluation are bit error rate (BER), quality factor (Q-factor), and eye diagrams and simulated on opti-system simulator. The optimum performance has been observed at a power level of −5 dBm for all these elected evaluation parameters. It has also been observed that, for channel spacing of 100 GHz, the network performed better in comparison with 50 GHz.
Introduction
With time, the need for superfast transmission speed of data is growing. Nowadays, it is difficult to imagine life without video calls, online high-resolution video streaming, biomedical sensors data aggregation, online gaming, virtual reality experience, artificial intelligence (AI), and the list goes on. All these technologies require high bandwidth, high transmission speed, and minimum disturbance possible. Optical fiber communication plays a vital role in our modern age communication systems.
In RoF technology, the modulated RF signal is carried by uplink and downlink between central station (CS) and base station (BS) [1, 2]. These data are transported, using an optical fiber link. However, the optical fiber introduces various non-linearities while transmitting data through it [3]. These non-linearities produce both generative and degenerative effects in the communication system. Non-linear effects also enhance the fiber performance; hence, they offer innovative applications, such as fiber lasers, multiplexers, demultiplexers, etc. On the other hand, the disadvantage of the non-linear effects is that they limit the optical fiber communication. In RoF, the centralization of BS and reduced cell size offers uninterrupted high-data speed to serve a maximum number of customers. It also decreases the installation cost, operational cost, and maintenance cost of the system, and, hence, the overall fixed cost of the system installation decreases [4]. Dahiya et al. discussed the effects of PMD and have used a hybrid optical amplifier to achieve enhanced capacity in the polarization division multiplexed (PDM-QAM) system [5].
Jia et al. proposed a novel method for a link distance of 40 km and a data rate of 2.5 Gbps in a RoF system. The carrier suppression technique is used for downlink, while utilizing this carrier for uplink communication results in obviating the requirement of the optical source at the BS end. However, this method exhibited a power penalty of 1.2 dB [6]. Lin et al. employed a null-biased MZM for modulating the light into central carrier suppressed double side band (CCS-DSB) and a central carrier added DSB (CCA-DSB) master and a dual-mode colorless laser diode in order to establish 5G-based 39-GHz mm-wave over the fiber system for a perfect fusion between the fiber and mm-wave to deliver 36 Gbps for baseband and 4-Gbps free-space transmissions. A comparison of different injection-locking masters was also performed that revealed a CCS-DSB master injection-locked slave colorless laser diode, superior with best back-to-back performance in comparison with the CCA-DSB and the dual distributed feedback laser diodes (DFBLD) [7].
The combination of RoF with the WDM technology enhances cellular communication availability even in remote areas. In WDM, different wavelengths carry different signals, and many wavelengths travel through a single optical fiber. Therefore, different signals with different wavelengths are combined and then transmitted through a single optical fiber and then separated at the end [8]. This results in a high-data rate, the larger capacity of the system, more flexibility, a decrease in cost, and a simple network design, hence an enhanced optical communication system in all forms. Kim et al. evaluated WDM RoF applications, using SOA and implemented frequency up conversion by the FWM effect; they observed that the simultaneous up conversion of eight channels was achieved, almost a negligible crosstalk and with no error. This proves that WDM RoF technology is certainly a better choice of a broadband wireless access network [9].
A basic WDM RoF system is depicted in Figure 1. The electrical data received from an individual sensor is fed into the transmitter (present at the CS), which consists of an RF modulator, a continuous wave (CW) laser, and MZM. Then, it is fed to the multiplexer; likewise, all transmitters feed λ1…λn into the multiplexer. The multiplexer then combines all these wavelengths and then passes it on through an optical fiber to the demultiplexer. The demultiplexer separates all the wavelengths and passes them to the receiver BS. The BS consists of a photodiode and a filter. The signal is then transmitted through an antenna to other mobile stations.
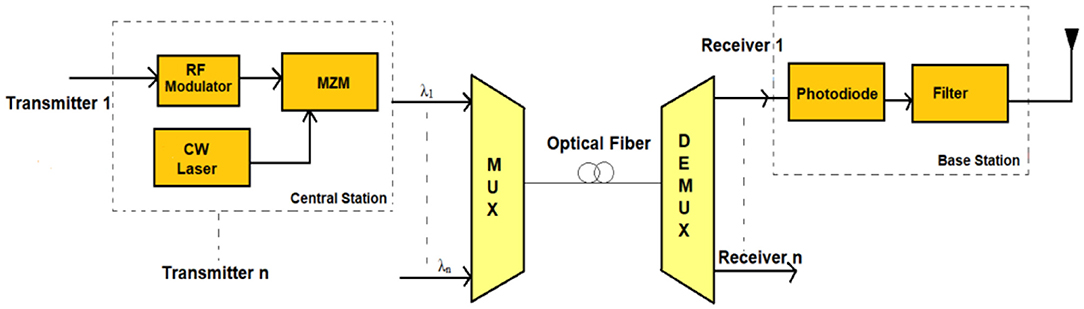
Figure 1. Basic WDM-based RoF system.
The present research work involves the design of a 16/160 Gbps WDM-RoF system, utilizing the hybrid combination of DCF and FBG for the mitigation of non-linearities. Section Non-linearities in the propagation path categorizes the non-linearities that occur in the path link and the impact on the system quality. The designed simulation schematic is described in section Simulation Design, with the selected parameter values. The section Results and Discussion contains the result and discussion, and section Conclusion concludes the paper.
Non-Linearities in the Propagation Path
Fiber non-linearities are basically subdivided into two categories. The first one relates to the index, which includes the non-linearities that occur because of intensity-dependent disparities in the refractive index of the optical fiber and is broadly named as “Kerr effect.” The Kerr effect is further subdivided into different non-linearities, known as “SPM,” “XPM,” and FWM. The second category is related to scattering non-linearities and because of inflexible stimulated scattering, which is further classified as SRS and SBS [10].
SPM—it is, basically, the self-induced phase shift, which is observed in the fiber when the optical signal is transmitted through the optical fiber. In other words, this phenomenon can also be termed as “phase modulation” of light due to the fact of varying light intensity. It results in the broadening of the signal spectrum. When the light signal travels through fiber, it leads to high intensity of light in the core, which further results in a higher refractive index. The variation of the refractive index with respect to time takes place due to variation in light signal intensity, and this further leads to phase changes, which are purely time dependent. Nain et al. investigated the performance of MZM and optical phase modulator (OPM) under the SPM effect in the RoF system [11].
XPM—in the XPM non-linearity, one wavelength of light can affect the phase of another light wavelength. Here, the refractive index non-linearity of one light signal is not only dependent on its own intensity but also gets affected by the intensity of other light signal beams while these are propagating into the fiber. It results in translation of power variations from one wavelength channel to the phase variations of another channel. Nain et al. evaluated the influence of the XPM crosstalk in SCM-based RoF systems. It has been observed that the crosstalk increases for the greater transmission distance and higher modulation frequency [12].
FWM–it gets observed when channel spacing is comparatively less, i.e., wavelength channels are placed very close to each other. Channel spacing and a fiber type result in variation in the FWM effects. These wavelengths, while propagating through the fiber simultaneously, create another new wavelength, which is named as “idler” due to the effect of FWM. This new wavelength is entirely different from all other wavelengths, given as input to the system [13].
where fx,fy,fz = frequency of input signals and fxyz = frequency of a resultant signal.
The equations below represent the high-order dispersion parameters of FWM in terms of propagation constant ‘b' by Taylor series;
Now, , where δ is the propagation delay per optical length. We will replace the values in Equation (2);
Therefore, by 4, second-order dispersion is given by
Third order dispersion is given by
where △ f = channel spacing and F0 = fiber chromatic dispersion
The power of the resultant FWM signal is expressed as
where L = fiber length;
λ = wavelength;
c = speed of light;
D = a degrading factor;
X = non-linear susceptibility;
Px Py Pz = power of the input signal with frequency fx, fy, and fz, respectively;
Aef = the effective area of the optical fiber core;
α = loss coefficient; and
n = the refractive index
When input channels increase, the FWM sideband products also increase. When an equal amount of power is given as input to all the channels and phase matching is maintained, then the following equation holds true:
where γ denotes a non-linear coefficient, Pi is the input power, and DFis 2 for each channel having a different frequency.
With an increase in optical power levels, the FWM effects get observed significantly. Processes such as wavelength conversion and de-multiplexing are the basic applications of FWM. Kathpal and Garg have presented the simulations of the studied 8/32 RoF-BF system and found out that the FWM effects are lesser when there is a reduction in the power level and enhancement in channel spacing [14].
SRS—in the WDM fiber communication system, SRS plays an important role. The photons of the light signal interact with the molecular vibrations of the fiber, and these also interact with the photons of the other light signals while using the same single fiber for the propagation of light. Because of these interactions, the generation of scattered light takes place. It has also been concluded that the wavelength of the resultant light is comparatively longer than all other light signals [15]. Nain et al. have observed that the SRS-induced crosstalk level varies due to variation in modulation frequency and optical power. It has also been noticed that the crosstalk remains almost unchanged with respect to variation in transmission link length [16].
SBS—it has been observed that the scattering of light is in the backward direction. In order to reduce the SBS effect, the possible solution is to keep the input power below the threshold of SBS or increase the spectral line width of the source itself. SBS effects are found to be related to the bandwidth of the input light signal and the type of the optical fiber [17].
Dispersion—it causes the light pulse to spread as it propagates through the fiber. Chromatic dispersion is one of the main factors responsible for the power penalty that limits the RoF link performance. Li et al. proposed two stages, heterodyning in a millimeter-wave RoF system, one at a millimeter-wave mixer and the other at FBG in BS. The system overall performed well with suppression of redundant frequency tones and no deterioration of power due to chromatic dispersion [18]. Li et al. proposed a carrier-phase-shifted DSB modulation in the RoF system to achieve high linearity without using additional RF or optical components and to reduce the effects of power fading due to dispersion. The RoF system has been verified with maximum frequency shifted to 10 and 15 GHz for 25- and 39-km ranges, with SFDR of 111.3 dB Hz2/3, which is greater than the conventional SSB modulation by 10 dB [19].
Cui et al. presented a parallel configuration of the electro-optic phase and intensity modulator to reduce the effect of chromatic dispersion (CD) over a 34-km link for a wide bandwidth of 0–18 GHz. The CD-induced power fading has been sufficiently compensated by appropriate adjustment of optical power and the time delay among the signals from different modulators. Furthermore, the proposed link is compared with the DSB-based link, and enhancement of up to 31 dB Hz2/3 in spurious free dynamic range (SFDR) has been observed [20]. Tsai et al. used an injection-locked colorless laser diode in a 40 Gbps 256-QAM-based OFDM system over a distance of 25 km. By careful adjustment of a bias current and pre-leveling of the modulation throughput, the dispersion-induced fading has been reduced prior to transmission [21]. Tsai et al. proposed a 60-GHz mm-WoF system via a directly modulated dual-mode laser diode (DMLD), with suppressed third order intermodulation dispersion for transmitting 16-QAM-modulated OFDM data at 6Gbps over a 4-km fiber and 3-m wireless distance. The power fading effect was restricted with improved BER and a power penalty of 1.1 dB [22]. The apodized and linearly chirped FBG (LCFBG) has been incorporated in the present system design so that the sidelobe levels and ripples in group delay response can be suitably reduced. The Gaussian apodization function is applied because of its maximum reflectivity and reduced side lobes characteristics.
Simulation Design
We have designed a 16-channel 160 Gbps WDM-RoF system with each channel operating at 10 Gbps, using Optisystem 16.1 [M/s Optiwave Systems Inc. (OPTIWAVE) at Ottawa, ON, Canada]. The diagram representing the 16/160 WDM-RoF setup is illustrated in Figure 2A. The transmitter section comprises 16 RF signals that are combined, using a WDM multiplexer, and are transmitted over an optical fiber at 60-km transmission distance.
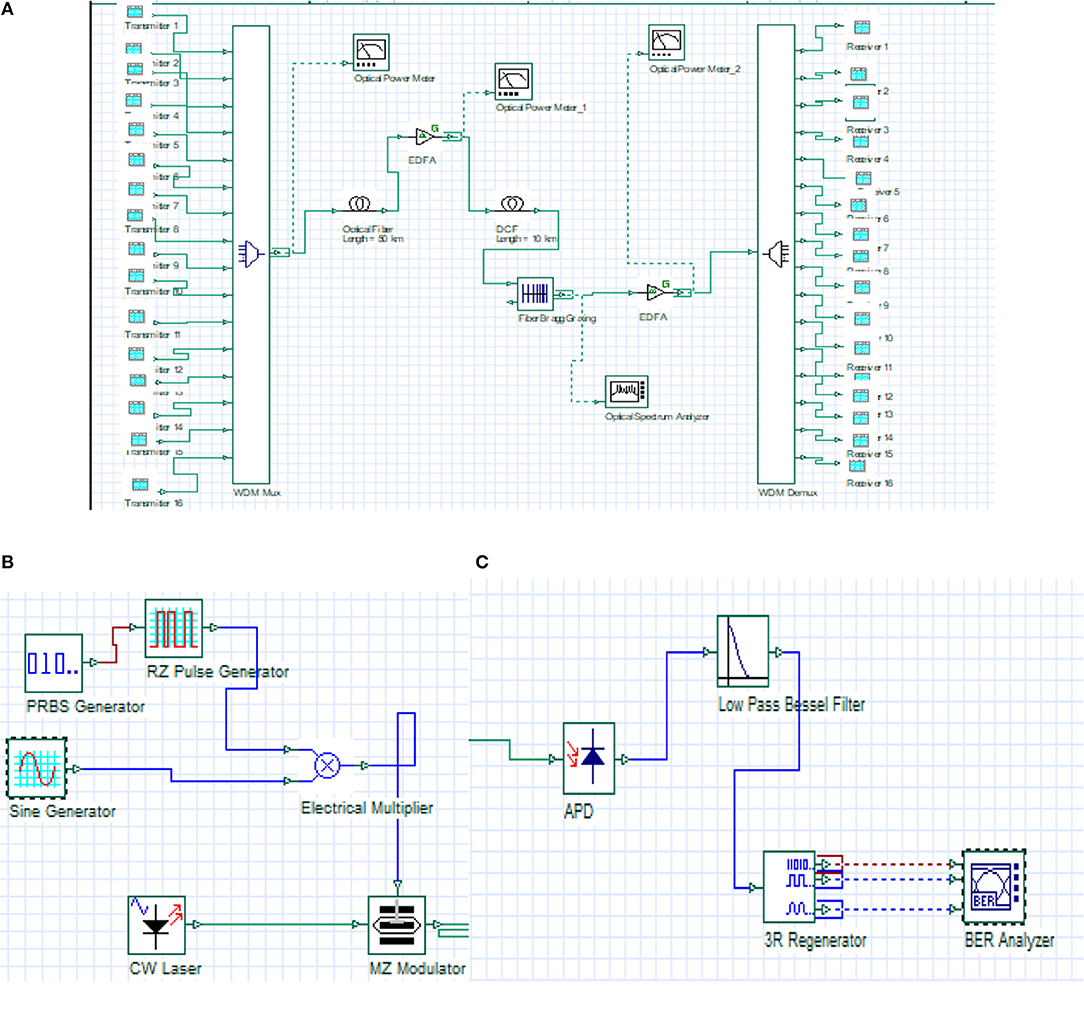
Figure 2. Schematic representation of the simulation layout of the 16/160-Gbps WDM-RoF system, transmitter, and receiver subsystem. (A) The layout of the 16/160-Gbps WDM-RoF system. (B) Transmitter subsystem. (C) Receiver subsystem.
Figure 2B depicts the transmitter subsystem. Each transmitter includes a pseudorandom bit sequence (PRBS) generator that generates binary data at a 10-Gbps data rate, which is given to the return-to-zero (RZ) pulse generator for baseband signal generation. The RZ coding format has been used due to its increased fairness to fiber non-linear effects. It is then multiplexed over the RF sinusoidal source. The MZM provides optical modulation, using a high-frequency optical carrier signal generated by the CW laser.
Optical signals of different wavelengths from all the CW lasers are modulated and, thereafter, combined, using the WDM multiplexer to enhance the data transmission capacity. This multiplexed signal is transmitted through a single-mode fiber (SMF). The SMF has been used, because, in comparison to multi-mode fiber (MMF), SMF is capable of carrying an optical signal at a higher data rate for a larger link length, although the optical signal also suffers due to higher order dispersion and non-linearities, which may result in limiting the transmission distance. In the present network simulation, erbium-doped fiber amplifier (EDFA) has been included because it can provide the necessary amplification of the optical signal while creating minimum internal noise.
The amplifier has been inserted after the SMF and acts as an in-line amplifier. Thereby, the EDFA provides amplification to the weak input signal and brings it to a precise level to compensate for the transmission losses. Furthermore, to compensate for the link losses and dispersion effects, DCF and FBG are also incorporated in the network system design. The amplified signal passes through DCF. Here, the DCF provides equal and opposite dispersion at the rate of −80 ps/nm/km so that the chromatic dispersion can be brought to nearly zero. FBGs are designed by exposing the fiber core to highly intense UV light. This results in an increase in the refractive index of the fiber core, which produces a fixed modulation index, known as “grating” [23]. This arrangement is found to be employing a low-cost filter in reducing the chromatic dispersion and also works as a wavelength selector. The apodized and linearly chirped FBG (LCFBG) has been incorporated in the present system design so that the side lobe levels and ripples in the group delay response can be suitably reduced. The Gaussian apodization function is applied because of its maximum reflectivity and reduced side lobes characteristics.
Since the data from the biomedical sensors have to be of very high quality and least BER, therefore, for improved receiver sensitivity and required SNR, a preamplifier is used before the receiver. The signal, after passing through a WDM demultiplexer, is received by 16 remote stations.
The receiver subsystem shown in Figure 2C comprises of an avalanche photodiode detector (APD) for optical to electrical conversion, a fourth-order low-pass Bessel filter for noise removal, 3R regenerator for recreation of an original electrical signal, and BER analyzer for the visualization of the results. The optical power meter has also been used to examine the impact of non-linearities. Table 1 below shows the simulation parameters used in the designed layout.
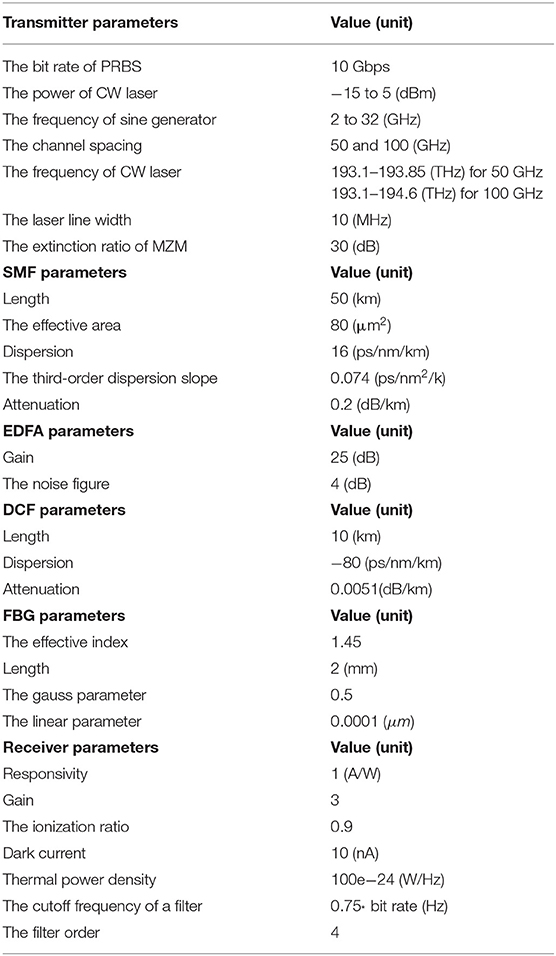
Table 1. The simulation parameters employed in the design of 16/160-Gbps WDM-RoF system.
Results and Discussion
The simulated 16-channel WDM-RoF optical communication network has been analyzed, with variation in input transmission power, using performance metrics: Q factor, BER, and eye diagrams. Furthermore, the results are justified with the help of the eye diagrams. The two different network configurations—(i) the simple optical fiber link (ii) the optical fiber, with combination of DCF-FBG at two different channel spacing scenarios of 50 and 100 GHz—are taken into consideration.
Figure 3 above shows the variation of Q factor with variation in input power for three different channels (channels 1, 8, and 16) at channel spacing of 50 GHz. The input power is varied from 5 to −15 dBm in a step size of 5 dBm.
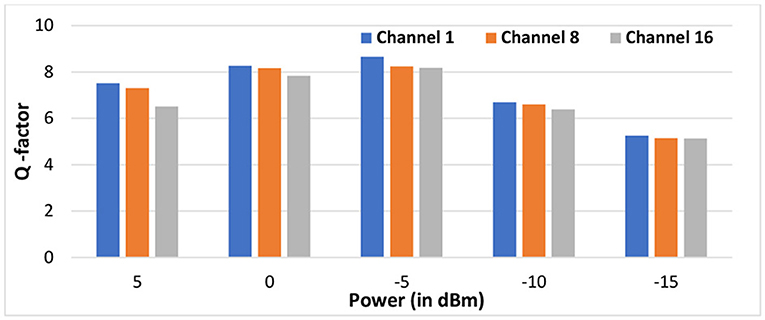
Figure 3. Variation of Q factor with input power at 50 GHz channel spacing.
From Figure 3, for a particular input power, the value of Q Factor shows a decreasing trend, with the increase in the number of input channels. Furthermore, with variation in input power from 5 to −15 dBm, the value of Q factor first increases from 7.42, 7.20, and 6.41 at 5 dBm to 8.58, 8.19, and 8.13 at −5 dBm for channels 1, 8, and 16, respectively. The Q factor decreases to 5.21, 5.1, and 5.06 for channels 1, 8, and 16, respectively, as the input power further decreases from −5 to −15 dBm. With the decrease in input power, the Q-factor increases up to optical power of −5 dBm; below which, the system performance has deteriorated. As the power decreases further, the FWM power generated to the existing channel power decreases, which, in turn, reduces the SNR.
Figure 4 shows the BER curves corresponding to variation in input power. The variation in BER is in synchronization with Q Factor variation. The value of BER first decreases up to −5 dBm, with variation in input power, then increases thereby limiting the performance.
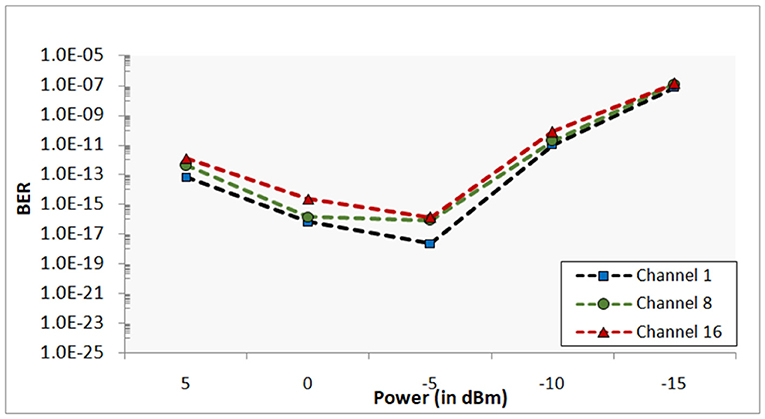
Figure 4. Variation of BER with power at channel spacing of 50 GHz.
It is clear from the above graphs of Q-factor and BER that the optimum values have been obtained at input power of −5 dBm, and the least values of Q-factor and highest BER have been obtained at −15 dBm. This can be justified by observing the eye diagrams at −5 (good and optimal) and −15 dBm (worst) for channels 1, 8, and 16, respectively. Figure 5 illustrates the eye diagrams of a conventional WDM-based RoF system at 50 GHz channel spacing.
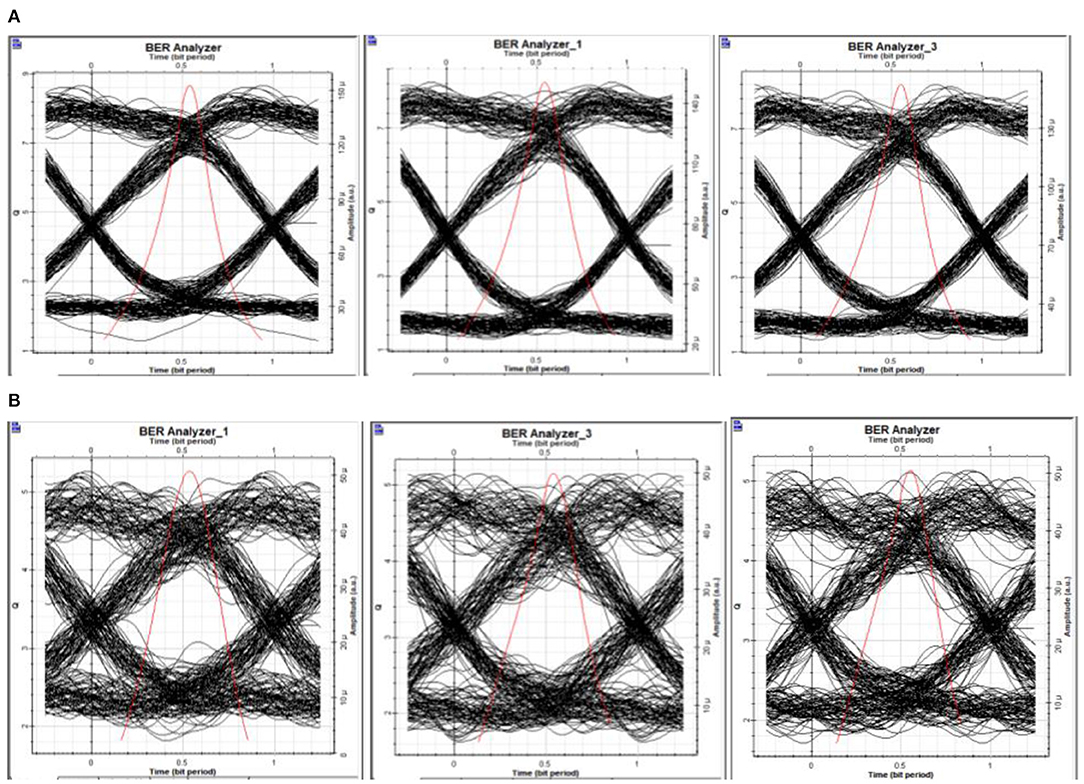
Figure 5. The eye diagrams for conventional WDM-based RoF system for 50 GHz channel spacing. (A) The eye diagrams at channels 1, 8, and 16 at −5 dBm input power. (B) The eye diagrams at channels 1, 8, and 16 at −15 dBm input power.
The eye height at −5 dBm is 5.82E−5, 5.66E−5, and 5.55E−5 for channels 1, 8, and 16, respectively. It subsequently reduces with increase in number of channels. When power is reduced up to −15 dBm, the eye height observed is 1.12E−5, 1.05E−5, and 1.01E−5, respectively. The eye opening has considerably reduced with decrease in input power and increase in the number of channels.
Figure 6 depicts a bar chart, showing the variation in Q factor for three different channels at 100 GHz channel spacing.
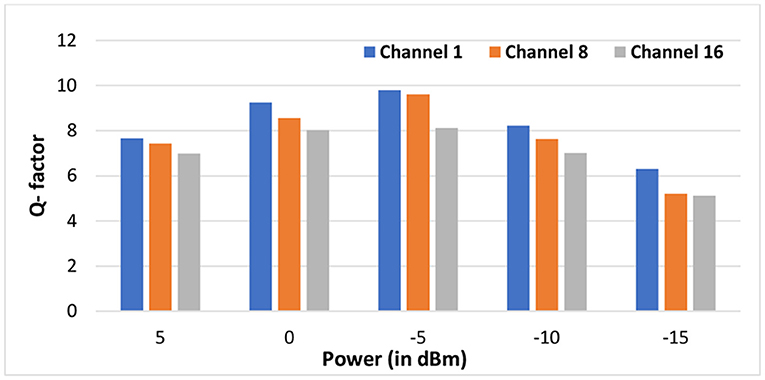
Figure 6. Variation of Q factor with power at channel spacing of 50 GHz.
It is observed that, for a particular input power value and with increase in the number of input channels, the Q factor decreases. Furthermore, with variation in input power from 5 to −15 dBm, the value of Q factor first increases from 7.56, 7.33, and 6.88 at 5 dBm to 9.68, 9.59, and 8.04 at −5 dBm for channels 1, 8, and 16, respectively. The Q factor decreases to 6.25, 5.16, and 5.06 for channels 1, 8, and 16, respectively, as the input power further decreases from −5 to −15 dBm.
Figure 7 shows the variation of BER with input power. With increase in channel spacing, a decrease in BER is observed from 2.23E−18 to 5.41E−23 for channel 1 and, consequently, for the other channels at the optimum power level of −5 dBm. From Figures 6, 9, the value of Q factor increases at a particular value of input power, with increase in channel spacing from 50 to 100 GHz. At input power of −5 dBm, an improvement of up to 16.51% is obtained in the Q factor.
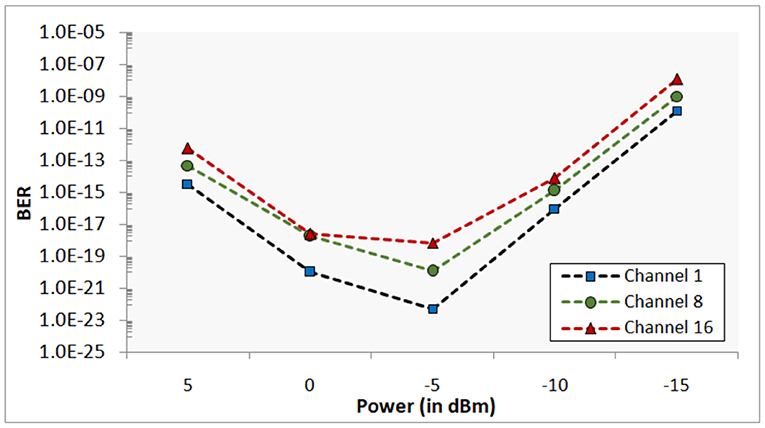
Figure 7. Variation of BER with power at channel spacing of 100 GHz.
Figure 8 shows the eye diagrams of a conventional WDM-based RoF system at 100 GHz channel spacing.
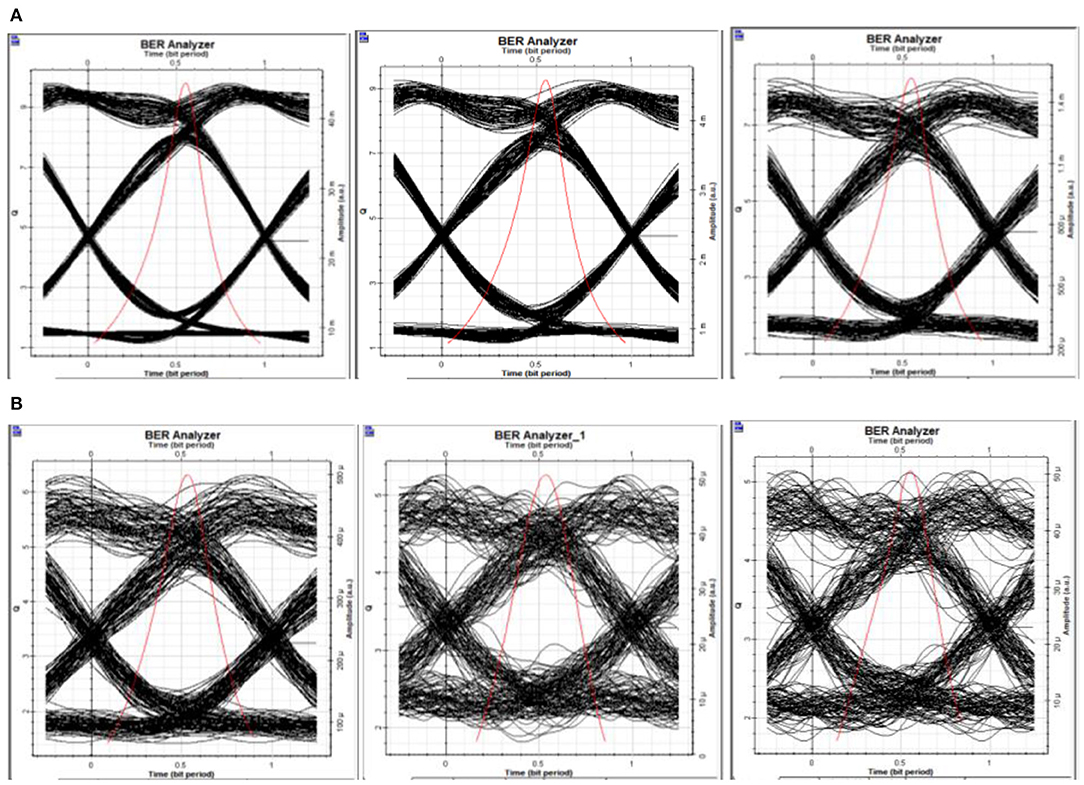
Figure 8. The eye diagrams for the conventional WDM-based RoF system for 100 GHz channel spacing. (A) The eye diagrams at channels 1, 8, and 16 at −5 dBm input power. (B) The eye diagrams at channels 1, 8, and 16 at −15 dBm input power.
The eye height for channels 1, 8, and 16 is 0.018, 0.0017, and 0.00056, respectively, at −5 dBm input power. It is observed that at −15 dBm, the eye height is 1.36E−4, 1.22E−5, and 1.12E−5 for the respective channels. With an increase in channel spacing to 100 GHz, clearer eye diagrams have been observed with a wider eye opening.
Figure 9 given below depicts a bar chart, showing the variation in Q factor values for channels 1, 8, and 16 for a hybrid combination of DCF-FBG at channel spacing of 50 GHz. The input power is varied from 5 to −15 dBm. The value of Q factor first increases from 7.52, 7.41, and 6.71 at 5 dBm to 11.32, 11.13, and 10.21 at −5 dBm for channels 1, 8, and 16, respectively. The Q factor decreases to 8.02, 7.23, and 7.21 for channels 1, 8, and 16, respectively, as the input power further decreases from −5 to −15 dBm.
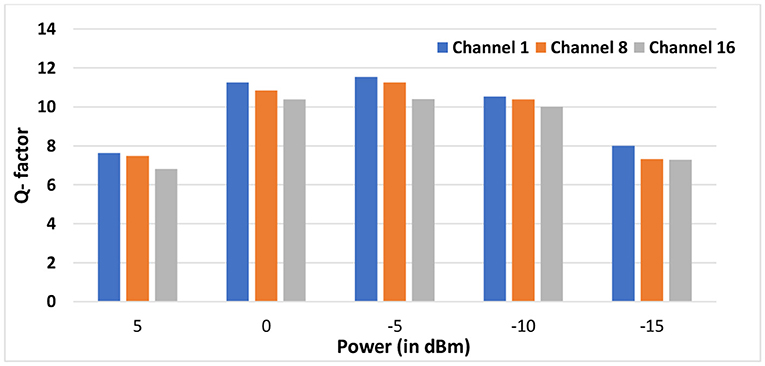
Figure 9. Variation of Q factor with power at channel spacing of 50 GHz.
Figure 10 shows the variation of BER with input power. The variation in BER is in synchronization with the variation in Q factor. The value of BER first decreases with variation in input power and then increases.
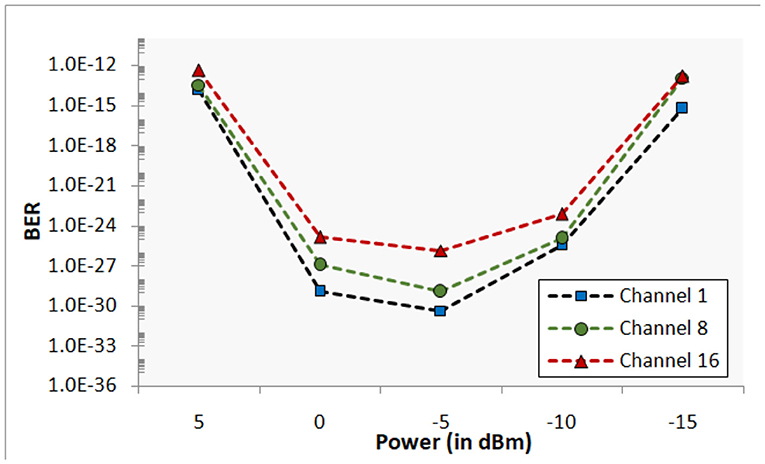
Figure 10. Variation of BER with power at channel spacing of 50 GHz.
The eye diagrams for WDM-based RoF system with DCF and FBG at 50 GHz channel spacing are shown in Figure 11.
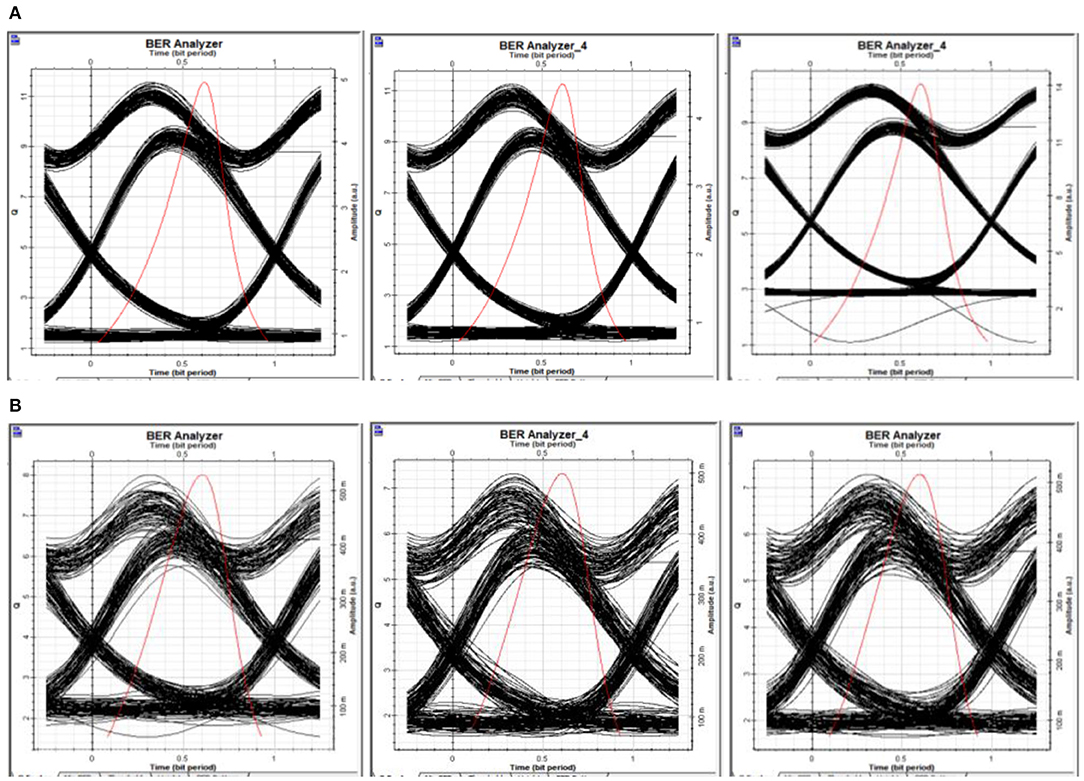
Figure 11. The eye diagrams for WDM-based RoF system with DCF and FBG for 50 GHz channel spacing. (A) The eye diagrams at channels 1, 8, and 16 at −5 dBm input power. (B) The eye diagrams at channels 1, 8, and 16 at −15 dBm input power.
The height of the eye diagrams at −5 dBm is 2.12, 1.91, and 1.22 and, at −15 dBm, is 0.18, 0.16, and 0.13, respectively, at channels 1, 8, and 16. With the use of hybrid DCF-FBG combination in the designed model, enhanced qualitative performance is obtained.
Figure 12 depicts a bar chart, showing the variation of Q factor for three different channels at channel spacing of 100 GHz. From Figure 11, the value of Q factor decreases with increase in the number of channels. Furthermore, as the input power is varied from 5 to −15 dBm, the value of Q factor first increases from 7.81, 7.72, and 7.59 at 5 dBm to 12.21, 11.59, and 11.48 at −5 dBm for channels 1, 8, and 16, respectively. The Q factor decreases to 8.42, 7.51, and 7.49 for channels 1, 8, and 16, respectively, as the input power further decreases from −5 to −15 dBm.
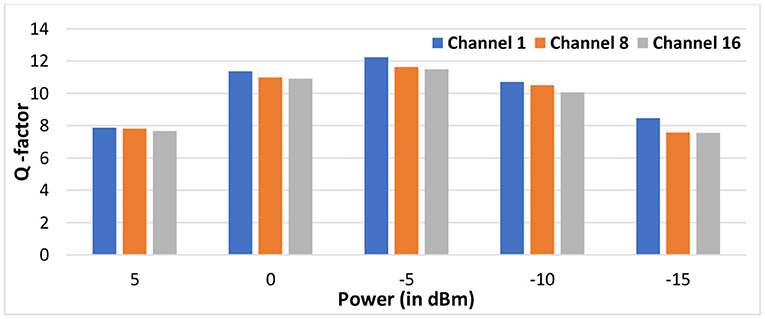
Figure 12. Variation of Q factor with power at channel spacing of 100 GHz.
Figure 13 shows BER vs. input power at 100 GHz channel spacing. The variation in BER is in synchronization with the variation in Q factor. The value of BER first decreases with variation in input power and then increases.
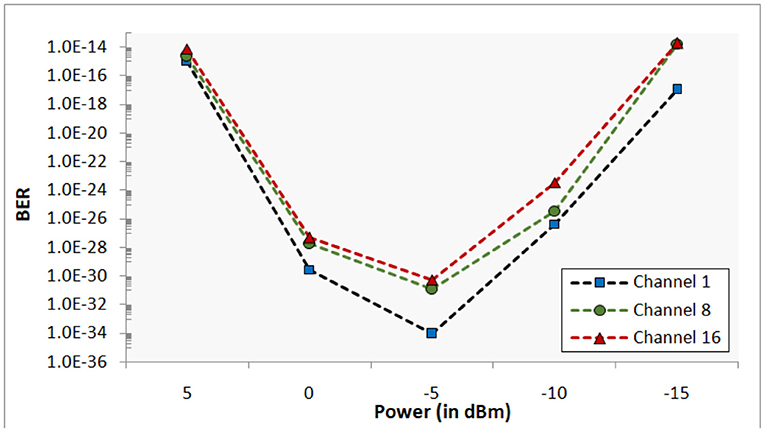
Figure 13. Variation of BER with power at channel spacing of 100 GHz.
From Figures 9, 12, with increase in channel spacing from 50 to 100 GHz, the value of Q factor increases at a particular value of input power. At input power of −5 dBm, an improvement of up to 10.42% is obtained in the Q factor.
The eye diagrams for WDM-based RoF system, with DCF and FBG at 100 GHz channel spacing, are shown in Figure 14.
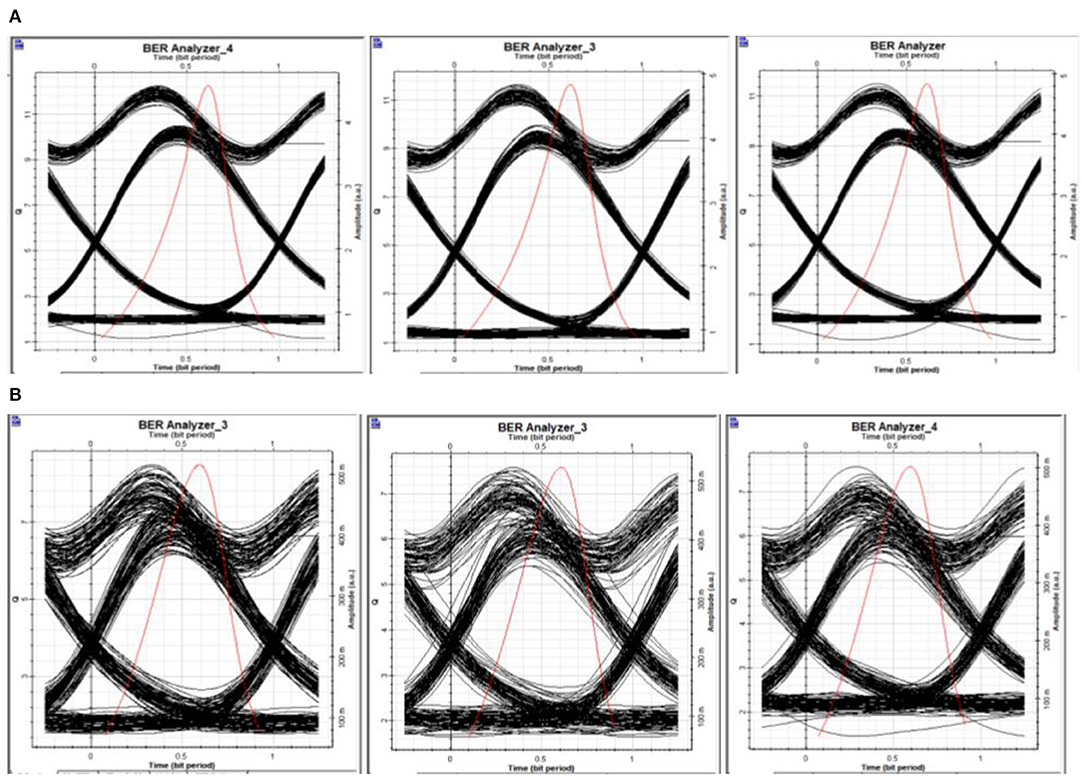
Figure 14. The eye diagrams for WDM-based RoF system, with DCF and FBG for 100 GHz channel spacing. (A) The eye diagrams at channels 1, 8, and 16 at −5 dBm input power. (B) The eye diagrams at channels 1, 8, and 16 at −15 dBm input power.
At −5 dBm, the larger eye opening, with the height of 2.15, 2.09, and 2.07, is observed comparable to 0.18, 0.14, and 0.12 at −15 dBm, corresponding to channels 1, 8, and 16, respectively. It is clearly noticed from the eye diagrams that, with the inclusion of DCF and FBG in our designed layout, the impact of non-linearities, such as third-order harmonics, FWM, etc., in the propagation path, has been mitigated. From the above discussion, it can be concluded that the wider and clear opening of the diagram indicates that the quality of the signal received is optimum for further processing.
From the graphical results, the increased values of Q factor and the improved values of BER can be attributed to the hybrid DCF-FBG combination. It can be further concluded that the hybrid combination of DCF-FBG is successful in mitigating the higher-order dispersion harmonics and, thereby, limiting the impact of FWM. Furthermore, the numerical computations show that, at channel spacing of 100 GHz, there is an improvement of up to 41.52% in the value of Q factor at an input power of −5 dBm, using a hybrid combination of DCF-FBG, as compared with the conventional WDM-based RoF system, thereby justifying the selection of simulation parameters to offer the optimum results in the network design. The parameters have been varied with the stipulated design values, and the best performing values have been chosen in the table to give desired and best possible results.
Conclusion
In the present work, a 16-channel, 160-Gbps WDM-RoF system has been evaluated for optimum performance, using Q factor and BER with varying input power at a channel spacing of 50 and 100 GHz, and is compared with the traditional RoF system. The data from biomedical sensors have to be captured, transported, and delivered, and the destination has to be of optimum quality. In order to mitigate the non-linearities, DCF-FBG hybrid combination has been used. From the qualitative analysis, with the reduction in input power, the Q factor first increases up to input power of −5 dBm, and, thereafter, it decreases with input power, whereas the BER first decreases up to −5 dBm and then increases thereafter with further variation in input power. The results also depicted that, at a given input power, the Q factor increases with an increase in channel spacing from 50 to 100 GHz, and an improvement of up to 16.51% is obtained. The WDM-RoF system with a hybrid combination of DCF-FBG performs efficiently at an input power of −5 dBm and provides an optimum BER performance, with an improvement of up to 41.52% in the value of Q factor, as compared with the conventional WDM-based RoF system. In further analysis of eye diagrams, the hybrid combination of DCF-FBG provides larger eye openings, with eye height of 2.15, 2.09, and 2.07 for channels 1, 8, and 16, respectively. With the considerable increase in channel spacing (50 to 100 GHz) and a simultaneous reduction in channel input power in the designed system, the effect of non-linearities has been sufficiently mitigated at an optimum power of −5 dBm.
Data Availability Statement
The raw data supporting the conclusions of this article will be made available by the authors, without undue reservation.
Author Contributions
SD proposed the idea and supervised the whole work. SK and SS carried out the analytical and numerical calculation. All authors contributed to the writing of the manuscript.
Conflict of Interest
The authors declare that the research was conducted in the absence of any commercial or financial relationships that could be construed as a potential conflict of interest.
References
1. Singh S, Kumar S, Payal. Radio over fiber communication system: lateral shift in cellular communication. Int J Emerg Technol. (2020) 11:731–4.
2. Kumar S, Sharma D, Payal, Singh R. Performance analysis of radio over fiber link using mzm external modulator. In: Luhach A, Kosa J, Poonia R, Gao XZ, Singh D, editors. First International Conference on Sustainable Technologies for Computational Intelligence (ICTSCI-2019). Singapore: Springer; ASIC (2020). doi: 10.1007/978-981-15-0029-9_18
3. Payal, Kumar S. Nonlinear impairments in fiber optic communication systems: analytical review. In: Futuristic Trends in Network and Communication Engineering (FTNCT-2018), Chapter-3, Vol. 958. Singapore: Springer; CCIS (2019). p. 28–44.
4. Yadav J, Jaiswal AK, Kumar M. Radio over fiber technology. IOSR J Electron Commun Eng. (2014) 9:83–7.
5. Dahiya S, Kumar S, Sharma D, Arora P. Mitigating polarization mode dispersion for enhanced capacity in polarization division multiplexed (PDM-QAM) optical fiber communication link using hybrid optical amplifier. In: SPIE proceedings Optics Photonics for Information Processing XIV 115090L. San Diego, CA (2020). doi: 10.1117/12.2566904
6. Jia Z, Yu J, Chang G. A full-duplex radio-over-fiber system based on optical carrier suppression and reuse. IEEE Photon Technol Lett. (2006) 18:1726–8. doi: 10.1109/LPT.2006.879946
7. Lin C, Chi Y, Tsai C, Wang H, Lin G. 39-GHz millimeter-wave carrier generation in dual-mode colorless laser diode for OFDM-MMWoF transmission. IEEE J Select Top Quant Electron. (2015) 21:609–18. doi: 10.1109/JSTQE.2015.2464276
8. Soni A, Pradesh M, Prajapati N, Sharma N. A review article of WDM based optical fiber communication with WDM system evolution. Int J Adv Res Ideas Innovat Technol. (2018) 4:739–43.
9. Kim HJ, Song JI. Simultaneous WDM RoF signal generation utilizing an all-optical frequency upconverter based on FWM in an SOA. IEEE Photon Technol Lett. (2011) 23:828–30. doi: 10.1109/LPT.2011.2140102
10. Amari A, Dobre OA, Venkatesan R, Kumar OS, Ciblat P, Jaouën Y. A survey on fiber nonlinearity compensation for 400 Gb/s and beyond optical communication systems. IEEE Commun Surv Tutor. (2017) 19:3097–113. doi: 10.1109/COMST.2017.2719958
11. Nain A, Kumar S. Performance investigation of different modulation schemes in RoF systems under the influence of self phase modulation. J Opt Commun. (2018) 39:343–7. doi: 10.1515/joc-2016-0155
12. Nain A, Kumar S, Singla S. Impact of XPM crosstalk on SCM-based RoF systems. J Opt Commun. (2017) 3:319–24. doi: 10.1515/joc-2016-0045
13. Bhatia R, Sharma AK, Saxena J. Improved analysis of four wave mixing with sub-plank higher-order dispersion parameters in optical communication systems. Optik. (2016) 127:9474–8. doi: 10.1016/j.ijleo.2016.07.035
14. Kathpal N, Garg AK. Analysis of radio over fiber system for mitigating four-wave mixing effect. Digit Commun Netw. (2020) 6:115–22. doi: 10.1016/j.dcan.2019.01.003
15. Kaur G, Singh ML, Patterh MS. Effect of fibre nonlinearities in a WDM transmission system. Optik. (2010) 121:889–96. doi: 10.1016/j.ijleo.2008.09.035
16. Nain A, Kumar S, Singla S. Performance estimation of WDM radio-over-fiber links under the influence of SRS induced crosstalk. In: Proceeding of International Conference on Intelligent Communication. Singapore: Springer (2017). p. 279–84. doi: 10.1007/978-981-10-1708-7_32
17. Ruzbarsky J, Turan J, Ovsenik L. Stimulated brillouin scattering in DWDM all optical communication systems. In: 26th IEEE International Conference Radioelektronika (Radioelektronika), Kosice (2016). p. 395–8. doi: 10.1109/RADIOELEK.2016.7477354
18. Li J, Ning T, Pei L, Qi C. Millimeter-wave radio-over-fiber system based on two-step heterodyne technique. Opt Lett. (2009) 34:3136–8. doi: 10.1364/OL.34.003136
19. Li S, Zheng X, Zhang H, Zhou B. Compensation of dispersion-induced power fading for highly linear radio-over-fiber link using carrier phase-shifted double sideband modulation. Opt Lett. (2011) 36:546–8. doi: 10.1364/OL.36.000546
20. Cui Y, Xu K, Dai J, Sun X, Dai Y, Ji Y, et al. Overcoming chromatic-dispersion-induced power fading in ROF links employing parallel modulators. IEEE Photon Technol Lett. (2012) 24:1173–5. doi: 10.1109/LPT.2012.2192422
21. Tsai C, Chi Y, Lin G. Power fading mitigation of 40-Gbit/s 256-QAM OFDM carried by colourless laser diode under injection-locking. Opt Express. (2015) 23:29065–78. doi: 10.1364/OE.23.029065
22. Tsai C, Lin C, Lin C, Chi Y, Lin G. 60-GHz millimeter-wave over fiber with directly modulated dual-mode laser diode. Sci Rep. (2016) 6:27919. doi: 10.1038/srep27919
Keywords: self-phase modulation, mach zehnder modulator, RoF, cross-phase modulation (XPM), four wave mixing, FBG, stimulated brillouin scattering, stimulated raman scattering
Citation: Kumar S, Sharma S and Dahiya S (2021) WDM-Based 160 Gbps Radio Over Fiber System With the Application of Dispersion Compensation Fiber and Fiber Bragg Grating. Front. Phys. 9:691387. doi: 10.3389/fphy.2021.691387
Received: 06 April 2021; Accepted: 15 April 2021;
Published: 10 May 2021.
Edited by:
Santosh Kumar, Liaocheng University, ChinaReviewed by:
Abhimanyu Nain, Guru Jambheshwar University of Science and Technology, IndiaRagini Singh, Liaocheng University, China
Copyright © 2021 Kumar, Sharma and Dahiya. This is an open-access article distributed under the terms of the Creative Commons Attribution License (CC BY). The use, distribution or reproduction in other forums is permitted, provided the original author(s) and the copyright owner(s) are credited and that the original publication in this journal is cited, in accordance with accepted academic practice. No use, distribution or reproduction is permitted which does not comply with these terms.
*Correspondence: Sandeep Dahiya, c2FuZGVlcGRhaGl5YUBicHN3b21lbnVuaXZlcnNpdHkuYWMuaW4=