- Guangdong Provincial Key Laboratory of Optical Information Materials and Technology and Institute of Electronic Paper Displays, South China Academy of Advanced Optoelectronics, South China Normal University, Guangzhou, China
As a reflective display technology, electrowetting displays (EWDs) have the advantages of paper-like display, low power consumption, fast response, and full color, but the aperture ratio of EWDs is seriously affected by oil dispersion and charge trapping. In order to improve the aperture ratio and optimize the display performance of EWDs, a combined pulse driving waveform with rising gradient design was proposed. First, an initial driving voltage was established by the threshold voltage of oil film rupture (Vth). And then, a rising gradient was designed to prevent oil from dispersing. At last, the oil splitting and movement were controlled to achieve the target aperture combined with the pulse waveform. Experimental results showed that the oil dispersion of EWDs can be effectively improved by using the proposed driving waveform, the aperture ratio of EWDs was increased by 3.16%, and the stability was increased by 71.43%.
Introduction
Electrowetting displays (EWDs) are a kind of reflective display technology with the ability of video-speed display applications; its fluidic pixels can respond and switch quickly by controlling electronic [1]. And it shows excellent electro-optic characteristics like low operating voltage, thinness, fast response, wide viewing angle, and low power consumption [2, 3]. EWD makes up the performance bottlenecks in full-color display and real-time dynamic video display [4–8]; it is known to be one of the most attractive emerging display technologies [15].
The concept of EWD was first proposed by Beni and Hackwood in 1981 [9]. In addition, Hayes developed a new type of the EWD scheme which was based on the principle of microfluidic motion at low driving voltages in 2003 [10]. To achieve fast response EWDs with an accurate multiple gray-level performance for video applications [11], it is necessary to solve the influence of hysteresis effect, charge trapping, and oil splitting in EWDs [12]. The driving waveform controls the motion state of the oil and affects the gray-scale display of EWDs [13]. By changing the applied voltage to control the aperture ratio of EWDs, multiple gray-scale displays can be realized [14]. Amplitude modulation (AM) and pulse width modulation (PWM) are the two main methods to obtain gray scales [15, 16]. But the hysteresis effect is obvious if using AM to drive EWDs. Although the hysteresis of the PWM driving method is much smaller, the gray scales and the frame update rate are limited. Therefore, an amplitude–frequency mixed modulation driving system was proposed to improve the response speed and oil stability when the gray scale was displayed [17]. Also, a driving waveform based on overdriving voltages was proposed to shorten the response time of EWDs [18]. Moreover, a decoupling driving waveform was developed to diminish the induced voltage stress on thin film transistor (TFT) backplane of EWDs [19]. For dealing with the charge trapping phenomenon properly, an asymmetrical alternating polarity driving waveform was proposed [20]. The asymmetry in the driving energy is the difference between an alternating polarity signal with symmetrical energy and a common signal with variable DC voltage. The objective of the asymmetrical driving energy was used to provide the consistent electric field on EWDs with the alternating polarity method, so as to obtain a faster response time and a higher reflectivity. In addition, it was found that the oil film has a higher aperture ratio and a higher reflectivity by applying driving voltage waveforms with different rising gradients, which has the same final voltage on EWDs [21]. The driving voltage gradient was proven to be useful in the microfluidic behavior for electrowetting devices. When the voltage increased slowly, the oil droplets had more time to coalesce or merge, and then the oil splitting phenomena decreased. Although the voltage gradient could improve the reflectivity of EWDs, the response time becomes longer. Therefore, both reflectivity and response time should be taken into account fully. Traditional driving waveforms often cause oil dispersion, which affects the optical performance seriously and reduces the aperture ratio greatly. Analysis of the oil motion behavior in the driving process is helpful to improve the performance of EWDs.
In this study, the relationship among threshold voltage of oil film rupture, luminance value, and response time was analyzed, and a combined pulse waveform with rising gradient design was proposed for improving the aperture ratio and optimizing the display performance of EWDs.
Principles
Display Principle of EWDs
Electrowetting refers to the electrical modulation of the interfacial tension between a conducting liquid phase and a solid electrode [22, 23]. It is a convenient method to actively control the contact angle [24]. As shown in Figure 1, the structure of an EWD is mainly composed of glass substrate, indium tin oxide (ITO), hydrophobic insulator layer, pixel wall, colored oil, and water [25, 26]. The principle is based on the movement of colored oil across a hydrophobic insulator [27].
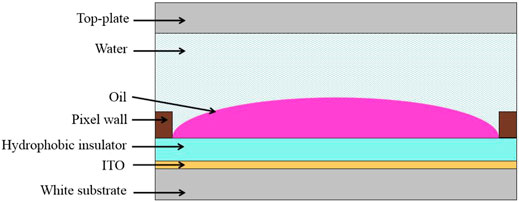
FIGURE 1. Pixel structure of EWDs. The optical stack consists of glass substrate, indium tin oxide (ITO), hydrophobic insulator layer, pixel wall, colored oil, and water.
Without driving voltage, the oil forms a continuous film between the hydrophobic insulator and water. In this case, the relationship of the interfacial tension in a three-phase system is presented as Eq. 1.
where
The display principle of EWDs is presented in Figure 2. For a pixel unit, the surface of the insulator layer is hydrophobic when no driving voltage is applied. The oil covers the insulator layer and absorbs the incident light, as shown in Figure 2A, and the pixel is in a dark state. Figure 2C shows the top view of a pixel in colored off-state. When driving voltage is applied on pixel electrodes, the surface polarity of an insulator layer changes from hydrophobic to hydrophilic, which leads to the change of interfacial tension. As shown in Figure 2B, the oil would be pushed to corners of a pixel by interfacial tension, and the underlying reflective layer would reflect the incident light. Figure 2D is the top view when a pixel is in white on-state. In this way, the optical switch is formed and the monochromatic display of a pixel unit is realized [28].
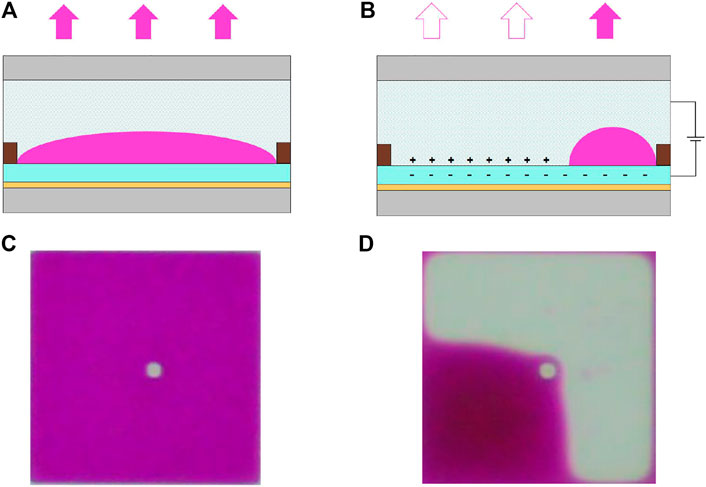
FIGURE 2. Display principle of an EWD pixel. (A) A homogeneous oil film is present when no driving voltage is applied, and the pixel is in colored off-state. (B) When a driving voltage is applied, oil is shrunk to a corner, and the pixel is in white on-state. (C) Top view of the pixel in colored off-state. (D) Top view of the pixel in white on-state.
Electro-optic Characteristics of EWDs
Electrowetting behavior is governed by the Lippmann–Young equation for electrowetting in a three-phase system [29]. The Lippmann–Young equation is defined as Eq. 2.
where
The aperture ratio is an important index to describe the performance of EWDs, which refers to the percentage of white area in the pixel when the driving voltage is applied. During oil contraction, the aperture ratio is defined as Eq. 4.
where
where
When the colored oil film in a pixel splits into small droplets, the contact area between the oil and the hydrophobic insulator layer becomes larger. For example, if a single droplet with 90°contact angle splits into two droplets, the whole area of the two oil droplets occupied is
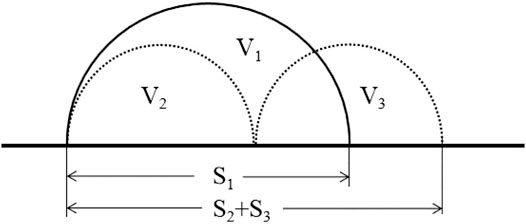
FIGURE 3. Schematic diagram of different oil contraction patterns in an EWD pixel; when an oil droplet splits into two droplets, the covered area between the oil and the hydrophobic insulator layer becomes larger, although the volume remains the same, that is, V1 = V2 + V3, S1 < S2 + S3.
Charge Trapping Phenomenon of EWDs
The phenomenon of charge trapping exists in EWDs. The charge trapping on the dielectric layer of EWDs can influence the stability of display effect, resulting in slow response speed and few gray scales [2]. Figure 4 illustrates the charge trapping phenomenon in an EWD. When the driving voltage is continuously applied to the pixel, ions in water move toward the insulator by the electrostatic force, and then the colored oil would be pushed away. In this process, some ions enter the insulator and can be trapped. Even when removing the driving voltage, the oil could not cover the whole hydrophobic layer. And trapped ions must be discharged by waiting enough time or applying a special driving waveform. Otherwise, the colored oil cannot be completely spread out. Worse still, the charge trapping can lead to the slow response speed of EWDs, which has serious impact on the aperture ratio value.
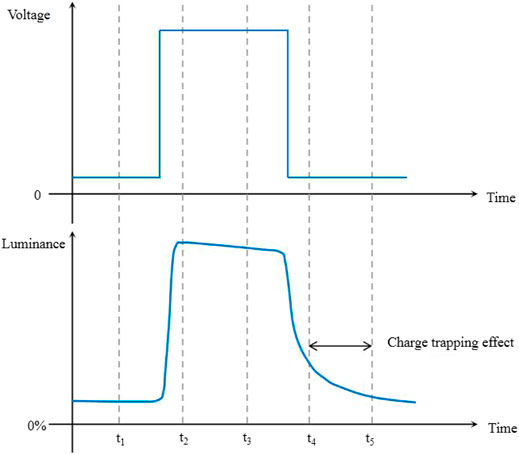
FIGURE 4. Charge trapping phenomenon of EWDs. When applying a driving voltage, ions in the water move toward the insulator due to the electrostatic force, and then the oil is pushed aside. Some ions move into the insulator and become trapped. Even when removing the driving voltage, the oil could not cover the entire hydrophobic layer.
Experimental Results and Discussion
Experimental Platform
In order to evaluate the performance of the proposed driving waveform, an optical experimental platform was built to measure the aperture ratio of EWDs. As shown in Figure 5, the experimental platform consisted of a GDS-3354 oscilloscope, an AFG3052C function generator, an ATA-2022H amplifier, an XTL-165 microscope, an Arges-45 colorimeter, and a computer. Relevant equipment information is shown in Table 1. The tested object was an EWD panel whose parameters are listed in Table 2. The maximum voltage of the texted EWD panel was 30 V. The detailed experimental procedure was as follows.
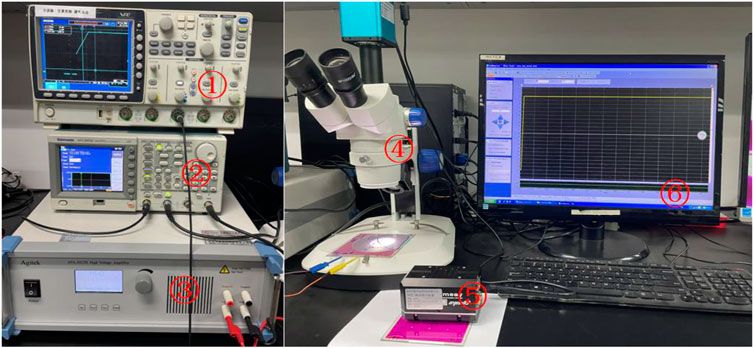
FIGURE 5. Experimental platform for driving EWDs. ① Oscilloscope. ② Arbitrary waveform generator. ③ Power amplifier. ④ Microscope. ⑤ Colorimeter. ⑥ Computer.
First, the required driving waveform was edited by the computer with ArbexPress software and sent to arbitrary waveform generator by serial communication. Then the required driving waveform was generated, which was amplified by the power amplifier to drive the EWD. During the experiment, the colorimeter was placed on the EWD panel, and the host software of colorimeter collected luminance values of the specified pixel in real time. In addition, the high-speed camera captured the display state of the EWD by the microscope.
Driving Waveform Design
The aperture ratio of EWDs is seriously influenced by oil dispersion and charge trapping. In order to improve the aperture ratio and optimize the display stability of EWDs, a combined pulse waveform with rising gradient design was proposed. As shown in Figure 6, the proposed driving waveform included two stages.
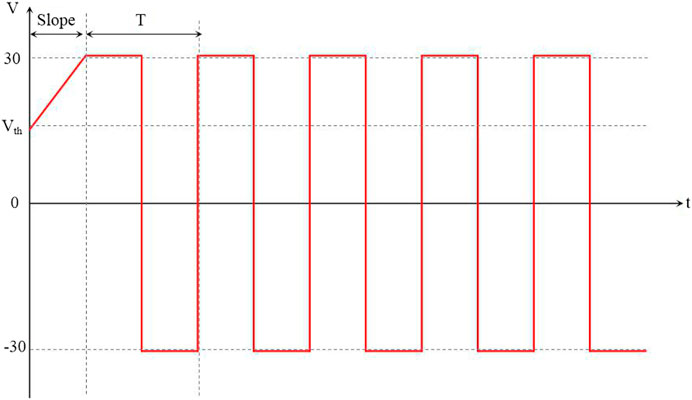
FIGURE 6. Schematic diagram of a combined pulse waveform with rising gradient design. The proposed driving waveform contained two stages. The first stage was a rising gradient with slope from Vth to 30 V. The second stage was a pulse waveform with a suitable period.
At the first stage, initial driving voltage was established by the threshold voltage of oil film rupture (Vth), and a rising gradient was designed to prevent oil from dispersing. Without driving voltage, the oil is in a balanced state of natural spreading; therefore, Vth needs to be applied to break the static balance. In addition, a rising gradient from Vth to 30 V was introduced to prevent the decrease of the aperture ratio caused by oil dispersion. It gives the oil droplets more time to coalesce or merge with adjacent oil droplets when the driving voltage increased slowly so that the oil splitting phenomena could be decreased. The pixel was supposed to reach a larger aperture ratio if the oil distribution is stable. To remove the electric charge which is trapped in the dielectric layer of EWDs, the pulse waveform was introduced at the second stage. As the polarization phenomenon was avoided, the oil splitting and movement could be controlled to achieve a target aperture ratio. With the combination of the pulse waveform, the stability of oil shrinkage could be maintained.
Threshold Voltage of Oil Film Rupture
The precise location of oil film rupture depends on the applied voltage to EWDs. In order to confirm the threshold voltage of the oil film rupture, a traditional DC voltage driving waveform was used to drive the EWD panel. The driving voltage was increased by 1 V per second from the initial voltage 0 V to the final voltage 30 V. During the experiment, the aperture ratio was increased while the driving voltage was increased gradually. As shown in Figure 7, the pixel in colored off-state turned in to white on-state when the applied voltage was increased from 0 V to 30 V. The threshold voltage of oil film rupture could be found by analyzing the relationship between the brightness and the applied voltage with DC voltage driving.
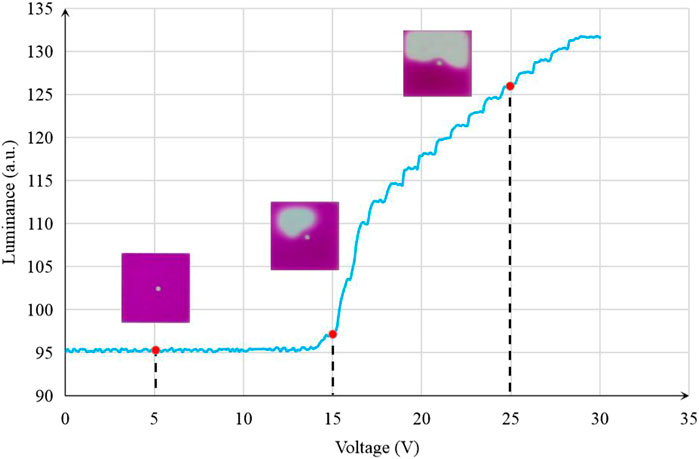
FIGURE 7. Luminance–voltage curve of an EWD when it was driven by a DC voltage. The EWD began to respond quickly when the voltage was 15 V. The threshold voltage of the oil film rupture was confirmed to be 15 V.
As the DC voltage increased, there was a clear threshold with the rupture of oil film. The results of the experiment showed that when the voltage was above the threshold voltage, the brightness value increases sharply. As the capillary force became dominant and the charge distribution increase quickly at the three-phase contact line, the optical response speed of EWDs was increased gradually. When the driving voltage reached 15 V, the EWD began to response quickly, so the threshold voltage of the oil film rupture was determined to be 15 V.
Effects of Different Slopes on the Aperture Ratio of EWDs
Driving waveforms with various slope values were applied to study the influence of rising gradient driving waveforms on the aperture ratio of EWDs. When the voltage was increased slowly, oil droplets have more time to coalesce with adjacent oil droplets, so it can effectively suppress the violent vibration of oil, which would result in the oil splitting, and obtain a higher aperture ratio. We applied different slopes to rising gradient driving waveforms from 15 V to 30 V for observing the influence of rising gradient waveforms with different slopes. Voltage rising speeds of 0.2 V/ ms, 0.4 V/ ms, 0.9 V/ ms, 1.4 V/ ms, and 2.0 V/ ms were tested in this study. Figure 8 shows the schematic diagram of a driving waveform with rising gradient design.
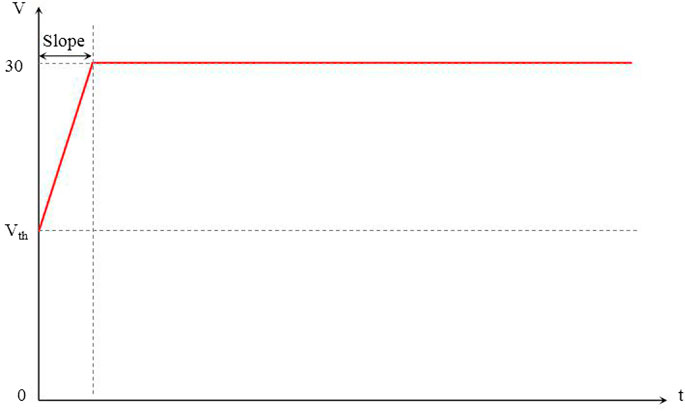
FIGURE 8. Schematic diagram of a driving waveform with rising gradient design. The rising gradient waveform with slope from Vth to 30 V. Vth = 15 V.
The luminance curve of EWDs driven by different slope rising gradient driving waveforms is shown in Figure 9. And the comparison of driving effects is listed in Table 3. The experimental results showed that the response speed was 1.73 ms when the slope was 0.2 V/ s, whereas the response speed was 0.96 ms when the slope was 0.4 V/ s; it was 0.77 ms faster than the slope of 0.2 V/ ms. When the slope of the waveform was 0.4 V/ ms, the mean square error of the luminance value was smaller than that of other waveforms; that is, the aperture ratio and oil state of EWDs were more stable. Therefore, the rising gradient driving waveform with the slope of 0.4 V/ s was selected in our driving waveform for EWDs.
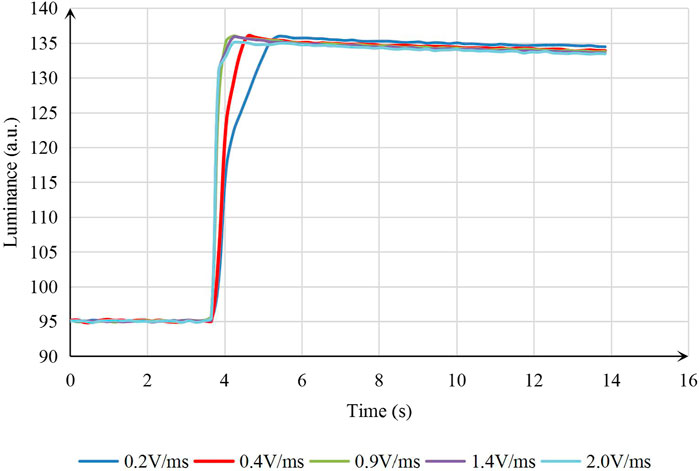
FIGURE 9. Brightness–duration curve of an EWD when it was driven by different rising gradient driving waveforms. The 0.4 V/ ms slope driving waveform had the most stable aperture ratio.

TABLE 3. Driving effect comparison when different rising gradient driving waveforms were used to drive EWDs.
Performance Testing of the Rising Gradient Pulse Waveform
The charge trapping phenomenon of EWDs can cause oil backflow and affect the stability of display directly. Therefore, at the end of the 0.4 V/ s rising gradient waveform, a pulse waveform was introduced as the driving force to keep the aperture ratio stable. By adjusting the period of the applied square waveform, the shape of oil contraction was supposed to be maintained stable. Square waveforms with periods of 5 ms, 15 ms, 25 ms, and 35 ms were applied to the EWD panel. The time-varying curve of the brightness of the EWD driven by different periods is shown in Figure 10. And the comparison of driving effect is listed in Table 4.
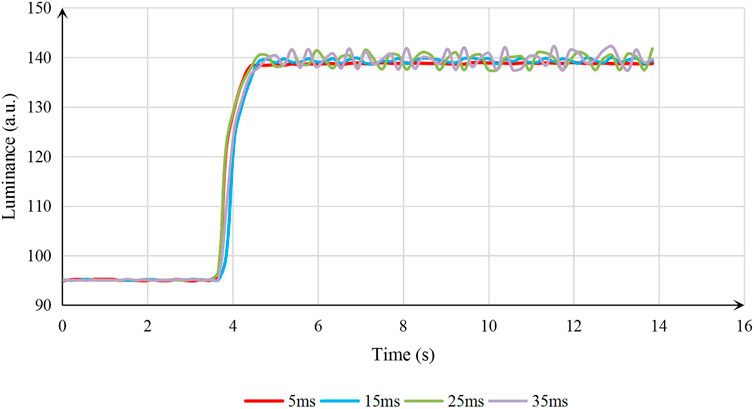
FIGURE 10. The brightness curve of an EWD driven by rising gradient pulse waveform at different periods. Square waveforms with periods of 5, 15, 25, and 35 ms were applied to the EWD panel. The curve was relatively stable when the period was 5 ms.
The experimental results showed that when the period of the square waveform was 5 ms, the stale brightness value of the EWD was 138.77, which was lower than that of other driving waveforms, with periods of 15 ms, 25 ms, and 35 ms. However, the mean square error of the stable luminance value was smaller than that of other waveforms; that is, the aperture ratio and the stability of oil were the best with the period of 5 ms.
In addition, the luminance–time curve of an EWD driven by four different driving waveforms is shown in Figure 11, including the traditional square waveform, the existing rising gradient driving waveform proposed by Zhang [21], the asymmetrical alternating polarity driving waveform proposed by Chen [20], and the proposed combined pulse waveform with rising gradient in this study. It was proved that the proposed driving waveform eliminated the oil dispersion phenomenon and inhibited oil backflow effectively. It not only decreased oil splitting but also avoided the polarization phenomenon. As listed in Table 5, the average of the brightness value was 138.77, which was higher than that of other three driving waveforms. Compared with the asymmetrical alternating polarity driving waveform, the aperture ratio was increased by 3.16%. Moreover, the mean square error of the stable brightness value was 0.12; it was much lower than that of the other driving waveforms. The brightness standard deviation was increased by 71.43% compared with the traditional square wave. Hence, both the aperture ratio and the stability of oil were the best by applying the proposed driving waveform. Therefore, the proposed driving waveform in this study could effectively suppress the charge trapping of EWDs and keep the state of oil film more stable.
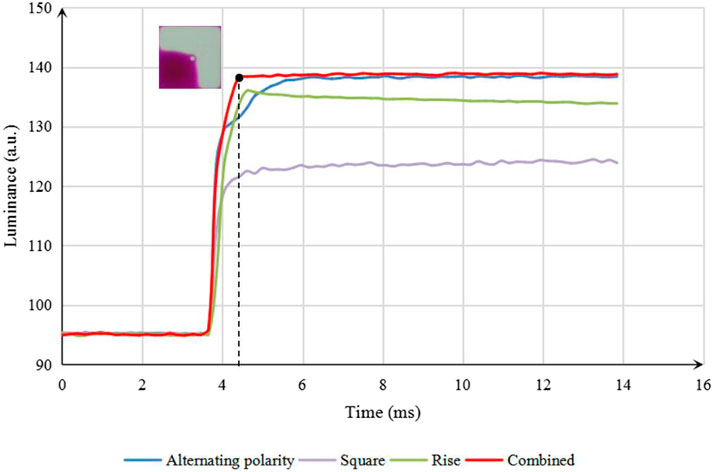
FIGURE 11. Luminance–time curve of an EWD panel with four different driving waveforms. The traditional square waveform, the existing rising gradient driving waveform proposed by Zhang [21], the asymmetrical alternating polarity driving waveform proposed by Chen [20], and the proposed combined driving waveform in this study.
Conclusion
In order to improve the aperture ratio and optimize the display performance of EWDs, a combined pulse driving waveform with rising gradient design was proposed in this study. It can significantly reduce the influence of oil dispersion and charge trapping in EWDs. Experimental results showed that EWD has a higher aperture ratio than the former waveforms. The aperture ratio was increased by 3.16%, and the stability was increased by 71.43%. It was proved that the proposed driving waveform can control oil splitting and movement. It is helpful to realize a more stable EWD and achieve target aperture.
Data Availability Statement
The original contributions presented in the study are included in the article/Supplementary Material; further inquiries can be directed to the corresponding author.
Author Contribution
LT and PB designed this project. LT carried out most of the experiments. PB performed part of the experiments and helped with discussions during manuscript preparation. LT contributed to the data analysis and correction. PB provided helpful discussions on the experimental results. All authors have discussed the results and agreed to the published version of the manuscript.
Funding
This research was supported by Program for Chang Jiang Scholars and Innovative Research Teams in Universities (No. IRT_17R40), Program for Guangdong Innovative and Enterpreneurial Teams (No. 2019BT02C241), Science and Technology Program of Guangzhou (No. 2019050001), Guangdong Provincial Key Laboratory of Optical Information Materials and Technology (No. 2017B030301007), Guangzhou Key Laboratory of Electronic Paper Displays Materials and Devices (201705030007), and the 111 Project.
Conflict of Interest
The authors declare that the research was conducted in the absence of any commercial or financial relationships that could be construed as a potential conflict of interest.
References
1. Bai PF, Hayes RA, Jin M, Shui L, Yi ZC, Wang L, et al. REVIEW of PAPER-LIKE DISPLAY TECHNOLOGIES (Invited Review). Pier (2014) 147:95–116. doi:10.2528/PIER13120405
2. Palanivelu S, Surjya S. Display Applications of Electrowetting. J Adhes Sci Tech (2012) 26(12-17):1947–63. doi:10.1163/156856111X600532
3. Li W, Wang L, Zhang T, Lai S, Liu L, He W, et al. Driving Waveform Design with Rising Gradient and Sawtooth Wave of Electrowetting Displays for Ultra-low Power Consumption. Micromachines (2020) 11(2):145. doi:10.3390/mi11020145
4. Chen J, Cranton W, Fihn M. Droplet-Driven Electrowetting Displays. Handbook Vis Display Tech (2012) 104:1747–59. doi:10.1007/978-3-540-79567-4_104
5. Yi Z-c., Bai P-f., Wang L, Zhang X, Zhou G-f. An Electrophoretic Display Driving Waveform Based on Improvement of Activation Pattern. J Cent South Univ (2014) 21(8):3133–7. doi:10.1007/s11771-014-2285-9
6. Wang L, Yi Z, Jin M, Shui L, Zhou G. Improvement of Video Playback Performance of Electrophoretic Displays by Optimized Waveforms with Shortened Refresh Time. Displays (2017) 49(9):95–100. doi:10.1016/j.displa.2017.07.007
7. Shen S, Gong Y, Jin M, Yan Z, Xu C, Yi Z, et al. Improving Electrophoretic Particle Motion Control in Electrophoretic Displays by Eliminating the Fringing Effect via Driving Waveform Design. Micromachines (2018) 9(4):143. doi:10.3390/mi9040143
8. He W, Yi Z, Shen S, Huang Z, Liu L, Zhang T, et al. Driving Waveform Design of Electrophoretic Display Based on Optimized Particle Activation for a Rapid Response Speed. Micromachines (2020) 11(5):498. doi:10.3390/mi11050498
9. Beni G, Hackwood S. Electro‐wetting Displays. Appl Phys Lett (1981) 38(4):207–9. doi:10.1063/1.92322
10. Hayes RA, Feenstra BJ. Video-speed Electronic Paper Based on Electrowetting. Nature (2003) 425(6956):383–5. doi:10.1038/nature01988
11. Liu L, Bai P, Yi Z, Zhou G. A Separated Reset Waveform Design for Suppressing Oil Backflow in Active Matrix Electrowetting Displays. Micromachines (2021) 12(5):491. doi:10.3390/mi12050491
12. Chiu Y-H, Liang C-C, Chen Y-C, Lee W-Y, Chen H-Y, Wu S-H. Accurate-gray-level and Quick-Response Driving Methods for High-Performance Electrowetting Displays. J Soc Inf Display (2011) 19(11):741–8. doi:10.1889/JSID19.11.741
13. Luo ZJ, Zhang WN, Liu LW, Xie S, Zhou G. Portable Multi-gray Scale Video Playing Scheme for High-Performance Electrowetting Displays. Jnl Soc Info Display (2016) 24(6):345–54. doi:10.1002/jsid.444
14. Yi Z, Shui L, Wang L, Jin M, Hayes RA, Zhou G. A Novel Driver for Active Matrix Electrowetting Displays. Displays (2015) 37:86–93. doi:10.1016/j.displa.2014.09.004
15. Van R, Feenstra B, Hayes R, Camps I, Boom R, Wagemans M, et al. Gray Scales for Video Applications on Electrowetting Displays. SID Symp Dig Tech Pap (2006) 37(1):1926–9. doi:10.1889/1.2433427
16. Yi Z, Huang Z, Lai S, He W, Wang L, Chi F, et al. Driving Waveform Design of Electrowetting Displays Based on an Exponential Function for a Stable Grayscale and a Short Driving Time. Micromachines (2020) 11(3):313. doi:10.3390/mi11030313
17. Yi Z, Liu L, Wang L, Li W, Shui L, Zhou G. A Driving System for Fast and Precise Gray-Scale Response Based on Amplitude-Frequency Mixed Modulation in TFT Electrowetting Displays. Micromachines (2019) 10(11):732. doi:10.3390/mi10110732
18. Zeng W, Yi Z, Zhao Y, Zeng W, Ma S, Zhou X, et al. Design of Driving Waveform Based on Overdriving Voltage for Shortening Response Time in Electrowetting Displays. Front Phys (2021) 9:642682. doi:10.3389/fphy.2021.642682
19. Liang C-C, Chen Y-C, Chiu Y-H, Chen H-Y, Cheng W-Y, Lee W-Y. 27.3: A Decoupling Driving Scheme for Low Voltage Stress in Driving a Large-Area High-Resolution Electrowetting Display. SID Symp Dig (2009) 40(1):375–8. doi:10.1889/1.3256791
20. Chen Y-C, Chiu Y-H, Lee W-Y, Liang C-C. 56.3: A Charge Trapping Suppression Method for Quick Response Electrowetting Displays. SID Symp Dig (2010) 41(1):842–5. doi:10.1889/1.3500607
21. Zhang X-M, Bai P-F, Hayes R, Shui L-L, Jin M-L, Tang B, et al. Novel Driving Methods for Manipulating Oil Motion in Electrofluidic Display Pixels. J Display Technol (2015) 12(2):1. doi:10.1109/jdt.2015.2477947
22. Yi Z, Feng H, Zhou X, Shui L. Design of an Open Electrowetting on Dielectric Device Based on Printed Circuit Board by Using a Parafilm M. Front Phys (2020) 8:193. doi:10.3389/fphy10.3389/fphy.2020.00193
23. Feng H, Yi Z, Yang R, Qin X, Shen S, Zeng W, et al. Designing Splicing Digital Microfluidics Chips Based on Polytetrafluoroethylene Membrane. Micromachines (2020) 11(12):1067. doi:10.3390/mi11121067
24. Prins MWJ, Welters W, Weekamp J. Fluid Control in Multichannel Structures by Electrocapillary Pressure. Science (2001) 291(5502):277–80. doi:10.1126/science.291.5502.277
25. Feenstra J. Video-Speed Electrowetting Display Technology. Handbook Vis Display Tech (2016) 1(13):2443–58. doi:10.1007/978-3-319-14346-0_103
26. Jin M, Shen S, Yi Z, Zhou G, Shui L. Optofluid-Based Reflective Displays. Micromachines (2018) 9(4):159. doi:10.3390/mi9040159
27. Roques C, Hayes R, Feenstra B, Schlangen L. Liquid Behavior inside a Reflective Display Pixel Based on Electrowetting. J Appl Phys (2004) 95(8):4389–96. doi:10.1063/1.1667595
28. Feenstra BJ, Hayes RA, Camps IGJ, Hage LM, Johnson MT, Roques-Carmes T, et al. A Video-Speed Reflective Display Based on Electrowetting: Principle and Properties. J Soc Inf Display (2004) 12(3):293–9. doi:10.1889/1.1825703
Keywords: electrowetting display, driving waveform, aperture ratio, charge trapping, threshold voltage, oil dispersion
Citation: Tian L and Bai P (2021) A Combined Pulse Driving Waveform With Rising Gradient for Improving the Aperture Ratio of Electrowetting Displays. Front. Phys. 9:709151. doi: 10.3389/fphy.2021.709151
Received: 13 May 2021; Accepted: 11 June 2021;
Published: 02 July 2021.
Edited by:
Qiang Xu, Nanyang Technological University, SingaporeReviewed by:
Liming Liu, University of Electronic Science and Technology of China, ChinaZhixian Lin, Fuzhou University, China
Copyright © 2021 Tian and Bai. This is an open-access article distributed under the terms of the Creative Commons Attribution License (CC BY). The use, distribution or reproduction in other forums is permitted, provided the original author(s) and the copyright owner(s) are credited and that the original publication in this journal is cited, in accordance with accepted academic practice. No use, distribution or reproduction is permitted which does not comply with these terms.
*Correspondence: Pengfei Bai, YmFpcGZAc2NudS5lZHUuY24=
 Lixia Tian
 Pengfei Bai


