Abstract
Black soldier fly larvae are a sustainable protein source and play a vital role in the emerging food-waste recycling industry. One of the challenges of raising larvae in dense aggregations is their rise in temperature during feeding, which, if not mitigated, can become lethal to the larvae. We propose applying air-fluidization to circumvent such overheating. However, the behavior of such a system involves complex air-larva interactions and is poorly understood. In this combined experimental and numerical study, we show that the larval activity changes the behavior of the ensemble when compared to passive particles such as dead larvae. Over a cycle of increasing and then decreasing airflow, the states (pressure and height) of the live larva aggregates are single-value functions of the flow speed. In contrast, dead larva aggregates exhibit hysteresis characteristic of traditional fluidized beds, becoming more porous during the ramp down of airflow. This history-dependence for passive particles is supported by simulations that couple agent-based dynamics and computational fluid dynamics. We show that the hysteresis in height and pressure of the aggregates decreases as the activity of simulated larvae increases. To test if air fluidization can increase larval food intake, we performed feeding trials in a fluidization chamber and visualized the food consumption via x-ray imaging. Although the food mixes more rapidly in faster airflow, the consumption rate decreases. Our findings suggest that providing moderate airflow to larval aggregations may alleviate overheating of larval aggregations and evenly distribute the food without reducing feeding rates.
1 Introduction
Every year, humans waste over one billion tons of food, a third of all food production [1]. Such excessive food waste also creates management problems. When left unattended in traditional landfills, rotting food becomes an environmental hazard that can spread diseases and release greenhouse gases [2]. One solution to this issue involves feeding the food waste to insects, which subsequently can be rendered into livestock feed or biofuel [3–6]. Black soldier fly larvae (Hermetia illucens) have been used extensively for this process because they reduce the house fly population and have high nutritional value [7–9]. However, raising black soldier fly larvae in denser aggregations than those found in nature creates a number of new challenges, such as the distribution of food, the removal of uneaten food, and the removal of solid and liquid waste produced by the larvae. Furthermore, larval metabolic heat dissipates slowly in dense aggregations, causing them to rise to temperatures lethal to larvae. As a result, it is recommended to grow larvae at area densities lower than five larvae per square centimeter, or equivalently, at heights lower than approximately three times the larval width [8, 10]. This factor limits efficient space utilization in the industry. To feed larvae in denser aggregations, it has been proposed to provide aeration during feeding [11–13].
Providing fluid flows through particle aggregations, a process called fluidization, is a common strategy used in industrial processes such as coal gasification, catalytic cracking, chemical synthesis, heat exchange, and coating [14–16]. During the procedure, air or other inert fluids are forced from below the particle beds. The external flow lifts the particles and allows them to behave like fluids themselves. Fluidization is a collective phenomenon: the flow velocity required for the aggregations to fluidize is insufficient to lift one particle. Fluidization is adopted in industrial applications mainly for three reasons: the increased surface area exposure to the fluid, even distribution of heating, and mixing of particles [14]. While aeration can indeed cool larval aggregations [12], it is unclear if fluidization can improve the mixing of food in the aggregates well. A better understanding of the interactions between airflow and larvae could help improve industrial practices.
Fluidization has also drawn much interest from physicists for generating interesting multiphase states of matter [15, 17, 18]. A fluidization-defluidization cycle is defined as a ramp up and then ramp down in flow rate. A critical feature of fluidized beds undergoing such cycles is that the particulate response to airflow is history-dependent due to granular-level interactions. Both state variables, the air pressure difference across the aggregation, and the aggregation height, show hysteresis effects. Particles pack together more loosely towards the end of the fluidization-defluidization cycle compared to the beginning [15, 17, 18]. Previous fluidization studies have mostly considered passive particles, but black soldier fly larvae have their own energy source and can deform their bodies, thus actively generating forces on their neighbors. This study will show how active matter behaves in a fluidized bed.
In this project, we used both experiments and simulations to examine the behavior of black soldier fly larvae under fluidization-defludization cycles and to develop a minimal model for how living aggregates interact with airflow. We subjected live and dead larvae to ramps in airflow and measured their height and air pressure. To study the effect of activity on fluidization, we developed simulations with actively propelling agents in fluidization-defluidization cycles. Using both approaches, we also explored how food mixes with the larvae under airflow.
2 Materials and Methods
2.1 Experiment
We used the black soldier fly larvae from EVO Conversion Systems for our experiments. Larva sizes were affected by the environmental conditions during growth, including the conditions during shipment. Due to this challenge, we used one of three size classes of larvae (short, medium, and long) in each experiment. Larvae sizes were not mixed in any experiment. Long larvae were 20.1 ± 1.9 mm long, 6.2 ± 0.5 wide, and 4.2 ± 0.6 thick (N = 50). Medium larvae were 12.0 ± 1.4 mm long and 4.4 ± 0.5 mm wide. Short larvae were 9.7 ± 2.2 mm long, 4.0 ± 0.4 wide, and 2.1 ± 0.4 thick (N = 26). In the experiments with dead larvae, we euthanized the larvae by placing them in a freezer overnight and then thawing them to room temperature. We performed the fluidization experiments with larval aggregations with masses 300 and 600 g.
To estimate the larval propulsive force, we placed plastic spheres 6 mm in diameter and 0.11 g each in mass on the surface of the larva aggregates. We tracked the trajectories of the spheres using the circular Hough transform in MATLAB and obtained the acceleration by calculating the finite differences over 0.06-s intervals. The force on a sphere was obtained by multiplying the acceleration by the mass.
The fluidization chamber consisted of a 95 mm-diameter acrylic tube. Beneath the tube, we used a 0.635 cm-thick, porous plastic sheet with 50 μm-diameter pores to support the weight of the larval aggregation and to laminarize the flow. We supplied the airflow by connecting the setup to a Toro Ultra Leaf Blower Vac (51619), whose voltage was controlled manually by a voltage relay Staco 3PN1010. The system can provide a maximum air speed of approximately 2 m/s at the outlet of the fluidization chamber. We performed the fluidization experiments with a voltage ramp rate of 0–100% at 1% per second, as well as two and four times this rate. In a typical trial, airflow velocity increased linearly, was held at the maximum for 20 seconds, and then decreased linearly. In total, each trial took 220 s for the experiments at a 1x ramp rate. For experiments at greater ramp rates, 2x and 4x, all steps of the cycle were sped up accordingly. The duration of the constant velocity phase was halved for the 2x ramp rate and quartered for the 4x ramp rate. As a consequence, 2x trials and 4x trials took a half and a quarter of the time it took for 1x trials, respectively.
We measured air speed and pressure using an OMEGA FMA 1000 series anemometer and a Honeywell pressure sensor. The anemometer was positioned at the top of the setup, and the pressure sensor was placed at the bottom of the larval aggregates (Figure 1E). The data were digitized using an Arduino Uno and saved with MATLAB at a 5 Hz sampling rate.
FIGURE 1
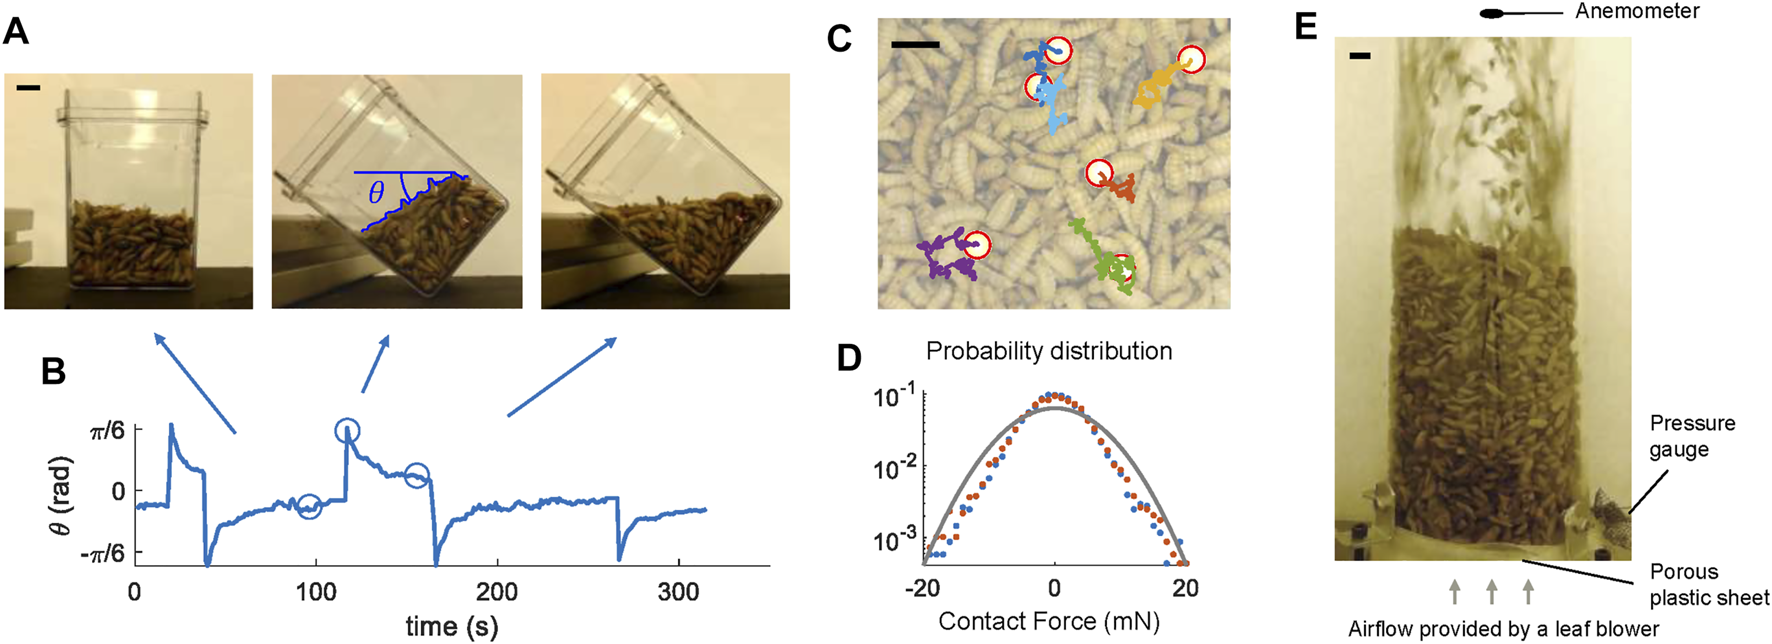
Aggregates of live black soldier fly larvae show fluid-like behaviors. (A) Larva aggregates flow and level with the horizon as the container is tilted. (B) The orientation of the larva aggregate surface with respect to the horizon. The circles represent the snapshots in (A). (C) Plastic spheres in the larva aggregates undergo Brownian motion. Red circles mark the locations of the plastic spheres, and colored lines show their tracked trajectories. (D) The probability distribution of translational forces on the plastic spheres. Blue dots and red dots show the force component in the x and y direction, respectively. The gray line shows a Gaussian distribution with a standard deviation of 6.3 mN. (E) Side view of the fluidization chamber. Scale bars are 1 cm long in all subfigures.
For all trials, we captured side view videos using a webcam at 30 frames per second. We performed video processing using a custom MATLAB program which identified larvae based on the brightness difference and extracted the height of the larval columns as a function of time. In addition, we customized functions within PIVlab [19] to estimate the larval velocity field.
For the feeding trials, we used an x-ray machine (Orthoscan Mobile DI) to visualize the food within the larval aggregation (Figure 6A). In all feeding trials, medium size larvae were used. We prepared a food source composed of water, sugar, agar powder, and 20% contrast agent Omnipaque iohexol for x-ray imaging. We cut the “jelly” into cubes with sides 6.3 ± 0.7 mm long, roughly half the length of a larva. We performed the feeding experiments under three conditions: no flow, slow flow (1.4 m/s), and fast flow (2 m/s). We conducted two trials for each condition. In each trial, we placed four jelly cubes onto the top surface of 150 g larval aggregations before recording x-ray images every 10 s.
2.2 Simulation
We simulated fly larvae in two dimensions as circular discs capable of actively propelling themselves. “Dead” larvae in simulations were the same shape but did not actively apply any forces. We wrote the simulation in the computational fluid dynamics package Basilisk, open-source software based in C [20]. Basilisk solves moving boundary problems using an adaptive Cartesian mesh and the volume of fluid (VOF) technique. The fidelity of this package has been verified in various benchmark tests [20]. We modified the solver to incorporate agent-based rules. The geometry and the dimensionless parameters of the simulation are comparable to those of the experiment, as detailed in the following subsection. Here, we highlight some key aspects of the simulations.
All agents moved following Newton’s second law. Dead larvae were driven by three forces: 1. fluid viscous and pressure forces; 2. gravity; 3. viscoelastic collision forces with other agents and the container walls (Figure 4A). For live larvae, an additional active force Factive was applied. Based on our experimental measurements of the Brownian motion of plastic spheres at the bed surface, we model Factive as Gaussian white noise. The activity intensity is isotropic and homogeneous in the simulations.
In our simulations, the thickness of the virtual shell tshell accounted for 30% of the diameter. The collision force Fcollision was applied when the virtual shells (gray in Figure 4A) overlapped. The virtual shells did not obstruct fluid flows. The collision force consisted of an elastic and a viscous component. , where ks = 1.6 × 10⁶ N/m is the spring constant and c = 0.45 N⋅s/m is the damping coefficient, d and are the distance and relative velocity between the centers of two colliding discs. These values were chosen to prevent the core of the discs from overlapping without using thicker shells.
At each time step, the program updated the location and velocity of each agent. Their translational and rotational velocities became the boundary conditions for the fluid field at the next time step. At the inlet, a turbulent velocity profile was assumed. The velocity followed a 1/7 power-law increased from zero at the side walls to a maximum value at the center [21]. At the outlet, we set the Neumann boundary conditions for velocity and the Dirichlet boundary condition for the pressure. At each time step, the average velocity and pressure across the outlet were measured. The height of the aggregates was calculated by averaging the vertical locations of the 19 highest simulated larvae, which typically represent the top layer of the aggregation.
We simulated larval feeding using circular food with twice the radius of the larvae, which exceeded the size ratio in the experiment. Simulating food elements smaller than the larvae would require finer meshes and more computational time. Here instead of seeking quantitative agreement we sought to discover if our minimal model could capture features of feeding observed in the experiments. At each time step, the area of the food decreased by the product of the number of contacting larvae and a fixed feeding rate. Simulations were performed with fixed flow speeds of 0, 1.4, or 1.8 m/s.
The simulations required high resolution in space and time to resolve the fluid field. The mesh sizes adapt to the local fluid fields at each time step, becoming 0.74 mm wide at their finest. The size of the time step also varied according to the Courant–Friedrichs–Lewy condition requirement for the fluid field calculation [22]. Agents were updated at a fixed time step of 0.12 ms. The flow ramp rate and the feeding rate were sped up in the simulation to reduce the computation time.
We performed the simulations on the Partnership for an Advanced Computing Environment (PACE) clusters at the Georgia Institute of Technology. Fluidization simulations took approximately 5.5 h when calculated on 24 CPU cores in parallel. The simulations with food took approximately 3.5 h. The fluid field and the agent information are saved throughout the simulation. Occasionally, the fluid field failed to converge due to the limited spatial and temporal resolution. In these cases, we restarted the simulation a few time steps before its termination.
2.3 Normalization
Our experiments and simulations are each characterized by five dimensionless groups, including the Reynolds number, Re, which represents the ratio between the fluid inertia to the viscous force; the Froude number Fr, which represents the ratio between gravity and inertia; the activity level k, which represents the ratio of the random force intensity to the air inertial force; the density ratio between larvae and air; the dimensionless size of the larvae, which is the ratio of the larva width to bed width. They are defined as:
Here ρ and umax are the air density and the maximum velocity of the airflow in the fluidization-defluidization cycle, D is the diameter of the fluidization chamber, g is the gravitational acceleration, is the standard deviation of the active force, wlarvae is the width of the larvae in the experiments. Experiments are characterized by another dimensionless group, wlarvae/Llarvae, the aspect ratio of the larvae, which was not matched in the simulations, which assumed circular particles.
The values of the dimensionless parameters are shown in Table 1. The orders of magnitude of all dimensionless groups are matched, except for the Reynolds number. Re is 105 in the experiments and 5 × 10⁴ in the simulations, indicating the fluid inertia dominates over viscous effects. We artificially increased the viscosity of air by a factor of 10 to ensure that the fluid field could be simulated without using finer meshes. For the feeding trials, k = 0.25 was used for simulating live larvae.
TABLE 1
| Dimensionless parameters | Experiment | Simulation |
|---|---|---|
| Re | 105 | 5 × 10⁴ |
| Fr | 4.2 | 5 |
| K | 0.17 | 0–2.5 |
| ρ s /ρ | 500 | 500 |
| w larva /D | 0.042 | 0.050 |
Dimensionless parameters in the experiments and simulations.
The response of the system is also presented using dimensionless variables. We normalized the three state variables, pressure p, air velocity u, and height of the larvae bed h. We define their dimensionless counterparts P*, U*, and H* (Figure 2A) as:where Mlarvae and Vlarvae are the total mass and volume of the larvae in the container, g the gravitational acceleration, and A the cross-sectional area of the chamber. Dimensionless pressure P* = 1 signifies the fluidization condition, which arises when the total larvae weight equals the applied air pressure force (which develops as the flow is forced through the porous medium). In this condition, the container is fluidized such that particles enter a collisional regime and do not experience enduring contacts. For most experiments, P* = 1 when the airflow velocity reached 1.6 m/s. Therefore, we used 1.6 m/s to normalize the velocity. H* is normalized by the height of the larvae if they had filled all the gaps among them. H* equals the inverse of the volume fraction.
FIGURE 2
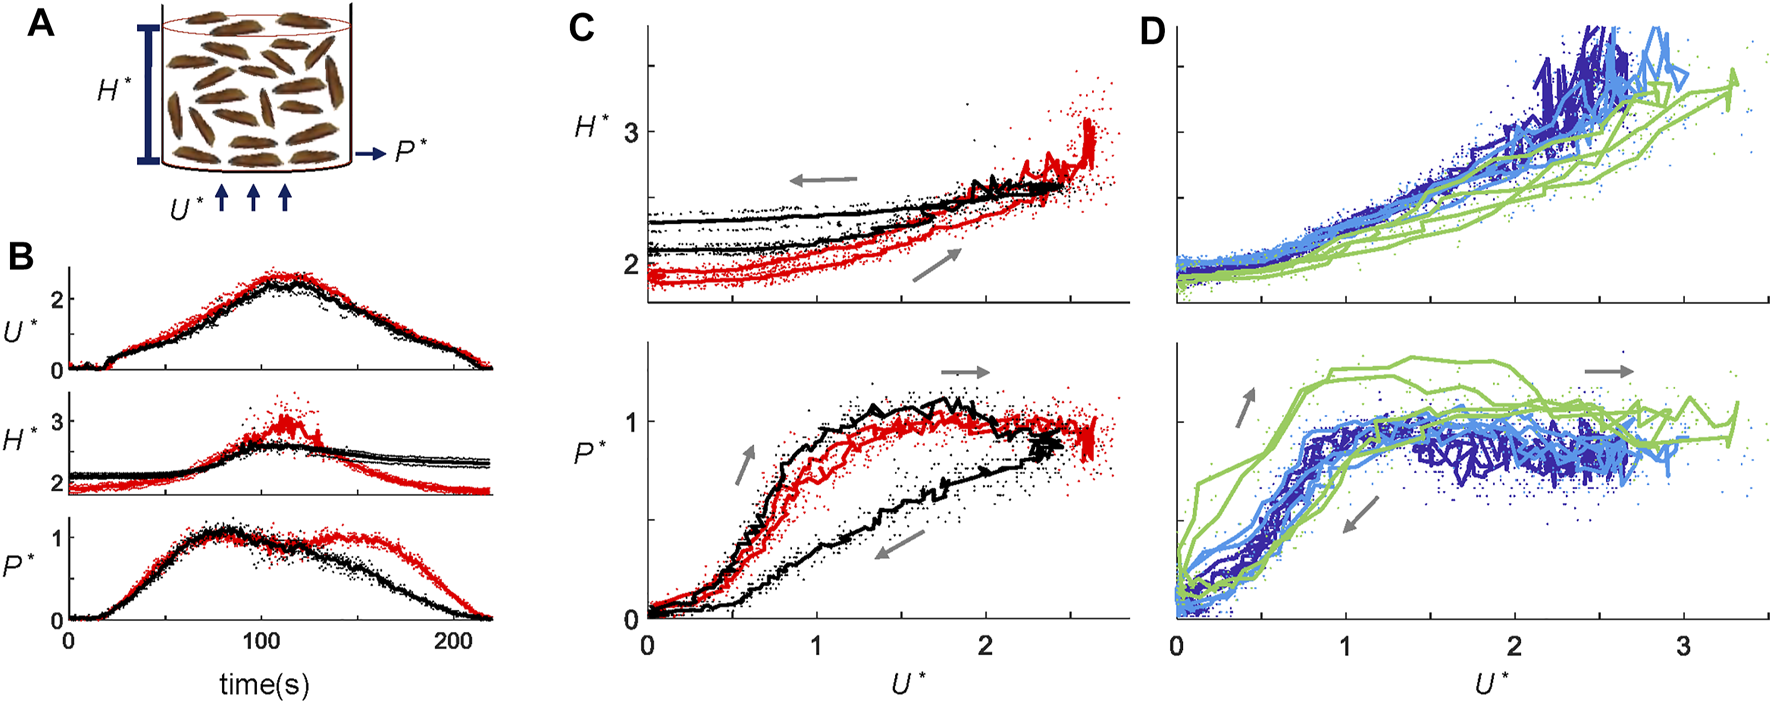
Larva fluidization-defluidization experiments. (A) Schematic of the fluidization setup. (B) Time series of dimensionless variable U*, H*, and P* in a fluidization cycle for 300 g “long” larvae at the 1x ramping rate. Red shows the live larva trials, and black shows the dead larva trials. (C) Hysteresis diagram plotting H* and P* as functions of U*. Data and the color scheme are the same as (B). (D) Hysteresis diagram for 300 g short larvae at ramping rates of 1x (dark blue), 2x (light blue), and 4x (green). Dots represent the raw data, whereas the solid lines show the average across trials.
3 Results
3.1 Fluidization
Aggregations of black soldier fly larvae behave like fluids even without external fluid flows (Supplementary Video S1 and Figure 1A). For example, as the container of larvae is tilted, the larvae rearrange themselves, creating a level interface. Their movement creates a new configuration minimizing the center of mass. Figure 1B and Supplementary Video S1 shows the orientation of the surface θ due to a series of inclinations of the container. As we moved the container, the magnitude of θ initially increased but then θ converged to zero within tens of seconds. Similarly, after larvae were forced to separate and occupy more volume due to the fluidization process (Figure 1E), larvae returned to the original densely-packed state through a continuous movement of individuals. Plastic spheres within the top layers of the larva aggregates exhibit approximate Brownian motion as shown in Figures 1C,D. Through tracking the movement of the spheres, we fit the force acting on each sphere to a 2D Gaussian distribution and obtained a standard deviation of 6.3 mN. Since the spheres are similar in size to the larvae, this provides an estimate for the force a larva within the aggregate would experience due to their neighbors’ activity. The propulsive force generated by the larva itself should also be on the same order of magnitude.
We performed 25 fluidization-defluidization cycles using both live and dead larvae (Supplementary Video S2). Figure 2B shows the dimensionless height H* and air pressure P* of the aggregation as functions of time, with dead larvae shown by the black curves and live larvae by the red curves (Source data provided in Supplementary Table S1). To highlight the magnitude of hysteresis, Figure 2C plots the state variables H* and P* against U*. As the flow velocity increases and then decreases, dead larva aggregates expand and then contract. However, dead larvae do not return to their original height at the end of the fluidization-defluidization cycle. Instead, they form a more loosely packed configuration. This results in hysteresis, where the state of the system depends not only on the applied flow rate but also on its history. Such hysteresis is a characteristic of fluidized beds, as shown by numerous experiments with various granular systems, from sand to glass particles [18, 23]. The dimensionless pressure P* also shows hysteresis, but a second mechanism becomes apparent. Similar to the fluidization of closely packed glass beads, during the airflow increase, pressure P* of dead larvae exceeds 1 momentarily. At this moment, the air pressure force exceeds the gravity on the larvae since the aggregation cannot expand fast enough to fluidize. As U* later decreases, dead larvae aggregates settle down to a more porous arrangement, allowing P* to be lower than before.
In contrast to typical granular systems, live larvae do not show hysteresis. As shown by the red curves in Figure 2C, height H* and pressure P* are both single-valued functions of U*. The larvae activity evidently erases the memory effect of the granular material, making the fluidization-defluidization cycles independent of their history. We saw earlier that without flow, larvae rearranged to assume the lowest gravitational potential. Live larval aggregations expand earlier during increasing flow and pack themselves for a more extended period during decreasing airflow. We hypothesize that the rearrangement in live larval aggregates requires a specific time scale. If velocity U* is varied at a rapid enough pace, larvae would not have enough time to rearrange, and pressure P* and height H* would show hysteresis.
To test this hypothesis, we performed experiments at various air ramp rates, from 2 cm/s2 (1x) to 8 cm/s2 (4x). Long larvae were used for Figure 2D. Short larvae in Figure 2D behave the same as the long larvae in Figure 2C at the 1x ramp rate. Nonetheless, Figure 2D shows that indeed, when the airflow increases at 8 cm/s2, four times the original rate, even live larvae demonstrate hysteresis (bright green). Why do live larvae exhibit hysteresis at high ramp raptes? Larval aggregations respond similarly at all flow decelerations. However, at the highest accelerations, they do not have enough time to rearrange and adjust to the increasing flow, thus displaying hysteresis. The inability to cope with this time scale indicates that live larval aggregations in our system can be considered as fluids if the time scale of the disturbance is more than approximately 25 s, the duration of air acceleration at 4x ramp rate. This time scale is comparable to the time for a larva to crawl its body length, around 7 seconds ([24]).
We quantify the extent of hysteresis, ΔH* and ΔP*, as the area between the hysteresis diagrams (Figure 3A). Figure 3B summarizes the fluidization trials and shows that live larvae show hysteresis only at higher ramp rates. Dead larvae show hysteresis under all conditions.
FIGURE 3
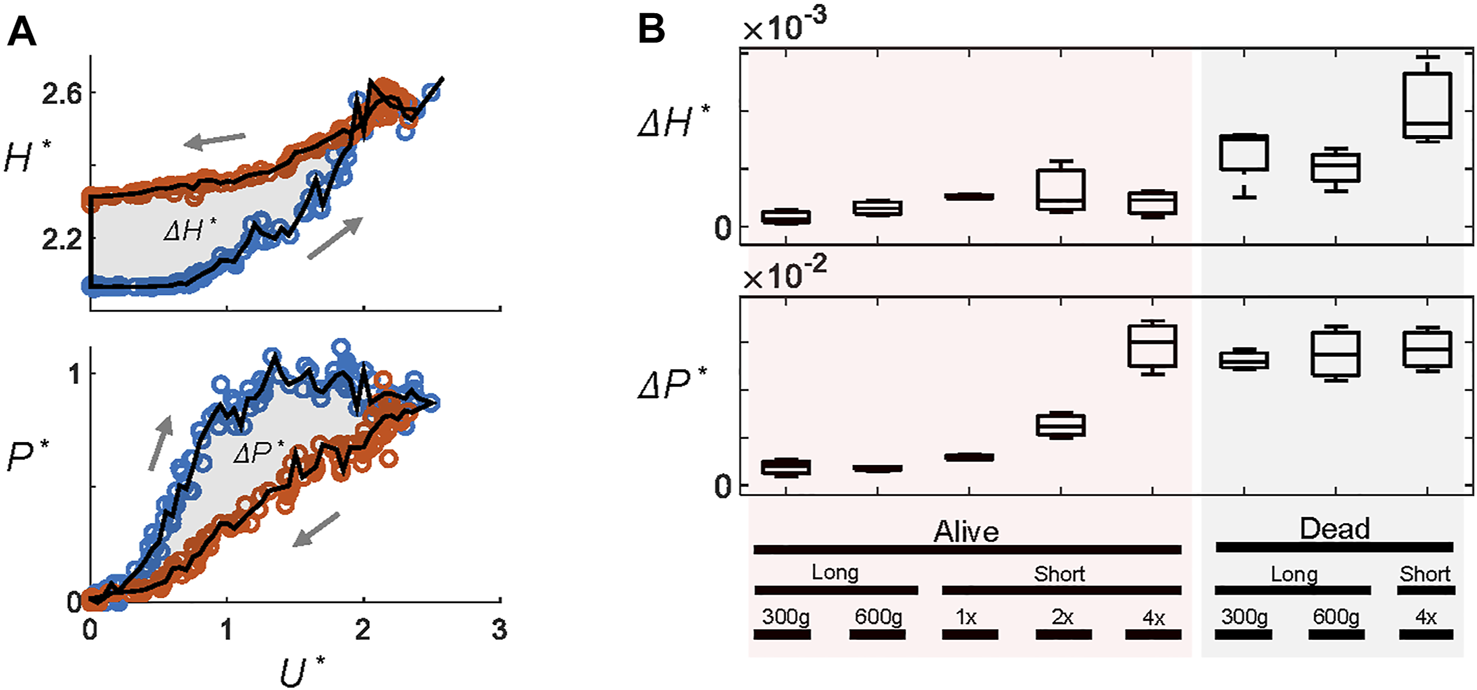
The magnitude of hysteresis. (A) Hysteresis metrics ΔH* and ΔP* are defined as the area between the curves in the hysteresis diagrams such as Figures 2C,D. Here, blue and red circles represent ramping up and down, respectively. (B) ΔH* and ΔP* under different flow conditions. “Long” and “short” refer to the size of the larvae used. Other conditions include the total weight of larvae (300 g or 600 g) and the ramp rate (1x, 2x, and 4x). All long larva experiments are performed at 1x, and all short larvae experiments are 300 g.
The simulations recover the experimental measurements qualitatively through modeling larval activity with propulsive forces that act in random directions and magnitudes. We simulated 296 discs that move under physical forces as well as active propulsive forces [Figures 4A,B (Supplementary Video S3)]. Figure 4C shows as the dimensionless activity levels k increases from 0 to 2.5, the hysteresis in both height H* and pressure P* decreases. The ramp rate was 11.2 times the original speed, or 2.8 times the fastest ramp rate performed in experiments. The response during the ramp-up period is similar to those in Figures 2C,D. Active discs rise earlier and more smoothly. However, due to lack of friction and other simplifications made in the simulation, during the ramp down, H* is lower, and P* is higher compared to dead larvae (Figures 2C,D). Figure 4D demonstrates that ΔH* and ΔP* start to decrease when k > 1 or when the random propulsion is comparable with the scale of the air pressure force. Our simulation suggests that the hysteresis-free behavior of live larval aggregation does not require active strategies that involve sensory information. Instead, it can be achieved simply through larvae exerting random propulsive forces (achieved in their case via body self-deformation and locomotion).
FIGURE 4
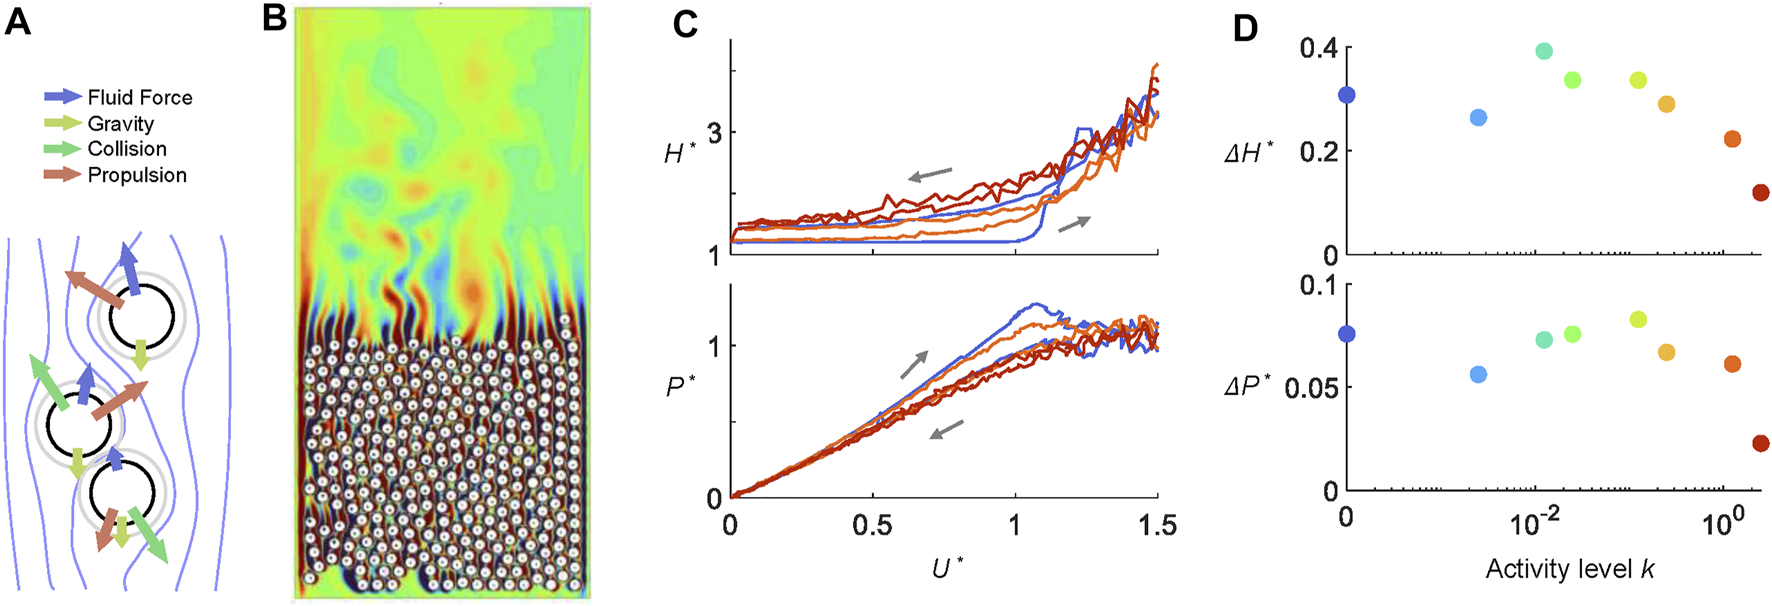
Larva fluidization-defluidization simulations. (A) Agents move under fluid forces, collisional forces, and a random force that mimics larval activity. (B) A snapshot from the simulation of 396 active cylinders in ramping air flows. Contour colors represent the magnitude of the vorticity field. (C) Hysteresis diagram and (D) hysteresis metric ΔH* and ΔP* of cylinders at various activity level k. In both (C–D), k = 2.5 is shown in red, k = 1.25 in orange, and k = 0 in blue.
3.2 Feeding and Mixing
Figure 5 shows that under low airflow, the larva motion is suppressed at positions deeper in the aggregation. In both experiments and simulations, with applied flow velocity from U* = 0 to U* = 0.6, larvae closer at the top surface move more rapidly than larvae in the bulk. This is because the contact forces among larvae are higher for the bottom layers due to the weight on top of them. The effect of self-propulsion is therefore negligible. In contrast, with little weight to support, larvae at the top layers “flow” freely. This points to the challenge of feeding in dense aggregations. Food may be mixed and consumed among the larvae close to the top surface, but larvae at the bottom layers remained unfed.
FIGURE 5
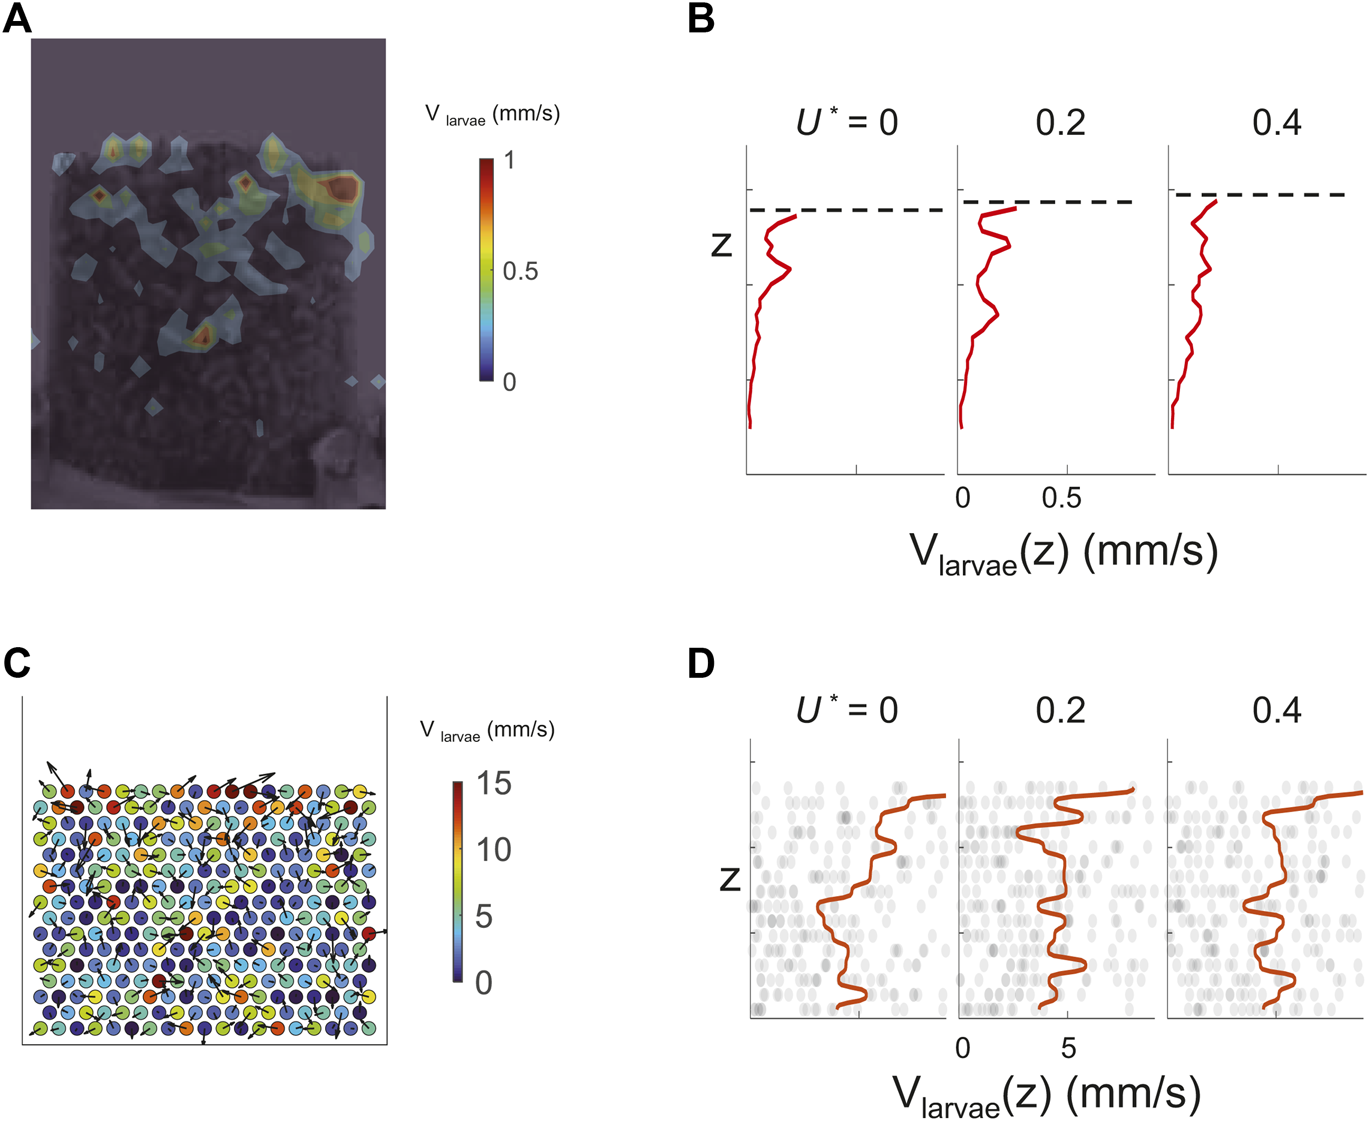
Top layers of both live and simulated larvae move more rapidly. (A) Larval speed distribution at the boundary measured using Particle Image Velocimetry (PIV). The color bar shows the scale in mm/s. (B) Average larval speed (x-axis) at different elevation z (y-axis). Elevation level z corresponds to that in A. Dash lines mark the top surface of the larva aggregates in each snapshot. (C) Speed of active cylinders at the onset of fluidization is shown using colors and arrows. The color bar shows the scale in mm/s. (D) Average cylinder speed from simulation, the axes arrangement is the same as (B).
We confirmed the non-uniformity of motion using X-ray imaging experiments where we fed the larvae cubes of jelly. Figures 6A–C and Supplementary Video S4 show that without flow, jelly cubes remain at the top of the aggregation. Under airflow, more layers of larvae can move, and the food can be distributed deeper into the aggregations. When the air speed is high (2 m/s), the larval aggregation is fully fluidized, and both food and larvae travel rapidly in the chamber. Surprisingly, despite a broader spatial distribution, jelly cubes were consumed at comparable or slower rates with respect to the no-flow condition (Figure 6D). Under fast flow, large pieces of food were still found after 15 min. However, jelly cubes fed to larvae without flow or with slow flow disappeared in approximately 5 min.
FIGURE 6
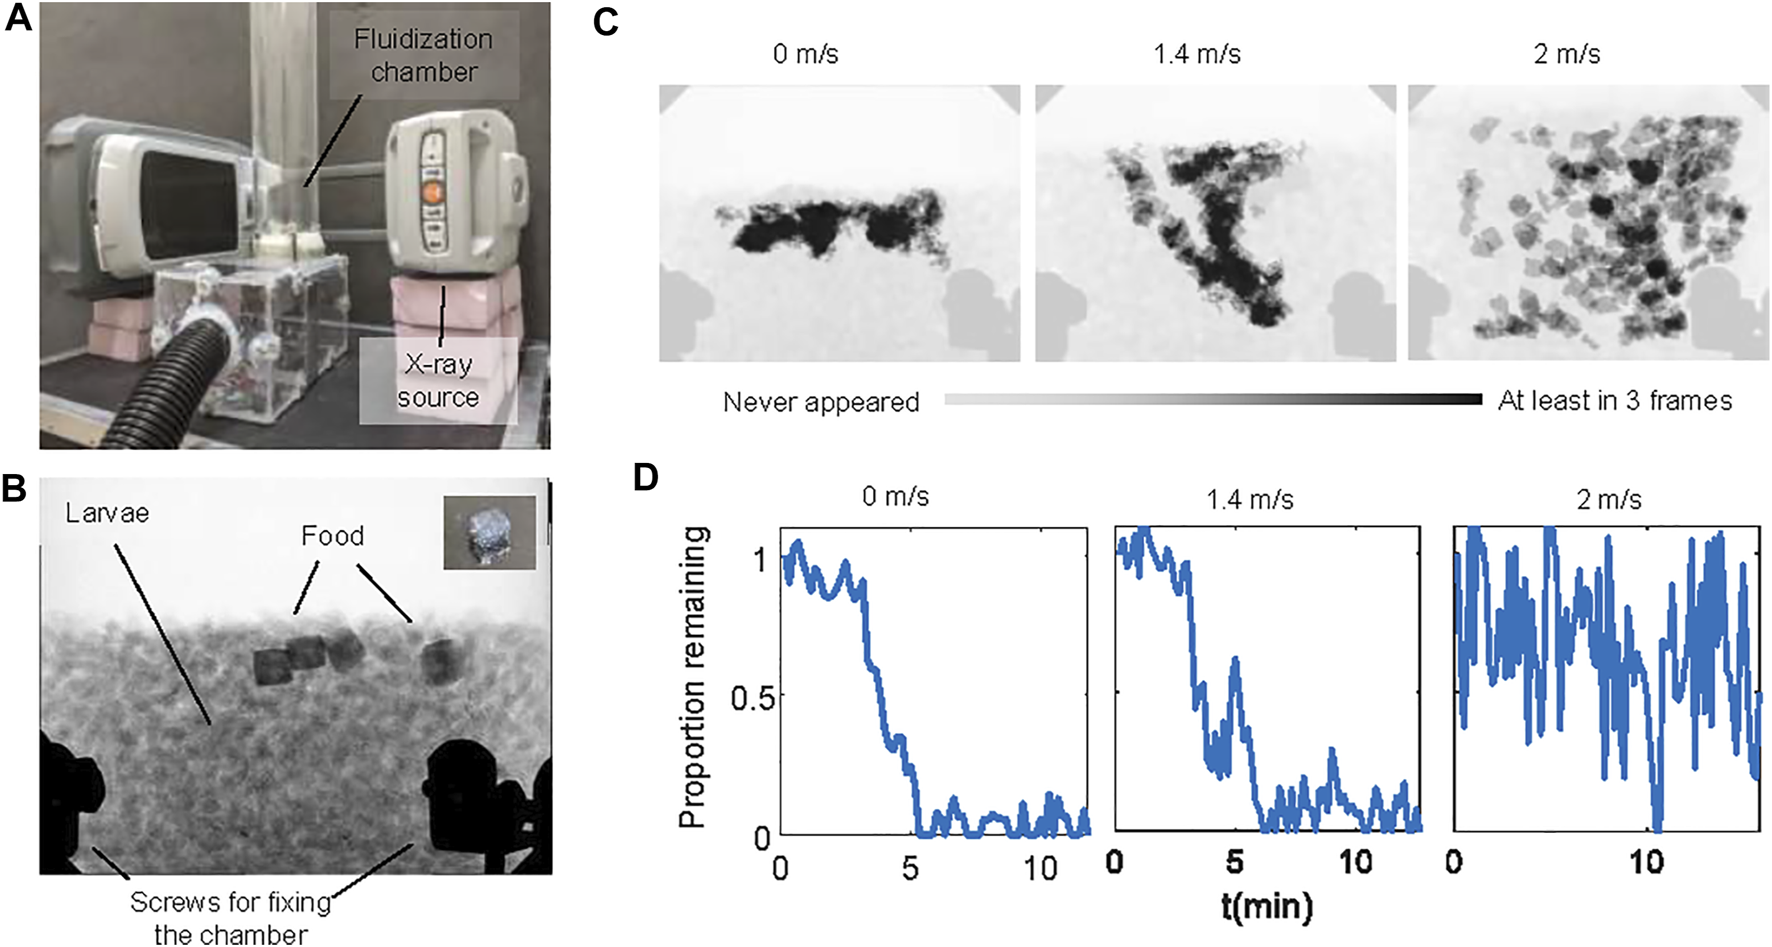
Larva feeding experiments with cubic jellies. (A) The experimental setup for the feeding experiment consists of the fluidization chamber and a portable x-ray machine. (B) A representative X-ray image of the experiment. Darker regions near the top of the aggregations are food. The inset shows a picture of the cube-shaped jelly. The black shades near the bottom of the image are the screws of the chamber. (C) The spatial distribution of the food using time-lapse photography. Light gray shows that the food never appeared in the location throughout the video. Black shows that the food appeared at least in three video frames. (D) Time series of the proportion of food remaining in the chamber under no flow, slow flow, and fast flow conditions. Larvae used in here are medium size (see the Materials and Methods section).
Similar conclusions were reached through simulating food particles that decreased in areas at a rate proportional to the number of neighbors (Supplementary Video S5). While a higher flow mixes the food more uniformly (Figure 7A), the feeding rate decreases (Figure 7B). The simulations also provide a potential reason for this observation: as food and larvae are agitated by rapid flows, larvae are more likely to be suspended in mid-air without contacting the food (Figure 7C). This suggests that a moderate flow rate would be optimal for feeding dense aggregations of larvae. Such moderate flows prevent the larvae from being airborne for a prolonged period of time, while allowing food to travel deeper into the aggregation. The optimal flow rates for larval feeding remains to be determined in future research.
FIGURE 7
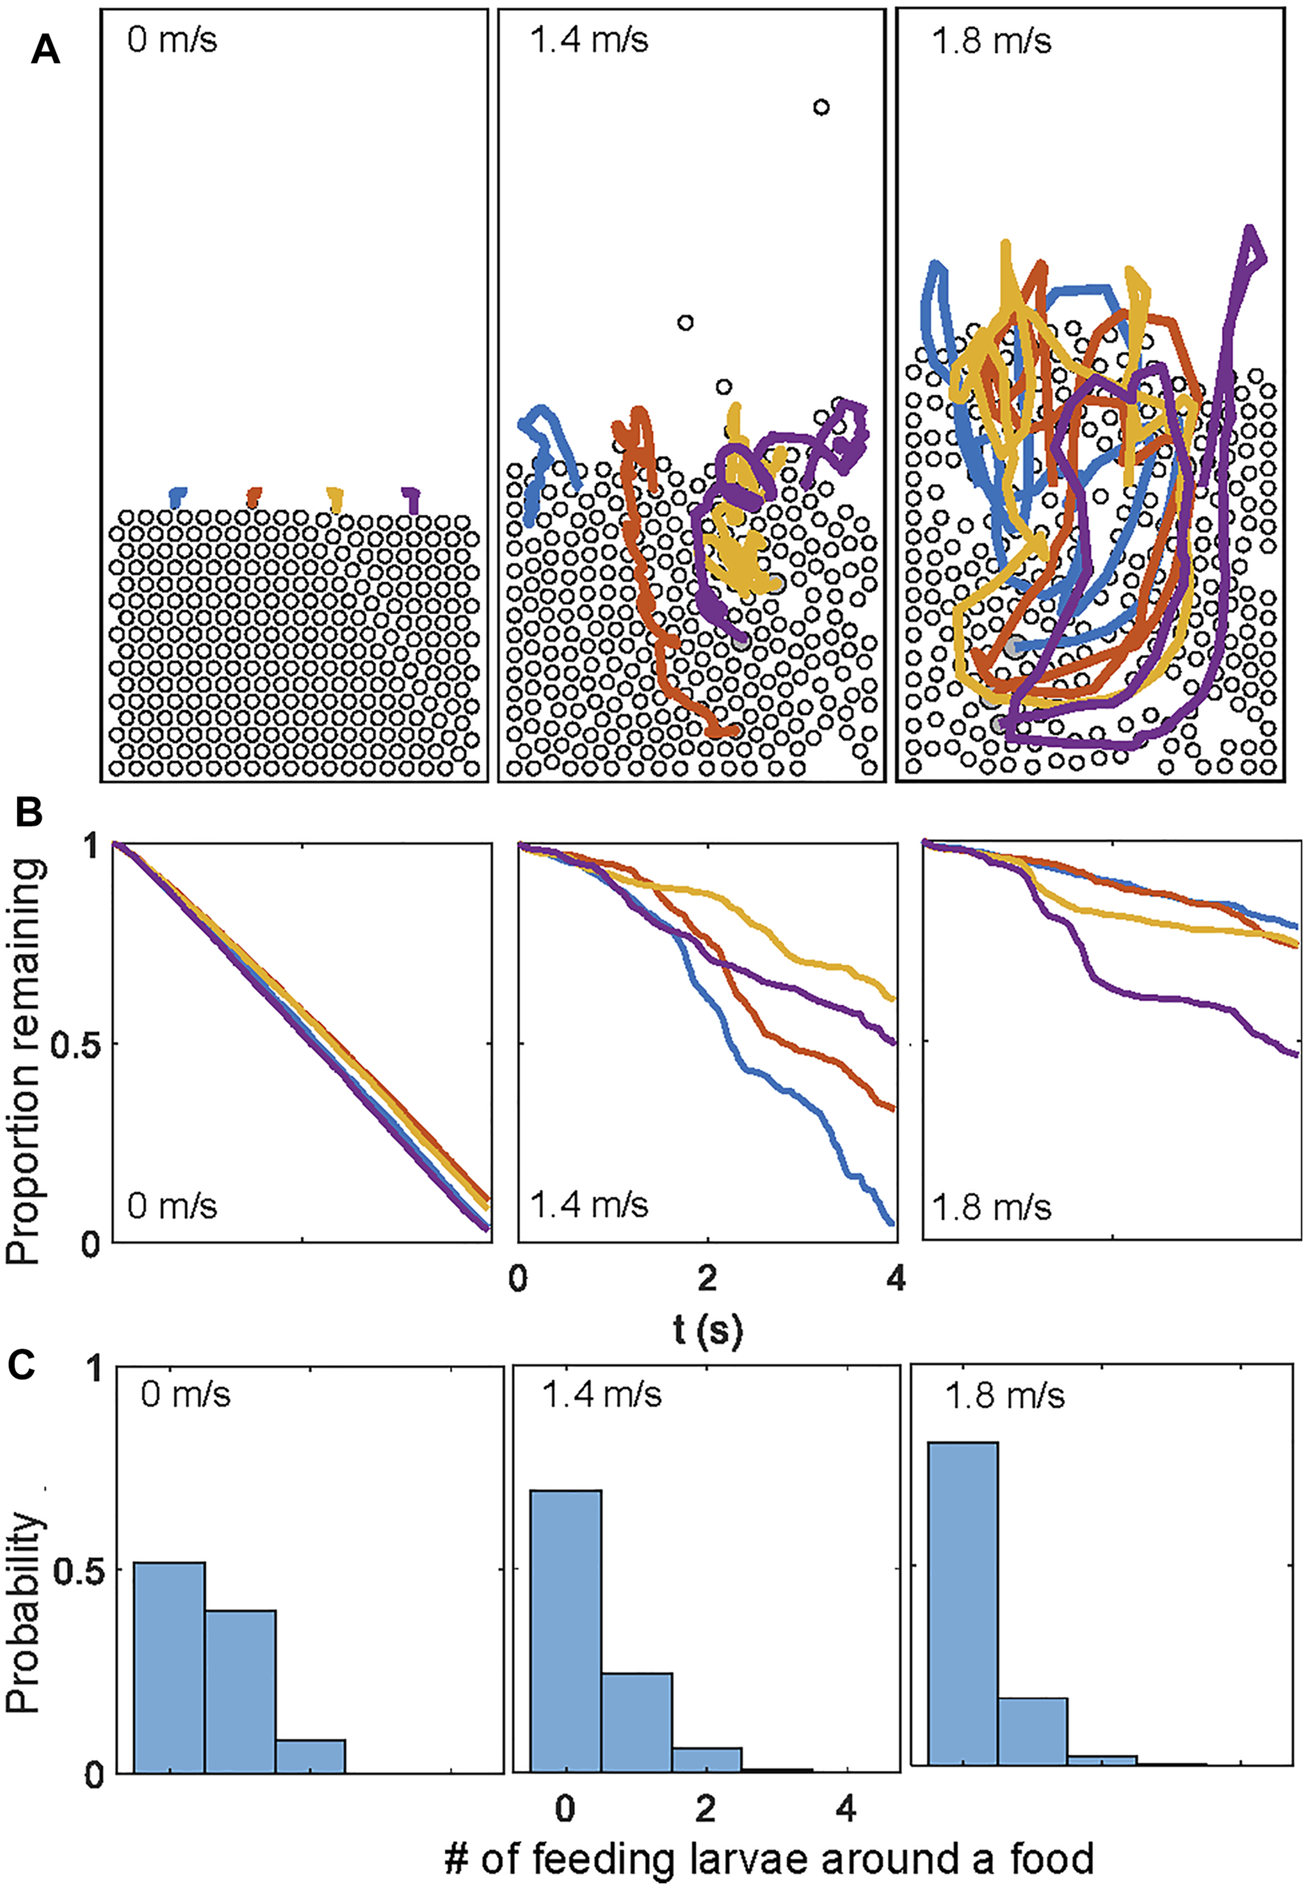
Larva feeding simulations for different constant fluidization air speeds. (A) Trajectories of the four food particles. (B) Time series of the proportion of food remaining in the simulation over approximately 4 seconds. The feeding rates are significantly sped up in the simulations. (C) The histogram of numbers of “eating” larvae, defined as those contacting and consuming food in each time step.
4 Discussion
Mixing granular materials is critical to a wide range of industrial applications. Typically, it is achieved through applying external forces [25–28]. Common strategies require motions of the container, such as a rotating drum [29] or a manually tossed wok [30]. Air-fluidization provides another method to mix particulate matter since it does not require intrusion into or boundary-driven agitation of the particles, allowing nearly uniform particle motion. Black soldier fly larvae, on the other hand, can move like a fluid without airflow. Their activity propels them in random directions, which allows the aggregation to flow and minimize its gravitational potential. However, mixing through larval activity alone is limited since gravitational forces dominate their activity in deeper layers via the high contact forces due to increasing “lithostatic pressure”. By carefully varying the airflow from below, black soldier fly farmers may optimize mixing, maximize larva feeding rates, and improve their use of space. Future research could help elucidate the optimal conditions for larva feeding, such as the flow rate and the food density.
Our work expands upon knowledge of biological aggregations, which have been shown to demonstrate fluid-like behaviors. These aggregations can be considered active granular fluids, where the animal movement prevails over the contact forces among individuals. As a result, live larva aggregates do not jam like grains in a fluidization-defluidization cycle. Active granular fluids span from the scale of plant cells [31] to that of fly larvae and can be realized with centimeter-scale robots [32]. It remains an open question how these active fluids consisting of millimeter-scale or micrometer-scale constituents behave differently from traditional fluids made up of nanometer-scale molecules. More intriguingly, how do fluids of different scales interact with each other? This paper presents one example of such interactions. More research is required to describe the behaviors of such systems.
The simulations presented in this paper are among the first to incorporate active particle dynamics into particle suspensions in fluids. Our simulations had several simplifications. To reduce running time, we used two-dimensional particles and decreased fluidization-defluidization cycle durations. We also used a rigid circular geometry for the larvae. Assuming frictionless particles may have reduced jamming effects during decreasing airflow. Lastly, larval activities were simplified as random body forces. Therefore, experimental observations such as larva squeezing through narrow gaps could not be simulated. Despite these shortcomings, our simulations successfully recovered features of fluidization, such as the plateauing of air pressure as airflow velocity increases, through capturing complex agent-environment interactions. The simplified form of activity in our simulation also caused the collectives to behave like fluids and reduced the magnitude of hysteresis, matching the behavior of live larval aggregates at least qualitatively. The relative success in these simulations paves the way for future studies that focus on animal collective behaviors in moving fluids.
Statements
Data availability statement
The original contributions presented in the study are included in the article/Supplementary Material, further inquiries can be directed to the corresponding author.
Author contributions
HK, OS, DH, and DG contributed to the conception and design of the study. OS performed preliminary experiments. HK, GC, performed the experiments and collected data. EA prepared experimental materials. HK designed and performed the simulations. HK performed video processing. HK wrote the first draft of the manuscript. All authors contributed to manuscript revision, read, and approved the submitted version.
Funding
This study is supported by the Army research office (72989-EG and W911NF-12-R-001), ARO MURI award (W911NF-19-1-023), and NSF Physics of Living Systems Grant (PHY-1205878).
Acknowledgments
This research was supported in part through research cyberinfrastructure resources and services provided by the Partnership for an Advanced Computing Environment (PACE) at the Georgia Institute of Technology, Atlanta, Georgia, United States. Black soldier fly larvae were provided by the generous support from EVO Conversion Systems LLC. We thank Andras Karsai for providing feedback on our manuscript.
Conflict of interest
The authors declare that the research was conducted in the absence of any commercial or financial relationships that could be construed as a potential conflict of interest.
Publisher’s note
All claims expressed in this article are solely those of the authors and do not necessarily represent those of their affiliated organizations, or those of the publisher, the editors and the reviewers. Any product that may be evaluated in this article, or claim that may be made by its manufacturer, is not guaranteed or endorsed by the publisher.
Supplementary material
The Supplementary Material for this article can be found online at: https://www.frontiersin.org/articles/10.3389/fphy.2021.734447/full#supplementary-material
Supplementary Video S1Fluid-like behavior of live larval aggregates in a container 10x.
Supplementary Video S2Air-fluidized aggregates of live and dead larvae 16x.
Supplementary Video S3Simulations of fluidized beds of active disks.
Supplementary Video S4Feeding larva aggregates under airflow 100x.
Supplementary Video S5Simulations of larvae feeding under airflow.
Supplementary Table S1An excel sheet of time series of U*, H*, P* in fluidization experiments.
References
1.
Gustavsson J Cederberg C Sonesson U Van Otterdijk R Meybeck A . Global Food Losses and Food Waste Section 3.2 (Study conducted for the International Congress “Save Food!” at Interpack2011, Düsseldorf, Germany) (FAO, Rural Infrastructure and Agro-Industries Division, 2011). Available at https://www.nature.com/articles/nature10452#Bib1 (2011).
2.
Hall KD Guo J Dore M Chow CC . The Progressive Increase of Food Waste in america and its Environmental Impact. PloS One (2009) 4:e7940. 10.1371/journal.pone.0007940
3.
Diener S Zurbrügg C Tockner K . Conversion of Organic Material by Black Soldier Fly Larvae: Establishing Optimal Feeding Rates. Waste Manag Res (2009) 27:603–10. 10.1177/0734242x09103838
4.
Hale O . Dried Hermetia Illucens Larvae (Diptera: Stratiomyidae) as a Feed Additive for Poultry. Ga Entomol Soc J (1973) 8:16–20.
5.
Newton GL Booram CV Barker RW Hale OM . Dried Hermetia Illucens Larvae Meal as a Supplement for Swine. J Anim Sci (1977) 44:395–400. 10.2527/jas1977.443395x
6.
Li Q Zheng L Cai H Garza E Yu Z Zhou S . From Organic Waste to Biodiesel: Black Soldier Fly, Hermetia Illucens, Makes it Feasible. Fuel (2011) 90:1545–8. 10.1016/j.fuel.2010.11.016
7.
Diener S Zurbrügg C Gutiérrez FR Nguyen DH Morel A Koottatep T et al Black Soldier Fly Larvae for Organic Waste Treatment Prospects and Constraints. Proc WasteSafe (2011) 2:13–5. 10.1007/s12649-011-9079-1
8.
Sheppard DC Tomberlin JK Joyce JA Kiser BC Sumner SM . Rearing Methods for the Black Soldier Fly (Diptera: Stratiomyidae): Table 1. J Med Entomol (2002) 39:695–8. 10.1603/0022-2585-39.4.695
9.
Sheppard C . House Fly and Lesser Fly Control Utilizing the Black Soldier Fly in Manure Management Systems for Caged Laying Hens. Environ Entomol (1983) 12:1439–42. 10.1093/ee/12.5.1439
10.
Parra Paz AS Carrejo NS Gómez Rodríguez CH . Effects of Larval Density and Feeding Rates on the Bioconversion of Vegetable Waste Using Black Soldier Fly Larvae Hermetia Illucens (L.), (Diptera: Stratiomyidae). Waste Biomass Valor (2015) 6:1059–65. 10.1007/s12649-015-9418-8
11.
Shishkov O Hu M Johnson C Hu DL . Systems and Methods for Cooling a Plurality of Containerized Animals. WO 2017/106475 Al (2019).
12.
Cheng JYK Chiu SLH Lo IMC . Effects of Moisture Content of Food Waste on Residue Separation, Larval Growth and Larval Survival in Black Soldier Fly Bioconversion. Waste Manag (2017) 67:315–23. 10.1016/j.wasman.2017.05.046
13.
Palma L Ceballos SJ Johnson PC Niemeier D Pitesky M VanderGheynst JS . Cultivation of Black Soldier Fly Larvae on almond Byproducts: Impacts of Aeration and Moisture on Larvae Growth and Composition. J Sci Food Agric (2018) 98:5893–900. 10.1002/jsfa.9252
14.
Kunii D Levenspiel O . Fluidization Engineering. Oxford, United Kingdom: Butterworth-Heinemann (1991).
15.
Sundaresan S . Instabilities in Fluidized Beds. Annu Rev Fluid Mech (2003) 35:63–88. 10.1146/annurev.fluid.35.101101.161151
16.
Jackson R . The Dynamics of Fluidized Particles. Cambridge, United Kingdom: Cambridge University Press (2000).
17.
Ojha R Menon N Durian DJ . Hysteresis and Packing in Gas-Fluidized Beds. Phys Rev E (2000) 62:4442–5. 10.1103/physreve.62.4442
18.
Goldman DI Swinney HL . Signatures of Glass Formation in a Fluidized Bed of Hard Spheres. Phys Rev Lett (2006) 96:145702. 10.1103/physrevlett.96.145702
19.
Thielicke W Stamhuis E . Pivlab–towards User-Friendly, Affordable and Accurate Digital Particle Image Velocimetry in Matlab. J Open Res Softw (2014) 2:30. 10.5334/jors.bl
20.
Popinet S . Basilisk (2014). Available from: http://basilisk.fr (Accessed December 2020).
21.
Schlichting H Gersten K . Boundary-layer Theory. New York, United States: Springer (2016).
22.
Courant R Friedrichs K Lewy H . Uber die partiellen Differenzengleichungen der mathematischen Physik. Math Ann (1928) 100:32–74. 10.1007/bf01448839
23.
Goldman DI . Pattern Formation and Fluidization in Vibrated Granular Layers, and Grain Dynamics and Jamming in a Water Fluidized Bed. Ph.D. Thesis. Ann Arbor, MI: The University of Texas at Austin; ProQuest Dissertations Publishing (2002).
24.
Shishkov O Hu M Johnson C Hu DL . Black Soldier Fly Larvae Feed by Forming a fountain Around Food. J R Soc Interf (2019) 16:20180735. 10.1098/rsif.2018.0735
25.
Jaeger HM Nagel SR Behringer RP . Granular Solids, Liquids, and Gases. Rev Mod Phys (1996) 68:1259–73. 10.1103/revmodphys.68.1259
26.
Goldhirsch I . Rapid Granular Flows. Annu Rev Fluid Mech (2003) 35:267–93. 10.1146/annurev.fluid.35.101101.161114
27.
Jaeger HM Nagel SR . Physics of the Granular State. Science (1992) 255:1523–31. 10.1126/science.255.5051.1523
28.
Campbell CS . Rapid Granular Flows. Annu Rev Fluid Mech (1990) 22:57–90. 10.1146/annurev.fl.22.010190.000421
29.
Schlick CP Fan Y Umbanhowar PB Paul B Ottino M Lueptow RM . Granular Segregation In Circular Tumblers: Theoretical Model And Scaling Laws. J Fluid Mech (2015) 765:632–652.
30.
Ko H Hu DL . The Physics of Tossing Fried rice. J R Soc Interf (2020) 17:20190622. 10.1098/rsif.2019.0622
31.
Bérut A Chauvet H Legué V Moulia B Pouliquen O Forterre Y . Gravisensors in Plant Cells Behave like an Active Granular Liquid. Proc Natl Acad Sci USA (2018) 115:5123–8. 10.1073/pnas.1801895115
32.
Li S Dutta B Cannon S Daymude JJ Avinery R Aydin E et al Programming Active Cohesive Granular Matter with Mechanically Induced Phase Changes. Sci Adv (2021) 7(17):eabe8494. 10.1126/sciadv.abe8494
Summary
Keywords
black soldier fly larvae, fluidization, living matter, collective behavior, activity, Gaussian force, CFD, agent-based simulation
Citation
Ko H, Cassidy GJ, Shishkov O, Aydin E, Hu DL and Goldman DI (2021) Air-Fluidized Aggregates of Black Soldier fly Larvae. Front. Phys. 9:734447. doi: 10.3389/fphy.2021.734447
Received
01 July 2021
Accepted
20 October 2021
Published
02 December 2021
Volume
9 - 2021
Edited by
Tim Landgraf, Freie Universität Berlin, Germany
Reviewed by
Louwrens Hoffman, The University of Queensland, Australia
Shih-Yuan Chen, North Carolina State University, United States
Updates
Copyright
© 2021 Ko, Cassidy, Shishkov, Aydin, Hu and Goldman.
This is an open-access article distributed under the terms of the Creative Commons Attribution License (CC BY). The use, distribution or reproduction in other forums is permitted, provided the original author(s) and the copyright owner(s) are credited and that the original publication in this journal is cited, in accordance with accepted academic practice. No use, distribution or reproduction is permitted which does not comply with these terms.
*Correspondence: Daniel I. Goldman, daniel.goldman@physics.gatech.edu; David L. Hu, hu@me.gatech.edu
This article was submitted to Social Physics, a section of the journal Frontiers in Physics
Disclaimer
All claims expressed in this article are solely those of the authors and do not necessarily represent those of their affiliated organizations, or those of the publisher, the editors and the reviewers. Any product that may be evaluated in this article or claim that may be made by its manufacturer is not guaranteed or endorsed by the publisher.