Abstract
Chinese lacquerware is an important invention of arts and crafts in China. In this study, Chinese lacquerware is characterized using terahertz reflectometric imaging. The lacquerware studied herein comprises an ornamental wood panel covered by multiple layers of lacquers to portray motifs. For characterizing lacquerware, a terahertz time-domain spectroscopic reflectometric imaging system is proposed. The role of the proposed terahertz imaging system in highlighting the interface between layers during stratigraphic buildup in reflection geometry is proved. The proposed system provides a universal method for assessing the structural information of lacquered objects in a contactless and non-invasive manner; moreover, it provides two-dimensional images, subsurface three-dimensional images, and stratigraphic images (b-scans) in a contactless and non-invasive manner. Using the proposed system, we examine the buried layers of the lacquerware, including faults in the wooden layer and damages in the lacquerware. Research shows the promising prospects of terahertz time-domain spectroscopic reflectometric imaging as a non-destructive detection technique suited to lacquerware.
Introduction
Chinese lacquerware is an important invention of arts and crafts in China. It is used to create beautiful colored patterns on the surface of utensils. Traditional Chinese lacquerware, as ornamental artifacts, comprise several composite layers of lacquer and rank among the most important forms of expression in Chinese art. Generally, raw lacquer is applied onto utensil surfaces. Raw lacquer is obtained from lacquer trees and primarily comprises urushiol, laccase, gum, and water. By using raw lacquer as paint, the Chinese formulated different colors of paint gloriously. Moreover, lacquer has special functions such as moisture resistance, high temperature resistance, and corrosion resistance. Since the Neolithic Age, the Chinese have recognized the performance of lacquer and used it to paint utensils. During the Shang and Zhou Dynasties and the Ming and Qing Dynasties, the Chinese lacquerware technique witnessed continuous development and achieved a very high level. Deeply appreciated by people worldwide, Chinese lacquerware has had a great impact on worldwide arts and crafts. Scientific analysis of lacquer provides information on the constituent layer compositions and conditions and allows conservators to propose appropriate conservation measures. Standard approaches for visualizing the internal structure of artifacts include infrared reflectography and X-ray radiography technologies, often in conjunction with microscopic analysis of the cross-sections of the samples [1, 2]. However, current methods are still underdeveloped and fail at generating the three-dimensional view without damaging the lacquerware. Combining these methods with terahertz (THz) imaging can provide a universal method to enrich information about Chinese lacquerware.
THz radiation (1 THz = 1012 Hz) includes the frequencies in the range of 0.1–10 THz (wavelength: 0.3–3 mm). The terahertz time-domain spectroscopic reflectometric imaging (THz-TDSRI) system proposed in this study can depict 2D images as well as subsurface 3D images due to its ability to highlight the interface between layers for the stratigraphic buildup. This system provides stratigraphic images in a contactless and non-invasive manner; however, cross-sectioned samples could destroy the sample. Furthermore, as THz radiation is nonionizing because of its low photon energy (4.1 meV at 1 THz) and requires very low power levels (∼1 µW), internal structure visualization can be accomplished without damaging the artifacts. As such, the THz-TDSRI system can be employed to acquire the structural information of lacquered artifacts.
In Terahertz Time-Domain Spectroscopic Reflectometric Imaging System, we describe the proposed THz-TDSRI system. In Imaging of Chinese Lacquerware, the THz-TDSRI system is used to examine the hidden layers in lacquerware, such as cracks in the wooden layer, without damaging the lacquer layers. Finally, we conclude that the THz-TDSRI system is an important and promising non-destructive inspection method for lacquerware examination.
Terahertz Time-Domain Spectroscopic Reflectometric Imaging System
THz time-domain spectroscopic reflectometric (or THz pulsed) imaging is a non-invasive and coherent imaging technique that is used to obtain the inherent 3D information. As for imaging, the most advantageous trait of THz radiation is its capability of penetrating visually opaque and nonconducting materials.
To measure the outer layer of the lacquerware, a terahertz time-domain spectroscopic reflectometric imaging (THz-TDSRI) system is established in this study. This system comprises a femtosecond laser, a scanning optical delay line, a THz antenna, a THz detector, and an XY-scanning stage. A sketch map of the device in normal incidence reflection geometry is illustrated in Figure 1. Laser average power, pulse width, and repetition frequency in optical pulses are 100 mW, 100 fs, and 79 MHz, respectively. Using a half-wave plate and a polarization beam splitter, the optical pulses are divided into generation and detection beams; the ratio of generation beams to detection beams is set to 9:1 by rotating the half-wave plate. A beam with 90% power is passed through the scanning optical delay line, and the THz antenna is irradiated to produce THz waves. The THz beam is reflected by an off-axis parabolic mirror 1 (OAP1) to obtain a parallel beam. The parallel THz beam is then incident on the THz beam splitter; half of the THz energy is reflected. The reflected THz waves are focused on the lacquerware by OAP2 and reflected multiple times by the lacquerware. The reflected beam is focused on ZnTe by OAP2 and OAP3. Simultaneously, another beam with 90% power is irradiated on ZnTe as the probe beam. The probe beam is passed through a polarizer before irradiating ZnTe to ensure that it is linearly polarized. Then, the detection light probe beam is irradiated on the balance detector through a quarter-wave plate and a Wollaston prism to detect THz waves. The lacquerware is placed in the XY-scanning stage. The THz beam is used to perform raster scanning on the lacquerware in the X and Y spatial dimensions. A time-domain pulse is documented at every spatial coordinate for image formation. 2D and 3D THz tomography plots are acquired by scanning the lacquerware in the X and Y directions.
FIGURE 1
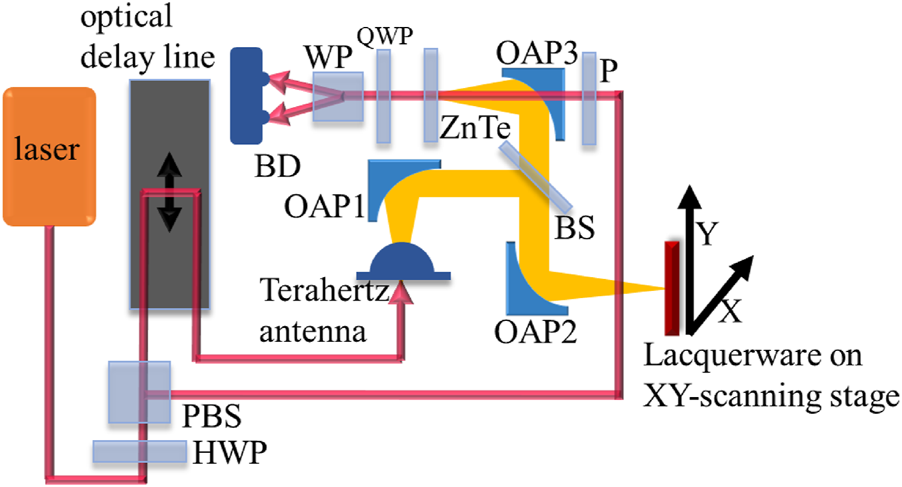
Schematic of the experimental setup of the proposed THz-TDSRI system. HWP: Half-wave plate. PBS: Polarizing beam splitter. BS: THz beam splitter. P: Polarizer. QWP: Quarter-wave plate. WP: Wollaston prism. BD: Balance detector. OAP1, OAP2, OAP3: Off-axis parabolic mirror.
The C-scan method is employed for scanning. First, a THz wave is focused on a point in the lacquerware; then, the XY-scanning is stopped and spectral scanning is started. After the optical delay line completes the spectral scan of the point, the X-axis of the XY-scanning stage moves to the next point to perform the spectral scan again. This process is repeated until the X-axis spectral scanning is completed. At this time, the X-axis returns to the origin and the Y-axis moves to the next point. The same operation is repeated until the entire lacquerware is scanned [3].
Terahertz time-domain systems (THz-TDS) can emit and detect very short electromagnetic pulses (with duration below picosecond) in the THz frequency range. This THz-TDSRI system can be operated in the frequency range of 0.1–2.6 THz. THz radiation reflected by the gold mirror is shown in Figure 2.
FIGURE 2
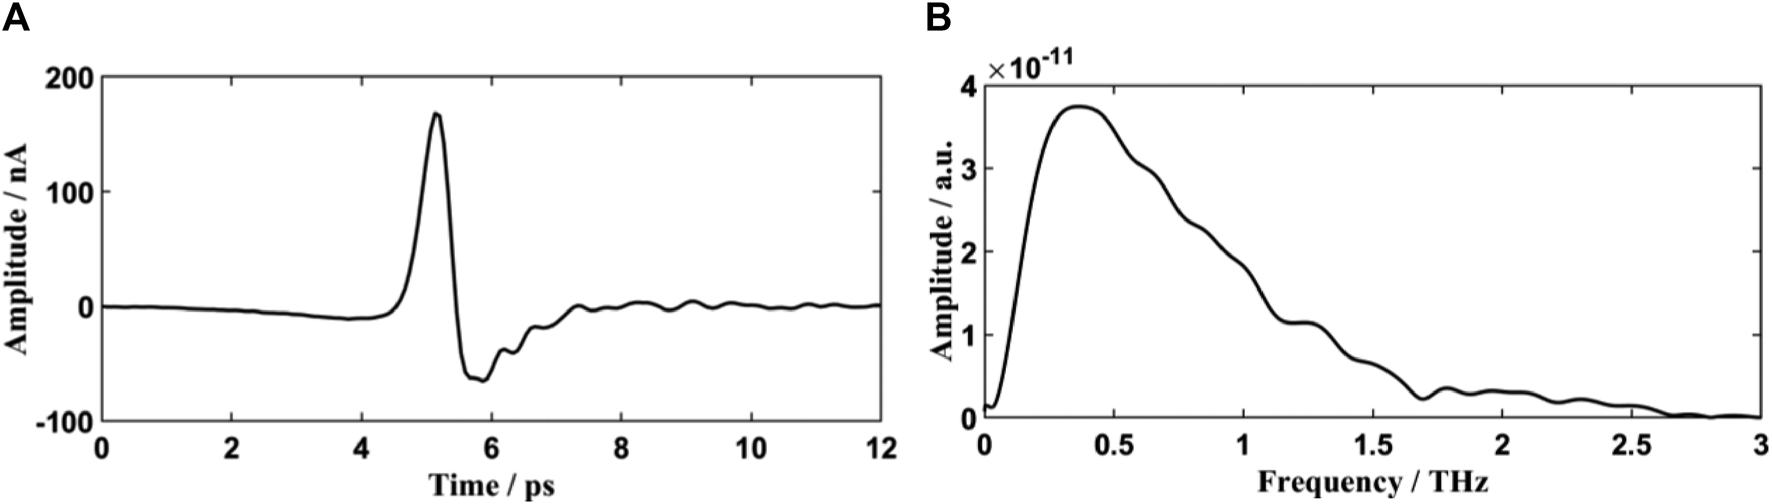
(A) Time-domain spectrum of THz radiation reflected by a gold mirror; here, the time-domain width is 12 ps (B) Frequency-domain spectrum of THz radiation reflected by a gold mirror.
In the proposed system, the temporal spacing between reflections is directly proportional to the optical thickness of the layers, implying that the time scale affords information concerning penetrated depth in the reflected signals, thereby enabling 3D time-of-flight (TOF) imaging [4, 5]. Time-domain images are reconstructed based on the measured data following the aforementioned pulse delay for the reference pulse. The principle is shown in Figure 3.
FIGURE 3
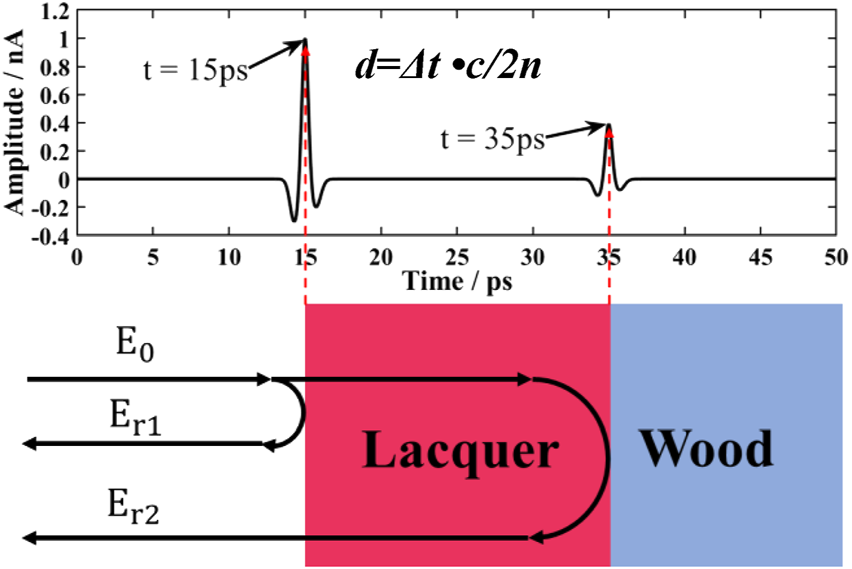
Principle of THz-TDSRI system.
E 0 is the incident THz radiation. Er1 is the THz radiation reflected from the upper surface of the lacquer. This THz pulse appears at 15 ps Er2 is the THz radiation reflected by the interface between the lacquer and the wood. This THz pulse appears at 35 ps The time difference between these 2 THz pulses is 20 ps(Δt = 20 ps). Therefore, the thickness of the lacquer layer can be estimated using the expression, , where c is the speed of light and n denotes the refractive index of lacquer. As for the spectral bandwidth of the THz pulse, its depth resolution is approximately half of the coherence length of the THz radiation. The coherence length of the radiation is based on , where Δω is the spectral bandwidth and cn denotes the speed of light within the intervening medium [6, 7].
Imaging of Chinese Lacquerware
The studied lacquerware was procured from the Palace Museum, Beijing (Figure 4). The lacquerware is an ornamental object comprising a wood panel covered by multiple layers of lacquer to portray motifs, with its wood panel covered with thick glossy black lacquer. The pattern was portrayed by a layer of red-colored lacquer and a layer of gold-like yellow-colored lacquer.
FIGURE 4
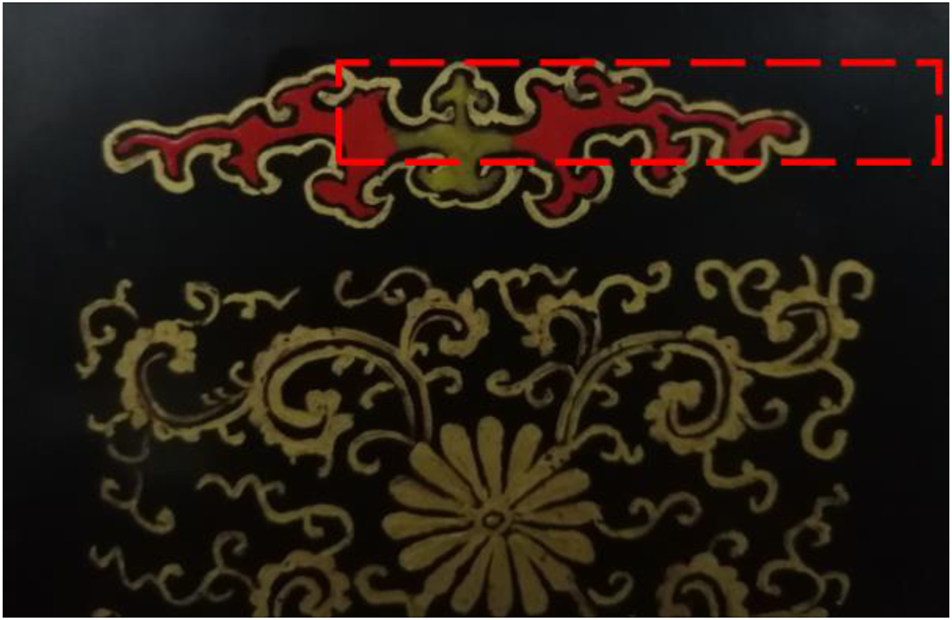
Visible-light picture of the lacquerware replica; red lines mark the scanned area.
The electric field value calculated at every spatial coordinate (x, y) across the scanned area was applied in lacquerware bidimensional visualization. The XY scan step was 0.25 mm, subject to the restriction of THz radiation wavelength. C-scan allowed us to obtain the time-domain intensity value of each point in space. The spectrum value was obtained via fast Fourier transform. A code was used to produce the frequency-and time-domain parametric THz images (Figure 5). THz reflection images were obtained by assigning intensity values to each pixel, thus, yielding various shades of gray within the black-white range in proportion to the parameter values.
FIGURE 5
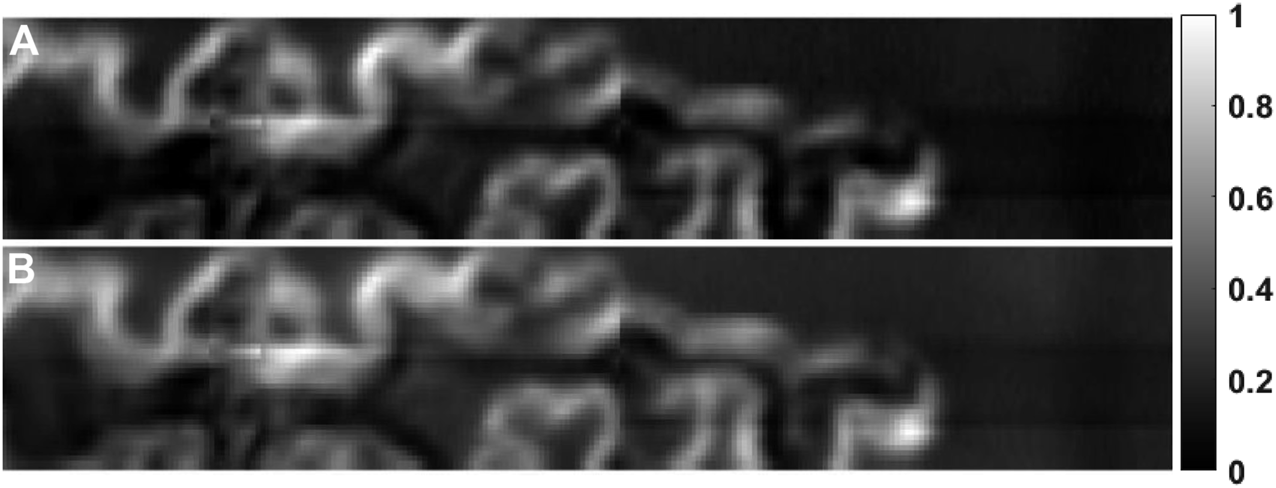
(A) THz time-domain parametric image (maximum of temporal amplitude). (B) THz frequency-domain image (integral of the spectral amplitude over the 0–2.6-THz frequency range). Both panels are normalized, so they can share a color bar. There is a problem that needs to be explained: although the XY scan step length is 0.25 mm, but its horizontal resolution is 1 mm. This is because the size of the THz wave focus is limited by the wavelength and spectral width. We are currently working to improve the horizontal resolution.
The grayscale intensity images demonstrated a favorable THz optical contrast of the materials. The background is black lacquer, and the glittering patterns and gray is red lacquer.
In contrast to the time-domain parametric image, the frequency-domain image can be used to display images at a specific frequency. Different frequencies can provide us different information. To avoid the effect of THz waves reflected by the wood on the frequency spectrum, the reflected THz pulse of the lacquer was extracted, and the time-domain spectrum was normalized. The spectrogram of a specific frequency range was made. To improve the contrast, composite false-color rendering was applied while creating the reflected composite THz frequency-domain images [8] (Figure 6).
FIGURE 6
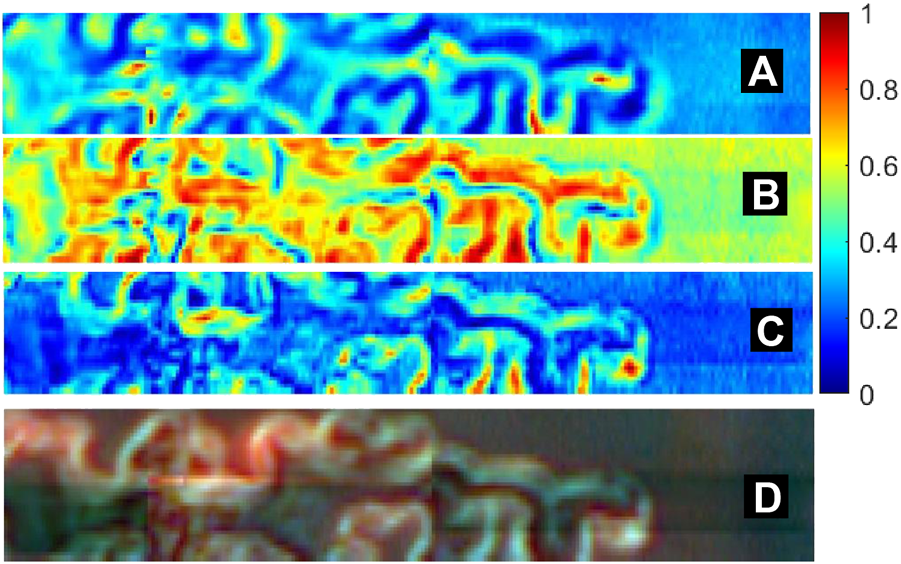
THz reflection frequency spectrum composite image. (A) The image is recorded in the 0.16113–0.45410 THz range. (B) The image is recorded in the 1.112,790–1.42090 THz range. (C) The image is recorded in the 1.81640–2.10940 THz range. (D) The image is synthesized via false RGB. (a) Image of the red channel, (b) image of the green channel, and (c) image of the blue channel. The panels arebeen normalized to share a color bar.
The different images correspond to different frequency ranges. The red lacquer was highlighted at frequencies of 0.16113–0.45410 THz. The yellow lacquer was highlighted at frequencies of 1.112,790–1.42090 THz and 1.81640–2.10940 THz. To improve the visual effect, these images were converted to RGB channels, and composite reflected THz composite images for RGB false-color were rendered (Figure 6D). RGB false-color rendering enabled the differentiation of multiple materials and textures on the lacquerware surface. The improvement in the recorded pattern is especially evident, in which the texture is much clearer due to the difference in the RGB colors.
The comparison between Figure 6 and Figure 4 shows that the yellow part is stronger in the mid-frequency (1.112,790–1.42090 THz) and high-frequency (1.81640–2.10940 THz) range. Because gold powder has been added to the yellow part. The red part is stronger in the low frequency (0.16113–0.45410 THz) range.
Terahertz Reflection Slice Images
Figure 7 shows the time-domain spectrum of a point. This point is at x = 55 mm and y = 3 mm. It can be found that this point is a point in the upper right corner of the red box, compared with Figure 4. We can clearly see two reflected THz pulses. The first is the THz pulse reflected by the lacquer, and the second is the THz pulse reflected by the wood. The time difference between the appearance of these two peaks is 1.96 ps, Δt = 1.96 ps Phase analysis revealed that the THz pulse reflected by lacquer and the THz pulse reflected by wood have a phase difference of 180°; therefore, the THz pulse reflected by wood shows a negative amplitude. All time-domain spectra are similar to this one, but they have different amplitudes and Δt.
FIGURE 7
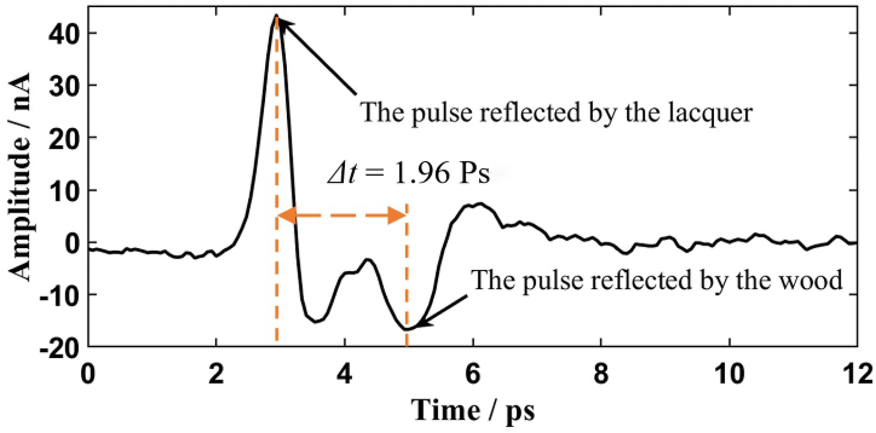
A time-domain spectrum of one point.
B-scans show the TOF in the electric field in the vertical axis and (x) transceiver linear position in the horizontal axis [9, 10]. In the lacquerware sample, depth difference was observed between the upper surface of the lacquer and the interface of the wood and lacquer [11, 12]. Figure 8 shows the b-scan image of the red dashed scan line from a THz time-domain parametric graph. In the picture, we can clearly see the two surfaces (the upper surface of the lacquer and the interface of the wood and lacquer).
FIGURE 8
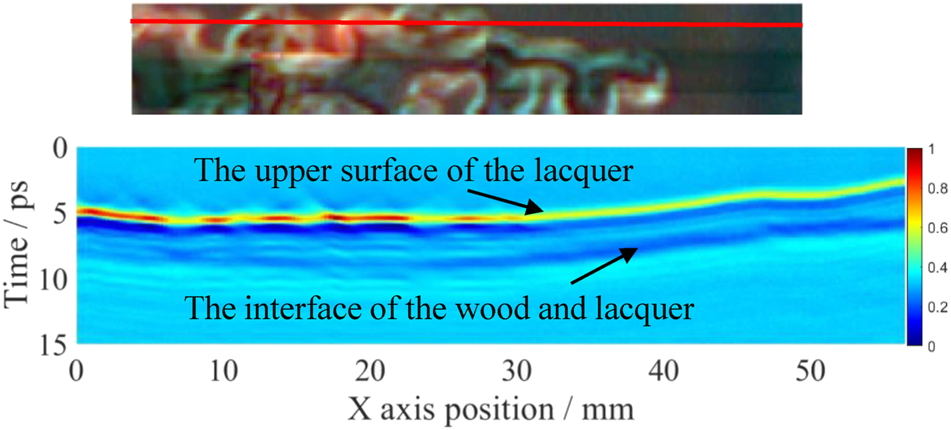
B-scan image. The figure has been normalized.
Time-of-Flight Image
TOF imaging is used to study the relationship between layers [13]. By using ultrashort THz pulses in high-resolution TOF THz tomography, the tomographic spectrum can be acquired by detecting the pulses reflected from each layer [14]. Figure 9 presents the THz TOF images of the scanned areas. We analyzed all time-domain spectra. The time of each reflection peak in each time-domain spectrum has been extracted. To improve the visual effect, the figure is displayed in pseudo-color. The time of the first reflection peak in each time-domain spectrum forms the lower surface. The time of the second reflection peak in each time-domain spectrum forms the upper surface.
FIGURE 9
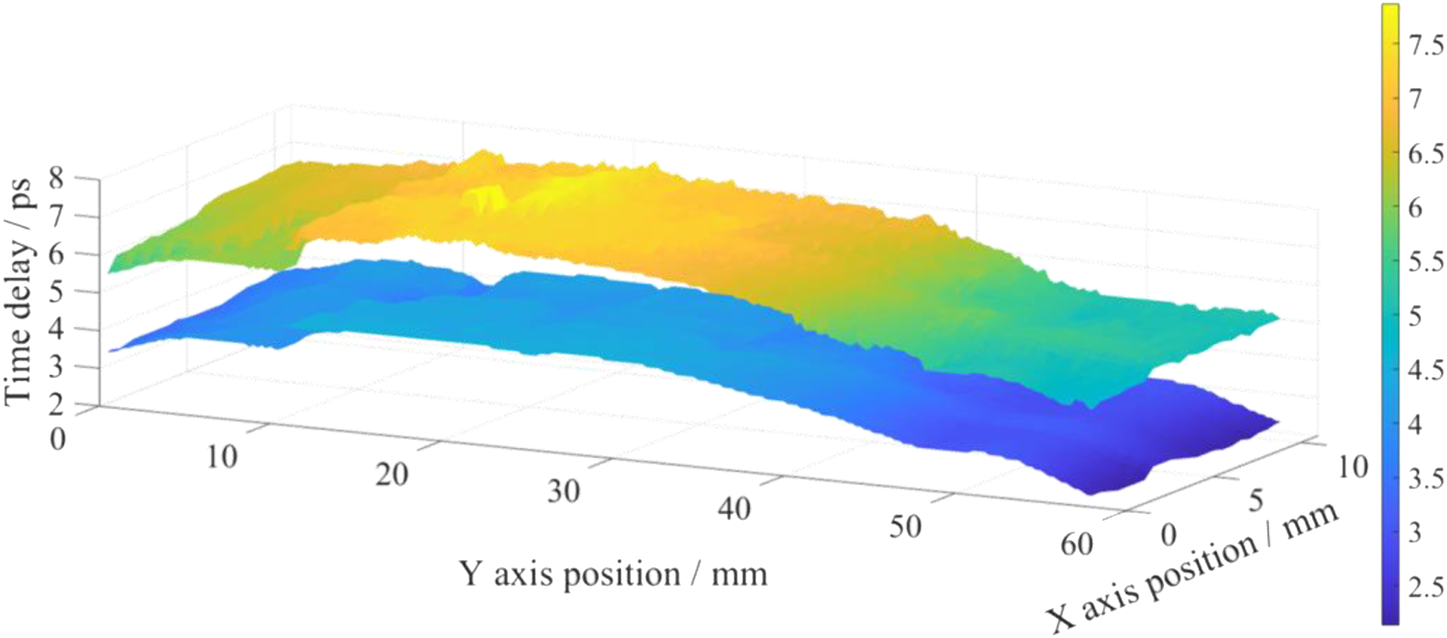
Time-of-flight image.
Figure 9 shows the layers for the area shown in Figure 4. The figure clearly shows two layers: the upper layer is the interface of lacquer and wood, and the lower layer is the upper surface of the lacquer. Figure 9 shows that both reflection layers have a fault (Y-axis position near 10 mm) and that the faults on the wood layer are slightly greater compared with those on the lacquer layer. In this study, a sample of black lacquer with a thickness of 0.5 mm and a diameter of 10 mm has been produced, in order to evaluate the thickness of lacquer layer. By analyzing the frequency domain spectra in the air and reflected by the sample, it is found that the refractive index (n) is 1.83, which is obtained by integration in the frequency range of 0.1–2.6 THz. After calculation, the average thickness of the lacquer layer is 159.318 µm and the average fault of the wood layer and lacquer layer was found to be 65.42 and 46.38 µm, respectively. This proves that the lacquer repaired the fault of the wood to a certain extent. Comparing with Figure 4, it can be concluded that the wood layer and the lacquer layer are slightly convex at the edge of the lacquerware and the trend is the same in both layers. The probability of visualizing the wooden support’s inner structure enables relevant integrity detection.
Conclusion
In this study, we demonstrated that the THz-TDSRI system proposed herein can highlight the interface between layers for the stratigraphic buildup and can be employed as a universal method to obtain the structural information (2D images, subsurface 3D images, and stratigraphic images (b-scans)) of lacquerware in a contactless and non-invasive manner. Using the proposed THz-TDSRI system, we examined the buried layers involving wood layer faults in the lacquerware without damaging the artifact. A traditional Chinese lacquerware artifact was studied using reflectometric THz imaging, which proves that THz-TDSRI has great potential in lacquerware inspection.
Statements
Data availability statement
The original contributions presented in the study are included in the article/Supplementary Material, further inquiries can be directed to the corresponding authors.
Author contributions
HZ: conceptualization, methodology, validation, investigation, writing-original draft. YZ: supervision, conceptualization, writing-reviewing, and editing. CL: sample selection and acquisition. CZ: conceptualization and funding acquisition.
Acknowledgments
The authors would like to thank Beijing Broad Hengtong S&T Development Co, Ltd., for having provided the femtosecond laser in this study. Thanks for the support of Capital Normal University Development Funds by Category-Physics Department-Practice base Projects for Degree Study Program (No. 008–2155089).
Conflict of interest
The authors declare that the research was conducted in the absence of any commercial or financial relationships that could be construed as a potential conflict of interest.
Publisher’s note
All claims expressed in this article are solely those of the authors and do not necessarily represent those of their affiliated organizations or those of the publisher, the editors, and the reviewers. Any product that may be evaluated in this article, or claim that may be made by its manufacturer, is not guaranteed or endorsed by the publisher.
References
1.
Fabien D Christophe B . Impact damages detection on composite materials by THz imaging [J]. Case Stud Non-destructive Test Eval (2016) 6:53–62.
2.
Niijima S Shoyama M Murakami K Kawase K . Evaluation of the sintering properties of pottery bodies using terahertz time-domain spectroscopy. J Asian Ceram Societies (2018) 6(1):37–42. 10.1080/21870764.2018.1439610
3.
Iskandarani MZ . Abnormalities in Ultrasonic (C-Scan) Images of Composite Structures: Impact Damaged versus Hole Damaged. J Comp Sci (2019) 15(7):972–82. 10.3844/jcssp.2019.972.982
4.
Eom KH Peltek SE Popik VM Jeong YU Park GS . Irradiative damage characterization of a lysozyme during high-power THz ablation using MALDI-TOF mass spectrometry: Proceedings of the Infrared, Millimeter, and Terahertz Waves (IRMMW-THz), 2012 37th International Conference on IEEE (2012). [C]. Wollongong.
5.
Dandolo CLK Gomezsepulveda AM Hernandezserrano AI Castrocamus E . Examination of Painting on Metal Support by Terahertz Time-Domain Imaging [J]. J Infrared Millimeter Terahertz Waves (2017) 38(10):1–10. 10.1007/s10762-017-0409-7
6.
Walker GC Bowen JW Labaune J Jackson J-B Hadjiloucas S Roberts J et al Terahertz deconvolution. Opt Express (2012) 20(25):27230–41. 10.1364/oe.20.027230
7.
Schwerdtfeger M Castro-camus E Krügener K Viöl W Koch M . Beating the wavelength limit: three-dimensional imaging of buried subwavelength fractures in sculpture and construction materials by terahertz time-domain reflection spectroscopy. Appl Opt (2013) 52(3):375–80. 10.1364/AO.52.000375
8.
Lu WL Lou SQ Wang X Shen Y Sheng XZ . False-color terahertz imaging system based on terahertz time domain spectrocsopy [J]. Acta Physica Sinica (2015) 64(11):0. 10.7498/aps.64.114206
9.
Sim YC Ahn K-M Park JY Park C-S Son J-H . Temperature-Dependent Terahertz Imaging of Excised Oral Malignant Melanoma. IEEE Trans Thz Sci Technol (2013) 3(4):368–73. 10.1109/tthz.2013.2267415
10.
Dandolo CLK Fukunaga K Kohzuma Y Kiriyama K Jepsen PU . Inspection of Asian Lacquer Substructures by Terahertz Time-Domain Imaging (THz-TDI)[J]. J Infrared Millimeter Terahertz Waves38(4):1–10.
11.
Bardon T May RK Jackson JB Beentjes GL De Bruin G Taday PF et al Contrast in Terahertz Images of Archival Documents—Part I: Influence of the Optical Parameters from the Ink and Support [J]. J Infrared Millimeter Terahertz Waves38(4):443–66.
12.
Oh SJ Kim S-H Jeong K Park Y Huh Y-M Son J-H et al Measurement depth enhancement in terahertz imaging of biological tissues. Opt Express (2013) 21(18):21299. 10.1364/oe.21.021299
13.
Spranger H Beckmann J . THz – ToF Optical Layer Analysis (OLA) to determine optical properties of dielectric materials: proceedings of the Review of Progress in Quantitative Nondestructive Evaluation (2017). [C].
14.
Xin G Yoshikazu U Xiangrong Z Takeshi H Takahiko A . A Fast and Fully Automatic Method for Cerebrovascular Segmentation on Time-of-Flight (TOF) MRA Image [J]. J Digital Imaging (2010).
Summary
Keywords
lacquerware, terahertz imaging, time-of-flight, b-scan, C-scan
Citation
Zhang H, Zhao Y, Li C and Zhang C (2021) Characterizing the Layer Structures of the Lacquerware From the Palace Museum by Terahertz Imaging in Reflection Geometry. Front. Phys. 9:751205. doi: 10.3389/fphy.2021.751205
Received
31 July 2021
Accepted
23 August 2021
Published
03 September 2021
Volume
9 - 2021
Edited by
Meng Chen, Tsinghua University, Beijing, China
Reviewed by
Xudong Liu, Shenzhen University, Shenzhen, China
Jiaguo Liu, Beijing Institute of Environmental Features, Beijing, China
Updates
Copyright
© 2021 Zhang, Zhao, Li and Zhang.
This is an open-access article distributed under the terms of the Creative Commons Attribution License (CC BY). The use, distribution or reproduction in other forums is permitted, provided the original author(s) and the copyright owner(s) are credited and that the original publication in this journal is cited, in accordance with accepted academic practice. No use, distribution or reproduction is permitted which does not comply with these terms.
*Correspondence: Yuanmeng Zhao, zhao.yuanmeng@cnu.edu.cn; Cunlin Zhang, cunlin_zhang@cnu.edu.cn
This article was submitted to Optics and Photonics, a section of the journal Frontiers in Physics
Disclaimer
All claims expressed in this article are solely those of the authors and do not necessarily represent those of their affiliated organizations, or those of the publisher, the editors and the reviewers. Any product that may be evaluated in this article or claim that may be made by its manufacturer is not guaranteed or endorsed by the publisher.