Abstract
An optical fiber was modified at the tip with a self-assembled plasmonic metamaterial that acts as a miniature surface-enhanced Raman spectroscopy (SERS) substrate. This optical fiber-based device co-localizes the laser probe signal and the chemical analyte at a distance remote from the spectrometer, and returns the scattered light signal to the spectrometer for analysis. Remote SERS chemical detection is possible in liquids and in dried samples. Under laboratory conditions, the analyte SERS signal can be separated from the background signal of the fiber itself and the solvent. An enhancement factor greater than 35,000 is achieved with a monolayer of the SERS marker 4-aminothiophenol.
Introduction
Plasmonic metamaterials obtain their unique optical properties from the combined action of plasmonic and dielectric components of sub-wavelength dimensions [1]. Plasmonic metamaterials are useful in a variety of surface-enhanced spectroscopy techniques, enabling detection of chemicals through their spectral signatures with lower detection limits and higher spatial resolution compared to the standard spectroscopy techniques[2–4]. Among the most studied surface-enhanced spectroscopy techniques is surface-enhanced Raman scattering spectroscopy (SERS) [5,6,7]. In SERS, the plasmonic metamaterial increases the scattering cross-section of the probed molecule by a large factor (called the SERS enhancement factor), allowing for the possibility of single molecule detection [8]:[9].
Remote chemical sensing by optical methods has many applications in health care, oil and gas exploration, environmental monitoring, and law enforcement [10]:[11]. A number of these applications allow for the installation of a plasmonic metamaterial at the detection site for signal enhancement [12]:[13]. Of particular interest is addressing said metamaterial via an optical fiber such that (1) optical sensing is possible even without a direct line-of-sight between the spectrometer and the site of interest, and (2) the measurement can be performed through scattering media such as biological tissue, smoke, and soil. Techniques for localizing a plasmonic metamaterial on the optical fiber tip involve self-assembly methods and/or nanolithography tools [14–24].
Previously, a plasmonic metamaterial consisting of a non-close packed monolayer of metallic nanospheres with controllable inter-particle gaps was demonstrated as a reliable and reproducible SERS substrate [25]. That SERS substrate had been investigated using laser light propagating in free space. Here we report on the implementation of said metamaterial as a component of an optical fiber-based SERS spectroscopy system for remote sensing. The merits of this approach include facile and economic fabrication based on self-assembly techniques, and quantitative evaluation of the SERS enhancement factor.
Materials and Methods
The metamaterial was produced on the polished tip of an optical fiber (Edmund Optics, 200 μm core diameter 0.22 NA VIS/NIR fused silica fiber, polyimide coating) to demonstrate remote sensing by sending and receiving the optical signals through the fiber. The fiber was ∼0.5 m in length. A detailed procedure of the fabrication of the metamaterial was reported elsewhere [26]. Briefly, the optical fiber was equipped with SMA905 connectors and the tips were polished. A drop of solution of the block-copolymer polystyrene-b-poly(4-vinylpyridine) (PS-b-P4VP) in propylene glycol methyl ether acetate was spin coated on one polished tip of the optical fiber for 60 s at 3,000 rpm using a custom-designed holder. The block-copolymer film was annealed in THF vapor for 3 h. The P4VP blocks were crosslinked by exposure to 1,4-dibromobutane (DBB) vapor for 4 h. The fiber tip was immersed in a gold nanoparticle solution (BBI Solutions, citrate-capped, 15 nm) for 12 h, resulting in a non-closed packed monolayer of nanoparticles. The diameter of the nanoparticles was adjusted from ∼15 to ∼32 nm by soaking the fiber tip in an electroless gold plating solution (prepared by mixing solutions of CTAB (6 ml, 0.2 M), HAuCl4 (0.384 ml, 0.04 M), AgNO3 (0.228 ml, 0.01 M), ascorbic acid (0.96 ml, 0.1 M), and deionized water (11 ml)) for 8 min[25]. The metamaterial was characterized by optical microscopy (Olympus BX60 microscope with an Olympus UMPlanFI 20X/0.46 BD objective lens), by scanning electron microscopy (Hitachi SU-70 Schottky FE-SEM working at 10 kV accelerating voltage) and by atomic force microscopy (DI Nanoscope III multimode AFM, tapping mode, TESP tip (42 N/ m)).
Raman and SERS: The measurements were carried out using a LabRAM ARAMIS Horiba Yvon-Jobin micro-Raman spectrometer, operating at a wavelength of 633 nm and equipped with an Olympus BX41 microscope. The proximal bare tip of the fiber was placed near the focal point of the objective lens (Olympus MPlan, ×10 NA = 0.25 WD = 10.6 mm) of the Raman microscope. For SERS, the metamaterial functionalized tip of the fiber was soaked in the analyte solution for 15 min. Measurements were taken with the functionalized distal tip immersed in the solution in the dark, or for quantitative determination of the enhancement factor, the tip was soaked in a solvent to remove excess analyte, and was let dry in the dark prior to the measurements. Reference spectra were collected using normal Raman spectroscopy with the optical fiber. For normal Raman spectroscopy, no metamaterials were constructed on the optical fiber, and measurements were taken with the distal tip of the fiber immersed in the analyte solution in the dark.
Results
The SERS system consisted of the 633-nm CW laser, the spectrometer, and the silica optical fiber modified on its distal end with the metamaterial (Figure 1A). The laser light was guided through a beam-splitter to a lens that focused the light into the proximal end of the optical fiber. After traveling through the fiber, the light coupled to the metamaterial and the surface-enhanced Raman scattering process took place. A portion of the Stokes-shifted (back-scattered) light was collected by the fiber and was guided back towards the lens and the beam-splitter, making its way to the notch filter and the detector in the spectrometer. The structure of the functionalized distal end of the optical fiber is shown schematically in Figure 1B. Over the polished tip of the silica fiber is a thin (<50 nm) film of PS-b-P4VP. This polymer is typically not involved in the Raman process. It is chosen because the P4VP and the PS components microphase separate upon solvent-vapor annealing and self-assemble into hexagonally-ordered P4VP cylindrical domains in a PS matrix, serving as a template for the nanoparticle adsorption process. Over the polymeric film is a monolayer of gold nanoparticles of uniform diameter (d∼32 nm) arranged in a hexagonal pattern at the microscale. Because the center-to-center distance of the hexagonal pattern (d+δ, δ∼8 nm) is slightly larger than the nanoparticle diameter, nanoscale gaps are present between pairs of adjacent nanoparticles. This metamaterial of evenly-spaced metallic nanoscale particles and dielectric nanoscale gaps of controlled dimensions generates strong, localized optical fields that give rise to the enhanced Raman signal.
FIGURE 1
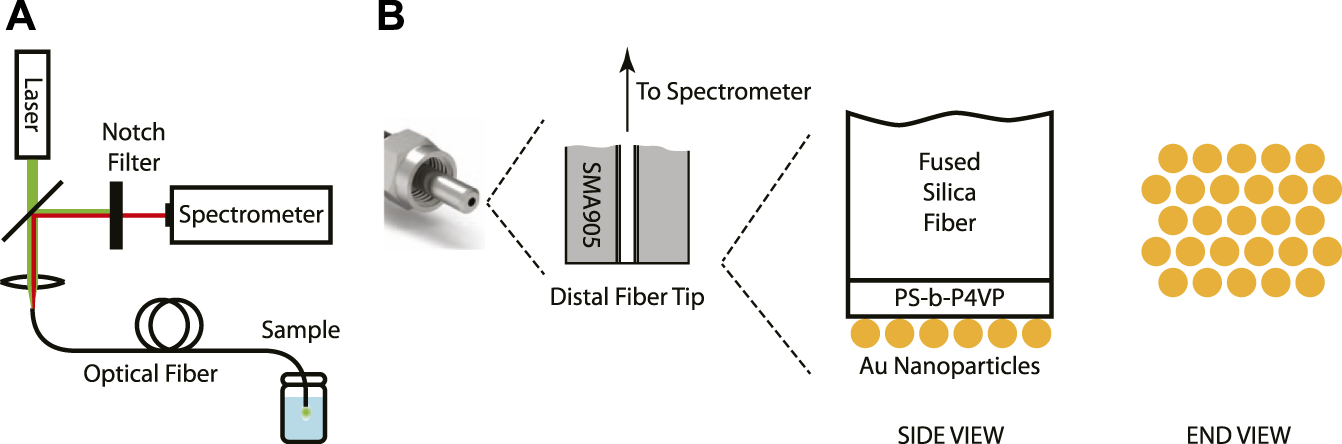
(A) Schematic of the SERS remote spectroscopy system. (B) Schematic of the structure of the metamaterial-functionalized optical fiber tip.
The SERS optical fibers were characterized during fabrication by optical microscopy, SEM and AFM in order to confirm and evaluate the formation of a hexagonal array of gold nanoparticles on the polished surface at the distal end of the fiber. The optical images in Figure 2 show that the block copolymer film and the nanoparticle metamaterial covered almost the entire cross-sectional area of the fiber and displayed good uniformity, particularly at the center of the fiber core. SEM imaging of the tip of the fiber confirmed the presence of a layer of gold nanoparticles on the entire circular area of the silica core, however, due to the poor electrical conductivity of the sample the resolution and quality of the images were compromised (Figure 3A). High-resolution height profile images were obtained by AFM (Figure 3B), scanning the AFM tip over a few square-microns of the fiber core in tapping mode. The AFM images indicated that the silica surface and the polymer film on top of it were smooth and that the gold nanoparticles were dispersed as a monolayer over the film. Most nanoparticles were separated from their neighbors by a nanoscale gap (∼25 nm), and were locally arranged in hexagonal patterns, as expected for 15 nm nanoparticles adhering to the hydrophilic columnar domains of the (PS-b-P4VP) polymer film[26]. Some sites were not covered by adsorbed nanoparticles. These locations appear to have not formed cylindrical P4VP domains normal to the surface. These defects may be remedied by a longer annealing time and/or a longer immersion time in the nanoparticle solution.
FIGURE 2
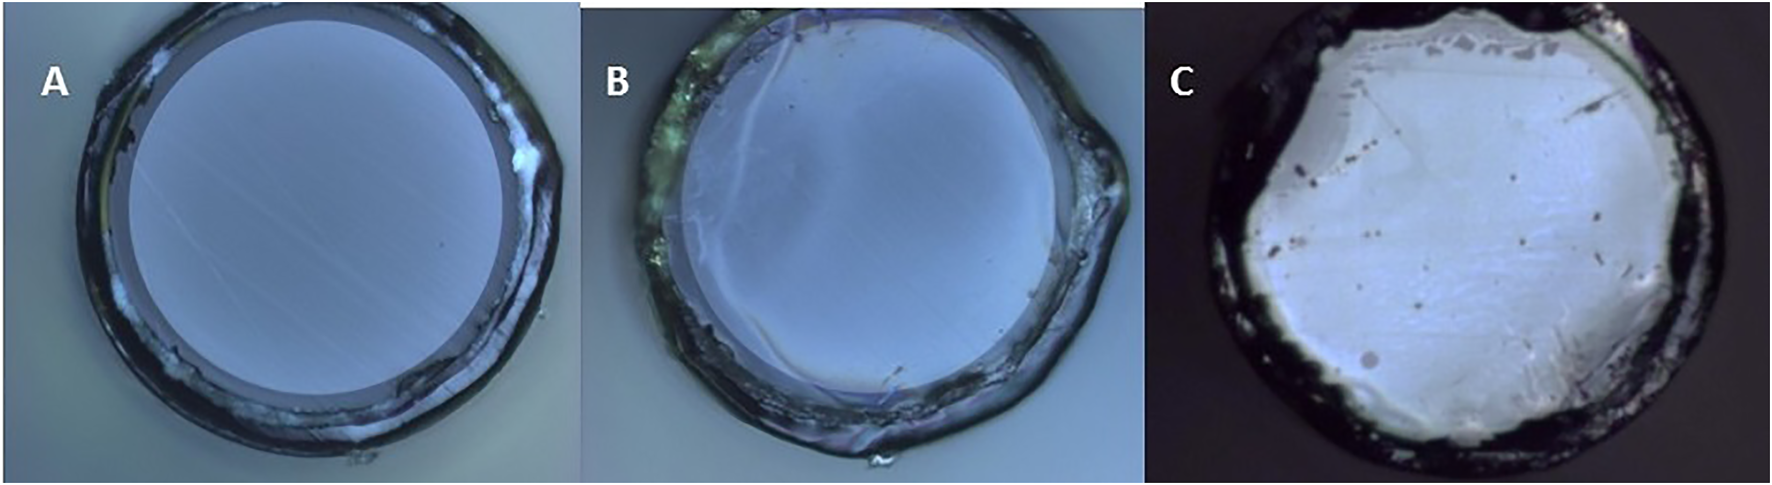
Optical images of the silica core of the optical fiber at different stages of the SERS optical fiber fabrication. (A) Polished tip fiber mounted on SMA905 connector. (B) Same fiber as in (A) after spin-coating the block copolymer. (C) A different fiber with the block-copolymer film and a monolayer of gold nanoparticles. The metamaterial structure appears uniform at the center. Irregularities are more common toward the edge of the silica core, likely due to height differences between the silica core and the polyimide coating.
FIGURE 3
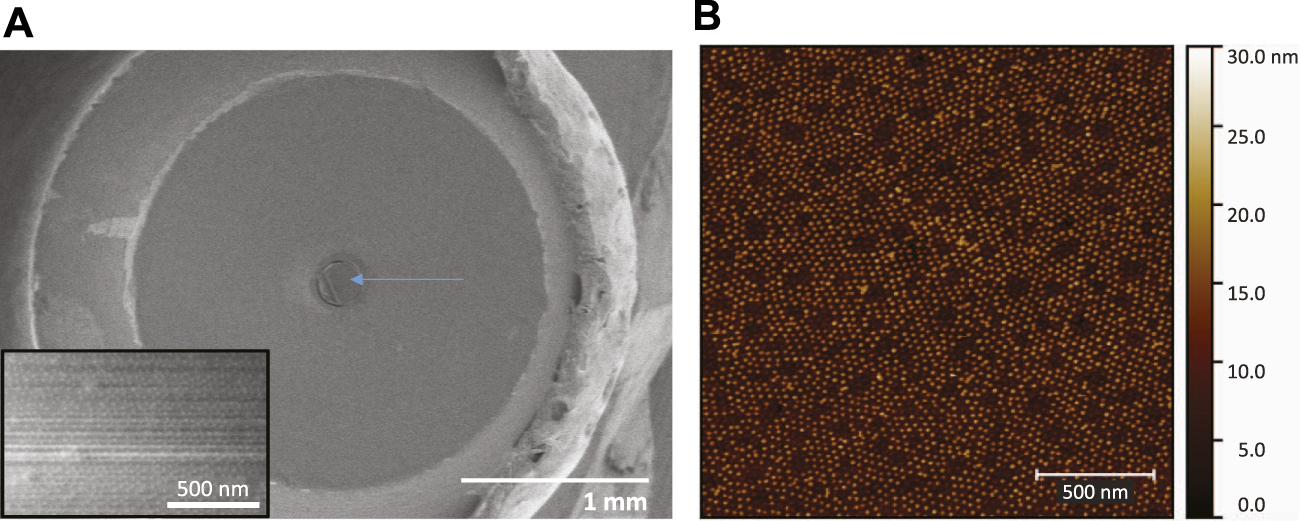
(A) Low-magnification SEM image of the fiber mounted on the SMA905 connector, after 15 nm gold nanoparticle absorption and before electroless plating. The arrow points at the silica core surface where the metamaterial is located. Inset: High magnification SEM image of the fiber core surface. (B) AFM topography image of the gold nanoparticle array self-assembled on the block-copolymer film on the fiber tip. Short-range hexagonal ordering is observed. There are nanoscale gaps between the nanoparticles.
SERS spectra of 4-aminothiophenol (4-ATP) were collected by immersing the functionalized optical fiber in an ethanoic solution of the thiol. To quantify the SERS enhancement factor, the number of molecules probed needs to be known. This was achieved by rinsing the analyte off the fiber, such that only a monolayer of chemisorbed thiol molecules is present on the surface of the gold nanoparticles. The SERS spectrum of “dry” 4-ATP is shown in Figure 4A. This spectrum was obtained by subtracting the signals collected before and after exposing the fiber to the chemical solutions. Six peaks associated with the SERS spectrum of 4-ATP can be identified. The SERS spectra obtained in “wet” conditions are qualitatively the same. In Figure 4B, the reference Raman spectrum of 4-ATP obtained with the same spectrometer using an optical fiber without the metamaterial is shown. Here, the distal end of the fiber was immersed in a 200 mM solution of 4-ATP in 1,5-pentanediol, and the spectra were collected with the fiber end in the liquid. The spectrum has been baseline-corrected by subtracting the signal collected from pure pentanediol under the same experimental conditions. In the Raman spectrum, the two strong peaks associated with 4-ATP can be recognized, however, four peaks of pentanediol also remain in the spectrum due to imperfect background subtraction.
FIGURE 4
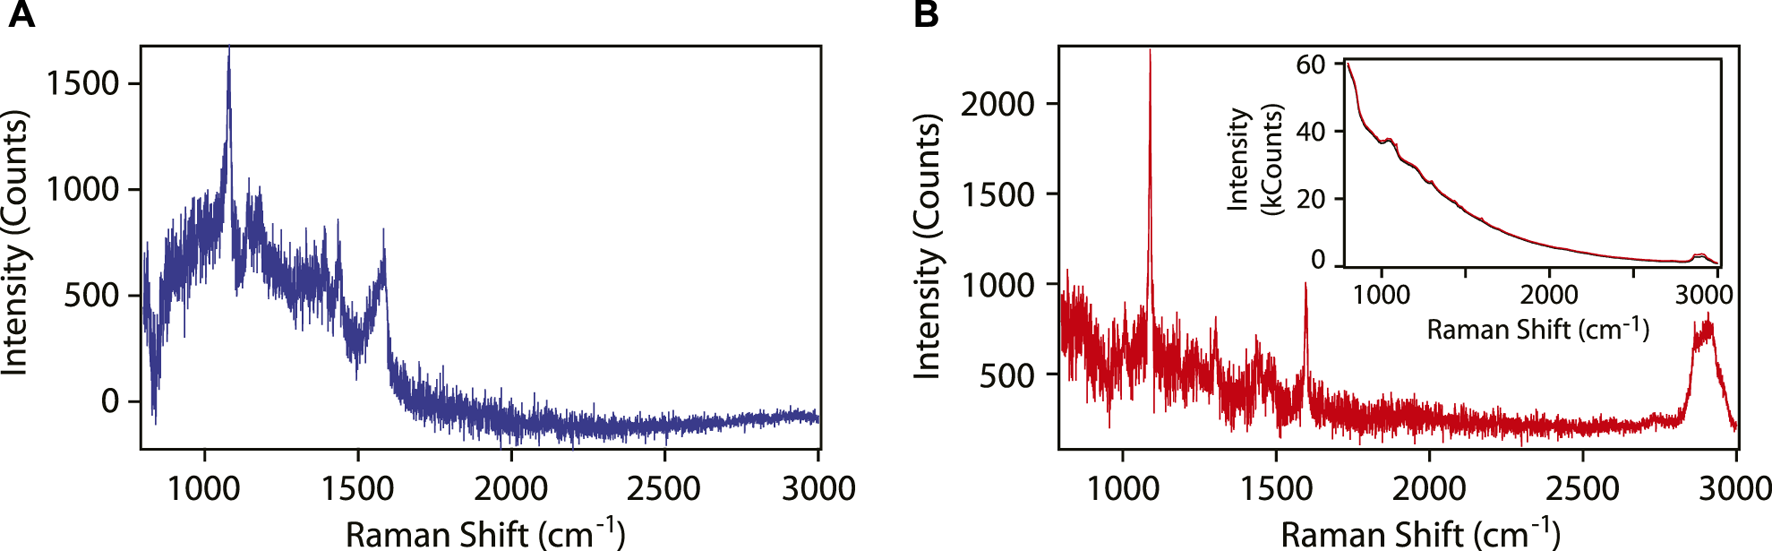
(A) SERS spectrum of 4-ATP using the metamaterial functionalized optical fiber. (B) Raman spectrum of 4-ATP using a bare optical fiber. The spectrum contains also residual signals from the solvent: three peaks in the range 1300–1500 cm−1 and a broad peak at 2850–2940 cm−1. Inset: Raw Raman spectra of the bare fiber in pentanediol (black) and in pentanediol with 0.2 M 4-ATP (red). In the measurements, the laser power incident on the proximal end of the fiber was 2 mW. The acquisition time was 45 s for the SERS spectrum, and 60 s for the Raman spectrum.
The SERS enhancement factor EF is calculated using Eq. 1 where Ni is a function of the number of molecules probed and the signal collection efficiency of the fiber (see Supplemental Material for calculation details), ti is the data acquisition time, and Ii is the intensity of the peak near 1070 cm−1. The subscript i corresponds to either the SERS experiment or the Raman experiment. The number of molecules probed in the SERS experiment is estimated using the known surface density of the nanospheres in the array, the diameter of the nanospheres and the density of 4-ATP in monolayers on gold surfaces (5 molecules/nm2). The number of molecules probed in the Raman experiment is estimated using the known analyte concentration in the solution.
The SERS enhancement factor of the metamaterial-functionalized optical fiber was determined to be ∼37,000. This value is comparable to the SERS enhancement factors obtained for large-area (>1 cm2) versions of the metamaterials on glass slides.
The raw data showed a strong Raman and fluorescence signal originating from the fused silica fiber (inset in Figure 4). For the purpose of the experiments described above, this signal remained constant throughout the measurements, and was satisfactorily removed using standard background subtraction techniques.
Discussion
There are a number of technical considerations specific to SERS measurements through optical fibers. First, the optical fiber can channel photons that originate from light sources other than the incident laser (e.g. sunlight, room lighting) back to the spectrometer. Therefore, samples must be measured in the dark. Second, the fiber itself is a source of fluorescence and Raman scattering. These features must be recognized in the recorded spectra and not mistaken for analyte signals. Therefore, the method is limited to analytes with Raman signals that do not overlap with the Raman signals of fused silica (420, 485, 600, and 790 cm−1). The method also necessitates post-measurement analysis, such as background subtraction, peak fitting and principal component analysis. The fused silica background signal can be mitigated by employing a Raman spectrometer that operates at a longer wavelength (e.g. 785 nm), or by using specialty optical fibers such as hollow-core photonic crystal fibers [27]. Third, the sensitivity of the optical fiber-based SERS measurement may be limited by losses associated with inserting the incident laser light into the fiber and near-field coupling the light scattered by the molecules in the metamaterial back into the fiber. Interestingly, using macroscopic samples of the metamaterial on quartz slides, we have determined that more photons back-scatter inelastically when the sample is illuminated from the quartz side than from the air side[28]. The permittivity contrast at the interface may be responsible for this effect, as has been previously theorized [29]. Consequently, optical fiber SERS of dry samples (i.e. in air) often results in better sensitivity than SERS performed with solutions.
Despite the technical challenges listed above, remote detection of SERS-active molecules through the optical fiber is practical thanks to the tremendous enhancements in the Raman scattered light intensity by the plasmonic metamaterial, estimated to be of the order of 105 for this metamaterial using a 633-nm input laser light. Through the analysis of the spectrum in Figure 4A, it is possible to unambiguously assign 6 SERS peaks (1070, 1140, 1180, 1390, 1435 and 1580 cm−1) to 4-ATP adsorbed on the gold nanoparticles at the fiber tip. In contrast, only 2 Raman peaks were recorded in the spectrum collected without the assistance of the metamaterial despite the very-high concentration of 4-ATP in the sample, with 2 other peaks possibly masked by the solvent Raman peaks and the baseline noise.
Optical fiber-based plasmonic sensors using the SERS effect gain their sensitivity from the co-localization of the optical field and the molecules at the surface of the plasmonic nanostructures. The metamaterial-functionalized optical fiber used in this study distinguishes itself from other optical fiber-based plasmonic sensors. The whole diameter of the silica fiber tip surface is covered with the gold nanoparticle array, providing a maximal functional surface. At the same time, the structure of the metamaterial is sufficiently uniform that, for practical purposes, the enhancement factor is homogenous across the device, without local hot-spots dominating the plasmonic response. The fabrication process can be standardized such that the enhancement factor of all the fibers in a batch is the same, as was achieved with macroscopic SERS substrates. This combination of a predictable SERS enhancement factor and a large functional area is highly desirable among SERS users. The metamaterial functionalized optical fiber is expected to be biocompatible, and operational in aqueous environments, where SERS-based chemical sensing benefits from water molecules being Raman inactive and SERS inactive.
Statements
Data availability statement
The raw data supporting the conclusions of this article will be made available by the authors, without undue reservation.
Author contributions
OR, RB, CM, and GA contributed to conception and design of the study. HvB, KZ, and XZ fabricated the optical fibers. KZ, XZ performed the Raman measurements and the data analysis. OR wrote the manuscript. OR and XZ prepared the figures. All authors read and approved the submitted version of the manuscript.
Funding
This work was supported by the National Science Foundation (Grant No. DMR-1151614) and by the UM Ventures Seed Grant Program of the University of Maryland.
Acknowledgments
We acknowledge the support of the Maryland NanoCenter and its AIMLab. The authors thank Dr. Karen Gaskell and Prof. Seung Yong Lee (KIST) for valuable discussions.
Conflict of interest
Authors HvB, CM, and GA, were employed by the company Accustrata, Inc.
The remaining authors declare that the research was conducted in the absence of any commercial or financial relationships that could be construed as a potential conflict of interest.
Publisher’s note
All claims expressed in this article are solely those of the authors and do not necessarily represent those of their affiliated organizations, or those of the publisher, the editors and the reviewers. Any product that may be evaluated in this article, or claim that may be made by its manufacturer, is not guaranteed or endorsed by the publisher.
Supplementary material
The Supplementary Material for this article can be found online at: https://www.frontiersin.org/articles/10.3389/fphy.2021.752943/full#supplementary-material
References
1.
WangPNasirMEKrasavinAVDicksonWJiangYZayatsAV. Plasmonic Metamaterials for Nanochemistry and Sensing. Acc Chem Res (2019) 52(11):3018–28. 10.1021/acs.accounts.9b00325
2.
CamdenJPDieringerJAWangYMasielloDJMarksLDSchatzGCet alProbing the Structure of Single-Molecule Surface-Enhanced Raman Scattering Hot Spots. J Am Chem Soc (2008) 130(38):12616–7. 10.1021/ja8051427
3.
AdatoRYanikAAAmsdenJJKaplanDLOmenettoFGHongMKet alUltra-sensitive Vibrational Spectroscopy of Protein Monolayers with Plasmonic Nanoantenna Arrays. Proc Natl Acad Sci (2009) 106(46):19227–32. 10.1073/pnas.0907459106
4.
NeubrechFBeckSGlaserTHentschelMGiessenHPucciA. Spatial Extent of Plasmonic Enhancement of Vibrational Signals in the Infrared. ACS Nano (2014) 8(6):6250–8. 10.1021/nn5017204
5.
AlbrechtMGCreightonJA. Anomalously Intense Raman Spectra of Pyridine at a Silver Electrode. J Am Chem Soc (1977) 99(15):5215–7. 10.1021/ja00457a071
6.
StilesPLDieringerJAShahNCVan DuyneRP. Surface-Enhanced Raman Spectroscopy. Annu Rev. Anal. Chem. (2008) 1:601–26. 10.1146/annurev.anchem.1.031207.112814
7.
PilotRSignoriniRDuranteCOrianLBhamidipatiMFabrisL. A Review on Surface-Enhanced Raman Scattering. Biosensors (2019) 9(2):57. 10.3390/bios9020057
8.
WeissAHaranG. Time-dependent Single-Molecule Raman Scattering as a Probe of Surface Dynamics. J Phys Chem B (2001) 105(49):12348–54. 10.1021/jp0126863
9.
DoeringWENieS. Single-molecule and Single-Nanoparticle SERS: Examining the Roles of Surface Active Sites and Chemical Enhancement. J Phys Chem B (2002) 106(2):311–7. 10.1021/jp011730b
10.
HogeFESwiftRN. Oil Film Thickness Measurement Using Airborne Laser-Induced Water Raman Backscatter. Appl Opt (1980) 19(19):3269–81. 10.1364/ao.19.003269
11.
MirellDChalusOPetersonKDielsJ-C. Remote Sensing of Explosives Using Infrared and Ultraviolet Filaments. J Opt Soc Am B (2008) 25(7):B108–B111. 10.1364/josab.25.00b108
12.
ConnatserRMProkesSMGlembockiOJSchulerRLGardnerCWLewisSAet alToward Surface-Enhanced Raman Imaging of Latent Fingerprints*. J Forensic Sci (2010) 55(6):1462–70. 10.1111/j.1556-4029.2010.01484.x
13.
Vo-DinhTLiuYFalesAMNgoHWangHNRegisterJKet alSERS Nanosensors and Nanoreporters: Golden Opportunities in Biomedical Applications. Wiley Interdiscip Rev Nanomed Nanobiotechnol (2015) 7(1):17–33. 10.1002/wnan.1283
14.
HankusMELiHGibsonGJCullumBM. Surface-enhanced Raman Scattering-Based Nanoprobe for High-Resolution, Non-scanning Chemical Imaging. Anal Chem (2006) 78(21):7535–46. 10.1021/ac061125a
15.
DhawanAMuthJF. Engineering Surface Plasmon Based Fiber-Optic Sensors. Mater Sci Eng B (2008) 149(3):237–41. 10.1016/j.mseb.2007.09.076
16.
OoMKKHanYMartiniRSukhishviliSDuH. Forward-propagating Surface-Enhanced Raman Scattering and Intensity Distribution in Photonic crystal Fiber with Immobilized Ag Nanoparticles. Opt Lett (2009) 34(7):968–70. 10.1364/ol.34.000968
17.
SmytheEJDickeyMDBaoJWhitesidesGMCapassoF. Optical Antenna Arrays on a Fiber Facet for In Situ Surface-Enhanced Raman Scattering Detection. Nano Lett (2009) 9(3):1132–8. 10.1021/nl803668u
18.
MaXHuoHWangWTianYWuNGuthyCet alSurface-Enhanced Raman Scattering Sensor on an Optical Fiber Probe Fabricated with a Femtosecond Laser. Sensors (2010) 10(12):11064–71. 10.3390/s101211064
19.
JayawardhanaSKostovskiGMazzoliniAPStoddartPR. Optical Fiber Sensor Based on Oblique Angle Deposition. Appl Opt (2011) 50(2):155–62. 10.1364/ao.50.000155
20.
ZhuYDluhyRAZhaoY. Development of Silver Nanorod Array Based Fiber Optic Probes for SERS Detection. Sensors Actuators B: Chem (2011) 157(1):42–50. 10.1016/j.snb.2011.03.024
21.
YapFLThoniyotPKrishnanSKrishnamoorthyS. Nanoparticle Cluster Arrays for High-Performance SERS through Directed Self-Assembly on Flat Substrates and on Optical Fibers. ACS Nano (2012) 6(3):2056–70. 10.1021/nn203661n
22.
HuangZLeiXLiuYWangZWangXWangZet alTapered Optical Fiber Probe Assembled with Plasmonic Nanostructures for Surface-Enhanced Raman Scattering Application. ACS Appl Mater Inter (2015) 7(31):17247–54. 10.1021/acsami.5b04202
23.
MiccoARicciardiAPiscoMLa FerraraVCusanoA. Optical Fiber Tip Templating Using Direct Focused Ion Beam Milling. Sci Rep (2015) 5:15935. 10.1038/srep15935
24.
KwakJLeeWKimJBBaeSIJeongKH. Fiber-optic Plasmonic Probe with Nanogap-Rich Au Nanoislands for On-Site Surface-Enhanced Raman Spectroscopy Using Repeated Solid-State Dewetting. J Biomed Opt (2019) 24(3):6. 10.1117/1.JBO.24.3.037001
25.
LeeWLeeSYBriberRMRabinO. Self-Assembled SERS Substrates with Tunable Surface Plasmon Resonances. Adv Funct Mater (2011) 21(18):3424–9. 10.1002/adfm.201101218
26.
LeeWLeeSYZhangXRabinOBriberRM. Hexagonally Ordered Nanoparticles Templated Using a Block Copolymer Film through Coulombic Interactions. Nanotechnology (2013) 24(4):045305. 10.1088/0957-4484/24/4/045305
27.
HanYTanSOoMKKPristinskiDSukhishviliSDuH. Towards Full-Length Accumulative Surface-Enhanced Raman Scattering-Active Photonic Crystal Fibers. Adv Mater (2010) 22(24):2647–51. 10.1002/adma.200904192
28.
RabinOZhangXZhangKBriberRMvon BredowHMettingCet alIntegrated Surface-Enhanced Raman Spectroscopy Sensors for Process Monitoring. TechConnect Briefs (2017) 4:214–7.
29.
EnghetaNPapasCHElachiC. Radiation Patterns of Interfacial Dipole Antennas. Radio Sci (1982) 17(6):1557–66. 10.1029/rs017i006p01557
Summary
Keywords
surface enhanced Raman spectroscopy, remote sensing, fiber optics, gold nanoparticles, self-assembly, optical metamaterial, fused silica fiber, enhancement factor
Citation
Zhang X, Zhang K, von Bredow H, Metting C, Atanasoff G, Briber RM and Rabin O (2022) Remote Chemical Sensing by SERS with Self-Assembly Plasmonic Nanoparticle Arrays on a Fiber. Front. Phys. 9:752943. doi: 10.3389/fphy.2021.752943
Received
03 August 2021
Accepted
29 November 2021
Published
25 January 2022
Volume
9 - 2021
Edited by
Carlos Marques, University of Aveiro, Portugal
Reviewed by
Ana-Maria Craciun, Babes-Bolyai University, Romania
Carlos Ferrer, University of Aveiro, Portugal
Updates
Copyright
© 2022 Zhang, Zhang, von Bredow, Metting, Atanasoff, Briber and Rabin.
This is an open-access article distributed under the terms of the Creative Commons Attribution License (CC BY). The use, distribution or reproduction in other forums is permitted, provided the original author(s) and the copyright owner(s) are credited and that the original publication in this journal is cited, in accordance with accepted academic practice. No use, distribution or reproduction is permitted which does not comply with these terms.
*Correspondence: Oded Rabin, oded@umd.edu
This article was submitted to Optics and Photonics, a section of the journal Frontiers in Physics
Disclaimer
All claims expressed in this article are solely those of the authors and do not necessarily represent those of their affiliated organizations, or those of the publisher, the editors and the reviewers. Any product that may be evaluated in this article or claim that may be made by its manufacturer is not guaranteed or endorsed by the publisher.