 Bin Tang1,2
 Fangyuan Han
- 1Electric Power Research Institute of Guangxi Power Grid Co., Ltd., Nanning, China
- 2Guangxi Key Laboratory of Intelligent Control, Operation and Maintenance of Electric Power Equipment, Nanning, China
- 3Guangxi Power Grid Co., Ltd., Nanning, China
- 4Nanning Power Supply Bureau of Guangxi Power Grid Co., Ltd., Nanning, China
Analytical science has always been calling for simple, fast and ultra-sensitive methods to sense molecules of interest. Surface-Enhanced Raman Spectroscopy (SERS) has drawn much attention as a convenient tool for molecular fingerprint characterization. In addition to sample preparation, the key point of sensitive SERS detection is the preparation of highly reproducible and sensitive SERS substrates. In this paper, 2D gold nanoclusters are grown on surfaces of glass slips using an in-situ cyclic growth method in aqueous solutions to prepare high-quality SERS substrates, whose surface morphology can be effectively modulated by adjusting a few parameters during preparation. Substrates prepared with optimized parameters exhibit high SERS activity, uniform response, and good batch-to-batch reproducibility. Due to their strong absorption in the near-infrared range, the substrates can be combined with a portable Raman spectrometer with 785 nm excitation wavelength to detect traces of dibenzyl disulfide (DBDS), a major source of corrosive sulfur in mineral insulating oil. A detection limit lower than 1 mg/L can be achieved with the aid of a simple sample pretreatment method, representing a promising on-site insulating oil analysis method for electric power industry.
Introduction
Surface-enhanced Raman scattering, usually 6–14 orders of magnitude stronger than spontaneous Raman scattering, is mainly caused by the localized surface plasmon resonance absorption arising from the interaction between the excitation light and the induced electromagnetic field near the surfaces of noble metal nanostructures. In the past few decades, the SERS technique has been applied in a wide variety of fields as an attractive tool for label-free and separation-free detection of target molecules in complex systems, and it is well accepted that high-quality substrates are essential for the success of such applications. Metal nanoparticles (NPs), either in the form of suspensions or anchored to solid materials, represent one of the most important types of SERS substrates today. The electromagnetic field above the substrate is uneven, and the distribution of its intensity relies heavily on the surface morphology, with an exceptionally high electromagnetic field intensity in close proximity to the tips of and gaps between noble metal NPs. These special areas, namely SERS hot spots [1], are far superior to other areas of the substrate in generating enhancement. SERS hot spots can be either generated in solution phase through aggregation of metal NPs, or constructed above solid substrates by arranging metal NPs in two-dimensional or three-dimensional space through physical or chemical means. In order to attain an immense enhancement effect, the analyte molecules must be brought close enough to SERS hot spots. Compared with solid SERS substrates, it is generally more challenging to capture the analytes at hot spots and guarantee the reproducibility of detection results with liquid SERS reagents, since the aggregation and dispersion of NPs in colloidal suspensions are usually difficult to be brought under control.
At present, preparation methods of solid SERS substrates mainly focus on organizing plasmonic nanostructures into ordered two-dimensional (sometimes three-dimensional) arrays, and can be divided into two main categories, i.e., top-down and bottom-up methods. Top-down methods involve fabrication of nanostructures using various lithographic techniques, such as electron-beam lithography, nanoimprint lithography and nanosphere lithography, which make it possible to precisely control the surface geometry and achieve uniform distribution of hot spots on the substrate surface. Although reproducible SERS substrates can be rapidly prepared [2], the top-down methods actually require sophisticated and expensive instruments as well as complicated preparation processes. Due to the limitation of the template size, the prepared substrates may fail to present sufficient enhancement [3]. So far, wide application of highly sensitive commercial SERS substrates prepared in batches by top-down methods has not been realized.
Self-assembly of NPs is widely used in bottom-up methods to prepare two-dimensional SERS substrates. The self-assembly of NPs at the interface of two immiscible fluids is one of the most attractive methods. Generally, NPs can be spontaneously adsorbed to the interface in order to minimize the free energy, thereby forming close-packed 2D nanoclusters [4, 5]. These structures can be directly used as a two-dimensional SERS substrate. For example, the self-assembly of gold nanorods at the oil-water interface can simultaneously and quantitatively detect water-soluble rhodamine 6G and organic molecules with low nanomolar concentrations, such as oleic acid. Such 2D nanoclusters can also be transferred to a solid-phase interface, such as the surface of a polymer film, and used as a flexible SERS substrate [6–8]. The bottom-up methods can also rely on electrostatic interactions, the van der Waals force or the stronger chemical bonding force to construct two-dimensional nanoclusters on dense surfaces. However, these methods are limited not only by the mismatch between the size of NPs and the ability to connect bifunctional molecules [9–11], but also by the presence of surface charges on NPs. As a result, it is generally difficult to form a continuous and dense self-assembly layer of noble metal nanoclusters on the surface of a solid substrate, and effective SERS detection is hampered by a reduced sensitivity [12, 13].
In this paper, we proposed an in-situ growth approach for the preparation of 2D gold nanoclusters with high-density nanogaps on the surface of flat glass slips, where 5 nm gold NPs were used as gold seeds. The gold NPs were anchored to the glass surface, and then underwent immersion in different growth solutions. The selection of basic parameters such as the composition and amount of the growth solution, soaking time and soaking sequence proved very important for the modulation of substrate surface morphology and SERS detection performance. With optimized parameters, batch preparation of highly reproducible SERS substrates can be achieved. Finally, the glass-surface-based SERS device was applied in the detection of dibenzyl disulfide (DBDS), a major source of corrosive sulfide in insulating oil, by using a regular portable Raman spectrometer.
Experimental Section
Chemicals and Materials. Chloroauric acid trihydrate (HAuCl4·3H2O), trisodium citrate (C6H5Na3O7, 99%), 3-aminopropyl trimethoxysiloxane (3-APTMS, C6H17NO3Si, 97%), Sodium borohydride (NaBH4, 99%), hydroxylamine hydrochloride (NH2OHHCl, 99%), 4-mercaptobenzoic acid (4-MBA, C7H6O2S, analytical grade), N-Methylpyrrolidone (C5H9NO, analytical grade) and dibenzyl disulfide (DBDS, C14H14S2, 99%) were purchased from Aladdin Biotechnology Co., Ltd. (Shanghai, China). All of the above-mentioned chemicals were of analytical grade and used without further purification unless otherwise noted. Insulating oil (KI25X) was purchased from KunLun Lubricant (Beijing, China). Milli-Q water with a resistivity of 18.2 MΩ·cm was used throughout the experiments. Glassware was soaked with aqua regia and cleaned before use.
Synthesis of Gold Seeds and its Fixation on the Glass Surface. 50 ml deionized water was added to a 150 ml round bottom flask, then 500 µL 1% wt chloroauric acid solution was added with constant stirring. 1.5 ml 11.4 mg/ml trisodium citrate solution was then added as a protective agent. Finally, 500 µL 0.8 mg/ml sodium borohydride solution was added, and the solution was stirred continuously for 2 h to obtain the wine red solution containing the required nano gold seeds. A 10 × 20 mm glass slip was cleaned and then immersed in 0.1% wt APTMS solution for dozens of minutes before taken out to dry with nitrogen. APTMS can couple a large number of amino groups to the glass surface, so that the nano-gold seeds can be fixed to the glass slip through the affinity interaction between NH2 and gold. The glass slip was then immersed in the nano-gold seeds solution and hung vertically for 10 h before taken out to dry with nitrogen.
In-situ growth of 2D Gold Nanoclusters on Glass Surface. The aforementioned pretreated glass slip was placed in a 5 ml Eppendorf microcentrifuge tube, and 3 ml deionized water was added to just immerse the entire slip. 40 μL 0.2% wt HAuCl4 and 20 μL 0.04 mol/L hydroxylamine hydrochloride solution were subsequently added to make the growth solution needed for a single growth cycle [14]. The microcentrifuge tube was then put in a constant temperature mixer to shake at 1,500 rpm for 15 min, before it was taken out and washed with deionized water at the end of the first growth cycle. Generally, it takes five such growth cycles to form a good 2D gold nanoclusters substrate on glass surface.
Preparation of DBDS Samples. The 1,000 mg/L DBDS stock solution was prepared by dissolving 10 mg standard powder in 10 ml ethanol. DBDS standard solutions of different concentrations (10, 50, 100, 500 mg/L) were prepared by serial dilution of the stock solution with ethanol. The spiked DBDS samples were prepared following similar procedures, with the solvent being insulating oil (KI25X) instead of ethanol.
Results and Discussion
Synthesis and Characterization of Gold Seeds. The nano-gold seeds must be sufficiently small in size so as to meet the need of subsequent solid-phase growth. The minuscule gold seeds not only ensure the uniformity of adsorption on the glass surface in the initial step, but also make the controllable epitaxial growth of gold seeds possible [15]. In the process of gold seeds synthesis, besides sodium borohydride that served as a reducing agent [16], trisodium citrate was added as a protective agent to make the gold seeds stable. Furthermore, the 2-h reaction time ensures complete consumption of excess sodium borohydride, so that the subsequent fixation can be achieved without further purification [17], thus effectively simplifying the preparation process. The transmission electron microscopy (TEM, JEM-2100, JEOL) images of the gold seeds are shown in Supplementary Figure S1. It can be seen from the TEM images that the gold seeds have a relatively uniform particle size around 5 nm.
Optimization of Soaking Time of Glass Slips in APTMS. At room temperature, the glass slips can be simply soaked in the APTMS solution to complete surface adsorption. APTMS was selected as the linker between gold NPs and glass surface for the following reasons: First, the adsorbed APTMS can contribute a large number of amino groups, so that the affinity interaction between NH2 and gold NPs allows successful fixation of gold seeds; second, Raman signals of APTMS molecules are notably weak in the spectral range of interest and will not interfere with the spectra of other surface substances; third, the APTMS-modified layer on the surface of the glass slip is optically transparent in the visible and near-infrared range and won’t affect focusing of the excitation laser. The only factor affecting the adsorption rate of APTMS on the glass surface is soaking time. To optimize the soaking time, both the gold seeds assembly time (10 h) and number of growth cycles (five times) were kept unchanged. The morphologies of two-dimensional nanoclusters prepared with soaking time of 10, 20, 30 and 60 min were obtained by scanning electron microscopy (SEM, Zeiss SIGMA, Zeiss). As shown in Supplementary Figure S2, no obvious change in morphology was observed except that the particle spacing in Supplementary Figure S2A is larger. Therefore, the soaking time of glass slips in APTMS was chosen to be 20 min, since a further increase in soaking time has little impact on the morphology of nanoclusters.
Optimization of the Number of Growth Cycles. The number of growth cycles was varied between three and nine, while other conditions were fixed during the in-situ growth of 2D gold nanoclusters. As the number of growth cycles increases, the nanoclusters get closer to each other. As shown in Figure 1, the 2D nanoclusters basically formed a dense monolayer on the surface of the glass slip after five growth cycles, while no obvious change in morphology was found with two additional cycles. A further increase to nine growth cycles lead to excessive growth of nanoclusters on the glass surface and a significant change in morphology was observed. Therefore, five growth cycles were the best choice taking into account both substrate quality and preparation time.
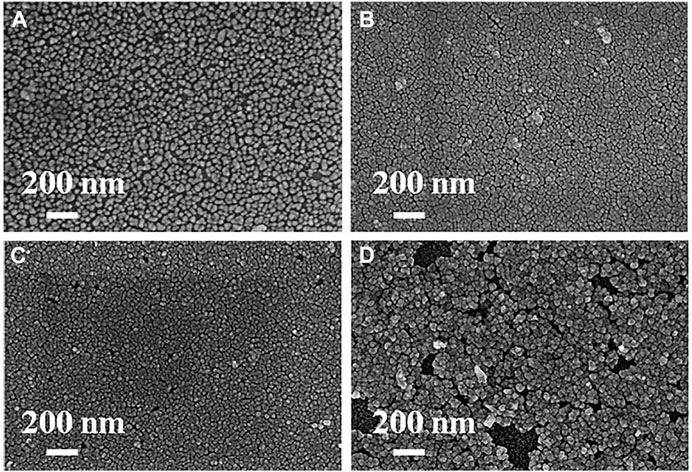
FIGURE 1. SEM images of the 2D gold nanoclusters on glass slips obtained by merely adjusting the number of growth cycles to (A) 3 cycles (B) 5 cycles (C) 7 cycles and (D) 9 cycles.
Optimization of the Surface Morphology of Substrates. Although the 2D gold nanoclusters on glass slips were obtained through the aforementioned optimization process, where the density of nanoclusters could be conveniently controlled by adjusting a few parameters, the size of NPs can also play a crucial role in producing substrates with high enhancement factors. In order to optimize the size of NPs, it is necessary to determine the most appropriate amount of growth solution, and the number of growth cycles may need to be adjusted accordingly. After some preliminary attempts based on the above cyclic growth method, it was found that an increase in the amount of growth solution helps form gold nanoclusters of larger sizes, which is generally beneficial for generating greater SERS enhancement. If 40 μL 0.2% wt chloroauric acid solution and 20 μL 0.04 mol/L hydroxylamine hydrochloride solution are defined as a basic unit of growth solution amount, represented by a circled number ①, then an increased amount of growth solution can be represented by a larger circled number. For example, the symbol ② represents 80 μL 0.2% wt chloroauric acid solution and 40 μL 0.04 mol/L hydroxylamine hydrochloride solution, while the symbol ④ stands for 160 μL 0.2% wt chloroauric acid solution and 80 μL 0.04 mol/L hydroxylamine hydrochloride solution. To simplify the optimization procedure, the amount of growth solution in the first cycle was increased to ④, ⑥ and ⑧ in different trials, while a constant amount of ② was used for the remaining four growth cycles in each trial. The obtained substrates exhibited excessive growth morphologies rather than the ideal morphology of single-layer 2D nanoclusters, as shown in Supplementary Figure S3. It was also found that an even higher initial amount of growth solution, i. e., ⑩ in the first cycle, makes the particle size nonuniform and the morphology difficult to control.
To meet the requirements of both large particle size and good uniformity, the amount of growth solution in the first cycle was selected to be ⑥ or ⑧, and a constant amount of ② was used for all remaining growth cycles in each trial. Meanwhile, the total number of cycles was properly reduced to avoid excessive growth of NPs, as shown in Figure 2. It can be seen in Figure 2D, where a four-cycle sequence of ⑧②②② was applied, that the particle size is uniform and substantially larger compared with substrates obtained before surface morphology optimization. With the soaking time in APTMS and subsequently in gold seeds solution unchanged, the density of gold seeds fixed to the glass slip surface will not change either. The larger the size of nanoparticles obtained by epitaxial growth, the smaller the spacing between particles and the better the enhancement effect, on condition that no excessive growth of nanoparticles occurs. More importantly, the nano gaps in Figure 2D are dense and evenly distributed. Additionally, the morphology of this optimized substrate exhibits good batch-to-batch reproducibility, as shown in Supplementary Figure S4.
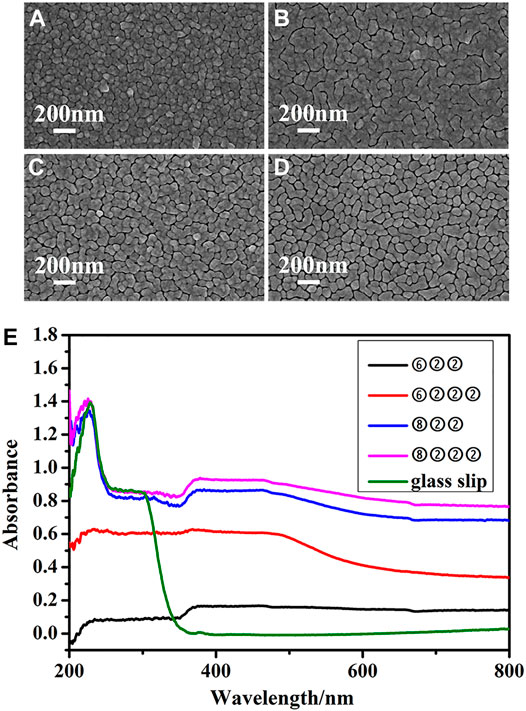
FIGURE 2. SEM images of substrates obtained by adjusting the number of growth cycles and the amount of growth solution to (A) three growth cycles: ⑥②② (B) four growth cycles: ⑥②②② (C) three growth cycles: ⑧②② (D) four growth cycles: ⑧②②② and (E) SPR reflection characterization of the above substrates.
Optical Properties of Different SERS Substrates. The performance of SERS detection relies heavily on substrates’ optical properties such as surface plasmon resonance (SPR) reflection and the uniformity of SERS signal intensity. As shown in Figure 2E, the glass slips hardly absorb in the visible range. However, once the 2D gold nanoclusters form on their surfaces, the SPR reflection from 400 to 800 nm shows peaks similar to absorption. With greater amounts of growth solution and more growth cycles, the intensity of SPR is significantly enhanced. It can also be seen that in addition to the SPR reflection of individual gold NPs, there is an obvious coupling SPR reflection between gold nanoclusters above 600 nm. Therefore, 785 nm semiconductor near-infrared laser can be used as the excitation light source of SERS for practical on-site detection.
In order to characterize the uniformity of SERS signals across the 2D substrate, 4-MBA was selected as the reporter molecule. 40.8 mg 4-MBA was dissolved in ethanol and diluted to 100 ml to prepare a 1 × 10⁻³ mol/L stock solution, which was further diluted using deionized water to make a 1 × 10⁻⁶ mol/L 4-MBA standard solution. SERS substrates were prepared following the same procedure as the one shown in Figure 2D. Substrates were immersed in the above-mentioned 4-MBA standard solution for 30 min and then taken out for measurements. SERS measurements were performed by using a confocal micro-Raman spectrometer (DXR3, Thermo Fisher) with 5 mW of 632.8 nm radiation from a Helium-Neon laser. The 20 × objective lens of the spectrometer was used to scan an area of 300 × 150 μm2, with an exposure of 5 s and a spectral range of 400–1800 cm−1. Each spectrum was an average of results from three repeated measurements. SERS mapping images were drawn based on the SERS intensity of the characteristic peak at 1,080 cm−1 shown in Figure 3A, and the enhancement effect of the substrate is relatively uniform except for a few odd values, as shown in Figure 3B.
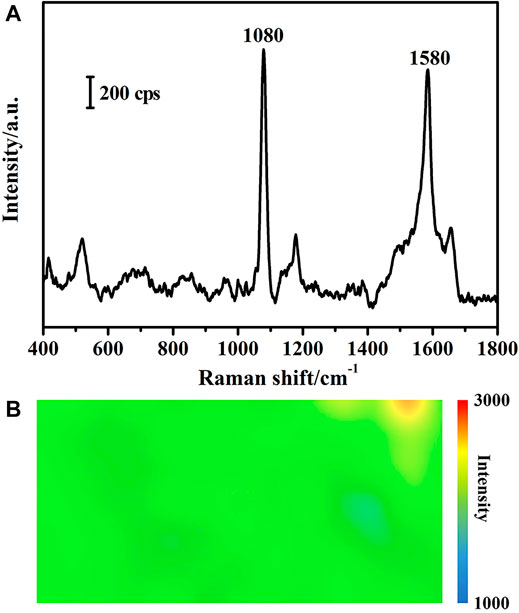
FIGURE 3. (A) SERS spectrum of 4-MBA and (B) SERS mapping image of the optimized substrate based on the SERS intensity of the 1,080 cm−1 peak of 4-MBA.
In order to explore the possibility of applying the above-mentioned substrates in SERS detection with a portable Raman spectrometer, SERS signals of 4-MBA were registered with substrates prepared by two, three and four growth cycles, respectively. For substrates preparation, the amount of growth solution was selected to be ⑧ in the first growth cycle and ② for all remaining growth cycles. SERS measurements were performed by using a portable Raman spectrometer (SEED3000, OCEANHOOD) with 200 mW of 785 nm radiation. The exposure was set as 1 s and the spectral range was 400–1800 cm−1. Each spectrum was an average of results from two repeated measurements. Stronger SERS signals of 4-MBA were registered as the number of growth cycles increased, as shown in Supplementary Figure S5, due to a smaller spacing and thus enhanced coupling between nano particle clusters. It can be seen that the cyclic epitaxial growth can effectively regulate the enhancement effect of the substrate, and more importantly, the wet-chemistry based method allows substrates to be prepared in batches.
SERS Detection of DBDS in ethanol and in Insulating Oil. Standard solutions of DBDS were obtained by dissolving DBDS in ethanol. Before SERS measurements, 1 μL of standard solution was dripped onto the surface of the substrate using a micropipette. After evaporation of the solvent, SERS measurements were carried out with the above-mentioned portable Raman spectrometer by focusing the excitation laser on the thin layer of remnants. SERS spectra of DBDS standard solutions of different concentrations (10, 50, 100, 500, 1,000 mg/L) obtained in this manner were shown in Figure 4A. By comparison with the intrinsic Raman spectrum of DBDS in Figure 4C, which was obtained through direct measurements of DBDS powder, the peak at 996 cm−1 was identified as a characteristic peak of DBDS. This peak is clearly discernible in all three spectra in Figure 4A, with its intensity dependent on the original concentrations of DBDS solutions, as shown in Figure 4B.
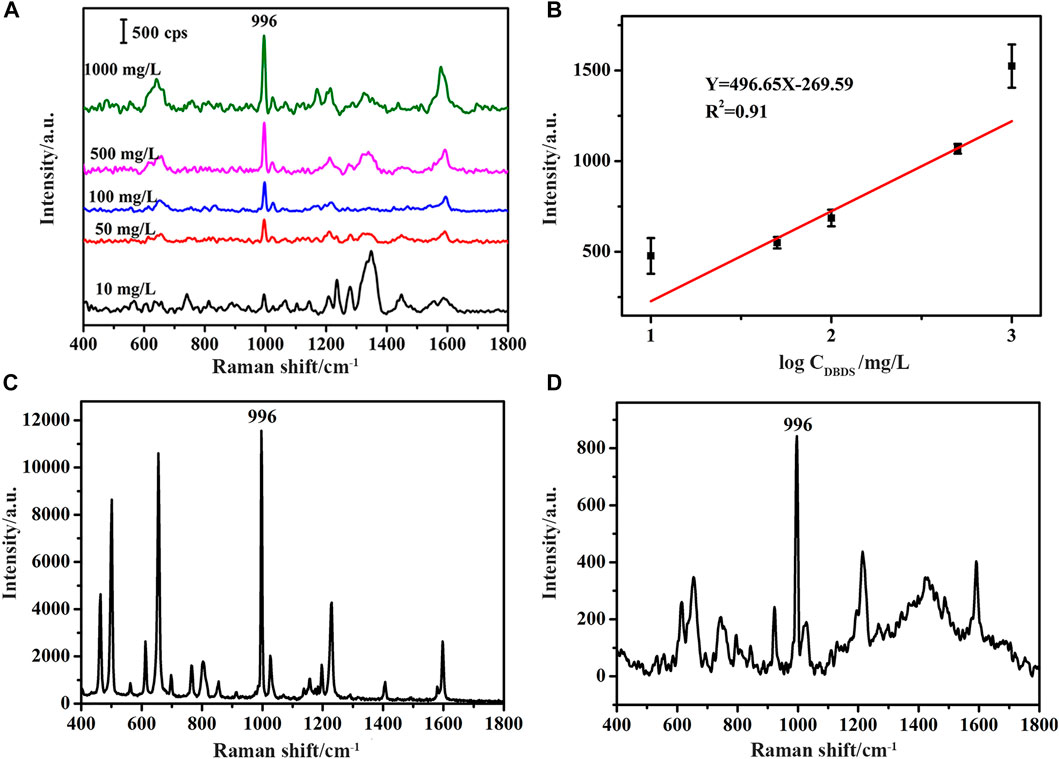
FIGURE 4. (A) SERS spectra of DBDS standard solutions of different concentrations (10, 50, 100, 500, 1,000 mg/L DBDS in ethanol) (B) The working curve (C) The intrinsic Raman spectrum of DBDS obtained through direct measurements of DBDS powder and (D) The SERS spectrum of the DBDS solution obtained by extracting 3 ml 1 mg/L DBDS in insulating oil with 300 µL 3-methylpyrrolidone.
DBDS has been identified as a major source of corrosive sulfur in mineral insulating oil widely used in power industry. DBDS may do harm to paper insulation commonly used in high-voltage power equipment and cause reduction in key insulation properties. Standard detection methods of DBDS in insulating oil rely on lab-based analytical instruments such as gas chromatograph, ion chromatograph and mass spectrometer. In order to explore whether SERS method is applicable to the detection of DBDS in insulating oil, 1 mg/L DBDS sample was prepared and 3 ml such sample was mixed well with 300 µL 3-methylpyrrolidone in a 5 ml Eppendorf microcentrifuge tube. After standing for 15 min, the bottom layer was taken out and dripped onto the substrate for SERS detection using the aforementioned portable Raman spectrometer. As shown in Figure 4D, the characteristic peak of DBDS at 996 cm−1 was clearly discernible, suggesting a detection limit lower than 1 mg/L when combined with the above-mentioned pretreatment method. In the latest version of IEC 60296, an international standard issued by the International Electrotechnical Commission, the concentration of DBDS in mineral insulating oil is required to be less than 5 mg/kg, a limit that is obviously higher than 1 mg/L since the density of mineral insulating oil used in the experiment is around 0.9 kg/L at room temperature.
Conclusion
In this paper, tiny gold seeds were uniformly modified on the surfaces of glass slips, and the gap plasmon coupling of two-dimensional planar gold nanoclusters was controllably adjusted via epitaxial growth. A multiple cyclic growth procedure was designed to ensure the reproducibility and thus enable batch preparation of SERS substrates. Wet chemical synthesis was adopted throughout the preparation process, making the method simple and cost-effective. Substrates prepared by this method exhibit high SERS activity and uniform SERS response. When combined with simple sample pretreatment such as liquid-liquid extraction, practically important organic compounds such as DBDS in insulating oil can be detected by using a commercially available portable Raman spectrometer, and a detection limit lower than what is required by the international standard can be achieved, thus representing a promising on-site insulating oil analysis method for power industry.
Data Availability Statement
The raw data supporting the conclusion of this article will be made available by the authors, without undue reservation.
Author Contributions
All authors listed have made a substantial, direct and intellectual contribution to the work and approved it for publication.
Funding
This study received funding from Guangxi Power Grid Co., Ltd. (GXKJXM20190787). The funder was not involved in the study design, collection, analysis, interpretation of data, the writing of this article or the decision to submit it for publication.
Conflict of Interest
BT, FH, and LZ were employed by the company Electric Power Research Institute of Guangxi Power Grid Co., Ltd. and Guangxi Key Laboratory of Intelligent Control, Operation and Maintenance of Electric Power Equipment.
JW was employed by the company Guangxi Power Grid Co., Ltd.
ZX and RW were employed by the company Nanning Power Supply Bureau of Guangxi Power Grid Co., Ltd.
Publisher’s Note
All claims expressed in this article are solely those of the authors and do not necessarily represent those of their affiliated organizations, or those of the publisher, the editors and the reviewers. Any product that may be evaluated in this article, or claim that may be made by its manufacturer, is not guaranteed or endorsed by the publisher.
Supplementary Material
The Supplementary Material for this article can be found online at: https://www.frontiersin.org/articles/10.3389/fphy.2021.771568/full#supplementary-material
References
1. Li Y, Xin X, Zhang T, Li W, Li J, Lu R. Raspberry-like Polyamide@Ag Hybrid Nanoarrays with Flexible Cores and SERS Signal Enhancement Strategy for Adenosine Detection. Chem Eng J (2021) 422:129983. doi:10.1016/j.cej.2021.129983
2. Kneipp J. Nanosensors Based on SERS for Applications in Living Cells. Top Appl Phys (2006) 103:335–49. doi:10.1007/3-540-33567-6_17
3. Ghosh P, Han G, De M, Kim C, Rotello V. Gold Nanoparticles in Delivery Applications☆. Adv Drug Deliv Rev (2008) 60:1307–15. doi:10.1016/j.addr.2008.03.016
4. Lee YH, Shi W, Lee HK, Jiang R, Phang IY, Cui Y, et al. Nanoscale Surface Chemistry Directs the Tunable Assembly of Silver Octahedra into Three Two-Dimensional Plasmonic Superlattices. Nat Commun (2015) 6:2418–21. doi:10.1038/ncomms7990
5. Kim K, Han HS, Choi I, Lee C, Hong S, Suh S-H, et al. Interfacial Liquid-State Surface-Enhanced Raman Spectroscopy. Nat Commun (2013) 4:159–60. doi:10.1038/ncomms3182
6. Lane LA, Qian X, Nie S. SERS Nanoparticles in Medicine: From Label-free Detection to Spectroscopic Tagging. Chem Rev (2015) 115:10489–529. doi:10.1021/acs.chemrev.5b00265
7. Wu H-L, Tsai H-R, Hung Y-T, Lao K-U, Liao C-W, Chung P-J, et al. A Comparative Study of Gold Nanocubes, Octahedra, and Rhombic Dodecahedra as Highly Sensitive SERS Substrates. Inorg Chem (2011) 50:8106–11. doi:10.1021/ic200504n
8. Wang H, Zhou Y, Jiang X, Sun B, Zhu Y, Wang H, et al. Simultaneous Capture, Detection, and Inactivation of Bacteria as Enabled by A Surface-Enhanced Raman Scattering Multifunctional Chip. Angew Chem Int Ed (2015) 54:5132–6. doi:10.1002/ange.20150275210.1002/anie.201412294
9. Wu Z, Dong B, Zhou X, Shen A, Hu J. INHIBIT-Inspired Two-Output DNA Logic Gates Based on Surface-Enhanced Raman Scattering. Chem Eur J (2015) 21:14301–4. doi:10.1002/chem.201502938
10. Xie W, Walkenfort B, Schlücker S. Label-Free SERS Monitoring of Chemical Reactions Catalyzed by Small Gold Nanoparticles Using 3D Plasmonic Superstructures. J Am Chem Soc (2013) 135:1657–60. doi:10.1021/ja309074a
11. Xie W, Grzeschik R, Schlücker S. Metal Nanoparticle-Catalyzed Reduction Using Borohydride in Aqueous Media: A Kinetic Analysis of the Surface Reaction by Microfluidic SERS. Angew Chem Int Ed (2016) 55:13729–33. doi:10.1002/anie.201605776
12. Chen K, Zhang X, MacFarlane DR. Ultrasensitive Surface-Enhanced Raman Scattering Detection of Urea by Highly Ordered Au/Cu Hybrid Nanostructure Arrays. Chem Commun (2017) 53:7949–52. doi:10.1039/c7cc03523c
13. Gannabathula S, Krissansen GW, Bisson-Rowe L, Skinner M, Steinhorn G, Schlothauer R. Correlation of the Immunostimulatory Activities of Honeys with Their Contents of Identified Bioactives. Food Chem (2017) 221:39–46. doi:10.1016/j.foodchem.2016.10.038
14. Zhang L, Jiang C, Zhang Z. Graphene Oxide Embedded Sandwich Nanostructures for Enhanced Raman Readout and Their Applications in Pesticide Monitoring. Nanoscale (2013) 5:3773–9. doi:10.1039/c3nr00631j
15. Hu C, Bai X, Wang Y, Jin W, Zhang X, Hu S. Inkjet Printing of Nanoporous Gold Electrode Arrays on Cellulose Membranes for High-Sensitive Paper-like Electrochemical Oxygen Sensors Using Ionic Liquid Electrolytes. Anal Chem (2012) 84:3745–50. doi:10.1021/ac3003243
16. Pai NP, Vadnais C, Denkinger C, Engel N, Pai M. Point-of-care Testing for Infectious Diseases: Diversity, Complexity, and Barriers in Low- and Middle-Income Countries. Plos Med (2012) 9:e1001306. doi:10.1371/journal.pmed.1001306
Keywords: surface-enhanced Raman spectroscopy, in-situ growth, on-site analysis, dibenzyl disulfide, insulating oil
Citation: Tang B, Han F, Zhu L, Luo Z, Wang J, Xu Z and Wu R (2021) In-Situ Growth of Two-Dimensional Gold Nanoclusters on Glass Surface for On-Site Surface-Enhanced Raman Spectroscopic Detection. Front. Phys. 9:771568. doi: 10.3389/fphy.2021.771568
Received: 06 September 2021; Accepted: 05 October 2021;
Published: 21 October 2021.
Edited by:
Xianming Kong, Liaoning Shihua University, ChinaReviewed by:
Guo Xiaoyu, Shanghai Normal University, ChinaYe Liu, Oregon State University, United States
Copyright © 2021 Tang, Han, Zhu, Luo, Wang, Xu and Wu. This is an open-access article distributed under the terms of the Creative Commons Attribution License (CC BY). The use, distribution or reproduction in other forums is permitted, provided the original author(s) and the copyright owner(s) are credited and that the original publication in this journal is cited, in accordance with accepted academic practice. No use, distribution or reproduction is permitted which does not comply with these terms.
*Correspondence: Fangyuan Han, aGFuX2Z5LnN5QGd4LmNzZy5jbg==