Abstract
As the first step for revealing potential rules inherent in cities that are closely squeezed in a sectioned domain, municipalities in the entire prefecture in Japan are considered and their distributions of the areas are analyzed in details according to a rank-size procedure. Computed results suggest that among the population, area, and population density, the last becomes the most important factor in finding the rank-size rule. Indeed, of the 47 Japanese prefectures the Metropolis of Tokyo and Fukuoka Prefecture exhibit the most typical rank-size rules, where the former possesses the exceptionally high population density as well as urbanized rate. The underlying mechanism of the rule can be supported by a toy model with a tournament game using a sequence of random numbers, where teams (municipalities) are highly competitive in gaining the final wins (broadest territory). A stability analysis implying perturbations due to global warming allows one to confirm unexpected robustness of the rank-size relation. Finally, the authenticity of the log-log relation in the rank-area data of Tokyo Metropolis is tested statistically.
Introduction
Cities, towns, and villages have long been regarded as an attractive object of scientific study [1–3]. In the context of applied statistical physics, their dynamics, configuration, geography, and population have been studied from a variety of viewpoints [4–20]. In an effort to reveal implicit rules that govern the organized whole, the possibility of bearing rank-size rules such as the Zipf’s law and its variants has been constantly discussed for realistic cities that are scattered all over the world [7, 8, 13, 15, 18, 19]. Besides the conventional approach to cities, in recent years, arguments from a new perspective have been assembled. The most typical examples can be seen in quantitative studies on the basis of social interaction, information entropy, environmental change, and sustainability [21–24]. It should be noted here that in most literature the key term “size” has been employed implicitly as the meaning of population. One should notice, however, that besides the population there are two meanings in the term, namely, area and population density. In this paper we focus our principal attention on the former. Specifically, areas of municipalities (not only cities but towns and villages being included) that are squeezed in a prefecture of a country are considered. For an example we consider Japan because this country has been divided into 47 prefectures; in each prefecture, typically tens of municipalities are closely packed with a unique configuration that has been arranged according to a self-organized process over a long period. The distributions of the areas are analyzed in detail according to a rank-size procedure. Through numerical results, one can identify, among the populations, areas, and population densities of prefectures, a key factor in finding the rank-size rule. Indeed, of the 47 Japanese prefectures, only four (specifically, the Metropolis of Tokyo; Hiroshima, Shimane, and Fukuoka Prefectures) are shown to exhibit the typical rank-size rules, where the first in the parentheses possesses the exceptionally high population density as well as urbanized rate. The underlying mechanism of the rule is explained by a toy model with a tournament game using a sequence of random numbers, where teams (municipalities) are highly competitive for gaining the final wins (broadest territory). A stability analysis implying perturbations due to global warming allows one to discuss robustness of the rank-size relation. Finally, the authenticity of the log-log relation in the rank-area data of Tokyo Metropolis is tested with the Durbin-Watson d statistics.
Motivation and Methodology
Suppose that you are an inhabitant in a square-shaped prefecture, who is asked by the king to divide the land into unequal squares as few as possible in number. It is assumed further that if the requirement is met, the king is pleased to give you the entire land and at the same time to assign you to the governor of the prefecture. Struggling with the problem for hours or days, finally you will find it too difficult to solve. Actually, this is termed the simplest perfect squared square problem, which, along with the Kepler’s closest packing and the four colors problem, had long been one of the most difficult problems in geometry. In 1948, 23 years after the first explicit mention of division into unequal squares by Morón, a compound perfect square with 24 squares was realized by Willcocks [25] (see Figure 1A). Furthermore, after 30 years from his finding, in the long run the ultimately simple perfect squared square with only 21 elements was found by Duijvestijn [26, 27] (see Figure 1B), Dutch geometrician, who had devoted himself to solving the extremely hard problem. He applied Kirchhoff’s laws to polar nets with which the dissection was obtainable through calculating a current flow [26]. Here we note that for both squares there are pronounced inequalities in the areas of the elements, which may remind one of a realistic division inherent in lands that are constrained with a number of boundaries. Indeed, in 2003, 25 years after the great achievement by the Dutch scholar the areas y in the squared squares were found to obey the statistical rule [5] that corresponds to a q-extension of the logarithmic distributionwhere log abbreviates the common logarithm; x represents the rank in descending order; a, b, and q are positive real constants to be determined with the least squares fit. The analyzed results for the squares in Figure 1 are listed in Table 1 [5]. Here n is the number of elements; the accuracy of the regression model can be examined by the degree of fit, |r|, namely with the Pearson’s coefficient (0 < |r| < 1), and with the Durbin-Watson ratio, d (0 < d < 4) [28]for i = 1 to n – 1, wherefor i = 1 to n; Y = yq; and the prime on Y indicates the point on the regression line. In Table 1, dU represents the upper critical value of the ratio (α = 0.01, i.e. level 1% test being implied). For dU < d ≤ 2, a null hypothesis H: “There is no correlation between the neighboring residual data.” is not rejected. For a negative counterpart, i.e., 2 < d ≤ 4, d must be replaced with 4 – d. In contrast to non-ranking as well as rank-rank data (such as, e.g., Spearman’s and Kendall’s approaches), for the rank-size analysis, in most cases the positive correlations are included between the neighboring data. Note that along with detecting autocorrelations in the time-series data the Durbin-Watson d statistics was used also in other data; typical examples are seen in the Rietveld analysis of powder diffraction data [29–32] and in the Lorentzian fits in the 151Eu Mössbauer spectroscopy of oxide glasses [33]. More recently has the statistics been applied to testing assumptions of independent residuals in the physics education research [34].
FIGURE 1

Two perfect squared squares. (A) Willcock’s compound square of order 24. The sequential lengths of its elements are {81, 64, 56, 55, 51, 43, 39, 38, 35, 33, 31, 30, 29, 20, 18, 16, 14, 9, 8, 5, 4, 3, 2, 1}. (B) Duijvestijn’s simple square of order 21. They are {50, 42, 37, 35, 33, 29, 27, 25, 24, 19, 18, 17, 16, 15, 11, 9, 8, 7, 6, 4, 2}.
TABLE 1
| Configuration | n | q | |r| | d | dU |
| (A) Willcocks | 24 | 0.78 | 0.9945 | 1.450 | 1.20 |
| (B) Duijvestijn | 21 | 0.84 | 0.9977 | 1.521 | 1.16 |
Comparison of two perfect squared squares.
Besides the science of cities, to date, sustained efforts have been made to find nontrivial rules in the ranking of a variety of complex systems, not only in conventional physics but in geometry, geography, demography, linguistics, and sciences on social phenomena [35–43]. More recently has ranking been regarded as a tool useful for condensing large-scale data that have been accumulating in contemporary sciences such as, e.g., computational metallurgy [44] and gravitational wave astronomy [45], though the results are not yet ready for finding a rule.
Geometry of Problem
In this paper we consider the entire prefecture in Japan, which is divided into 47 prefectures that include Hokkaido and the Metropolis of Tokyo. In Figure 2, a complete map of A) Japan is given along with the ones of B) the Metropolis of Tokyo (n = 53, excluding remote islands), and C) Fukuoka Prefecture (n = 60). Here n indicates the number of municipalities squeezing in a prefecture, which consist of cities, towns, and villages. The two prefectures are to be cited in the rank-size analysis, and are marked with the blue and red ink, respectively, in Figure 2A. The colored dashed lines in Figures 2B,C indicate the boundaries among municipalities in the prefecture.
FIGURE 2

A complete map of (A) Japan, (B) the Metropolis of Tokyo, and (C) Fukuoka Prefecture. The two prefectures are marked with the blue and red ink, respectively, in (A). The colored dashed lines in (B, C) indicate the boundaries among municipalities in the prefecture.
Since the opening of Japan to the West, this country has experienced three major municipal consolidations [46]: 1) 1888–1889 (in the Meiji era): 71,314→15,859; 2) 1956–1961 (in the Showa era): 9,868→3,472; and 1999–2006 (in the Heisei era): 3,232→1,821, where arrow indicates the change in the number of municipalities in the entire country. Specifically, for Tokyo Metropolis, the historical sequence is 175 (1) in 1889, 121 (2) in 1943, 97 (5) in 1953, 58 (11) in 1961, 63 (27) in 2000, and 62 (26) in 2001, while for Fukuoka Prefecture it becomes 1,960 (2) in 1888, 386 (2) in 1889, 262 (12) in 1953, 120 (19) in 1956, 101 (16) in 1965, 97 (24) in 2000, and 60 (28) in 2010. Here the number in the parentheses represents the content of cities.
Results
Below numerical results for the areas in the 47 Japanese prefectures [46] are given. Note that in Figures 3, 4, truncation is made for the exceptional datum of Ehime Prefecture (q = 3.32), but it is included for the calculation of regression lines. For Fukui Prefecture, because of an ill-posed nature, there has been no optimal solution available:
FIGURE 3

Cross-sectional view of the three-dimensional scattergram of optimal solutions for the entire prefecture in Japan. The purple line in the individual cross section indicates the regression line. The red crosses that are superimposed on the dots highlight the four prefectures in Tables 2 and 3. (A)d-|r| plane (R = −0.0020 with d = 1.866). (B)q-|r| plane (R = −0.0278 with d = 2.016). (C)q-d plane (R = −0.0187 with d = 1.960).
FIGURE 4

Dependence of scaling exponent, q, on the geographic data of the entire prefecture in Japan. The purple line in the individual cross section indicates the regression line. The red crosses that are superimposed on the dots highlight the four prefectures in Tables 2 and 3. (A)q vs. common logarithm of population. (B)q vs. common logarithm of area (km2). (C)q vs. common logarithm of population density (km−2).
# The three frames in Figure 3 show a cross-sectional view of the three-dimensional scattergram of optimal solutions for the entire prefecture in Japan. The purple line in each individual cross section indicates the regression line. It can be seen that for all the cross sections the aggregation of dots is highly clustered around a “center of gravity”: specifically, A) 0.96 ≲ |r| ≲ 1.00 and 0.5 ≲ d ≲ 2.0 in the d-|r| plane, B) 0.96 ≲ |r| ≲ 1.00 and 0.2 ≲ q ≲ 1.5 in the q-|r| plane, and C) 0.5 ≲ d ≲ 2.0 and 0.2 ≲ q ≲ 1.5 in the q-d plane. Correlation analysis has shown that irrespective of the projective directions the dots are randomly scattered in each cluster. It can be found in Figure 3A that, in contrast to the dots’ aggregation in 0.99 < |r|, the d values exhibit concentrations in the vicinity of unity, indicating that, for reasons identical to quantifying serial correlations between adjacent least-squares residuals in Rietveld refinements of step-scan power diffraction data [29–32], the use of the Durbin-Watson d statistics is necessary for the rank-size analysis.
# Figure 4 shows the dependence of scaling exponent, q, in the left-hand side of Eq. 1 on the geographic data of the entire prefecture in Japan. First, as specific data we consider A) the population and B) the area (km2). Through correlation analysis it has been found that for the former, there exists a negative correlation (R = −0.3833 with d = 2.113), in contrast to a positive correlation (R = 0.4177 with d = 2.197) for the latter. Here R represents the correlation coefficient between the optimal parameters and the geographic data. The results allow one to expect that there will exist a stronger correlation between the scaling exponent and the population density (km−2) that is defined with the population divided by the area (km2). The plot on Figure 4C indicates that, as has been expected, there is a negative correlation with the maximum magnitude in the correlation |R| among the three (R = −0.5522 with d = 2.174).
# Above we have confirmed the noticeable dependence of the scaling exponent, q, on the population density. Therefore, it appears interesting to examine how the other two parameters, |r| and d, depend on the population density (km−2). Figure 5A shows the dependence of the degree of fit, |r|. It can be seen that, although in comparison with Figure 4C the magnitude of the correlation between |r| and the density reduces substantially, the parameter is positively correlated with the density (R = 0.2215 with d = 2.528). For the Durbin-Watson ratio, however, as is apparent in Figure 5B, correlation vanishes (R = -0.0095 with d = 2.206).
FIGURE 5
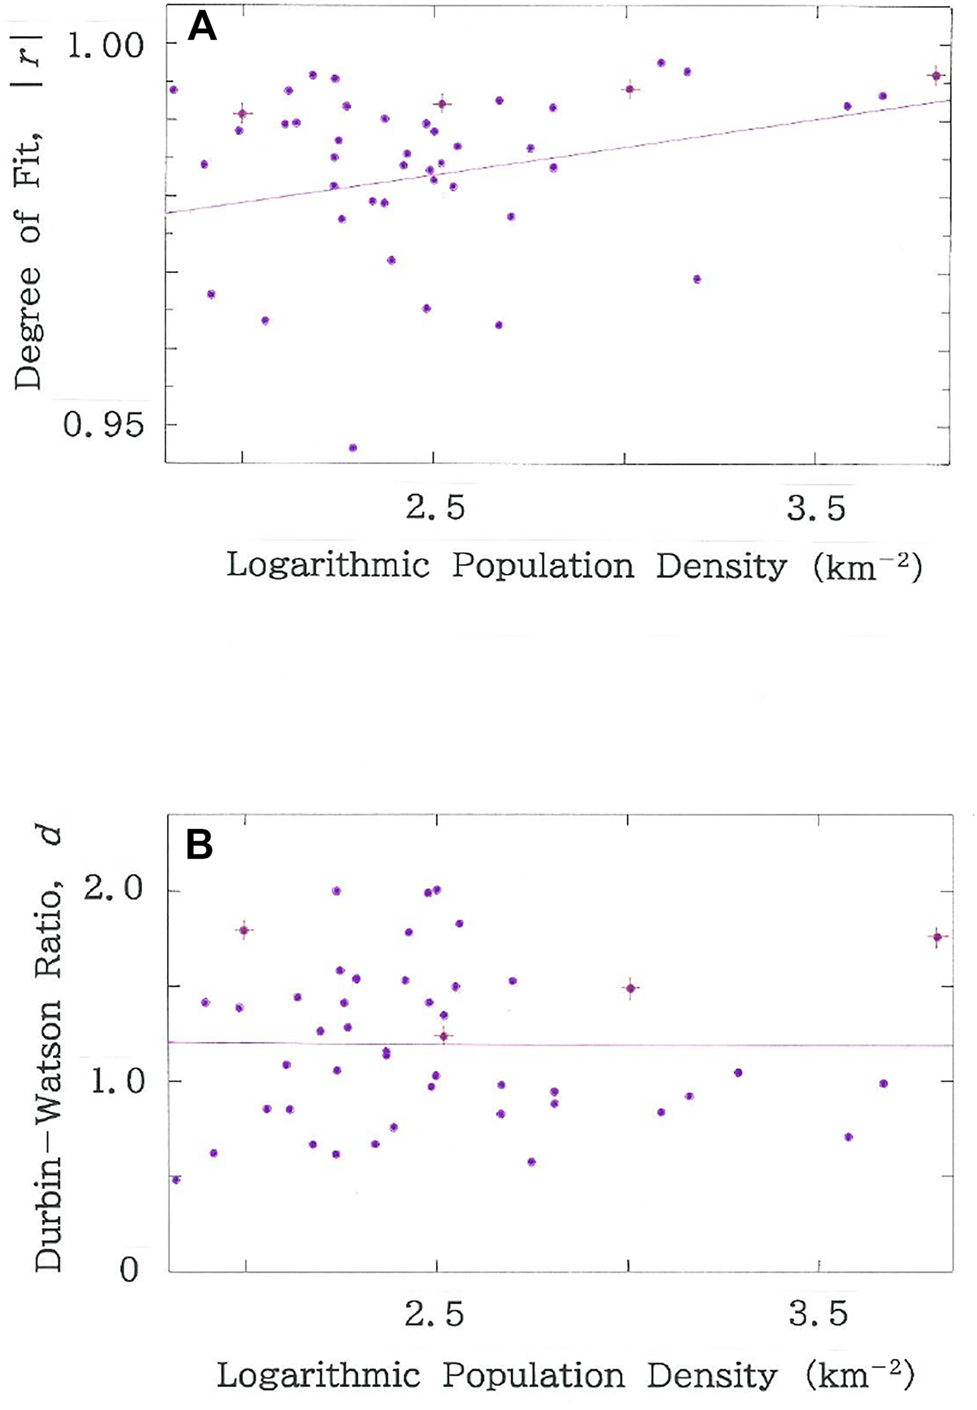
Dependence of (A) degree of fit, |r|, and (B) Durbin-Watson ratio, d, on the common logarithm of population density (km−2) for the entire prefecture in Japan. The purple line in the individual cross section indicates the regression line. The red crosses that are superimposed on the dots highlight the four prefectures in Tables 2 and 3.
# As has been seen in Figure 3A, there are four prefectures that meet the requirement: 0.99 < |r| and dU < d. The geographic data of the four prefectures are listed in Table 2. Figure 6A plots the rank dependence of the areas (km2) of municipalities on the main land in the Metropolis of Tokyo. The purple declining line indicates the optimized fit (|r| = 0.9961 with d = 1.861 > dU for q = 0.21 and n = 53). As is found in Figures 3B,C, the prefecture shows minimum in the scaling exponent. The entire Metropolis includes nine outlying municipalities on islets in the Pacific Ocean [46]. Analysis of the extended region (n = 62) has yielded the optimal solution: (q, |r|, d) = (0.44, 0.9936, 1.267); d < dU (= 1.46), which is consistent with our expectations that expanding territories give rise to the reduction of competitions.
TABLE 2
| Prefecture | Population | Area (km2) | Density (km–2) |
| Tokyo | 14,064,696 | 2,194.03 | 6,410.44 |
| Fukuoka | 5,138,891 | 4,986.51 | 1,030.56 |
| Hiroshima | 2,801,388 | 8,479.65 | 330.37 |
| Shimane | 671,602 | 6,077.89 | 100.12 |
Demographic and geographic data of the Metropolis of Tokyo, Fukuoka, Hiroshima, and Shimane Prefectures.
FIGURE 6

(A) Rank dependence of the areas (km2) of municipalities in the Metropolis of Tokyo. The purple declining line indicates the optimized fit (|r| = 0.9961 with d = 1.861 for q = 0.21 and n = 53). (B) Rank dependence of the areas (km2) of municipalities in Fukuoka Prefecture. The purple declining line indicates the optimized fit (|r| = 0.9942 with d = 1.493 for q = 0.53 and n = 60).
# Figure 6B plots the rank dependence of the areas (km2) of municipalities in Fukuoka Prefecture. The purple declining line indicates the optimized fit (|r| = 0.9942 with d = 1.493 > dU for q = 0.53 and n = 60). In both plots (Figures 6A,B) the dots are found to be hierarchically clustered along the regression line, the feature of which will be reviewed in performing a modeling. It has been found empirically that without the hierarchy the positive correlation arises in the alignment of dots, which results in d < dU. Note again that in the rank-size analysis the serial correlation analysis is indispensable. In summary, along with the other two prefectures (Hiroshima and Shimane Prefectures) the numerical results are given in Table 3.
TABLE 3
| Prefecture | n | q | |r| | d | dU |
| Tokyo | 53 | 0.21 | 0.9961 | 1.861 | 1.42 |
| Fukuoka | 60 | 0.53 | 0.9942 | 1.493 | 1.45 |
| Hiroshima | 23 | 1.27 | 0.9922 | 1.233 | 1.19 |
| Shimane | 19 | 2.04 | 0.9908 | 1.786 | 1.13 |
Comparison of optimal solutions (q, |r|, d) for the four prefectures in Table 2.
Discussion
Constructing a Toy Model
Along with data on Tables 2, 3, the results of Figure 6 suggest that municipalities in a prefecture are in intense competition for the extension of their areas, which might remind one inevitably of the tournament game in sports. Indeed, in recent years sports games have become one of the fascinating topics in applied statistical physics [40, 47–51]. As a specific sport, here we consider a virtual rugby with 64 teams competing on the tournament diagram as depicted in Figure 7A. Because the sport is chosen solely as an easy example for finding an analogy to the territory expansion, one may arbitrarily replace this with another such as basketball, bowling, cricket, soccer, or cycle race. For the entire team, according to a Monte Carlo procedure, wins and losses of each game are determined stochastically by the use of two-digit random numbers. After the 62 games being finished the cumulative scores of the 64 teams are recorded. Subsequently, to enhance the success-breeds-success effect the scores are modified by calculating the (1/q)-th power of them. For instance, for a team (assuming team #i) that has survived till the final, the modified cumulative score, Si, can be written aswhile for a team (assuming team #k) that has lost in the first round, the counterpart, Sk, can be given as
FIGURE 7

Final results of an artificial rugby with 64 teams. (A) Tournament diagram. (B) Rank dependence of the q-th power of cumulative score. The purple declining line indicates the optimized fit (|r| = 0.9963 with d = 1.477 for n = 57, with 7 ties being included). The ties are processed according to a standard procedure.
Here sij represents the score for team i (i = 1–64) at round j (j = 1–6). Consequently a non-square 64 × 6 matrix is generated. In comparison of the two teams in the scores it is apparent that for 0 < q < 1 the team (team #i) that has survived the final gains far greater advantage than the one (team #k) that has lost in the first round. Note that in the context of economics the effect due to a positive feedback mechanism is equivalent to the so-called rich-get-richer effect, and in the context of sociology it corresponds to the Mathew effect [51–55]. Besides, our model could be consistent with the one that was once portrayed by Calderón (1847–94), who modeled society as a thermodynamic machine [56]. There the temperature gradient was represented by the gap between rich and poor.
Figure 7B shows a typical example of the rank dependence of the q-th power of cumulative scores of the entire team for a tournament using a sequence of two-digit random numbers. The purple declining line indicates the optimized fit (|r| = 0.9963 with d = 1.477 > dU with n = 57; n < 64 because of 7 ties being included). In the plots the relation of Eq. 1 is found to be reproduced.
In recent years, efforts have been made to establish an analytical methodology for deriving stationary distributions of complex systems with unidirectional random growth with resetting [57–59]. To date the method using master equations has succeeded in finding extensive applications such as degree distributions in networks [60, 61], distributions in citations [62], and income distributions [63, 64]. It seems, however, that the possibility of application of the analytical approach to our case remains pending, because the highly complex morphologies (Figures 2B,C) in the present system have been organized through a long-term blend of spontaneousness and intermittent stimulations by the administration. Moreover, even if the unidirectional requirement can be met, the interference based on an administrative law might be capricious, sporadic, and far from periodic.
Analyzing History of the Metropolis of Tokyo
To examine the formation of the complicated geometrical configuration we consider the history of the Metropolis of Tokyo. Computed results from 1955 to 2005 are given in Table 4. Here dL denotes the lower critical value in the Durbin-Watson d statistics [28]; note that with d < dL the null hypothesis is unconditionally rejected (α = 0.01). It can be seen that the two parameters, |r| and d, increase constantly over the entire period. It should be noted here that the prefecture (the Metropolis of Tokyo) is a very rare exception in the entire Japanese prefecture, because of the absence of large-scale municipal consolidations [37].
TABLE 4
| Year | n | q | |r| | d | dL | dU |
| 1955 | 62 | 0.12 | 0.9937 | 0.828 | 1.39 | 1.46 |
| 1975 | 55 | 0.18 | 0.9947 | 1.428 | 1.36 | 1.43 |
| 1990 | 55 | 0.21 | 0.9951 | 1.454 | 1.36 | 1.43 |
| 2005 | 53 | 0.21 | 0.9960 | 1.863 | 1.34 | 1.42 |
History of the metropolis of Tokyo.
Examining Effects Due to Global Warming: A Stability Analysis
Not to mention islets in oceans, a number of cities on the globe are now confronting a sign of the inundation crisis due to global warming [65–68]. As is well known, the Japanese Islands (see Figure 2A) are surrounded by the four seas: the Sea of Okhotsk, Pacific Ocean, East China Sea, and Japan Sea, indicating that along with Dhaka, Jakarta, and Miami, coastal megacities in Japan are far from exceptional in the susceptibility to the forthcoming aqua-disaster caused by the climate crisis [69]. Figure 8 shows the dependence of optimal parameters on the inundated rate on the supposition that effects due to global warming will get more and more inevitable in the future. In the Metropolis of Tokyo and Fukuoka Prefecture, respectively, there are 6 and 14 municipalities that are located along the coast. Here it is assumed that these are uniformly inundated. It is surprising to note that both the scaling exponent (Figure 8A) and the degree of fit (Figure 8B) preserve stabilities against the large-scale perturbation. The results of the Durbin-Watson ratio (Figure 8C), however, exhibit a sharp contrast. Namely, for the Metropolis of Tokyo the value of d experiences a substantial reduction with increasing the inundated rate, whereas for Fukuoka Prefecture a phase transition occurs just in front of the 50% inundation, and the new phase is maintained to the complete inundation. Note that for the Metropolis of Tokyo the phase transition that occurs just in front of the complete inundation is due to the simultaneous vanishment of the 6 coastal cities (i.e., n = 53 → n = 47).
FIGURE 8

Dependence of optimal parameters on the inundated rate on the supposition that effects due to global warming will get more and more inevitable in the future. (A) Scaling exponent. (B) Degree of fit. (C) Durbin-Watson ratio. The horizontal bar shows d = dU.
Testing Stretched Exponentiality
For the value of q much smaller than unity, Eq. 1 becomes compatible with its dual counterpart
Here, for 0 < q < 1 the exponential decay is stretched along the x axis. The qualitative difference from Eq. 1 is seen in the appearance of a rank that characterizes the decay along the axis,where e is the Napier’s constant.
Figure 9 shows the stretched exponentiality for the Metropolis of Tokyo (n = 53). Here we note that there are two solutions: A) Mode #1 (q = 0.09; |r| = 0.9948 with d = 2.002), and B) Mode #2 (q = 0.23; |r| = 0.9953 with d = 2.046). The reason why the bimodal solutions are possible can be explained as follows: because the dependence of d against q exhibits a convex curve, there exists a single maximum, assuming here (q0, d0). If d0 exceeds 2, the curve crosses the q axis twice (assuming qL and qU) across the center q = q0 (i.e., qL < q0 < qU). Namely, at q = q0
FIGURE 9

Stretched exponentiality for the Metropolis of Tokyo (n = 53). (A) Mode #1 (q = 0.09; |r| = 0.9948 with d = 2.002). (B) Mode #2 (q = 0.23; |r| = 0.9953 with d = 2.046).
Hence one obtains two solutions: (qL, 2) and (qU, 2), for which all the blue dots in Figure 9 are randomly distributed on the regression line (log y versus xq). Along with the characteristic rank ρ, comparison of the two stretched exponential modes is given in Table 5.
TABLE 5
| Mode | q | |r| | d | |
|---|---|---|---|---|
| #1 | 0.09 | 0.9948 | 2.002 | 1.0 × 10⁻¹⁰ |
| #2 | 0.23 | 0.9953 | 2.046 | 3.5 × 10⁻² |
Comparison of two stretched exponential modes for the Metropolis of Tokyo (n = 53).
Testing Power Law
To comprehend the link with the power law (i.e., log-log) relation [70], with the use of the Box-Cox transformation [71], Eq. 1 will be rewritten as
In the derivation of Eq. 9 the formulahas been implied, where ln q (y) = – (1 – y1–q)/(1 – q) [72].
In Figure 10 the log-log plot is given for rank dependence of the areas of municipalities in the Metropolis of Tokyo (n = 53). The purple declining line indicates the optimized fit (|r| = 0.9912 with d = 0.792 < dL = 1.34). Because the Durbin-Watson ratio is much smaller than the lower critical value dL, it is judged that the resemblance to Figure 6A is solely apparent and therefore the pseudo-power law is far from authentic.
FIGURE 10

Log-log plot for rank dependence of the areas of municipalities in the Metropolis of Tokyo (n = 53). The purple declining line indicates the optimized fit (|r| = 0.9912 with d = 0.792 < dL).
Conclusion
As the first step for revealing potential rules inherent in cities, towns, and villages that are closely squeezed in a sectioned domain, municipalities in the entire prefecture in Japan have been considered and their highly squeezed distributions of the areas have been analyzed according to a rank-size procedure. Through computed results it has been confirmed that among the population, area, and population density, the last becomes the most important factor in finding the rank-size rule. Indeed, of the 47 Japanese prefectures the Metropolis of Tokyo exhibits the exceptionally high density. The remark can be supported by the model using a tournament game, where teams (municipalities) are highly competitive for gaining the final wins (broadest territory). Finally, the study of this paper remains open. To seek all over the world for prefectures (including their analogs) bearing the authentic power law, international co-operations are needed. The most likely candidates are the ones with population densities comparable to or higher than the one of Tokyo Metropolis. If on the globe there is no prefecture that passes the statistical testing, the proposition on the interrogative subtitle of this paper will be truly turned down.
Statements
Data availability statement
The raw data supporting the conclusions of this article will be made available by the authors, without undue reservation.
Author contributions
The author confirms being the sole contributor of this work and has approved it for publication.
Conflict of interest
The author declares that the research was conducted in the absence of any commercial or financial relationships that could be construed as a potential conflict of interest.
Publisher’s note
All claims expressed in this article are solely those of the authors and do not necessarily represent those of their affiliated organizations, or those of the publisher, the editors, and the reviewers. Any product that may be evaluated in this article, or claim that may be made by its manufacturer, is not guaranteed or endorsed by the publisher.
References
1.
BerryBJLOkulicz-KozarynA. The City Size Distribution Debate: Resolution for US Urban Regions and Megalopolitan Areas. Cities (2012) 29:S17–S23. 10.1016/j.cities.2011.11.007
2.
BattyM. The New Science of Cities. Cambridge, MA: MIT Press (2013).
3.
BarthelemyM. The Structure and Dynamics of Cities. Cambridge: Cambridge University Press (2016).
4.
BlankASolomonS. Power Laws in Cities Population, Financial Markets and Internet Sites (Scaling in Systems with a Variable Number of Components). Physica A: Stat Mech its Appl (2000) 287:279–88. 10.1016/s0378-4371(00)00464-7
5.
HayataK. Statistical Properties of Extremely Squeezed Configurations: a Feature in Common between Squared Squares and Neighboring Cities. J Phys Soc Jpn (2003) 72:2114–7. 10.1143/jpsj.72.2114
6.
SemboloniFLeyvrazF. Size and Resources Driven Migration Resulting in a Power-Law Distribution of Cities. Physica A: Stat Mech its Appl (2005) 352:612–28. 10.1016/j.physa.2004.12.066
7.
MouraNJJrRibeiroMB. Zipf Law for Brazilian Cities. Physica A: Stat Mech its Appl (2006) 367:441–8. 10.1016/j.physa.2005.11.038
8.
DeckerEHKerkhoffAJMosesME. Global Patterns of City Size Distributions and Their Fundamental Drivers. PLoS ONE (2007) 2:e934. 10.1371/journal.pone.0000934
9.
BenguiguiLBlumenfeld-LieberthalE. A Dynamic Model for City Size Distribution beyond Zipf's Law. Physica A: Stat Mech its Appl (2007) 384:613–27. 10.1016/j.physa.2007.05.059
10.
CourtatTGloaguenCDouadyS. Mathematics and Morphogenesis of Cities: a Geometrical Approach. Phys Rev E Stat Nonlin Soft Matter Phys (2011) 83:036106. 10.1103/PhysRevE.83.036106
11.
MalevergneYPisarenkoVSornetteD. Testing the Pareto against the Lognormal Distributions with the Uniformly Most Powerful Unbiased Test Applied to the Distribution of Cities. Phys Rev E Stat Nonlin Soft Matter Phys (2011) 83:036111. 10.1103/PhysRevE.83.036111
12.
LucksteadJDevadossS. A Comparison of City Size Distributions for China and India from 1950 to 2010. Econ Lett (2014) 124:290–5. 10.1016/j.econlet.2014.06.002
13.
GhoshAChatterjeeAChakrabartiASChakrabartiBK. Zipf's Law in City Size from a Resource Utilization Model. Phys Rev E Stat Nonlin Soft Matter Phys (2014) 90:042815. 10.1103/PhysRevE.90.042815
14.
DevadossSLucksteadJDanforthDAkhundjanovS. The Power Law Distribution for Lower Tail Cities in India. Physica A: Stat Mech its Appl (2016) 442:193–6. 10.1016/j.physa.2015.09.016
15.
ChenY. The Evolution of Zipf’s Law Indicative of City Development. Physica A: Stat Mech its Appl (2016) 443:555–67. 10.1016/j.physa.2015.09.083
16.
LucksteadJDevadossS. Pareto Tails and Lognormal Body of US Cities Size Distribution. Physica A: Stat Mech its Appl (2017) 465:573–8. 10.1016/j.physa.2016.08.061
17.
LucksteadJDevadossSDanforthD. The Size Distributions of All Indian Cities. Physica A: Stat Mech its Appl (2017) 474:237–49. 10.1016/j.physa.2017.01.065
18.
ArshadSHuSAshrafBN. Zipf’s Law and City Size Distribution: a Survey of the Literature and Future Research Agenda. Physica A: Stat Mech its Appl (2018) 492:75–92. 10.1016/j.physa.2017.10.005
19.
ArshadSHuSAshrafBN. Zipf’s Law, the Coherence of the Urban System and City Size Distribution: Evidence from Pakistan. Physica A: Stat Mech its Appl (2019) 513:87–103. 10.1016/j.physa.2018.08.065
20.
GhoshABasuB. Universal City-Size Distributions Through Rank Ordering. Physica A: Stat Mech its Appl (2019) 528:121094. 10.1016/j.physa.2019.121094
21.
NettoVMMeirellesJRibeiroFL. Social Interaction and the City: the Effect of Space on the Reduction of Entropy. Complexity (2017) 2017:6182503. 10.1155/2017/6182503
22.
NettoVBrigattiEMeirellesJRibeiroFPaceBCacholasCet alCities, from Information to Interaction. Entropy (2018) 20:834. 10.3390/e20110834
23.
RibeiroFLMeirellesJNettoVMNetoCRBaronchelliA. On the Relation between Transversal and Longitudinal Scaling in Cities. PLoS ONE (2020) 15:e0233003. 10.1371/journal.pone.0233003
24.
MeirellesJRibeiroFLCuryGBinderCRNettoVM. More from Less? Environmental Rebound Effects of City Size. Sustainability (2021) 13:4028. 10.3390/su13074028
25.
FedericoPJ. Squaring Rectangles and Squares. In: BondyJAMurtyUSR, editors. Graph Theory and Related Topics. New York, NY: Academic Press (1979). p. 173–96.
26.
DuijvestijnAJW. Simple Perfect Squared Square of Lowest Order. J Comb Theor Ser B (1978) 25:240–3. 10.1016/0095-8956(78)90041-2
27.
WellsD. The Penguin Dictionary of Curious and Interesting Geometry. Harmondsworth, Middlesex, England: Penguin Books (1991).
28.
ChatterjeeSHadiAS. Regression Analysis by Example. 5th ed. Hoboken, NJ: Wiley (2012).
29.
FlackHDVincentMGVincentJA. Testing for Serial Correlation in Intensity Data. Acta Cryst Sect A (1980) 36:495–6. 10.1107/s0567739480001040
30.
BernardinelliGFlackHD. Least-Squares Absolute-Structure Refinement. Practical Experience and Ancillary Calculations. Acta Cryst Sect A (1985) 41:500–11. 10.1107/s0108767385001064
31.
HillRJMadsenIC. The Effect of Profile Step Width on the Determination of Crystal Structure Parameters and Estimated Standard Deviations by X-ray Rietveld Analysis. J Appl Cryst (1986) 19:10–8. 10.1107/s0021889886090076
32.
HillRJFlackHD. The Use of the Durbin-Watson d statistic in Rietveld Analysis. J Appl Cryst (1987) 20:356–61. 10.1107/s0021889887086485
33.
ConcasGCongiuFMuntoniCBettinelliMSpeghiniA. Hyperfine Interactions at Europium Sites in Oxide Glasses. Phys Rev B (1996) 53:6197–202. 10.1103/physrevb.53.6197
34.
MesicVMuratovicH. Identifying Predictors of Physics Item Difficulty: a Linear Regression Approach. Phys Rev Spec Top Phys Educ Res (2011) 7:010110. 10.1103/physrevstper.7.010110
35.
KanterIKesslerDA. Markov Processes: Linguistics and Zipf's Law. Phys Rev Lett (1995) 74:4559–62. 10.1103/physrevlett.74.4559
36.
YangAC-CHseuS-SYienH-WGoldbergerALPengC-K. Linguistic Analysis of the Human Heartbeat Using Frequency and Rank Order Statistics. Phys Rev Lett (2003) 90:108103. 10.1103/physrevlett.90.108103
37.
HayataK. A Time-Dependent Statistical Analysis of the Large-Scale Municipal Consolidation. Forma (2010) 25:37–44.
38.
Alvarez-MartinezRMartinez-MeklerGCochoG. Order-Disorder Transition in Conflicting Dynamics Leading to Rank-Frequency Generalized Beta Distributions. Physica A: Stat Mech its Appl (2011) 390:120–30. 10.1016/j.physa.2010.07.037
39.
BlummNGhoshalGForróZSchichMBianconiGBouchaudJ-Pet alDynamics of Ranking Processes in Complex Systems. Phys Rev Lett (2012) 109:128701. 10.1103/physrevlett.109.128701
40.
AusloosM. Hint of a Universal Law for the Financial Gains of Competitive Sport Teams. The Case of Tour de France Cycle Race. Front Phys (2017) 5:59. 10.3389/fphy.2017.00059
41.
HayataK. Phonological Complexity in the Japanese Short Poetry: Coexistence between Nearest-Neighbor Correlations and Far-Reaching Anticorrelations. Front Phys (2018) 6:31. 10.3389/fphy.2018.00031
42.
MoralesJAColmanESánchezSSánchez-PuigFPinedaCIñiguezGet alRank Dynamics of Word Usage at Multiple Scales. Front Phys (2018) 6:45. 10.3389/fphy.2018.00045
43.
MehriAAgahiHMehri-DehnaviH. A Novel Word Ranking Method Based on Distorted Entropy. Physica A: Stat Mech its Appl (2019) 521:484–92. 10.1016/j.physa.2019.01.080
44.
LejaeghereKCottenierSVan SpeybroeckV. Ranking the Stars: a Refined Pareto Approach to Computational Materials Design. Phys Rev Lett (2013) 111:075501. 10.1103/PhysRevLett.111.075501
45.
KimKLiTGFLoRKLSachdevSYuenRSH. Ranking Candidate Signals with Machine Learning in Low-Latency Searches for Gravitational Waves from Compact Binary Mergers. Phys Rev D (2020) 101:083006. 10.1103/physrevd.101.083006
46.
Tsuneta Yano Commemorative Association. In: Kensei: The Data Book for the 47 Prefectures in Japan. Tokyo: Tsuneta Yano Commemorative Association (2017).
47.
YaariGEisenmannS. The Hot (Invisible?) Hand: Can Time Sequence Patterns of Success/Failure in Sports Be Modeled as Repeated Random Independent Trials?PLoS ONE (2011) 6:e24532. 10.1371/journal.pone.0024532
48.
YaariGDavidG. “Hot Hand” on Strike: Bowling Data Indicates Correlation to Recent Past Results, Not Causality. PLoS ONE (2012) 7:e30112. 10.1371/journal.pone.0030112
49.
RibeiroHVMukherjeeSZengXH. Anomalous Diffusion and Long-Range Correlations in the Score Evolution of the Game of Cricket. Phys Rev E Stat Nonlin Soft Matter Phys (2012) 86:022102. 10.1103/PhysRevE.86.022102
50.
da SilvaRVainsteinMHGonçalvesSPaulaFS. Anomalous Diffusion in the Evolution of Soccer Championship Scores: Real Data, Mean-Field Analysis, and an Agent-Based Model. Phys Rev E Stat Nonlin Soft Matter Phys (2013) 88:022136. 10.1103/PhysRevE.88.022136
51.
van de RijtAKangSMRestivoMPatilA. Field Experiments of Success-Breeds-Success Dynamics. Proc Natl Acad Sci (2014) 111:6934–9. 10.1073/pnas.1316836111
52.
MertonRK. The Matthew Effect in Science. Science (1968) 159:56–63. 10.1126/science.159.3810.56
53.
PriceDDS. A General Theory of Bibliometric and Other Cumulative Advantage Processes. J Am Soc Inf Sci (1976) 27:292–306. 10.1002/asi.4630270505
54.
BarabásiA-LAlbertR. Emergence of Scaling in Random Networks. Science (1999) 286:509–12. 10.1126/science.286.5439.509
55.
ÉrdiP. Ranking. New York, NY: Oxford University Press (2020).
56.
Pohl-ValeroS. The Circulation of Energy: Thermodynamics, National Culture and Social Progress in Spain, 1868-1890. In: PapanelopoulouFNieto-GalanAPerdigueroE, editors. Popularizing Science and Technology in the European Periphery, 1800-2000. London: Routledge (2016). p. 115–34.
57.
BiróTSNédaZ. Dynamical Stationarity as a Result of Sustained Random Growth. Phys Rev E (2017) 95:032130. 10.1103/physreve.95.032130
58.
BiróTSNédaZ. Unidirectional Random Growth with Resetting. Physica A (2018) 499:335–61. 10.1016/j.physa.2018.02.078
59.
BiróTSCsillagLNédaZ. Transient Dynamics in the Random Growth and Reset Model. Entropy (2021) 23:306. 10.3390/e23030306
60.
JeongHNédaZBarabásiAL. Measuring Preferential Attachment in Evolving Networks. Europhys Lett (2003) 61:567–72. 10.1209/epl/i2003-00166-9
61.
DerzsiADerzsyNKáptalanENédaZ. Topology of the ERASMUS Student Mobility Network. Physica A: Stat Mech its Appl (2011) 390:2601–10. 10.1016/j.physa.2011.02.041
62.
NédaZVargaLBiróTS. Science and Facebook: the Same Popularity Law. PLoS ONE (2017) 12:e0179656. 10.1371/journal.pone.0179656
63.
HegyiGNédaZAugusta SantosM. Wealth Distribution and Preto’s Law in the Hungarian Medieval Society. Physica A: Stat Mech its Appl (2007) 380:271–7. 10.1016/j.physa.2007.02.094
64.
DerzsyNNédaZSantosMA. Income Distribution Patterns from a Complete Social Security Database. Physica A: Stat Mech its Appl (2012) 391:5611–9. 10.1016/j.physa.2012.06.027
65.
WeartSR. The Discovery of Global Warming. Cambridge, MA: Harvard University Press (2008).
66.
StockerTFQinDPlattnerG-KTignorMMBAllenSKBoschungJet al editors. Climate Change 2013: The Physical Science Basis (Working Group I Contribution to the Fifth Assessment Report of the Intergovernmental Panel on Climate Change). Cambridge: Cambridge University Press (2014).
67.
BergerJJ. Climate Peril. Berkeley, CA: Northbrae (2014).
68.
WadhamsP. A Farewell to Ice: A Report from the Arctic. London: Penguin Books (2016).
69.
HayataK. Global-Scale Synchronization in the Meteorological Data: A Vectorial Analysis That Includes Higher-Order Differences. Climate (2020) 8:128. 10.3390/cli8110128
70.
KumamotoS-IKamihigashiT. Power Laws in Stochastic Processes for Social Phenomena: an Introductory Review. Front Phys (2018) 6:20. 10.3389/fphy.2018.00020
71.
VélezJICorreaJCMarmolejo-RamosF. A New Approach to the Box-Cox Transformation. Front Appl Math Stat (2015) 1:12. 10.3389/fams.2015.00012
72.
TsallisC. Possible Generalization of Boltzmann-Gibbs Statistics. J Stat Phys (1988) 52:479–87. 10.1007/bf01016429
Summary
Keywords
rank-size rule, power law, territorial extension, Durbin-Watson d statistics, stretched exponentiality, squared squares, global warming
Citation
Hayata K (2022) Birth, Annexation, and Squeezing of Cities in a Prefecture: Can the Ranking of Competitive Areas of Municipalities Obey the Authentic Power Law?. Front. Phys. 9:789571. doi: 10.3389/fphy.2021.789571
Received
05 October 2021
Accepted
28 December 2021
Published
08 February 2022
Volume
9 - 2021
Edited by
Fabiano Lemes Ribeiro, Universidade Federal de Lavras, Brazil
Reviewed by
Camilo Rodrigues Neto, University of São Paulo, Brazil
Ali Mehri, Babol Noshirvani University of Technology, Iran
Updates
Copyright
© 2022 Hayata.
This is an open-access article distributed under the terms of the Creative Commons Attribution License (CC BY). The use, distribution or reproduction in other forums is permitted, provided the original author(s) and the copyright owner(s) are credited and that the original publication in this journal is cited, in accordance with accepted academic practice. No use, distribution or reproduction is permitted which does not comply with these terms.
*Correspondence: Kazuya Hayata, hayata@sgu.ac.jp
This article was submitted to Social Physics, a section of the journal Frontiers in Physics
Disclaimer
All claims expressed in this article are solely those of the authors and do not necessarily represent those of their affiliated organizations, or those of the publisher, the editors and the reviewers. Any product that may be evaluated in this article or claim that may be made by its manufacturer is not guaranteed or endorsed by the publisher.