- 1School of Optics and Photonics, Beijing Institute of Technology, Beijing, China
- 2Key Laboratory of Photoelectronic Imaging Technology and System, Ministry of Education of People’s Republic of China, Beijing, China
- 3Key Laboratory of Photonics Information Technology, Ministry of Industry and Information Technology, Beijing, China
Optical lattices (OLs) with diverse transverse patterns and optical vortex lattices (OVLs) with special phase singularities have played important roles in the fields of atomic cooling, particle manipulation, quantum entanglement, and optical communication. As a matter of consensus until now, the OL patterns are generated by coherently superimposing multiple transverse modes with a fixed phase difference through the transverse mode locking (TML) effect. There are phase singularities in the dark area of this kind of OL pattern, so it is also called OVL pattern. However, in our research, it is found that some high-order complex symmetric OL patterns can hardly be analyzed by TML model. Instead, the analysis method of incoherent superposition of mode intensity could be applied. The OL pattern obtained by this method can be regarded as in non-TML state. Therefore, in this article, we mainly study the distinct characteristics and properties of OL patterns in TML and non-TML states. Through intensity comparison, interferometry, and beat frequency spectrum, we can effectively distinguish OL pattern in TML and non-TML states, which is of significance to explore the formation of laser transverse pattern possessing OL.
Introduction
Optical lattices (OLs) refer to the periodic potential well in the laser standing wave field [1, 2]. The spatial period of the potential well is the order of laser wavelength, making it available to capture, cool, and trap atoms in the potential well array [3, 4]. In 1990s, a two-dimensional OL pattern with spatiotemporal chaos was found in Na2 laser, whereas the time-averaged intensity was stable, wherein the transverse dynamics was ruled by the competition of two modes (each one of them possessing a cylindrical symmetry) [5]. Then, following the OL patterns generated in CO2 laser and theoretical speculations on spontaneous symmetry breaking phenomena, it was pointed out that the spatiotemporal behavior of a laser in the low-dimensional regimen crucially depends on symmetries and that most of the dynamic features can be directly captured as consequences of spontaneous symmetry breaking mechanism [6, 7]. For the high-dimensional case, patterns in a CO2 laser with a large Fresnel number are characterized by a high degree of complexity and by the absence of zeroes in the intensity profile [8, 9]. In addition, in the research of OL pattern generated in a Na2 laser, the phase singularities similar to that studied in hydrodynamics [10] were found, which possesses the same properties as the optical vortex discovered by Coullet et al in 1989 [11], thus naming this kind of OL with special phase singularities as optical vortex lattice (OVL). The transverse patterns with special phase singularities were then found to be generated in vertical-cavity-surface–emitting lasers (VCSELs) [12]. Here, the generated low-order OVL is experimentally interfered with the plane wave. It is found that there were bifurcation fringes in the dark region, which reveals the existence of phase singularities. Subsequently, the high-order OVL was found in microchip laser with large Fresnel number by Chen and Lan [13, 14]. And it is pointed out that with the inherent nonlinear properties of laser cavity, multiple transverse modes can be spontaneously locked, so as to generate high-order vortex lattice. The further generation laws of OVL are summarized in Refs. [15–17]; that is, by actively selective pumping and gain distribution such as adjusting the pump power, pump distance, and the size of pump spot on the gain crystal, the OVL patterns from low order to high order could be generated and switched. Optical lattices with special transverse distribution play an important part in atomic cooling and trapping [18–20], whereas the OVLs with unique phase singularity have also broadened the applications in particle manipulation [21–25], quantum entanglement [26], and optical communications [27–29].
The exploration of the essence of transverse pattern formation of OL can be traced back to 1970s. By simplifying the laser equations for the class A case to the complex Ginzburg–Landau (CGL) equation, the relationship between superfluid and laser dynamics was established. In view of this common theoretical description, it was expected that the dynamics of pattern formation in lasers and the dynamics of superfluid would show identical features [30]. Later, the generation and spatial stability of special laser transverse patterns were analyzed through Maxwell–Bloch (MB) equations [31, 32]. Moreover, the vortex solution was solved through MB equations [11], which could be applied in the formation of OVL. Subsequently, with the derivation of laser Ginzburg–Landau equations in class A lasers [33] and complex Swift–Hohenberg (CSH) equations in class B lasers [34], vortex solutions could also be obtained, thus generating OVL. It is worth noting that the numerical analytical solutions of these spatiotemporal multivariate nonlinear partial differential equations need to allocate complex parameters in the actual laser system. Therefore, the method to analyze the output OL patterns by superposition of some laser modes (such as Hermite–Gaussian [HG], Laguerre–Gaussian [LG], and Ince–Gaussian [IG] modes) is proposed [16, 17, 35–38]. There are two main types of superposition analysis methods. The first is to analyze the output OL pattern through the superposition of intensities of composed modes alone. It is pointed that in multi–transverse-mode lasers, the coupling between transverse modes occurs through their intensity rather than their field amplitude, and these modes are arranged together according to the principle of “transverse hole burning” to maximize energy coexistence and minimize intensity distribution overlap [35]. The OL patterns though the first analysis method can be observed in CO2 laser, most of which are high-order symmetrical patterns [7, 8]. The second kind of analysis method involves the transverse mode locking (TML) effect [31], which includes frequency locking and phase locking. The output OL pattern is analyzed by superimposing the electric field of multiple modes with the locking phase. Moreover, with the assistance of the inherent nonlinearity of the laser cavity, the frequencies of the composed modes are pulled to the same value [12, 16, 17]. The second TML method is commonly used. Through this analysis method, the OL with both high order and low order, as well as symmetric and asymmetric patterns, could be obtained, which have a wide range of applications. In addition, it is found that there are phase singularities in the dark region of OL pattern analyzed by TML method [12, 16], which could also be called OVL patterns. In contrast, the OL patterns obtained by intensity superposition alone could be regarded as the OL pattern in non-TML state. Whether there are phase singularities in the OL pattern in non-TML state has not been specially studied. Although the experimental higher-order OL patterns similar to the analyzed OL patterns in non-TML state have been generated in VCSEL [12] and microchip lasers [13, 14], the existence of phase singularity has not been discussed in these researches. Interferometric observation of the phase singularity in OL is a common detection method, which introduces a reference beam to interfere with the measured beam [39, 40], or splits the measured beam to interfere with each other [41–44]. Then, the existence of the phase singularity could be determined by observing whether the interference fringes are misaligned. In recent years, most of the analyses of OL and OVL patterns are to correspond the numerically simulation by TML model and the experimentally measured patterns. Then, the consistence of intensity correspondence is used to analyze the properties of the generated OL patterns [17]. Furthermore, interference experiments are applied to analyze whether there are phase singularities in the dark area of the generated OL patterns [12, 16]. However, these analyses are all based on the premise that OL patterns are in TML state, whereas the properties of OL patterns in non-TML state are rarely studied in these years. In our study, OL patterns in TML state and non-TML state are both analyzed by mode superposition method, rather than by solving complex nonlinear equations. For the OL patterns in non-TML state through our method, we not only analyze the numerical transverse patterns obtained by solving equations, but also obtain the same high-order symmetrical patterns as the output of CO2 lasers [7, 8], microchip lasers [13, 14], and solid-state lasers [17, 45]. In addition, if the TML state is satisfied, strictly speaking, the frequency of the composed modes should be locked to the same value. Then, measuring the beat frequency spectrum of the output pattern could also be used as a method to assist in judging the properties of OL patterns.
Consequently, the aim of this article is threefold. First, we theoretically analyze the difference through intensity profile between OL in TML and non-TML states in a more complete and rigorous way. Numerical simulations reveal that the OL pattern intensity in TML state varies greatly with the locking phase, and there are both symmetrical and asymmetrical patterns. For OL in non-TML states, as only intensity superposition is performed, it has nothing to do with the relative phase of the composed modes, and the pattern is always symmetrical. For the two-mode composed patterns, some intensity distributions of OL in TML and non-TML states are the same. However, when the composition modes reach more than two, their patterns produced by the approaches of TML and non-TML superposition are totally different. Second, interferometry is applied to distinguish OL patterns in TML and non-TML states. For OL patterns in TML state, after interfering with a plane wave, it is shown that all dark zones possess interference bifurcation fringes, revealing the phase singularities. This is consistent with previous research results [12, 16]. Nevertheless, for the interference between OL in non-TML states and a plane wave, we find that some dark regions of the pattern possess interference bifurcations, but some do not. Moreover, the existence of their interference bifurcation is related to the phase of the composed modes. Third, a peculiar assistant method is proposed to judge the states in OL formation through the beat frequency spectra. For the various beat frequency spectra observed in the experiment, including null-component spectra, several-spike spectra, two-cluster spectra, and periodic spectra, we theoretically and experimentally correspond to each state including TML, non-TML, only-phase-locking, and prelocking states in OL formation. Therefore, through the three methods introduced in our article, namely, the intensity comparison, interferometry, and beat frequency spectrum, the OL in TML or non-TML states could be effectively distinguished, which is of great significance for the understanding of the essence of laser transverse pattern possessing OL.
Numerical Characterizations and Theories
Intensity of the OL Patterns
For theoretical analysis of OL generation, the traditional method is to numerically solve the nonlinear MB equations [31] and the CGL [33] and CSH [34] equations. As a result, numerical solutions could be obtained to describe OL and OVL patterns. However, for this set of space–time multivariate nonlinear partial differential equations, the solution process is cumbersome, and it is tough to assign various parameters to a specific laser system. Furthermore, another analysis method is proposed, which is to perform coherent superposition of HG, LG, or IG modes with different locking phases to fulfill the analysis and simulation [37]. By matching the result of the simulation with the actual output pattern, it can confirm whether the OL is in TML state or not, which is the previous judging method [12, 16, 17]. In most cases, this correspondence is unique and can be applied to determine the TML state. However, we found that for two-mode composed patterns in TML state with some locking phases, the beam pattern is similar to that of their non-TML state.
Then, we would like to present the TML theoretical models by coherent superposition of HG or LG modes with different locked phases. The expressions of HG and LG modes are as follows [37].
where the HG and LG modes are individually expressed with Cartesian coordinates and cylindrical coordinates.
For the perspective of the perfect TML state of OL, apart from the phase locking, the frequencies of the participating transverse modes are supposed to be locked to a common value to establish cooperative frequency locking [31]. It is available under the assistance of nonlinearity in class B lasers [34]. In this case, the TML progress can be expressed by the coherent superposition of HG or LG modes with a specific locking phase as follows.
Or
where
Afterward, if we perform the non-TML superposition of the intensity of HG and LG modes, we can obtain the total intensity by
Or
where
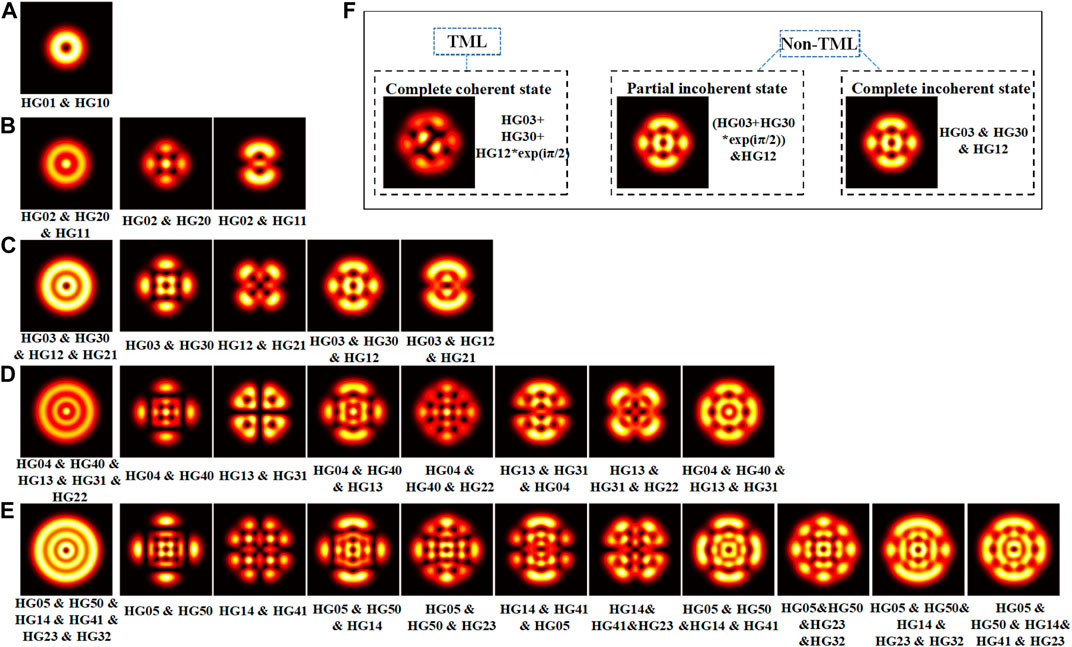
FIGURE 1. (A–E) Simulated beam patterns in non-TML state. (F) The complete coherent superposition belongs to TML state, whereas partial and complete incoherent superpositions are two special kinds of non-TML states. The symbol “+” indicates the coherent superposition between transverse modes, that is, the TML state, and the symbol “&” indicates the incoherent superposition between transverse modes, that is, the non-TML state.
In the first column of Figures 1A–E, it can be found that for OL pattern in non-TML state composed of total HG modes with the same order, the intensity of the pattern shows concentric-ring distribution. In addition, for OL pattern in non-TML state of partial HG modes with the same order, it can easily form patterns similar to that simulated by MB equations [31], as well as experimentally generated in CO2 laser [7, 8], microchip lasers [13, 14], and solid-state lasers [45–48]. Rows A–E, respectively, show the OL patterns in non-TML state composed of HG modes with Fresnel numbers from 2 to 6.
Next, we would like to show the intensity of OL patterns in TML state, which is obtained by coherent superposition between the transverse modes. Select one pattern in non-TML state from Figure 1, and use Eq. 3 to perform TML simulation with different locking phases by coherently superimposing the corresponding composed modes; the results can be obtained in Figure 2.
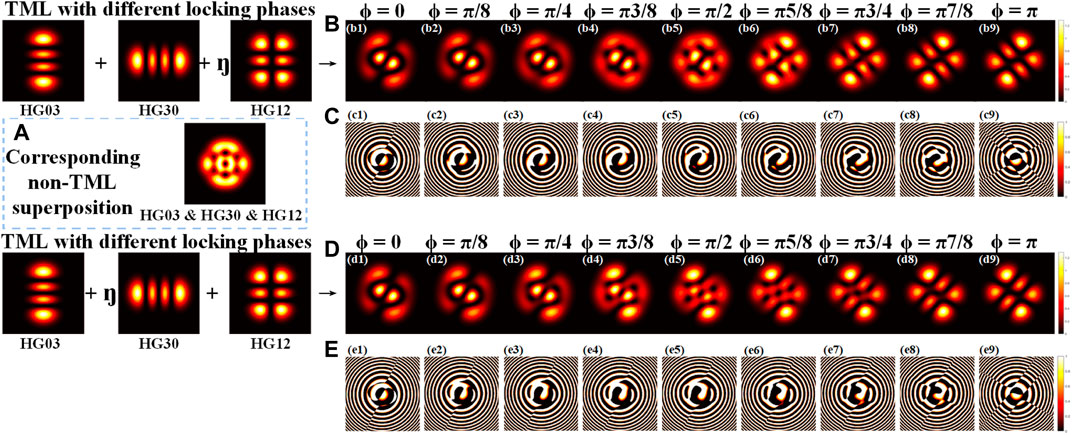
FIGURE 2. (B–E) Simulated beam patterns composed of HG03, HG30, and HG12 modes in TML states with different locking phases. (A) Corresponding pattern in non-TML state.
As shown in Figure 2, for the case of the combination of HG03, HG30, and HG12 modes, their pattern in non-TML state is a regular symmetrical pattern, whereas by conducting the composed modes to TML operations with different locking phases, it can be found that the obtained patterns are quite different with each other. In most cases, if the composition modes reach more than two, their patterns in TML and non-TML state are totally different, whereas for the two-mode composed pattern, simulation results based on Eqs 1–6 contrastively show the intensity of OL patterns in TML and non-TML state in Figure 3.
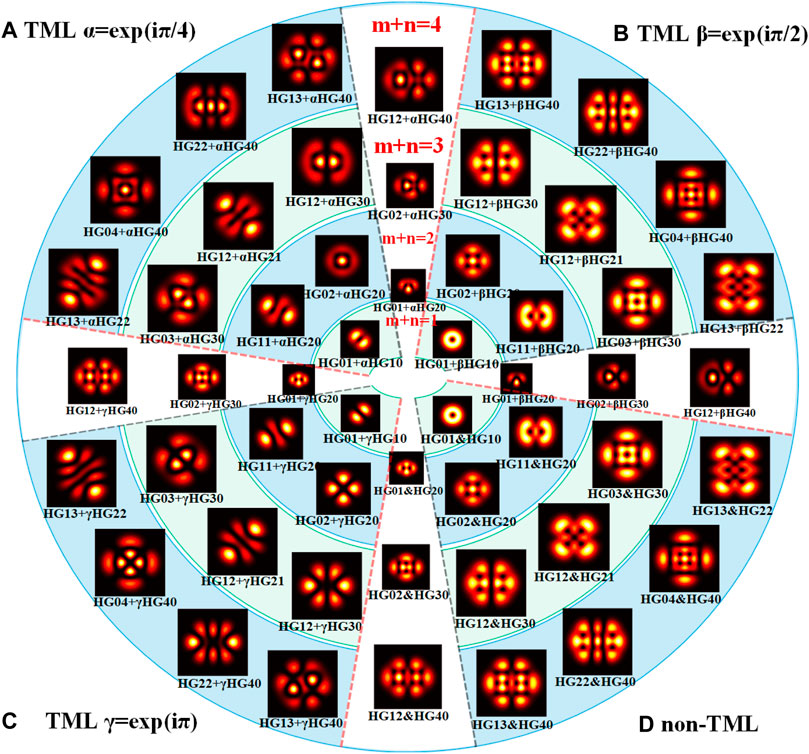
FIGURE 3. Simulated far field beam patterns in TML and non-TML states composed of two HG modes. (A–C) Patterns in TML state with locking phases of π/4, π/2, and π, respectively. (D) Patterns in non-TML state composed of corresponding HG modes.
As shown in Figures 3A–C, abundant beam patterns in TML states composed of only two HG eigenmodes are simulated with different locking phases. The patterns in the same ring of Figure 3 are composed of HG modes in the same order, whereas the orders of HG eigenmodes in different rings are different, with the values being 1 to 4 from the inner most ring (m + n = 1) to the outer most one (m + n = 4). The patterns located between two rings are composed of two HG eigenmodes with different but adjacent orders. α, β, and γ represent the phase items with locking phase of π/4, π/2, and π, respectively. Comparing Figures 3B,C with Figure 3D, it can be discovered that the patterns in TML state with locking phase of π/2 are basically the same as the corresponding patterns in non-TML state when the composed modes are in the same order, whereas in different orders, the patterns of two HG mode composed beams in non-TML state are the same as those in TML state with locking phase of π. Throughout the simulation results, we can find that for most cases, it is feasible to describe the formation of OL through the intensity distribution with the coherent superposition of HG modes in TML state. However, if the output light intensity can be characterized by TML and non-TML states simultaneously, it is tough to judge the exact state by the intensity distribution alone.
Interference Method to Distinguish OL Patterns
In this section, we show the difference between OL patterns in TML and non-TML states through interference method with a plane wave. The theoretical analysis of interference between OL pattern composed of HG modes in TML or non-TML state and a plane wave is investigated in Supplementary Appendix SA. Then, we can get the intensity of the interference result as follows:
where Eqs 7, 8 correspond to Eqs. A6, A7 in Supplementary Appendix SA, respectively. Comparing Eq. 8 with Eq. 7, we find that the interferences between plane wave and OL in the two states of TML and non-TML are both related to the phase item of the composed modes. However, Eq. 8 indicates that there are two last items related to the phase ϕ in the interference between plane wave and OL in TML state, whereas there is only one related phase item
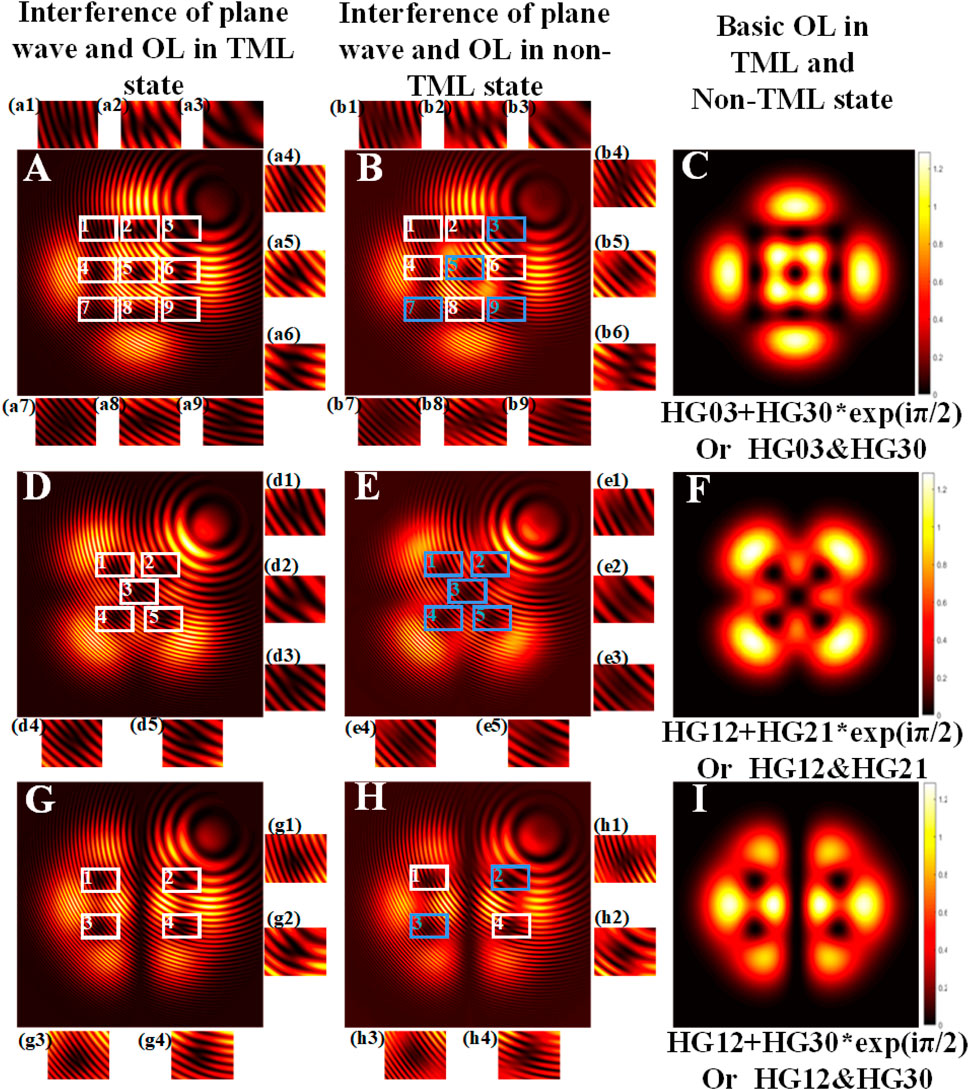
FIGURE 4. Simulated interference patterns between plane wave and OL in TML states (A), (C), and (G) and non-TML states (B), (E), and (H). (C), (F), and (I) are the corresponding OL patterns selected from Figure 3. The inserts show the enlarged area of the interference fringes.
As shown in Figure 4, although the OL pattern in TML and non-TML states may have same intensity distributions, their interference patterns with plane wave are different. The simulated interference results of the OL pattern in TML state with a plane wave show that there are bifurcations at all the dark regions [see Figure 4(a1)–(a9), (d1)–(d5), (g1)–(g4)]. In contrast, some dark regions of the interference pattern of OL in non-TML state with a plane wave do not have bifurcations, revealing no phase singularities there [see Figure 4(b3), (b7), (b9), (e1)–(e5), (h2), (h3)]. These are the main differences between OL patterns in TML and non-TML states through interference method. In addition, to further study the interference characteristic of the OL in non-TML state, we selected two beams from Figure 1 and performed the interference simulations. Different relative phases of the HG modes that comprise the OL pattern are also considered in the simulations. The results are depicted in Figure 5.
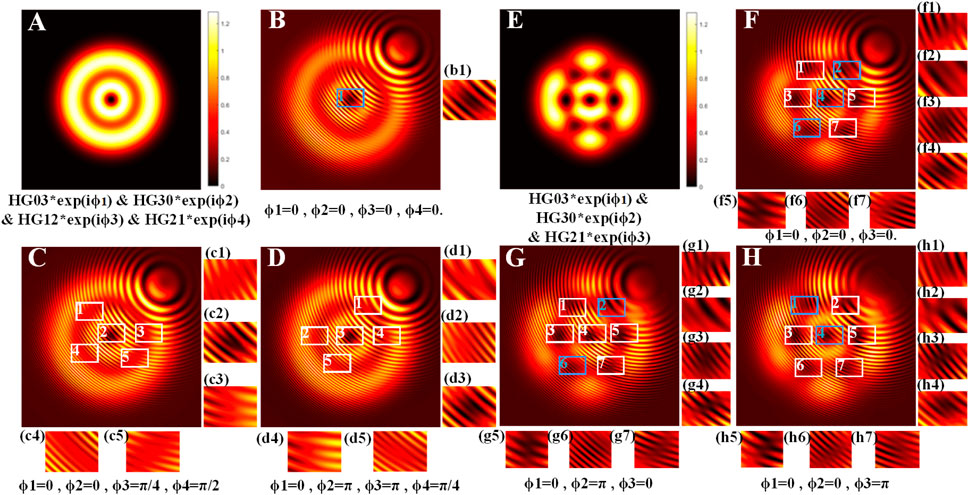
FIGURE 5. Simulated interference results in non-TML states with different phases. The inserts show the enlarged figures of the interference fringes.
It can be found from the previous discussion that the intensity distribution of OL in non-TML state is independent of the phase of combined modes. Therefore, the intensities of OL composed of HG modes with different locking phases before interference with the plane wave in Figures 5B–D,F–H are the same as those in Figures 5A,E, respectively. By comparing the interference patterns between wave plane and OL in non-TML state under different phases, we find that the interference bifurcations show new features. For example, the interference fringes in the case of Figure 5B show no obvious bifurcation, but only slight relative displacement between fringe and dark area center can be observed. In contrast, Figure 5(c1)–(c5), (d1)–(d5) shows clear interference bifurcation fringes. Similarly, in Figures 5F–H, there are no forked stripes in the dark area of the beam pattern, enlarged as Figure 5(f2), (f4), (f6), (g2), (g6), (h1), and (h4), whereas other dark areas possess interference bifurcations. Therefore, for the OL in non-TML state, although its beam intensity distribution is independent of the phase, the phase item of the composed modes still affects their interference patterns, which is consistent with Eq. A6 in Supplementary Appendix SA. This is different from the previous understanding that all dark areas have phase singularities [15, 16]. For beams with intensity distribution similar to OL, it may be a non-TML superposition state of several HG modes. In this case, although there is fringe bifurcation in the interference pattern, it still comes from the superposition of unlocked modes, so necessarily there is no vortex phase at this position. In fact, combining Figures 4, 5, it is seen that the dark zone of OL in TML state possesses phase singularity, whereas the existence and distribution of phase singularity of OL in non-TML state vary with the phases of composed HG modes.
Beat Frequency Spectra Method to Distinguish OL Patterns
In this section, we propose the method by observing the characteristic of beat frequency spectra, which could be applied to further distinguish OL in TML or non-TML state. First, for OL in TML state, it is assumed that frequencies of the transverse modes involved in the locking are pulled to the same value by the cooperative frequency locking effect with the aid of cavity nonlinearity [31]. As the frequencies are pulled to the same, it is obvious for no beat frequency components. Then, for the case of OL in non-TML state, the intensities of composed modes are superimposed, whereas their frequencies compete with each other, resulting in several-spike beat frequency spectra. Actually, in addition to the aforementioned TML and non-TML states, there are two other states of OL in actual multi–transverse-mode laser, which we call the only-phase-locking and prelocking states. The most common case we find is the only-phase-locking state. In this case, the intensity of OL pattern is stable, and the phase is locked, generally not π/2, whereas the frequencies of the composed modes are not completely locked at the same value, resulting in two-cluster spectra. The prelocking state corresponds to the periodic beat frequency spectra. It takes place when the frequency interval of the transverse modes involved in the locking is decreased close to the value meeting the cooperative locking frequency effect. The harmonic content of the mode-beat signal strongly increases if its frequency difference
where
Accordingly, after prelocking state, if the frequencies of the composed modes are pulled to the same value by cooperative frequency locking effect, this value would be the average of frequency weighted by the intensity of each mode, thus leading no beat frequency components and reaching TML state.
Experimental Setup and Results
In order to verify the above theory and simulation analysis, we carried out experimental verification based on microchip solid-state laser with large Fresnel number. The schematic diagram of experimental setup is shown in Figure 6. The designed microchip cavity for OVL generation is composed of a 0.4-mm-thick 1.0 at% doped Nd:YAG chip and a 1-mm-thick x-cut LiTO3 chip [52]. The cross-section dimensions of the chips are of 5 × 5 mm2. The two chips are stacked together to form the laser cavity, with 5% reflection coating at 1,064 nm on the surface of LiTO3 chip, and high transmission coating at 808 nm and high reflection coating at 1,064 nm on the surface of Nd:YAG chip. The microchip cavity is placed in a copper heat sink to transfer the generated heat. In addition, a 0.01°C temperature controller is applied on the copper heat sink to keep the cavity under stable thermal conditions. Besides, a fiber coupled 808-nm laser diode with maximum output power of 10 W is used as the pump source. Then, the pump beam delivered from the tail fiber with 100-μm core diameter is focused into the microchip cavity by a 1:1 free space optical coupler. The coupling system is fixed in the precise adjustment stage. Under a fixed pump power, OL can be switched by adjusting the pump angle Δθ. The beam profile of the pump beam at the beam waist is a super-Gaussian one close to a flattop [53]. A Mach–Zehnder interferometer is set up to observe the interference fringes of the laser beams. After passing through the beam splitter (BS) 1, the transmitted light is the generated OL pattern, whereas the reflected light becomes a plane wave after being modulated by the aperture diaphragm and lens, and the two beams interfere at BS2. If observing only the intensity distribution of the generated OL pattern, the obstacle board in the figure can be lowered to cover the plane wave. Afterward, the beam passed through BS2 is split into two beams by BS3. For the transmitted beam, the light intensity distribution can be observed on the CCD after the attenuation sheet. By contrast, the reflected beam can be directly detected by a photodetector to detect the beat frequency. No obvious difference was found on the spectra when the photodetector was shifted to measure the mode beat at different positions in a beam cross section. Furthermore, to ensure the RF range of beat frequency of the transverse modes in our setup, a 3-GHz bandwidth photodetector was also used to observe the mode beats of a quite complex series of transverse modes, showing that most of the mode-beat frequencies were located at the 0- to 500-MHz range. Consequently, a 400-MHz bandwidth is enough for all the modes discussed in this article. Last but not least, it should be noticed that the microchip cavity we used is quite thin with a longitudinal interval of about 50 GHz. As a result, it is available for a near-single longitudinal mode operation to prevent influence from the longitudinal modes. The whole experimental setup is shown in Figure 6, with a pump power of 5 W and the pump angle ranging from 0° to 10°, as well as the controlled temperature of 22°C.
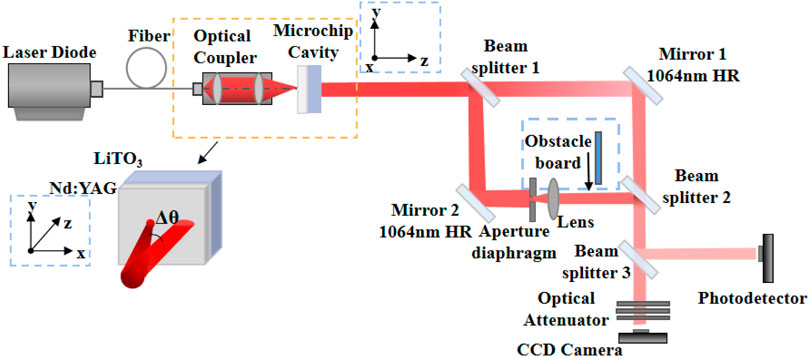
FIGURE 6. Schematic illustration of experimental arrangement used for OL generation and measurement.
Abundant OL patterns generated from our microchip laser are investigated by the pump angle tuning. Figure 7 summarizes the experimentally obtained patterns at various pumping angles, as well as the corresponding simulated results to show the exact mode composition of the OL pattern.
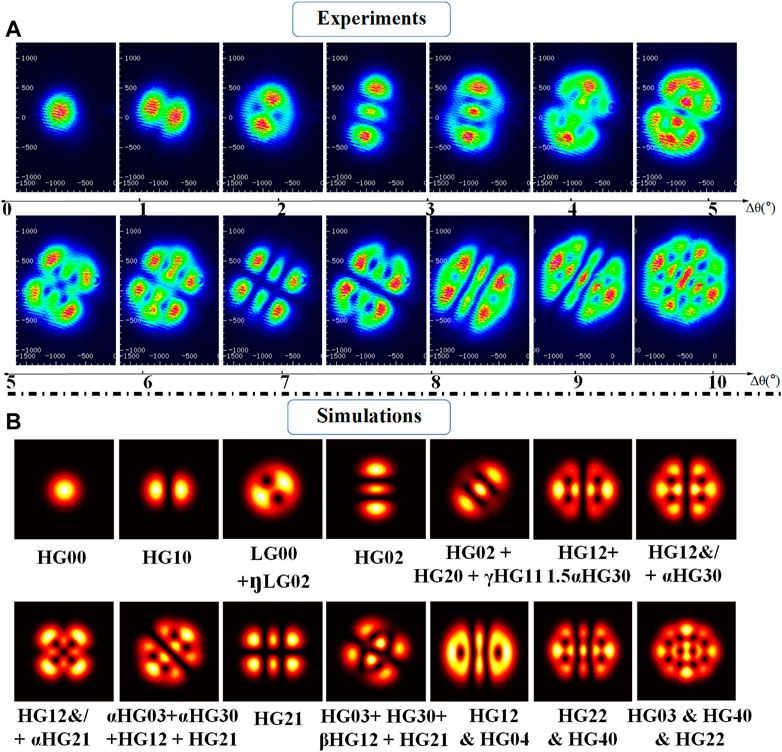
FIGURE 7. (A) Experimental and (B) simulated results of OL patterns versus the change of pump angle Δθ ranging from 0° to 10°, whereas
In Figure 7, the HG00 mode is generated with a pump beam diameter of about 100 μm in the cavity with a normal pump incident. Afterward, through increasing the pump angle Δθ to achieve the enlarged pump area or Fresnel number, OL patterns can be obtained and switched without increasing the pump power. Therefore, the order of the generated OL increases with the increase of the pump angle within a certain range. As shown in Figures 7A,B, the generated convertible OL patterns include basic single HG modes and other patterns in TML or non-TML states.
To investigate the states of the obtained OL patterns from the microchip cavity, the interference characteristic of the OL pattern is experimentally studied, corresponding to the theoretical analysis in Numerical Characterizations and Theories. As the research on the interference between plane wave and OVL in TML state has been discussed in Ref. [12], and it shows that all the dark regions have interference bifurcation, so here we mainly study the interference characteristics of plane wave and OL in non-TML state. We have selected several OL patterns in non-TML state from Figures 4H, 5. The beam patterns and corresponding interference fringes are shown in Figure 8. Comparing Figures 8B,D,F with Figures 4G,H and Figures 5B–D,F–H respectively, it can be seen that the number and position of the interference fringes do not correspond to those of the dark areas of the OL pattern. First, for Figure 8B, it can be seen that only the dark area in the enlarged area has bifurcation stripes, but not elsewhere. Then, there is a bifurcated stripe at the central dark area [enlarged shown in subfigure (d1)] of the concentric ring pattern in Figure 8D. And for the dark ring of the beam, a bifurcated stripe appears only at the bottom [enlarged shown in subfigure (d2)]. In addition, the interference results in Figure 8F show that two dark regions (f5) and (f6) do not possess bifurcated stripe. These results indicate not all dark areas of the OL patterns in non-TML state possess phase singularity, which is consistent with our theoretical analysis and simulation.
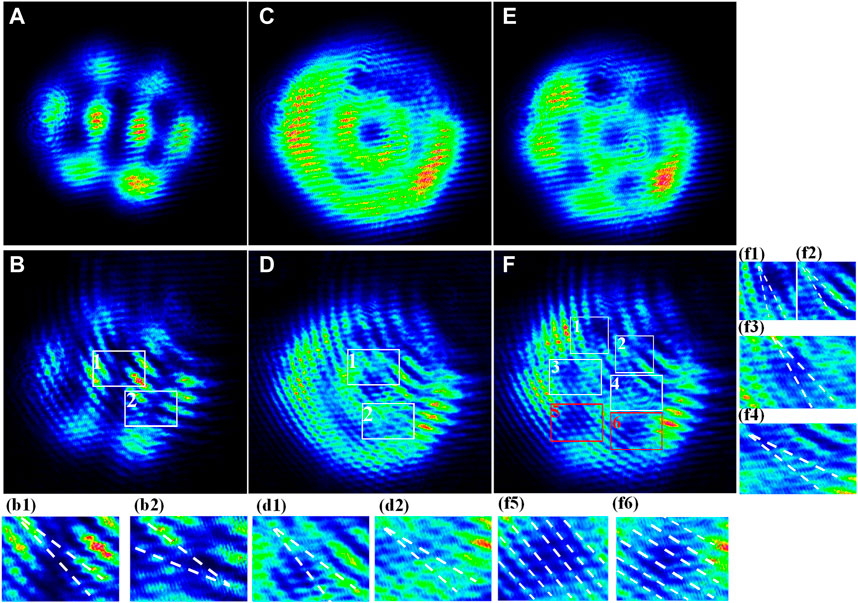
FIGURE 8. Experimental results of interference between OL patterns in non-TML state and a plane wave, which corresponded to Figures 4G,H, 5. The inserts show the enlarged regions of the interference fringes.
At last, we would like to show the experimentally measured beat frequency spectra results of the OL patterns in TML, non-TML, only-phase-locking, and prelocking states in Figure 9.
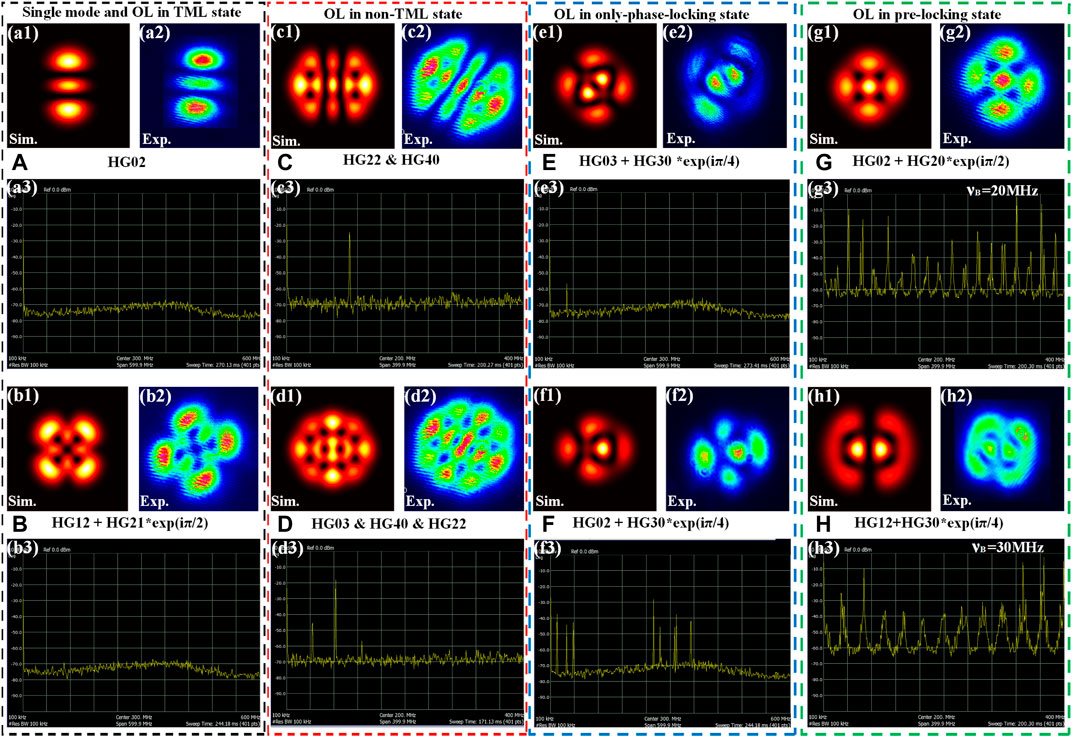
FIGURE 9. Simulated and experimental results of OL with complex beat frequency spectra in TML and non-TML states. (A) Single mode. (B) OL in TML state. (C, D) OL in non-TML state. (E, F) OL in only-phase-locking state. (G, H) OL in prelocking state.
To begin with, we studied the beat frequency spectra of OL in TML state in Figure 9B. In this case, the frequencies of the participating modes were pulled to the same value with the aid of nonlinearity. For this purpose, the beat frequency spectra in TML state are supposed to be the same as those of the single mode (see Figure 9A); that is, there is no extra beat frequency component. Subsequently, in the process of increasing the pump angle to switch the OL pattern, we found that it is tough to adjust it to the state of no beat frequency spectra for the OL in higher order. This reveals that the high-order OL is not in TML state to a large extent, but it is in the non-TML state. As shown in Figure 9(c3), a beat frequency component (approximately 100 MHz) always exists, which is the frequency difference of the two composed modes HG22 and HG40 in non-TML state. In addition, the frequency spectra in Figure 9(d3) are superimposed with three beat frequency components (approximately 40, 80, and 110 MHz) due to the pairwise beat frequencies of the three participating modes. Then, for the case when only the phases of the composed modes are locked, but the frequencies are not, as shown in Figures 9E,F, there comes the OL in only-phase-locking state. Comparing the experimentally obtained patterns in Figure 9(e2), (f2) with the simulations in Figure 9(e1), (f1), it is found that the phase difference of composed modes is locked to a constant value π/4, whereas the frequencies of composed modes are not perfectly locked together, resulting in the beat spectrum as shown in Figure 9(e3), (f3). For Figure 9(f3), the multispectra may be due to the two-order transverse mode families participating in oscillation. The frequency difference between the two transverse mode families is relatively large, resulting in two clusters of frequency spectra, and then the coupling of the modes in two orders leads to the appearance of multiple frequency spectra. Last but not the least, we found that in the lower-order OL switching process, there was a transitional stage from prelocking to locking. Figures 9G,H indicates the intensities and periodic spectra of OL in prelocking state, which are the superposition of transverse modes in the second degenerated family (m + n = 2) and the third degenerated family (m + n = 3), respectively. As discussed in Numerical Characterizations and Theories, the prelocking state occurs when the frequency interval of the transverse modes involved in the locking is decreased close to the value meeting the cooperative locking frequency effect. The harmonic content of the mode-beat signal strongly increases if its frequency difference
Conclusion
In summary, we have successfully demonstrated the distinction methods of OL patterns in TML state and non-TML state. First, through the intensity, the OL pattern in TML state varies greatly with the locking phase, and there are both symmetrical and asymmetrical patterns. Whereas for OL pattern in non-TML state, as only intensity superposition is performed, it has nothing to do with the relative phase of the composed modes, and the intensity pattern is always symmetrical. Next, through simulations and experiments on the interference between OL patterns and the plane wave, the OL patterns in the above two states could be distinguished. When the OL is in TML state, all the dark zones possess phase singularity. In contrast, the phase singularity of OL in non-TML state varies with the phases of the composed modes, and some dark regions of OL in non-TML state do not possess phase singularity. At last, an OL state judgment with the beat frequency spectra is proposed as an auxiliary means. For TML and non-TML state, our analysis shows that the corresponding beat frequency spectra are supposed to be null-component spectra and several-spike spectra, respectively. In addition, the other two types of OL states with beat frequency spectra are summarized; that is, the extra-component and two-cluster spectra correspond to only-phase-locking state, and the periodic spectra correspond to prelocking state. The OL patterns and interference patterns can be predicted by the established theoretical model and are in consonance with the experimental results. With the summarization of such three ingenious methods including intensity comparison, interferometry, and beat frequency spectrum to distinguish OL patterns in TML or non-TML states, it is beneficial for further rigorously understanding the physical mechanism of laser transverse pattern possessing OL.
Data Availability Statement
The original contributions presented in the study are included in the article/Supplementary Material, further inquiries can be directed to the corresponding author.
Author Contributions
XW and ZZ conceived the idea and performed analytical derivations. XW and ZZ performed numerical simulations and experiments. XW wrote the manuscript. All authors provided critical feedback and helped shape the research, analysis and manuscript.
Funding
ZZ acknowledges financial support via National Natural Science Foundation of China (NSFC), (61805013).
Conflict of Interest
The authors declare that the research was conducted in the absence of any commercial or financial relationships that could be construed as a potential conflict of interest.
Publisher’s Note
All claims expressed in this article are solely those of the authors and do not necessarily represent those of their affiliated organizations, or those of the publisher, the editors and the reviewers. Any product that may be evaluated in this article, or claim that may be made by its manufacturer, is not guaranteed or endorsed by the publisher.
Supplementary Material
The Supplementary Material for this article can be found online at: https://www.frontiersin.org/articles/10.3389/fphy.2021.801916/full#supplementary-material
References
1. Ungar PJ, Weiss DS, Riis E, Chu S Optical Molasses and Multilevel Atoms: Theory. J Opt Soc Am B (1989) 6:2058–71. doi:10.1364/JOSAB.6.002058
2. Weiss DS, Riis E, Shevy Y, Ungar PJ, Chu S Optical Molasses and Multilevel Atoms: experiment. J Opt Soc Am B (1989) 6:2072–83. doi:10.1364/JOSAB.6.002072
3. Jessen PS, Gerz C, Lett PD, Phillips WD, Rolston SL, Spreeuw RJC, et al. Observation of Quantized Motion of Rb Atoms in an Optical Field. Phys Rev Lett (1992) 69:49–52. doi:10.1103/PhysRevLett.69.49
4. Verkerk P, Lounis B, Salomon C, Cohen-Tannoudji C, Courtois J-Y, Grynberg G Dynamics and Spatial Order of Cold Cesium Atoms in a Periodic Optical Potential. Phys Rev Lett (1992) 68:3861–4. doi:10.1103/PhysRevLett.68.3861
5. Klische W, Weiss CO, Wellegehausen B Spatiotemporal Chaos from a continuousNa2laser. Phys Rev A (1989) 39:919–22. doi:10.1103/PhysRevA.39.919
6. Tredicce JR, Quel EJ, Ghazzawi AM, GreenPernigo CA, Pernigo MA, Narducci LM, et al. And Lugiato LA. Spatial and Temporal Instabilities in a CO2 LaserSpatial and Temporal Instabilities in aCO2laser. Phys Rev Lett (1989) 62:1274–7. doi:10.1103/PhysRevLett.62.1274
7. Dangoisse D, Hennequin D, Lepers C, Louvergneaux E, Glorieux P Two-dimensional Optical Lattices in aCO2laser. Phys Rev A (1992) 46:5955–8. doi:10.1103/PhysRevA.46.5955
8. Huyet G, Martinoni MC, Tredicce JR, Rica S Spatiotemporal Dynamics of Lasers with a Large Fresnel Number. Phys Rev Lett (1995) 75:4027–30. doi:10.1103/PhysRevLett.75.4027
9. Huyet G, Tredicce JR Spatio-temporal Chaos in the Transverse Section of Lasers. Physica D: Nonlinear Phenomena (1996) 96:209–14. doi:10.1016/0167-2789(96)00021-8
10. Brambilla M, Battipede F, Lugiato LA, Penna V, Prati F, Tamm C, et al. Transverse Laser Patterns. I. Phase Singularity Crystals. Phys Rev A (1991) 43:5090–113. doi:10.1103/PhysRevA.43.5090
11. Coullet P, Gil L, Rocca F Optical Vortices. Opt Commun (1989) 73:403–8. doi:10.1016/0030-4018(89)90180-6
12. Scheuer J, Orenstein M Optical Vortices Crystals: Spontaneous Generation in Nonlinear Semiconductor Microcavities. Science (1999) 285:230–3. doi:10.1126/science.285.5425.230
13. Chen YF, Lan YP Formation of Optical Vortex Lattices in Solid-State Microchip Lasers: Spontaneous Transverse Mode Locking. Phys Rev A (2001) 64:063807. doi:10.1103/PhysRevA.64.063807
14. Chen YF, Lan YP Transverse Pattern Formation of Optical Vortices in a Microchip Laser with a Large Fresnel Number. Phys Rev A (2001) 65:013802. doi:10.1103/PhysRevA.65.013802
15. Otsuka K, Ko J-Y, Makino H, Ohtomo T, Okamoto A Transverse Effects in a Microchip Laser with Asymmetric End-Pumping: Modal Interference and Dynamic Instability. J Opt B: Quan Semiclass. Opt. (2003) 5:R137–R145. doi:10.1088/1464-4266/5/3/202
16. Otsuka K, Chu S-C Generation of Vortex Array Beams from a Thin-Slice Solid-State Laser with Shaped Wide-Aperture Laser-Diode Pumping. Opt Lett (2009) 34:10–2. doi:10.1364/OL.34.000010
17. Shen Y, Wan Z, Fu X, Liu Q, Gong M Vortex Lattices with Transverse-Mode-Locking States Switching in a Large-Aperture off-axis-pumped Solid-State Laser. J Opt Soc Am B (2018) 35:2940–4. doi:10.1364/JOSAB.35.002940
18. Jaksch D, Bruder C, Cirac JI, Gardiner CW, Zoller P Cold Bosonic Atoms in Optical Lattices. Phys Rev Lett (1998) 81:3108–11. doi:10.1103/PhysRevLett.81.3108
19. Greiner M, Mandel O, Esslinger T, Hänsch TW, Bloch I Quantum Phase Transition from a Superfluid to a Mott Insulator in a Gas of Ultracold Atoms. Nature (2002) 415:39–44. doi:10.1038/415039a
20. Maher-Mcwilliams C, Douglas P, Barker PF Laser-driven Acceleration of Neutral Particles. Nat Photon (2012) 6:386–90. doi:10.1038/nphoton.2012.87
21. Padgett M, Bowman R Tweezers with a Twist. Nat Photon (2011) 5:343–8. doi:10.1038/nphoton.2011.81
22. Kuo C-F, Chu S-C Numerical Study of the Properties of Optical Vortex Array Laser Tweezers. Opt Express (2013) 21:26418–31. doi:10.1364/oe.21.026418
23. Woerdemann M, Alpmann C, Esseling M, Denz C Advanced Optical Trapping by Complex Beam Shaping. Laser Photon Rev (2013) 7:839–54. doi:10.1002/lpor.201200058
24. Shen Y, Wang X, Xie Z, Min C, Fu X, Liu Q, et al. Optical Vortices 30 Years on: OAM Manipulation from Topological Charge to Multiple Singularities. Light Sci Appl (2019) 8:1–29. doi:10.1038/s41377-019-0194-2
25. Yang Y, Ren Y-X, Chen M, Arita Y, Rosales-Guzmán C Optical Trapping with Structured Light: a Review. Adv Photon (2021) 3:034001. doi:10.1117/1.AP.3.3.034001
26. Mair A, Vaziri A, Weihs G, Zeilinger A Entanglement of the Orbital Angular Momentum States of Photons. Nature (2001) 412:313–6. doi:10.1038/35085529
27. Wang J, Yang J-Y, Fazal IM, Ahmed N, Yan Y, Huang H, et al. Terabit Free-Space Data Transmission Employing Orbital Angular Momentum Multiplexing. Nat Photon (2012) 6:488–96. doi:10.1038/nphoton.2012.138
28. Wang J Advances in Communications Using Optical Vortices. Photon Res (2016) 4:B14–28. doi:10.1364/prj.4.000b14
29. Gong L, Zhao Q, Zhang H, Hu X-Y, Huang K, Yang J-M, et al. Optical Orbital-Angular-Momentum-Multiplexed Data Transmission under High Scattering. Light Sci Appl (2019) 8:268–78. doi:10.1038/s41377-019-0140-3
30. Graham R, Haken H Laserlight ? First Example of a Second-Order Phase Transition Far Away from thermal Equilibrium. Z Physik (1970) 237:31–46. doi:10.1007/BF01400474
31. Lugiato LA, Narducci LM, Oldano C Cooperative Frequency Locking and Stationary Spatial Structures in Lasers. J Opt Soc Am B (1988) 5:879–88. doi:10.1364/josab.5.000879
32. Lugiato LA, Oppo GL, Tredicce JR, Narducci LM, Pernigo MA Instabilities and Spatial Complexity in a Laser. J Opt Soc Am B (1990) 7:1019–33. doi:10.1364/josab.7.001019
33. Staliunas K, Weiss CO Tilted and Standing Waves and Vortex Lattices in Class-A Lasers. Physica D: Nonlinear Phenomena (1995) 81:79–93. doi:10.1016/0167-2789(94)00193-T
34. Staliunas K, Weiss CO Nonstationary Vortex Lattices in Large-Aperture Class B Lasers. J Opt Soc Am B (1995) 12:1142–9. doi:10.1364/JOSAB.12.001142
35. Louvergneaux E, Hennequin D, Dangoisse D, Glorieux P Transverse Mode Competition in aCO2laser. Phys Rev A (1996) 53:4435–8. doi:10.1103/physreva.53.4435
36. D’Alessandro G, Papoff F, Louvergneaux E, Glorieux P Average Patterns and Coherent Phenomena in Wide Aperture Lasers. Phys Rev E (2004) 69:066212. doi:10.1103/PhysRevE.69.066212
37. Wan Z, Shen Y, Gong M, Fu X Quadrant-separable Multi-Singularity Vortices Manipulation by Coherent Superposed Mode with Spatial-Energy Mismatch. Opt Express (2018) 26:34940. doi:10.1364/OE.26.034940
38. Zhang Z, Zhao C Spontaneous Phase and Frequency Locking of Transverse Modes in Different Orders. Phys Rev Appl (2020) 13:024010. doi:10.1103/PhysRevApplied.13.024010
39. Huang H, Ren Y, Yan Y, Ahmed N, Yue Y, Bozovich A, et al. Phase-shift Interference-Based Wavefront Characterization for Orbital Angular Momentum Modes. Opt Lett (2013) 38:2348–50. doi:10.1364/OL.38.002348
40. Shen Y, Meng Y, Fu X, Gong M Hybrid Topological Evolution of Multi-Singularity Vortex Beams: Generalized Nature for Helical-Ince-Gaussian and Hermite-Laguerre-Gaussian Modes. J Opt Soc Am A (2019) 36:578–87. doi:10.1364/JOSAA.36.000578
41. Sztul HI, Alfano RR Double-slit Interference with Laguerre-Gaussian Beams. Opt Lett (2006) 31:999–1001. doi:10.1364/OL.31.000999
42. Emile O, Emile J Young's Double-Slit Interference Pattern from a Twisted Beam. Appl Phys B (2014) 117:487–91. doi:10.1007/s00340-014-5859-1
43. Leach J, Padgett MJ, Barnett SM, Franke-Arnold S, Courtial J Measuring the Orbital Angular Momentum of a Single Photon. Phys Rev Lett (2002) 88:257901. doi:10.1103/PhysRevLett.88.257901
44. Gao C, Qi X, Liu Y, Xin J, Wang L Sorting and Detecting Orbital Angular Momentum States by Using a Dove Prism Embedded Mach-Zehnder Interferometer and Amplitude Gratings. Opt Commun (2011) 284:48–51. doi:10.1016/j.optcom.2010.08.083
45. Rao AS, Miyamoto K, Omatsu T Direct Generation of Vortex Lattice Modes from an Intracavity Frequency Doubled Pr:YLF Laser. In: Conference on Lasers and Electro-Optics. San Jose, CA: OSA Technical DigestOptical Society of America (2021). paper STh1B.2. doi:10.1364/CLEO_SI.2021.STh1B.2
46. Ma Y, Vallés A, Tung J-C, Chen Y-F, Miyamoto K, Omatsu T Direct Generation of Red and orange Optical Vortex Beams from an off-axis Diode-Pumped Pr3+:YLF Laser. Opt Express (2019) 27:18190. doi:10.1364/OE.27.018190
47. Liang H-C, Lin H-Y Generation of Resonant Geometric Modes from off-axis Pumped Degenerate Cavity Nd:YVO4 Lasers with External Mode Converters. Opt Lett (2020) 45:2307–10. doi:10.1364/OL.390278
48. Rao AS, Miike T, Miyamoto K, Omatsu T Optical Vortex Lattice Mode Generation from a Diode-Pumped Pr3+:LiYF4 Laser. J Opt (2021) 23:075502. doi:10.1088/2040-8986/ac067d
49. Brunel M, Emile O, Alouini M, Le Floch A, Bretenaker F Experimental and Theoretical Study of Longitudinally Monomode Vectorial Solid-State Lasers. Phys Rev A (1999) 59:831–40. doi:10.1103/PhysRevA.59.831
50. Tamm C Frequency Locking of Two Transverse Optical Modes of a Laser. Phys Rev A (1988) 38:5960–3. doi:10.1103/PhysRevA.38.5960
51. Wolf E, Agarwal GS Coherence Theory of Laser Resonator Modes. J Opt Soc Am A (1984) 1:541–6. doi:10.1364/JOSAA.1.000541
52. Zhang Z, Gui K, Zhao C, Zhang H, Xing Y Direct Generation of Vortex Beam with a Dual-Polarization Microchip Laser. IEEE Photon Technol Lett (2019) 31:1221–4. doi:10.1109/LPT.2019.2922428
Keywords: laser transverse patterns, optical lattice, optical vortex lattice, transverse mode locking, structured light
Citation: Wang X, Zhang Z, Gao Y, Zhao S, Jie Y and Zhao C (2022) Investigation on the Formation of Laser Transverse Pattern Possessing Optical Lattices. Front. Phys. 9:801916. doi: 10.3389/fphy.2021.801916
Received: 26 October 2021; Accepted: 05 November 2021;
Published: 03 January 2022.
Edited by:
Xing Fu, Tsinghua University, ChinaReviewed by:
Yijie Shen, University of Southampton, United KingdomYuanjie Yang, University of Electronic Science and Technology of China, China
Copyright © 2022 Wang, Zhang, Gao, Zhao, Jie and Zhao. This is an open-access article distributed under the terms of the Creative Commons Attribution License (CC BY). The use, distribution or reproduction in other forums is permitted, provided the original author(s) and the copyright owner(s) are credited and that the original publication in this journal is cited, in accordance with accepted academic practice. No use, distribution or reproduction is permitted which does not comply with these terms.
*Correspondence: Zilong Zhang, emx6aGFuZ0BiaXQuZWR1LmNu
 Xin Wang
 Zilong Zhang1,2,3*