- 1State Key Laboratory of Bioelectronics, School of Biological Science and Medical Engineering, Southeast University, Nanjing, China
- 2Ceyear Technologies Co., Ltd., Qingdao, China
- 3Public Health and Epidemic Preparedness and Response Center, Peking University, Beijing, China
- 4Department of Epidemiology and Biostatistics, Center for Global Health, School of Public Health, Nanjing Medical University, Nanjing, China
Introduction: Differential equations governed compartmental models are known for their ability to simulate epidemiological dynamics and provide highly accurate descriptive and predictive results. However, identifying the corresponding parameters of flow from one compartment to another in these models remains a challenging task. These parameters change over time due to the effect of interventions, virus variation and so on, thus time-varying compartmental models are required to reflect the dynamics of the epidemic and provide plausible results.
Methods: In this paper, we propose an Euler iteration augmented physics-informed neural networks(called Euler-PINNs) to optimally integrates real-world reported data, epidemic laws and deep neural networks to capture the dynamics of COVID-19. The proposed Euler-PINNs method integrates the differential equations into deep neural networks by discretizing the compartmental model with suitable time-step and expressing the desired parameters as neural networks. We then define a robust and concise loss of the predicted data and the observed data for the epidemic in question and try to minimize it. In addition, a novel activation function based on Fourier theory is introduced for the Euler-PINNs method, which can deal with the inherently stochastic and noisy real-world data, leading to enhanced model performance.
Results and Discussion: Furthermore, we verify the effectiveness of the Euler-PINNs method on 2020 COVID-19-related data in Minnesota, the United States, both qualitative and quantitative analyses of the simulation results demonstrate its accuracy and efficiency. Finally, we also perform predictions based on data from the early stages of the outbreak, and the experimental results demonstrate that the Euler-PINNs method remains robust on small dataset.
1 Introduction
Mathematical models have proved invaluable to understanding and analyzing the transmission of infectious diseases, and many efforts have been made in epidemiological field [1]. Epidemic compartmental models governed by a system of differential equations can capture epidemiological dynamics and provide highly accurate descriptive and predictive results. Thus, the compartmental models served as the most widely applied modeling approach to analyze the transmission and evolution of infectious diseases [2, 3]. They also play a critical role in evaluating the effectiveness of interventions implemented by authorities in response to epidemic viruses [4]. The coronavirus disease 2019 (COVID-19) has overwhelmingly shocked and shaken the entire world continuously and unexpectedly, the World Health Organization (WHO) declared COVID-19 as a pandemic on 11 March 2020 [5]. Many people become sick, suffer from the Long Covid, and even lost their lives after being infected. Various interventions were implemented to fight the pandemic, specifically to reduce transmission and its impact on healthcare systems [6]. Epidemic compartmental models categorized the population into different compartments based on disease status and subsequently written mathematical equations to model infectious diseases. The basic Susceptible-Infectious-Removed (SIR) model was proposed by Kermack and McKendrick to model the dynamics of the Black Death in London in the year 1927 [7]. Since the start of COVID-19, epidemic compartmental models have been at the forefront of understanding and predicting the situation for supporting decision-making. Various compartmental models have been proposed to characterize the evolution of COVID-19 by adding customized compartments to the classical SIR model, such as the SEIR model with incubation period (E), the SEAIR model with the symptomatic carrier (A), the SEIRS model considering recurrent infection [8–10]. Wang et al use a modelling approach to reconstruct the full-spectrum dynamics of COVID-19 in Wuhan between 1 January and 8 March 2020 across 5 periods defined by events and interventions, identified the high covertness and high transmissibility features of the outbreak [11]. Wei et al. proposed an extended SEIR mode to evaluate how the implementation of clinical diagnostic criteria and universal symptom survey contributed to epidemic control in Wuhan [12].
Once a compartmental model is constructed to simulate a given scenario, the key task is to estimate the related parameters that govern its behavior. Many research efforts focus on parameter estimation of epidemic compartmental models, which fall into two main groups: deterministic and probabilistic, such as maximum likelihood estimation, Markov Chain Monte Carlo (MCMC)-based Bayesian inference [13–15], finite element methods [16], and so on. The deterministic approach uses optimization techniques to find a set of optimal parameters which satisfy the minimization of the difference between simulated and real data. The probabilistic approach especially Bayesian inversion techniques can obtain the probability distribution for each of those parameters to measure the uncertainty [17]. However, these methods suffer from important limitations, such as the problem being non-unique due to the higher number of unknowns than observations, and computational cost increasing exponentially with the complexity of the parameters and models, which hinders their application. Moreover, the fact is that related parameters may change over time in real-world scenarios due to interventions implemented by authorities, population behavioral changes, and/or mutations of the virus. Accordingly, compartmental models require time-varying parameters to capture the evolution of COVID-19 epidemiological attributes including time-varying infection, recovery, and mortality rate. Several research works have attempted to estimate time-varying parameters of the model using complex regression methods [18–20]. These methods for identifying time-varying parameters are in the context of the regression framework in which the time-varying parameters are defined as combinations of basis functions. Such a framework contains numerous parameters and employing intelligent algorithms to determine the parameters can not guarantee an optimal solution. In most instances, finding local optimum can be extremely hard, let alone the global optimum. In addition, the random initialization and following search strategies of such algorithms may lead to different solutions for each execution. Deep learning, also commonly referred to as deep neural networks (DNNs), has been used for dynamical system simulations indicating the strong potential of this computational method to address a wide variety of parameter identification tasks [21]. Neural networks can be viewed as discretizations of continuous dynamical systems, making them well-suited for dealing with dynamic systems. Moreover, the universal approximation theorem guarantees that arbitrary continuous functions can be approximated by neural networks with a sufficient number of hidden units. These two mentioned reasons facilitate DNNs achieved outstanding performance in scientific computation and parameter evaluation. It is important to note that the Physics-informed neural networks (PINNs) framework was originally developed for time-dependent partial differential equations (PDEs) and had been widely used in various domains [22–24]. The PINNs framework perfectly integrates data and mathematical models, it performs accurately and efficiently in the context of the dynamical system when partial spatio-temporal data are available. Recently, exploring the application potential of the PINNs framework in compartmental models has received attention, as many studies have demonstrated the capacity of the PINNs framework to be stable, efficient, and accurate in parameter estimation [25–28]. For example, Kharazmi et al analyze several variations of the classical SIR model through the lens of PINNs to identify time-dependent parameters for compartmental models [29]. Hu et al proposed a modified PINNs approach to estimate the unknown infected compartment I, and several unknown parameters [30].
In this paper, by skillfully incorporating the idea of Euler iteration and the Physics-informed neural networks, we propose an Euler iteration-based deep neural networks (called Euler-PINNs) to estimate the time-varying parameters for epidemic compartmental models. Firstly, we constructed a susceptible-infected-recovered-deceased (SIRD) compartmental model following the transmission behaviour of COVID-19. Next, several separate deep neural networks are built to express corresponding parameters in the SIRD model, and Euler iteration is applied to solve the equations. Lastly, we define a loss as the discrepancy between the predicted and the observed data of the epidemic in question and try to minimize it. After that, we applied the proposed Euler-PINNs method to the COVID-19 reported data from the state of Minnesota, in the United States. The experimental findings on the synthesized data have revealed that the proposed Euler-PINNs method can estimate reliable time-varying parameters that explicitly depicted the transmission trend of an infectious dynamical system over time. Specifically, both quantitative and qualitative analyses of estimated parameters in the context of the corresponding interventions are consistent with expected dynamics and previous publications. Furthermore, the proposed Euler-PINNs method is applied to predict early outbreaks, demonstrating its reliable prediction as well as robust performance on a small dataset. The main contributions of this paper are as follows:
• We proposed an Euler-PINNs method to estimate the time-vary parameters of the compartmental model. To the best of our knowledge, it is the first method to explore integrating compartmental model and Euler iteration into deep neural networks to model the dynamic of the infectious disease. Different from directly modeling all the compartments and parameters using neural networks, leveraging the Euler iteration in forward process provides more constraints to the network. As a result, this makes the network easier to converge and increases the explainability of the network as well as the plausibility of the results.
• We transform the continuous-time differential equations into discrete-time difference equations and build corresponding neural networks for each time-varying parameter in the equations. Then applying Euler iteration to integrate the neural networks and the differential equations to estimate the time-varying parameters in the equations. In addition, we add Fourier transformation for the input data before feed it to the network, considering that COVID-19 epidemic-related data is from real-world report, which is inherently, stochastic, and noisy.
• We applied the proposed Euler-PINNs method to 2020 COVID-19 data from the state of Minnesota, the United States, to analyze the effectiveness of the interventions. The estimated time-varying parameters of the SIRD compartmental model well explained the COVID-19 evolution under the light of government interventions that were taken, showing consistency in comparison with published works. More importantly, the proposed Euler-PINNs method can provide a reliable prediction for an early outbreak.
The rest of the paper is organized as follows. In Section 2, we briefly introduce Fourier neural networks, including the fundamental theory of neural networks, activation functions and Fourier mapping. Section 3 presents the SIRD compartmental model constructed for a given COVID-19 transmission scenario, and the Eulerian iteration to discretise the model. Moreover, a detailed description of how to integrate the compartmental model and Euler iteration into the neural network and how to design the loss function is provided. In Section 4, we test the proposed Euler-PINNs method with 2020 COVID-19 data from the state of Minnesota, discuss the results obtained and perform prediction for early stage outbreaks. Section 5 wraps up this work with a summary of conclusions, opportunities, and limitations.
2 Fourier induced deep neural networks
2.1 Deep neural networks
This section briefly introduces the relevant concepts and mathematical formulation of DNNs. Mathematically, the DNNs defines a mapping of functions
where d and c are the dimensions of input and output, respectively. At first, a standard neural unit of DNNs with an input
where
where
•
• N[ℓ−1]: the number of neurons in ℓ−1 layer
• σ[ℓ−1]: the activation function in ℓ−1 layer
•
•
We denote the output of the DNNs by y (x; θ) with θ representing the parameter set of all weights and biases. The hyper-parameter N[ℓ−1], L and the activation functions σ[ℓ−1] should be defined before training.
2.2 Activation function
Non-linear activation functions such as ReLU(z) = max{0, z} and tanh(z) enhance the ability of DNNs to model various non-linear problems such as non-linear PDEs and classification. Therefore, selecting the suitable activation function matters greatly for DNNs applied in all domains. Recent work has shown that Fourier feature mapping as an activation function enables the network to learn the objective function better [32–34]. Since the Fourier feature mapping of sine and cosine can mitigate the spectral bias or frequency preference phenomenon of DNNs [35, 36]. It is
where κ = (a1, a2, ⋯) is a user-specified vector (trainable or untrainable) that is consistent with the number of neural units in the first hidden layer of the DNNs. By performing a Fourier feature mapping of the input data, the input points in Ω may be mapped to the range [−1, 1]. Then, the following blocks of the DNNs can nicely handle the feature information, as shown in Figure 1.
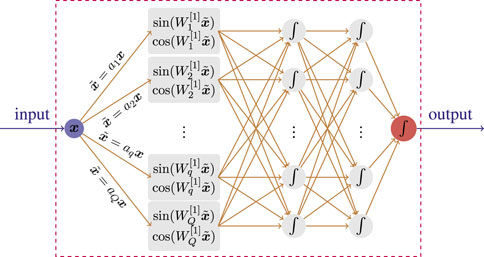
FIGURE 1. Illustration of the representation of Fourier basis in a neural network with 3 hidden layers.
Deep neural networks are now consistently used as the non-linear function approximation method and have shown their powerful capacity in the fields of scientific computation and engineering application. Therefore, this paper intends to explore the application of integrating DNNs into epidemic compartmental models for modeling the complex dynamics of COVID-19.
3 Methodology
3.1 Epidemiology model
Epidemic compartmental models enable the simulation of multi-state population transitions by incorporating domain knowledge and mathematical assumptions to characterize the dynamics of the infectious disease. The dynamics of the infection can be described approximately by a variation of the Kermack-McKendrick Eq. 7. We consider a geographical region, assumed as isolated from other regions, and within the such region, we define a time-dependent SIRD model which covers the most important features in modeling the dynamics of COVID-19. The transmission rate determines the dynamic of the epidemic and reflects the effectiveness of the interventions implemented by the authorities. The recovery rate and death rate reflect the capacity of the healthcare system to fight against COVID-19. This hypothesis is a reasonable assumption when interventions are well performed.
where S(t), I(t), R(t), D(t) denote the number of susceptible, infected, recovered and deceased individuals over time, respectively. β ≥ 0 represents the transmission rate of the disease, which is the average number of contacts of an infected individual per unit of time, multiplied by the probability of disease transmission. γ ≥ 0 represents the recovery rate, which is the proportion of infected individual that recover from the disease per unit of time. μ ≥ 0 is the death rate. Note that S(t) + I(t) + R(t) + D(t) = N, where N is the initial population and remains constant in time (e.g., dN/dt = 0). The model is initialized at some conventional t = t0 with values S (t0) = S0 > 0, I (t0) = I0 > 0, R (t0) = R0 ≥ 0, and D (t0) = D0 ≥ 0. R(t) + D(t) denote the removed individuals that are removed from the susceptible compartment due to death or immunization.
3.2 Euler iteration
Mathematically, the infectious disease transmission dynamics such as (Eq. 5) are generically represented as the following non-linear dynamical system
where
where t = t0, t0+1, t0+2, ⋯. In real-world scenario applications, these parameters are usually time-varying and unknown, which would result in an ill-posed inverse problem. Such an ill-posed inverse problem is a well-known dilemma and poses a significant challenge for traditional methods. Deep learning, specifically deep neural networks, as the non-linear function approximation method has shown its powerful capacity for solving forward-inverse problems. Here, we consider the function expressions for time-varying parameters β, γ and μ utilizing DNNs and provide their high-accuracy estimation relying on the aforementioned Euler iteration method according to the given observed data.
3.3 Overview of Euler-PINNs
To this end, we resort to data-driven surrogate βNN(⋅, θβ), μNN(⋅, θμ) and γNN(⋅, θγ) represented by DNNs as the hypothesis spaces (denoted as βNN μNN and γNN), then the expression of time-varying parameters β, μ and γ for SIRD model can be obtained by minimizing the following loss function:
with
where the observed data for S(t), I(t), R(t) and D(t) at t = t0, t0+1, t0+2, ⋯ with a given time interval [t0, T] are denoted as S0, S1, S2, ⋯, I0, I1, I2, ⋯, R0, R1, R2, ⋯, and D0, D1, D2, ⋯, respectively. In addition, we introduce five positive relaxing factor ωS, ωI, ωR, ωD and ω to balance the contribution of Loss2S, Loss2I, Loss2R, Loss2D and the regularization sum of network parameter in loss function, respectively. To obtain the ideal
where the learning rate αk decreases with k increasing and θ = {θβ, θγ, θμ}.
Figure 2 describes the schematic of the Euler-PINNs method. In this architecture, three separate deep neural networks are designed to express the corresponding parameters β, γ, and μ in SIRD compartmental model. Next, Euler iteration is introduced to perform the forward process, and then the discrepancy between forward predictions and real-world observations is defined as the loss function which requires to be minimized. Specifically, each neural networks comprise 5 layers, the weight matrix Wk and the bias vector bk of the kth layer are:
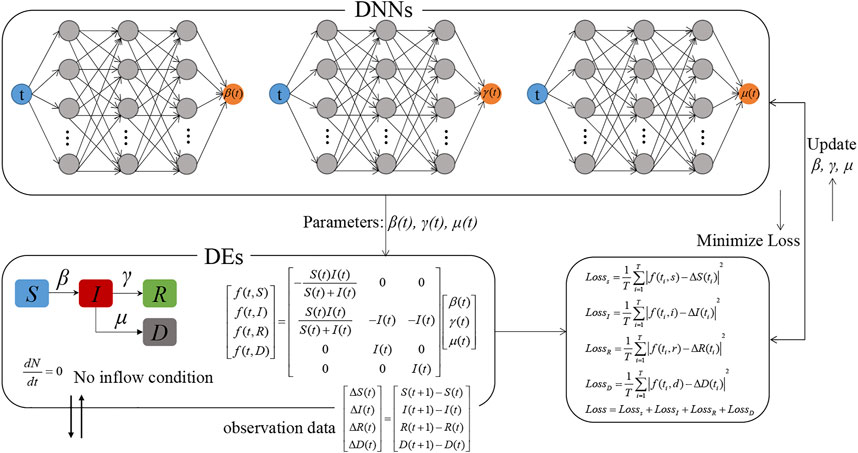
FIGURE 2. The overview of Euler-PINNs for parameters estimation. Each neural networks comprise 5 layers, the weight matrix Wk and the bias vector bk of the kth layer are:
4 Application
In this section, we applied the proposed Euler-PINNs method for time-varying parameters estimation of SIRD compartmental model to the real-world data from the state of Minnesota, the United States, and analyzed its performance on both parameter estimation and future prediction.
4.1 Data and implementation
4.1.1 Data source
The proposed Euler-PINNs method was applied to real-world COVID-19 reported data from The COVID Tracking Project [37], which covered the confirmed numbers of infected, recovered, and dead cases in the state of Minnesota, the United States. Accounting for the first dose of COVID-19 vaccine in the United States was administered on 14 December 2020, we selected the time window range 25 March to 13 December of 2020 to avoid any immunity after the vaccination. These time series data I(t), R(t), D(t) are smoothed with a 7-day average due to delays in registering new cases or updating the status of infected individuals over the weekend.
4.1.2 Implementation
We trained the proposed Euler-PINNs method on a personal laptop with an Intel (R) Core (TM) i7-8550U CPU and 1.8GHz, with the Windows 10 operating system. We developed the Euler-PINNs based on Python programming language and using the NumPy [38], Pandas [39] library and the TensorFlow [40] framework. In this numerical experiments, all neural networks are trained by the Adam optimizer, the initial learning rate is 2 × 10⁻³ with a decay rate 95% for every 2000 epochs. In addition, the regular factors ω is set as 0.0005, max epoch is set as 100000. The entire training process took about 10 min to run 10,000 epochs on all training data, and predictions could be made within seconds.
4.2 Analysis of the results
4.2.1 Quantitative analysis of the results
In this subsection, we present the evaluation of how well the estimated parameters fit the SIRD compartmental model on the available data. Figure 3 shows the fitting of the dynamic of the SIRD model with time-varying parameters to the available data (after 7-day smoothing), which demonstrates that the proposed Euler-PINNs method can accurately fit the different fluctuations in the data. In addition, the performance of mathematical modeling is measured by metrics such as mean absolute errors (MAE) and root means square error (RMSE). The loss function of the proposed Euler-PINNs method is formulated by these metrics, which guarantees it can reflect the convergence of the network and the performance of mathematical models. As can be seen in the Figure 4, the proposed Euler-PINNs method has good convergence.
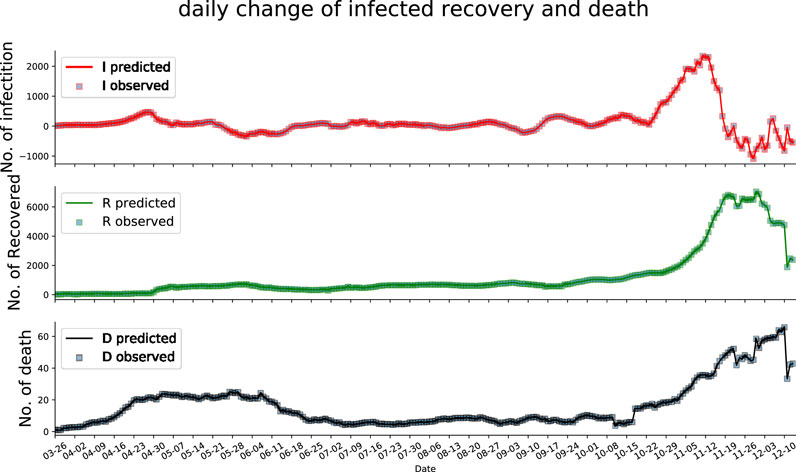
FIGURE 3. The fitting of infection, recovery and deaths during training.The squares represent the observed data and the curves represent the predicted data.
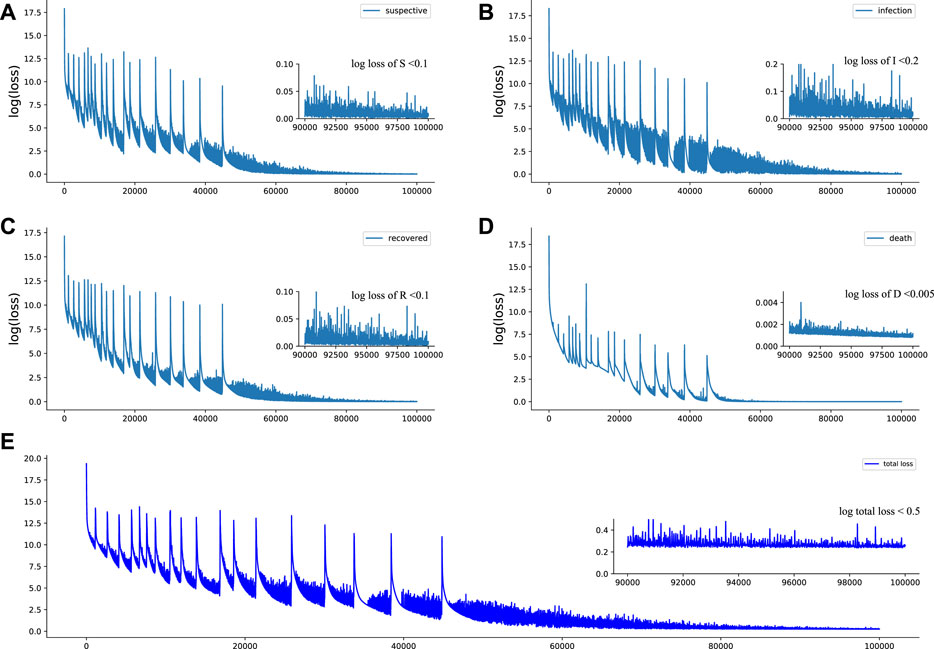
FIGURE 4. Loss of Euler-PINNs method. (A): Loss of susceptible individuals. (B): Loss of infection individuals. (C): Loss of recovery individuals. (D): Loss of death individuals. (E): Total loss of Euler-PINNs.
Moreover, we evaluate how the estimated parameters fit the SIRD compartmental model by comparing the results of previous publications. The findings demonstrate that the proposed Euler-PINNs method yields reliable results that are consistent with those given by other researchers. We compare our results to those obtained using the methodology of the rolling regression framework [19], where the order of magnitude of the time-varying parameters β(t), γ(t) and μ(t) is in agreement and the trend is almost identical. It is a sensible note that [41] estimate that the pandemic in the United States presented an estimated ascertainment rate of 21.6% (95% confidence interval:18.9%–25.5%). Asymptomatic and undocumented confirmed cases were not included in our model, which may account for the slightly lower transmission rate we estimated than in paper [19] to some extent. Recovery was defined differently in different states in the United States, in Minnesota it refers to people whose symptoms have improved. This means that asymptomatic cases or individuals suffering from symptoms but not hospitalized nor monitored are not included in the data. As a result, the number of individuals observed as recovered is lower, leading to a lower estimated recovery rate. Consistent with [42], who report values of β(t), γ(t) and μ(t) in the United States of orders 10–1, 10–2 and 10–3, respectively, around the middle of May. This is also consistent with the orders of magnitude of β(t), γ(t) and μ(t) for Minnesota around that time of the year. Consistent with [43], who report that the average time a person is infectious, 1/γ(t), to be 5 days (i.e., γ(t) ∼ 0.2), our result of γ(t) is very close to this estimation. The estimated range of μ(t) and β(t) given by [44] are approximately 10–3 and 10–1 for the first half of 2020, in the same order with our results.
4.2.2 Qualitative analysis of the results
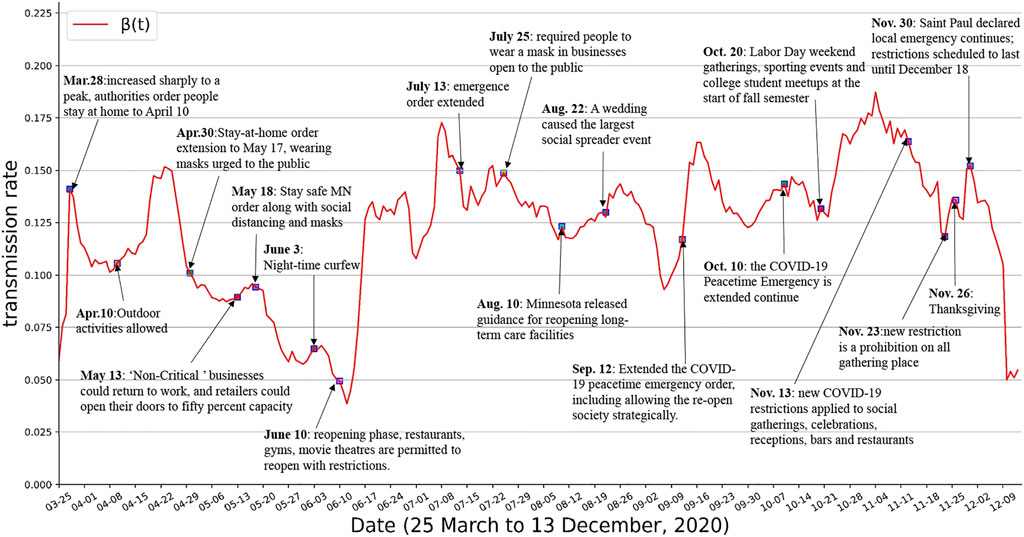
The epidemiological parameters in compartmental models are sensitive to government policies, people’s interactions, medical resources, and so on. In this subsection, we show the evolution of the parameters over time and the corresponding key events during this period. All events and interventions are available from official websites1 2 3. As shown in Figure 5, the transmission rate β(t) can fit well with what would be expected given such events. With the first confirmed cases of COVID-19 detected on March 15 2020, in Minnesota, β(t) increased sharply to a peak on March 28. The authorities then ordered people currently living within Minnesota to stay at home from March 28 to April 10. The value of transmission rate β(t) kept falling, but started to rise rapidly again after April 10 since all restrictive interventions were lifted. On April 30, the authorities of Minnesota extended the stay-at-home order until May 17, and urged people to wear masks in public. On May 13, Non-Critical businesses could return to work, and retailers could open their doors to fifty percent capacity. This order affected the average number of contacts among people, with the transmission rate of COVID-19 showing an upward trend after this. On May 18, the new Stay safe Minnesota order that contained a series of interventions for controlling the pandemic was issued. Night-time Curfew was imposed in all public places within Saint Paul between 10:00 p.m. and 4:00 a.m. on June 3. This new order, along with the effect of masks and social distancing, caused β(t) to remain reduced until June 12. However, Minnesota entered reopening phase since June 10, restaurants, gyms, movie theatres, et al. are permitted to reopen with restrictions. The effect of these reopen orders were a surge in β(t) a few days later. On July 25, new order required people to wear a mask in businesses open to the public. It is evident that wearing a mask is effective in preventing the transmission of COVID-19, and the transmission rate β(t) has started to decrease. On August 10, the Minnesota released guidance for reopening long-term care facilities, causing a slight surge in transmission rate. In addition, a motorcycle rally was held in western South Dakota during August 7–16, many event-associated cases were identified [45]. On August 22, a late-August wedding in southwestern Minnesota caused the largest social spreader event to date. On September 12, Minnesota extended the COVID-19 peacetime emergency order, including allowing the reopen society strategically. On October 10, the COVID-19 Peacetime Emergency is extended continue. On October 20, surge in cases expected from Labor Day weekend gatherings, sporting events and college student meetups at the start of fall semester. Minnesota announced new COVID-19 restrictions on November 11 to curb the spread of the virus, which apply to social gatherings, celebrations, receptions, bars and restaurants from November 13. The new COVID-19 restrictions in Minnesota apply to social gatherings, celebrations and receptions, and bars and restaurants from November 13. Since November 21, a new restriction is a prohibition on all gathering places. However, the impact of these interventions backfired shortly a few days before Thanksgiving on November 26 due to gathering. On November 30, Saint Paul declared that a local emergency continues to exist. The effect of the order of November 23 was a drop in β(t) after Thanksgiving activities due to it is scheduled to last until December 18.
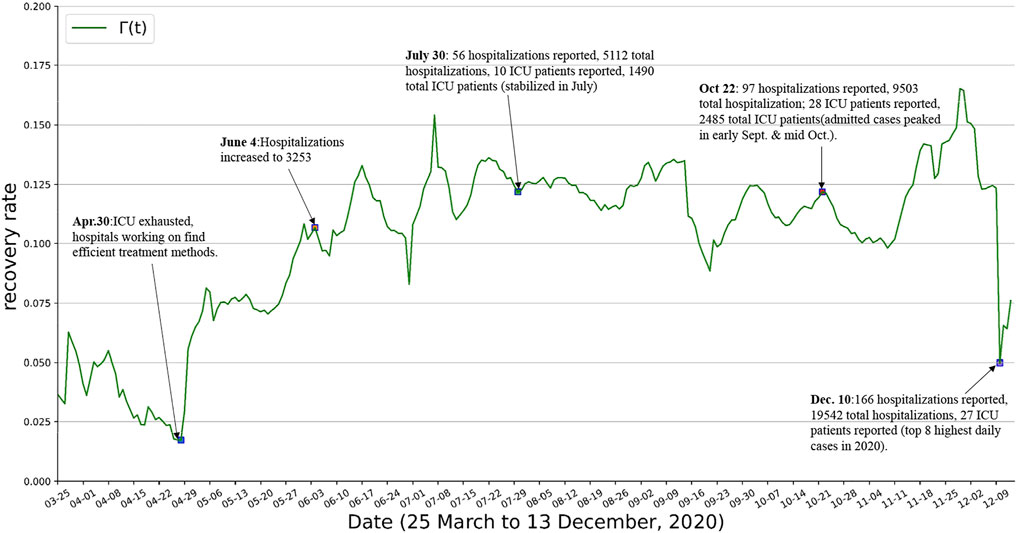
Note that the events that have an impact on β(t) have to do with people’s adaption to preventive interventions and the interactions among individuals, whereas μ(t) relates to the availability and effectiveness of healthcare, as well as on the resource availability in hospitals. γ(t) is known to be disease-specific parameter (inverse of the infectious period) but is also affected by the capacity of the healthcare system to accommodate hospitalization. As far as γ(t) and μ(t), when hospitals and emergency rooms do not working at full capacity they can better look after patients and provide better medical service. This usually results in a decrease in the proportion of individuals that died from the disease (decrease of μ(t)) and in a decrease in the recovery time (increase of γ(t)). In the context of COVID-19, the hospital’s ability to respond to the situation derived from the pandemic had a considerable impact. Hospitals are at full capacity in the first months of the outbreak, and as months went by, healthcare professionals learned more about possible treatments to treat the disease’s symptoms and effects. The consequence as shown in Figure 6 and Figure 7, in qualitative terms, was an increasing trend in γ(t) and a decreasing trend in μ(t).
4.3 Forecasting
The compartmental model requires determined initial conditions and model parameters to make predictions. As the initial conditions can be obtained and the model parameters are already calibrated, then predictions for the dynamics of COVID-19 can be made. Modeling results can provide reliable feedback information for the authorities to make future decisions. Therefore, it is critical to identify the epidemic parameters of infectious diseases timely at the beginning of an outbreak. Additionally, to test the performance of the proposed Euler-PINNs method on the small data set, we chose to predict the early-stage dynamics of the COVID-19.
In the prediction part, the value of β(t), γ(t) and μ(t) are assumed to be their final value of the training time window. Note that the number of recovered and death state in SIRD model are terminal states, which means that the changes in the number of recovered and death people are always non-decreasing. In turn, the infected people may see periods of increase and decrease due to it is a state of transition. In addition, the number of susceptible state is non-increasing, and therefore the change in this compartment is always non-positive. Training data and 1-week prediction results on the current infected cases, cumulative recovery cases and cumulative death cases and are corresponding ground truth displayed in Figures 8A–C displays the 1-week prediction based on the reported data from March 25—23 April 2020, and Figures 8D–F displays the 1-week prediction based on the reported data from March 25—8 May 2020. The interventions to control the COVID-19 keep adjusting, which may result in uncertainty, simulations illustrate that the proposed Euler-PINNs has the capability to capture the sudden change and give reliable short-term predictions.
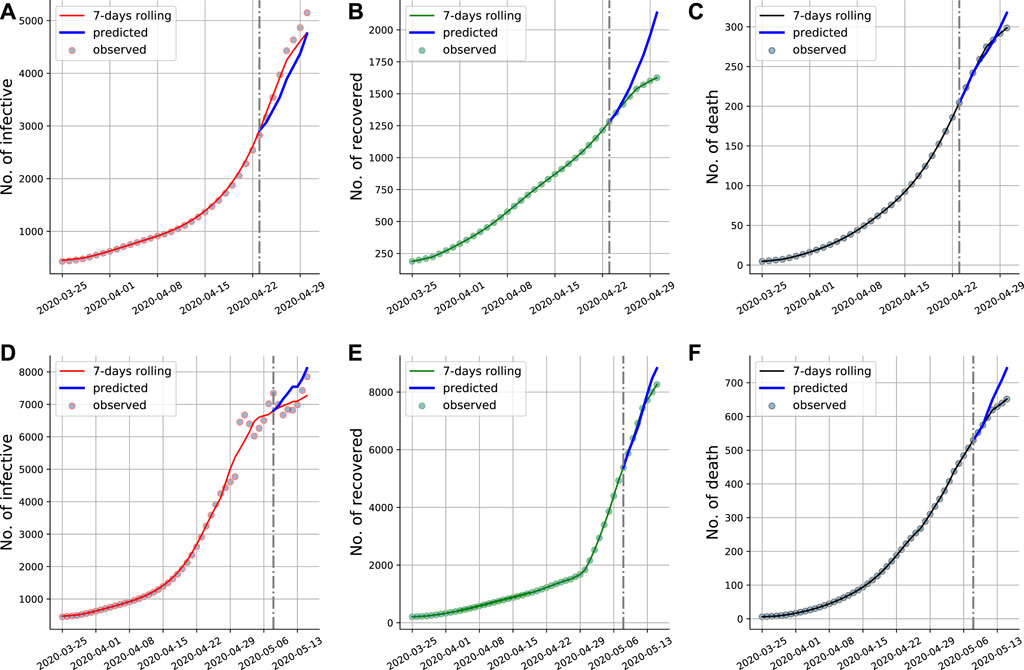
FIGURE 8. Euler-PINNs prediction for the early stage of COVID-19 in Minnesota. The gray vertical line divides the fitting and prediction window. We have included the new available data for the prediction period that were not used in the fitting to show that the predictions are correct. (A) and (D): Current infections. (B) and (E): Cumulative recovery. (C) and (F): Cumulative deaths.
4.4 Evaluation metrics
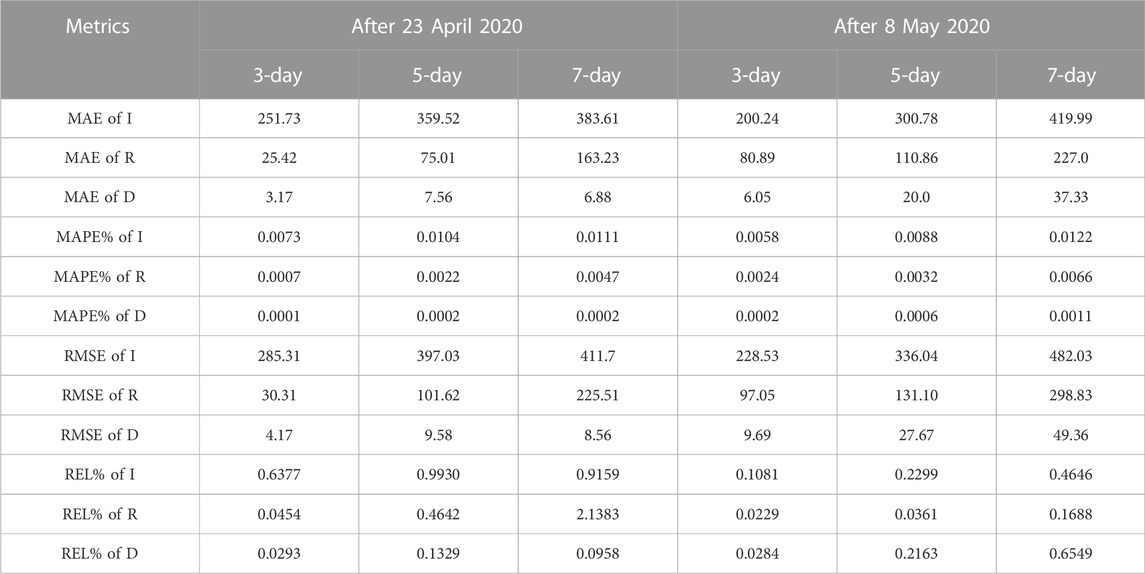
By comparing forecasting results and observations, the performance of the proposed Euler-PINNs can be evaluated. We use four evaluation metrics to make fair and effective comparisons. They are mean absolute error (MAE), average absolute percentage error (MAPE), root mean square error (RMSE) and relative error (REL). The calculation method is shown in Eqs 9–12.
To test the effect of the proposed Euler-PINNs method in the prediction, we did 3-day, 5-day and 7-day experiments. The experimental results as represented in Table 1 show the highly accurate forecasting capability of the proposed Euler-PINNs method.
5 Discussion and conclusion
In this paper, we proposed an Euler-PINNs method to estimate the time-varying parameters of the compartmental model and provide future forecasting based on calibrated parameters. We discretize the time-continuous compartmental model using forward Euler iteration, expressing each parameter in the compartmental model as separate DNNs, and substituting the predicted values of parameters into the equations. The loss function of the proposed Euler-PINNs method is formulated based on the error between prediction and observation, and the Adam optimizer with a dynamic learning rate is applied to minimize it.
Experiment results demonstrate that the time-varying parameters of the SIRD model estimated by the proposed Euler-PINNs method are consistent with previous published works. The transmission rate β determines the dynamics of COVID-19, and the time-varying β(t) estimated by proposed Euler-PINNs method can accurately capture the changes in government interventions and individual behaviors, such as mask wearing and social distancing. The recovery rate γ and the death rate μ are expected to increase and decrease, respectively, thanks to the more effective treatments for the disease. The estimated γ(t) and μ(t) by our proposed Euler-PINNs method also fit well with the improved capacity of the healthcare system to fight against COVID-19. The proposed Euler-PINNs method shows that rather than using several stage models with piece-wise constant parameters, it is possible to design one model with time-varying parameters that are capable of representing the overall evolution of the infectious disease. More importantly, applying estimated parameters to the compartmental model to depict the dynamics of COVID-19, the perfect fitting between model predictions and observed data also underscores that parameters yield great fitness.
For different infectious diseases and different transmission scenarios, different compartmental models are required to model the dynamics of infectious diseases. The SIRD compartmental model is not the most complex epidemic model available, dividing more compartments such as breaking down infected people into asymptomatic and symptomatic, adding the virus mutations, or adding the vaccination campaign could be part of a more complex model. In fact, it is impossible to build a state-of-the-art epidemiology model that represents all the intricacies of the current pandemic. Our paper aims to introduce a new intelligent method for estimating time-varying parameters in epidemic models and provide a reliable prediction. The proposed Euler-PINNs method can be implemented easily without any background knowledge about numerical analysis (for example, stability conditions, and a priori distribution). Therefore, for applying the Euler-PINNs method to various compartmental models, the practitioner only needs to redefine the transformation matrix for each compartment according to the equations and build DNNs for the relevant parameters. Lastly, deep learning models do not replace conventional computational simulations but could assist them in mitigating some of their common bottlenecks, such as high computational costs. In future work, we are planning to try to test some fast PINN frameworks [46, 47] and to try to approximate the parameters using extreme learning machines (ELM) [48]. More importantly, we would do more validation experiments on various extended compartment models and generalize the proposed method to other infectious diseases.
Data availability statement
The original contributions presented in the study are included in the article/Supplementary Material, further inquiries can be directed to the corresponding author.
Author contributions
XN designed the framwork and developed the code programming by Python and related packages, and X-AL reviewed and improved the code. YW and FC tested the proposed framework and provided critical comments for the application part. XN write the original draft and all the authors reviewed the final manuscript and critically revised it. All authors have read the paper and approved its submission.
Funding
The study was supported by the National Natural Science Foundation of China (82041024 to FC and 81973142 to YW). This study was also partially supported by the Bill & Melinda Gates Foundation (INV-006371).
Conflict of interest
Author X-ALi is employed by Ceyear Technologies Co., Ltd.
The remaining authors declare that the research was conducted in the absence of any commercial or financial relationships that could be construed as a potential conflict of interest.
Publisher’s note
All claims expressed in this article are solely those of the authors and do not necessarily represent those of their affiliated organizations, or those of the publisher, the editors and the reviewers. Any product that may be evaluated in this article, or claim that may be made by its manufacturer, is not guaranteed or endorsed by the publisher.
Footnotes
1https://mn.gov/governor/covid-19/news/
2https://www.stpaul.gov/departments/emergency-management/coronavirus-covid-19
3https://ballotpedia.org/Documenting_Minnesota%27s_path_to_recovery_from_the_coronavirus_(COVID-19)_pandemic,_2020-2021
References
1. Wei Y, Sha F, Zhao Y, Jiang Q, Hao H, Chen F. Better modelling of infectious diseases: Lessons from Covid-19 in China. BMJ (2021) 375:n2365. doi:10.1136/bmj.n2365
2. Guan J, Wei Y, Zhao Y, Chen F. Modeling the transmission dynamics of Covid-19 epidemic: A systematic review. J Biomed Res (2020) 34(6):422. doi:10.7555/jbr.34.20200119
3. Mohamadou Y, Halidou A, Kapen PT. A review of mathematical modeling, artificial intelligence and datasets used in the study, prediction and management of Covid-19. Appl Intell (2020) 50(11):3913–25. doi:10.1007/s10489-020-01770-9
4. Holmdahl I, Buckee C. Wrong but useful - what covid-19 epidemiologic models can and cannot tell us. N Engl J Med (2020) 383(4):303–5. doi:10.1056/nejmp2016822
5. Cucinotta D, Vanelli M. Who declares Covid-19 a pandemic. Acta Biomed (2020) 91(1):157–60. doi:10.23750/abm.v91i1.9397
6. Haug N, Geyrhofer L, Londei A, Dervic E, Desvars-Larrive A, Loreto V, et al. Ranking the effectiveness of worldwide Covid-19 government interventions. Nat Hum Behav (2020) 4(12):1303–12. doi:10.1038/s41562-020-01009-0
7. Kermack WO, McKendrick AG. A contribution to the mathematical theory of epidemics. Proc R Soc Lond Ser A, containing Pap a Math Phys character (1927) 115(772):700–21. doi:10.1098/rspa.1927.0118
8. Maier BF, Brockmann D. Effective containment explains subexponential growth in recent confirmed Covid-19 cases in China. Science (2020) 368(6492):742–6. doi:10.1126/science.abb4557
9. Giordano G, Blanchini F, Bruno R, Colaneri P, Di Filippo A, Di Matteo A, et al. Modelling the Covid-19 epidemic and implementation of population-wide interventions in Italy. Nat Med (2020) 26(6):855–60. doi:10.1038/s41591-020-0883-7
10. Tian H, Liu Y, Li Y, Wu CH, Chen B, Kraemer MUG, et al. An investigation of transmission control measures during the first 50 days of the Covid-19 epidemic in China. Science (2020) 368(6491):638–42. doi:10.1126/science.abb6105
11. Hao X, Cheng S, Wu D, Wu T, Lin X, Wang C. Reconstruction of the full transmission dynamics of Covid-19 in wuhan. Nature (2020) 584(7821):420–4. doi:10.1038/s41586-020-2554-8
12. Wei Y, Wei L, Jiang Y, Shen S, Zhao Y, Hao Y, et al. Implementation of clinical diagnostic criteria and universal symptom survey contributed to lower magnitude and faster resolution of the Covid-19 epidemic in wuhan. Engineering (2020) 6(10):1141–6. doi:10.1016/j.eng.2020.04.008
13. Jagan M, deJonge MS, Krylova O, Earn DJD. Fast estimation of time-varying infectious disease transmission rates. Plos Comput Biol (2020) 16(9):e1008124. doi:10.1371/journal.pcbi.1008124
14. Ge Y, Zhang WB, Wu X, Ruktanonchai CW, Liu H, Wang J, et al. Untangling the changing impact of non-pharmaceutical interventions and vaccination on European Covid-19 trajectories. Nat Commun (2022) 13(1):3106–9. doi:10.1038/s41467-022-30897-1
15. Xue L, Jing S, Miller JC, Sun W, Li H, Estrada-Franco J, et al. A data-driven network model for the emerging Covid-19 epidemics in wuhan, toronto and Italy. Math biosciences (2020) 326:108391. doi:10.1016/j.mbs.2020.108391
16. Viguerie A, Lorenzo G, Auricchio F, Baroli D, Hughes HJR, Patton A, et al. Simulating the spread of COVID-19 via a spatially-resolved susceptible-exposed-infected-recovered-deceased (SEIRD) model with heterogeneous diffusion. Appl Maths Lett (2021) 111:106617. doi:10.1016/j.aml.2020.106617
17. Schiassi E, De Florio M, D’Ambrosio A, Mortari D, Furfaro R. Physics-informed neural networks and functional interpolation for data-driven parameters discovery of epidemiological compartmental models. Mathematics (2021) 9(17):2069. doi:10.3390/math9172069
18. Chen YC, Lu PE, Chang CS, Liu TH. A time-dependent sir model for Covid-19 with undetectable infected persons. IEEE Trans Netw Sci Eng (2020) 7(4):3279–94. doi:10.1109/tnse.2020.3024723
19. Rubio-Herrero J, Wang Y. A flexible rolling regression framework for the identification of time-varying sird models. Comput Ind Eng (2022) 167:108003. doi:10.1016/j.cie.2022.108003
20. Calafiore GC, Novara C, Possieri C. A time-varying sird model for the Covid-19 contagion in Italy. Annu Rev Control (2020) 50:361–72. doi:10.1016/j.arcontrol.2020.10.005
21. Raissi M, Perdikaris P, Karniadakis GE. Physics-informed neural networks: A deep learning framework for solving forward and inverse problems involving nonlinear partial differential equations. J Comput Phys (2019) 378:686–707. doi:10.1016/j.jcp.2018.10.045
22. Tartakovsky M, Marrero CO, Perdikaris P, Tartakovsky DT, Barajas-Solano D. Physics-informed deep neural networks for learning parameters and constitutive relationships in subsurface flow problems. Water Resour Res (2020) 56(5):e2019WR026731. doi:10.1029/2019wr026731
23. Wang N, Chang H, Zhang D. Deep-learning-based inverse modeling approaches: A subsurface flow example. J Geophys Res Solid Earth (2021) 126(2):e2020JB020549. doi:10.1029/2020jb020549
24. Zhou Y, He Y, Wu J, Cui C, Chen M, Sun B. A method of parameter estimation for cardiovascular hemodynamics based on deep learning and its application to personalize a reduced-order model. Numer Methods Biomed Eng (2022) 38(1):e3533. doi:10.1002/cnm.3533
25. Kevin L, Schafer A, Meng X, Zou Z, Karniadakis GE, Kuhl E. Bayesian physics-informed neural networks for real-world nonlinear dynamical systems (2022). arXiv preprint arXiv:2205.08304.
26. Nguyen L, Raissi M, Seshaiyer P. Modeling, analysis and physics informed neural network approaches for studying the dynamics of Covid-19 involving human-human and human-pathogen interaction. Comput Math Biophys (2022) 10(1):1–17. doi:10.1515/cmb-2022-0001
27. Long J, Khaliq AQM, Furati KM. Identification and prediction of time-varying parameters of Covid-19 model: A data-driven deep learning approach. Int J Comp Maths (2021) 98(8):1–16. doi:10.1080/00207160.2021.1929942
28. Cai M, Karniadakis GEM, Li C. Fractional seir model and data-driven predictions of Covid-19 dynamics of omicron variant. Chaos (2022) 32(7):071101. doi:10.1063/5.0099450
29. Kharazmi E, Cai M, Zheng X, Zhang Z, Lin G, Karniadakis GEM. Identifiability and predictability of integer- and fractional-order epidemiological models using physics-informed neural networks. Nat Comput Sci (2021) 1(11):744–53. doi:10.1038/s43588-021-00158-0
30. Hu H, Kennedy CM, Kevrekidis PG, Zhang HK. A modified pinn approach for identifiable compartmental models in epidemiology with application to Covid-19. Viruses (2022) 14(11):2464. doi:10.3390/v14112464
31. Krogh K. What are artificial neural networks? Nat Biotechnol (2008) 26(2):195–7. doi:10.1038/nbt1386
32. Wang S, Wang H, Perdikaris P. On the eigenvector bias of Fourier feature networks: From regression to solving multi-scale pdes with physics-informed neural networks. Comp Methods Appl Mech Eng (2021) 384:113938. doi:10.1016/j.cma.2021.113938
33. Tancik M, Srinivasan PP, Mildenhall B, Fridovich-Keil S, Raghavan N, Singhal U, et al. Fourier features let networks learn high frequency functions in low dimensional domains (2020). arXiv preprint arXiv:2006.10739.
34. Li X, Xu ZJ, Zhang L. Subspace decomposition based dnn algorithm for elliptic-type multi-scale pdes (2021). arXiv preprint arXiv:2112.06660.
35. Xu ZQJ, Zhang Y, Luo T, Xiao Y, Zheng M. Frequency principle: Fourier analysis sheds light on deep neural networks. CiCP (2020) 28(5):1746–67. doi:10.4208/cicp.oa-2020-0085
36. Rahaman N, Arpit D, Baratin A, Draxler F, Lin M, Hamprecht FA, et al. On the spectral bias of deep neural networks. In: International Conference on Machine Learning (2019).
37. Wissel D, Van Camp PJ, Kouril M, Weis C, Glauser TA, White PS, et al. An interactive online dashboard for tracking COVID-19 in U.S. counties, cities, and states in real time. J Am Med Inform Assoc (2020) 27(7):1121–5. doi:10.1093/jamia/ocaa071
38. Harris C. R., Millman K. J., Van Der Walt F. J., Gommers, R., Virtanen P., Cournapeau D., et al. Array programming with NumPy (2020). Nature 585(7825):357–362. Nature Publishing Group.
39. McKinney W. pandas: a foundational python library for data analysis and statistics. Python high Perform scientific Comput (2011) 14(9):1–9.
40. Abadi M, Paul B, Chen J, Chen Z, Davis A, Dean J, et al. {TensorFlow}: A system for {Large-Scale} machine learning. In: 12th USENIX symposium on operating systems design and implementation (OSDI 16) (2016). p. 265–83.
41. Pei S, Yamana TK, Kandula S, Galanti M, Shaman J. Burden and characteristics of Covid-19 in the United States during 2020. Nature (2021) 598(7880):338–41. doi:10.1038/s41586-021-03914-4
42. Chakraborty A, Chen J, Desvars-Larrive A, Klimek P, Flores Tames E, Garcia D, et al. Analyzing covid-19 data using sird models. medRxiv (2020).
43. Bar-On YM, Flamholz A, Phillips R, Milo R. SARS-CoV-2 (COVID-19) by the numbers. elife (2020) 9:e57309. doi:10.7554/elife.57309
44. Fernández-Villaverde J, Jones CI. Estimating and simulating a sird model of Covid-19 for many countries, states, and cities. J Econ Dyn Control (2022) 140:104318. doi:10.1016/j.jedc.2022.104318
45. Firestone MJ, Wienkes H, Garfin J, Wang X, Vilen K, Smith KE, et al. COVID-19 outbreak associated with a 10-day motorcycle rally in a neighboring state - Minnesota, august-september 2020. MMWR Morb Mortal Wkly Rep (2020) 69(47):1771–6. doi:10.15585/mmwr.mm6947e1
46. Schiassi E, Furfaro R, Leake C, De Florio M, Johnston H, Mortari D. Extreme theory of functional connections: A fast physics-informed neural network method for solving ordinary and partial differential equations. Neurocomputing (2021) 457:334–56. doi:10.1016/j.neucom.2021.06.015
47. Srinivasan D, Srinivasan B. Physics Informed Extreme Learning Machine (PIELM)-A rapid method for the numerical solution of partial differential equations. Neurocomputing (2020) 391:96–118. doi:10.1016/j.neucom.2019.12.099
Keywords: parameter estimation, physics-informed neural network, Euler iteration, SIRD compartmental model, fourier feature mapping
Citation: Ning X, Li X-A, Wei Y and Chen F (2022) Euler iteration augmented physics-informed neural networks for time-varying parameter estimation of the epidemic compartmental model. Front. Phys. 10:1062554. doi: 10.3389/fphy.2022.1062554
Received: 06 October 2022; Accepted: 30 November 2022;
Published: 19 December 2022.
Edited by:
Thomas Peron, University of São Paulo, BrazilReviewed by:
Wei Wang, Chongqing Medical University, ChinaEnrico Schiassi, University of Arizona, United States
Copyright © 2022 Ning, Li, Wei and Chen. This is an open-access article distributed under the terms of the Creative Commons Attribution License (CC BY). The use, distribution or reproduction in other forums is permitted, provided the original author(s) and the copyright owner(s) are credited and that the original publication in this journal is cited, in accordance with accepted academic practice. No use, distribution or reproduction is permitted which does not comply with these terms.
*Correspondence: Feng Chen, ZmVuZ2NoZW5AbmptdS5lZHUuY24=
 Xiao Ning
 Xi-An Li2
 Yongyue Wei
 Feng Chen