Abstract
Nuclear magnetic resonance provides a wealth of information about the magnetic and nematic degrees of freedom in the iron-based superconductors. A striking observation is that the spin lattice relaxation rate is inhomogeneous with a standard deviation that correlates with the nematic susceptibility. Moreover, the spin lattice relaxation is strongly affected by uniaxial strain, and in doped samples it depends sensitively upon the history of the applied strain. These observations suggest that quenched strain fields associated with doping atoms induce a nematic glass in the iron pnictide materials.
1 Introduction
Electronic nematic order, in which low energy electronic degrees of freedom drive a crystal to spontaneously break discrete rotational symmetry without simultaneously breaking translational symmetry, has attracted broad interest in correlated electron physics [1]. Much of this interest stems from observations that unconventional superconductivity tends to emerge in materials exhibiting competing ground states with different broken symmetries, including nematic, charge, and/or spin density wave fluctuations [2–6]. Measurements of the nematic susceptibility in the iron based superconductors indicated the presence of a putative nematic quantum critical point under the dome of superconductivity in these materials [7, 8]. These observations have suggested a connection between quantum critical nematic fluctuations and the pairing mechanism for superconductivity [9–13]. It is thus important to understand the nature of the nematic fluctuations and their relationship to the coexisting antiferromagnetism throughout the phase diagram.
Nuclear magnetic resonance (NMR) provides a wealth of information about both the magnetic and nematic degrees of freedom in the iron-based superconductors [14]. Studies under uniaxial strain offer an important new direction in thermodynamic phase space to explore the physics of nematicity. Such experiments can broadly be separated into those that probe the static properties of the magnetic and nematic order, and those that probe the dynamical properties. The latter set of experiments have yielded some important surprises, such as a change in the spin anisotropy as a function of strain [15], and the presence of dynamical inhomogeneity when the materials are doped [16]. Below we discuss how NMR probes these broken symmetries and their fluctuations, and summarize results of experiments under uniaxial strain, both in the undoped and doped materials. These observations are consistent with the emergence of a nematic glass in doped samples, possibly driven by the presence of random strain fields from quenched disorder.
2 Coupling to Nuclear Spins
The 75As nuclei, with 100% abundance and spin I = 3/2, are excellent sensors of both the nematic and magnetic degrees of freedom in the iron pnictide superconductors. Figure 1 shows the unit cell and indicates the hyperfine coupling between the As nuclei and the four nearest neighbor Fe electronic moments. The As also has a significant quadrupolar moment, Q = 3.14 × 10⁻²⁹ m2, which couples to the surrounding electric field gradient (EFG) [17]. The hyperfine and quadrupolar couplings enable microscopic studies of both the magnetic and nematic susceptibilities of the electronic degrees of freedom.
FIGURE 1

(A) BaFe2As2 unit cell. Ba is cyan, Fe is brown and As is green. (B) The hyperfine field (green arrows) at the As sites in the antiferromagnetic state, with the Fe moments (red) oriented in the plane.
2.1 Hyperfine Interaction
The hyperfine coupling is given by:where are the nuclear spin operators, are the Fe spins on the four nearest neighbors to the As nucleus, and the hyperfine coupling tensors, , have dipolar symmetry [18, 19]. In BaFe2As2, the eigenvalues of the tensor are Aaa = Abb = 6.6 kOe/μB, and Acc = 4.7 kOe/μB, but these values depend on details of the electronic structure and can vary between compounds. They can change as a function of pressure or doping, but the general symmetry of the does not. The magnitude of these values are greater than those for the direct dipole interaction, which reflects the electronic hybridization between the As 4p and Fe 3d orbitals. The tensor nature of this coupling gives rise to a hyperfine field Hhf ∥c when the Fe moments lie in the ab plane, as illustrated in top row of Figure 2. Alternatively, if the Fe moments ordered parallel to c, then Hhf lies in the plane, as shown in the middle row of Figure 2.
FIGURE 2
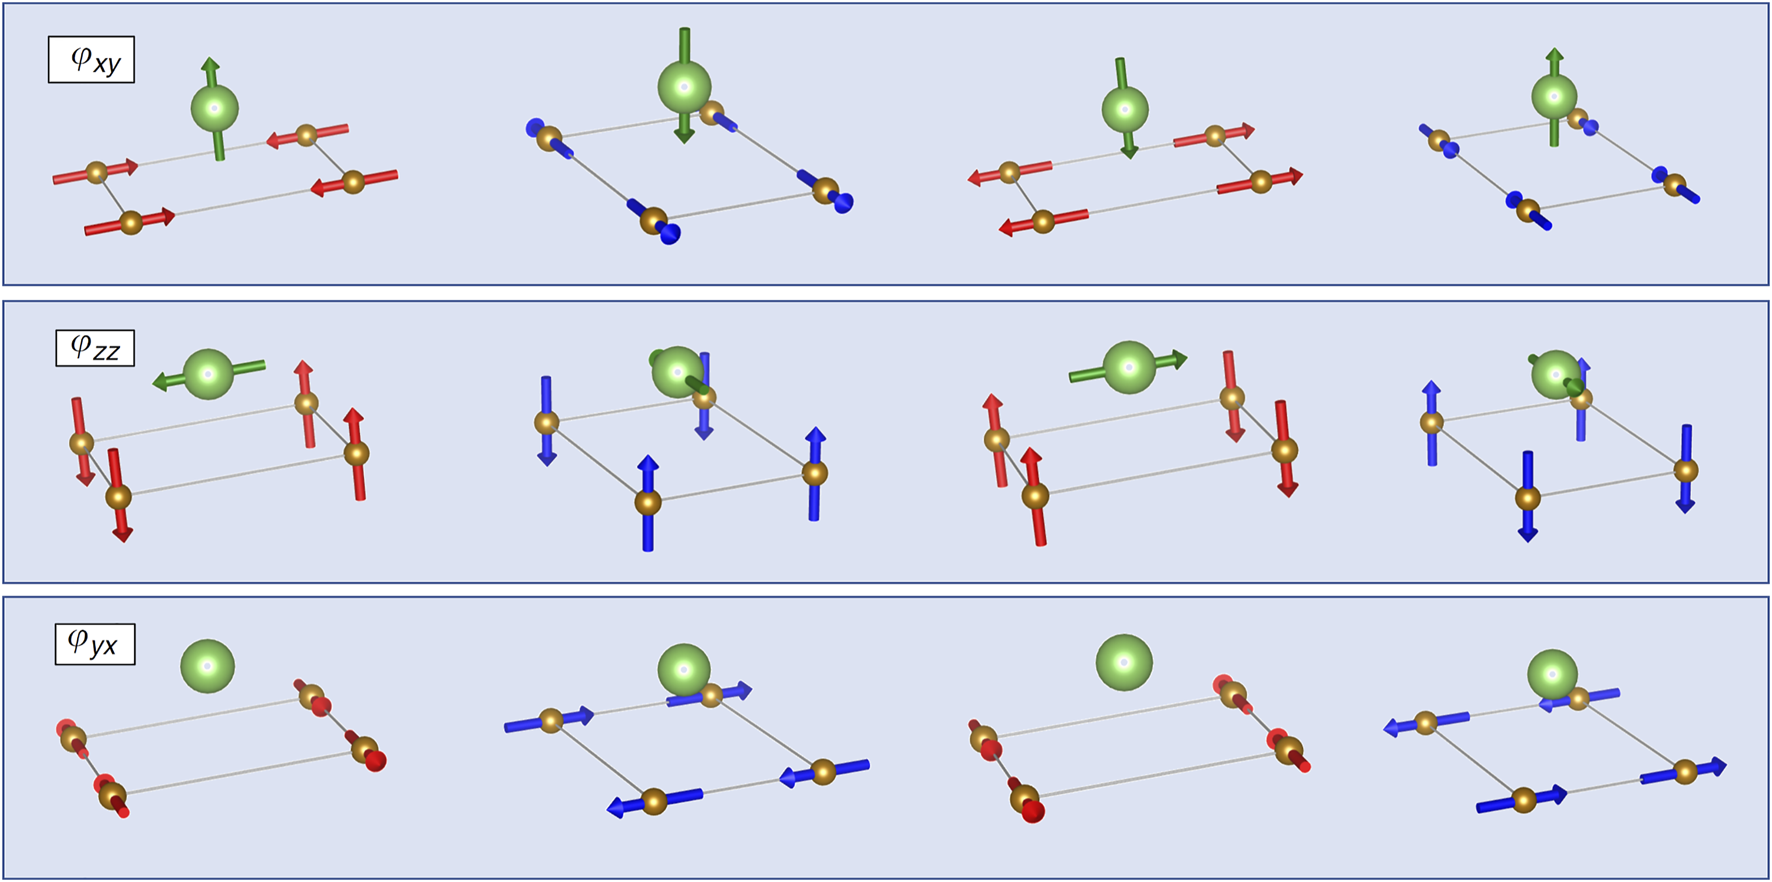
The hyperfine field at the As site (green) for the four degenerate domains with in-plane Fe moments oriented parallel to the ordering vector (ϕxy nematic order, upper row), with c-axis Fe moments (ϕzz nematic order, middle row) and with in-plane moments oriented perpendicular to the ordering vector (ϕyx nematic order, bottom row). Red and blue correspond to the two different nematic domains (positive and negative strains). Within each nematic domain, there are two different antiferromagnetic configurations.
Other magnetic orderings can be present in the pnictides, beyond the stripe-type spin density wave illustrated in Figure 2. In particular, the spin-vortex crystal configuration, in which the Fe spins form either loop or hedgehog structures, can be stabilized when a glide symmetry across the Fe planes is broken [20]. This type of order was recently identified in Ni-doped and Co-doped CaKFe4As4 [21]. There are two crystallographically distinct As sites in this structure, and the hyperfine field either vanishes at both sites for loop spin-vortex crystal order, or is aligned along the c axis for one As site and vanishes for the other As site for hedgehog spin-vortex crystal order. In this system, doping induces the latter, which was identified by NMR.
Note that when the Fe is substituted by another transition metal, the symmetry among the hyperfine couplings of the four nearest neighbors is broken, and the hyperfine field vector can acquire a component perpendicular to the c axis [22]. This effect contributes to inhomogeneous broadening in doped samples. In the presence of nematic order, the C4 symmetry of the lattice is broken, and in principle Aaa ≠ Abb. This asymmetry has not been observed directly. In FeSe, the Knight shift tensor becomes anisotropic, with Kaa ≠ Kbb, where Kαα = Aααχαα, and χαα is the static magnetic susceptibility [5]. However, in this case the anisotropy is believed to reflect that of the susceptibility, i.e., χaa ≠ χbb in the nematic phase, rather than an asymmetry in the hyperfine coupling [23]. Curiously, χaa > χbb in FeSe, but χbb > χaa in BaFe2As2, LaFeAsO, and NaFeAs [24–26], which may reflect different natures of the nematic order in these materials [27]. In particular, the nematic order parameter in the latter can be understood in terms of differential occupations between the dyz and dxz orbitals, whereas in the former the nematic order may involve more complex superpositions between 3d orbitals, giving rise to bond-centered nematic order [23, 28, 29]. The sign of the resistivity anisotropies in BaFe2As2 and FeSe match those of the magnetic anisotropies [24, 30], suggesting a common origin for the two.
2.2 Quadrupolar Interaction
For nuclei with spin I > 1/2, the quadrupolar coupling is given by:where the EFG tensor is given by:and V is the electrostatic potential at the As site. This quantity is dominated by the occupation of the As 4p orbitals, which in turn are hybridized with the dxz,yz-orbitals of the neighboring Fe atoms [31]. The EFG asymmetry parameter is given by:
This quantity vanishes in the tetragonal phase because the As 4px and 4py orbitals are degenerate, hence νxx = νyy [32]. The EFG tensor is always traceless, thus in this case it can be characterized by a single quantity, νzz. The magnitude of νzz depends on the degree of hybridization of the As 4pz orbital, and is sensitive to the c-axis length of the unit cell [33–35] and also varies with temperature [18, 36–38].
The EFG is strongly affected by doping. Replacing the Fe by another transition metal, or replacing the As by P, will give rise to spatially-varying strain fields that will distort the electrostatic potential and alter the EFG tensor. This effect can lower the symmetry such that νxx ≠ νyy, and create non-zero off-diagonal terms of the tensor. In some cases the effect is sufficiently large that separate resonances can be detected for sites that are adjacent to the substitutional site [31, 39]. This sensitivity to disorder tends to significantly broaden the NMR resonance frequencies in doped samples relative to the parent compound. In doped Ba(Fe,Co)2As2 the width of the quadrupolar satellites is dominated by a variation of η that exhibits a Curie-Weiss temperature dependence, which has been associated with the growth of nematic correlations surrounding the dopant atoms [40]. A similar effect has been observed in FeSe where the magnetic linewidth is broadened by the presence of crystal defects (there is no quadrupolar interaction for Se) [41]. In this case, the Knight shift anisotropy reflects the growth of an Edwards-Anderson order parameter of the nematicity [42].
In the presence of long range nematic order, the C4 symmetry of the EFG tensor is broken and νxx ≠ νyy [43]. In CaFe2As2η reaches 0.4 at low temperature, but in BaFe2As2 and SrFe2As2, η reaches 1.2 and 1.4, respectively, reflecting the fact that νxx and νyy have opposite signs [33]. Note that it is sometimes customary to define the principal axes of the EFG such that the eigenvalues |Vzz|≥|Vyy|≥|Vxx|, so that 0 ≤ η ≤ 1. Here we do not follow this convention, maintaining the Vzz associated with the crystal c axis as in the tetragonal phase. This choice is the reason that η > 1, which would correspond to a confusing rotation of orientation of the principal axes under the customary definition. These changes reflect a dramatic rearrangement of the charge distribution around the As nucleus below the structural transition, despite an orthorhombicity of only approximately 1%. The EFG tensor is dominated by the occupations of the As 4p orbitals, which in turn are hybridized with the Fe 3dyz and 3dxz orbitals [31, 32]. These orbitals are degenerate in the tetragonal phase, but develop a splitting on the order of 40 meV in the nematic phase [44]. As a result, the relative occupations of the As px and py orbitals change and alter the EFG.
2.3 NMR Spectra
In order to resolve the in-plane asymmetry that emerges in the Knight shift or EFG tensors, it is important to measure the NMR spectra of carefully oriented single crystals. In an external magnetic field, the As nuclear spins experience the sum of three interactions: , where is the Zeeman interaction. The spectrum will consist of three resonances. For sufficiently large Zeeman interaction (γH0 ≫ ναα), the frequencies are given to first order by:where fsat1,2 and fcen are the frequencies of the two satellites and the central transition, θ is the angle between H0 and c, and ϕ is the azimuthal angle of the projection of H0 in the ab plane. The Knight shift is given by:
The second order correction to the central transition is given by:
Measurements of the two satellite transitions as a function of field orientation can be used to extract the Knight shift and EFG tensors.
In the tetragonal phase, there are three distinct resonances for each As in the unit cell (e.g., one As site in AFe2As2). However, in the nematic phase there are multiple domains in an untwinned crystal, giving rise to extra resonances. If the magnetic field is oriented in the plane, then there may be two sets of resonances associated with these two domains because the azimuthal angle, ϕ, differs for each domain, as observed in Figure 3. This behavior is illustrated in Figure 4. In general, there are five distinct transitions (six if the Knight shift is also anisotropic), but in certain directions the spectra from the two domains overlap and three resonances are recovered. Large values of |η| cause the satellites to switch positions from below to above the central transition as the in-plane angle ϕ is rotated.
FIGURE 3
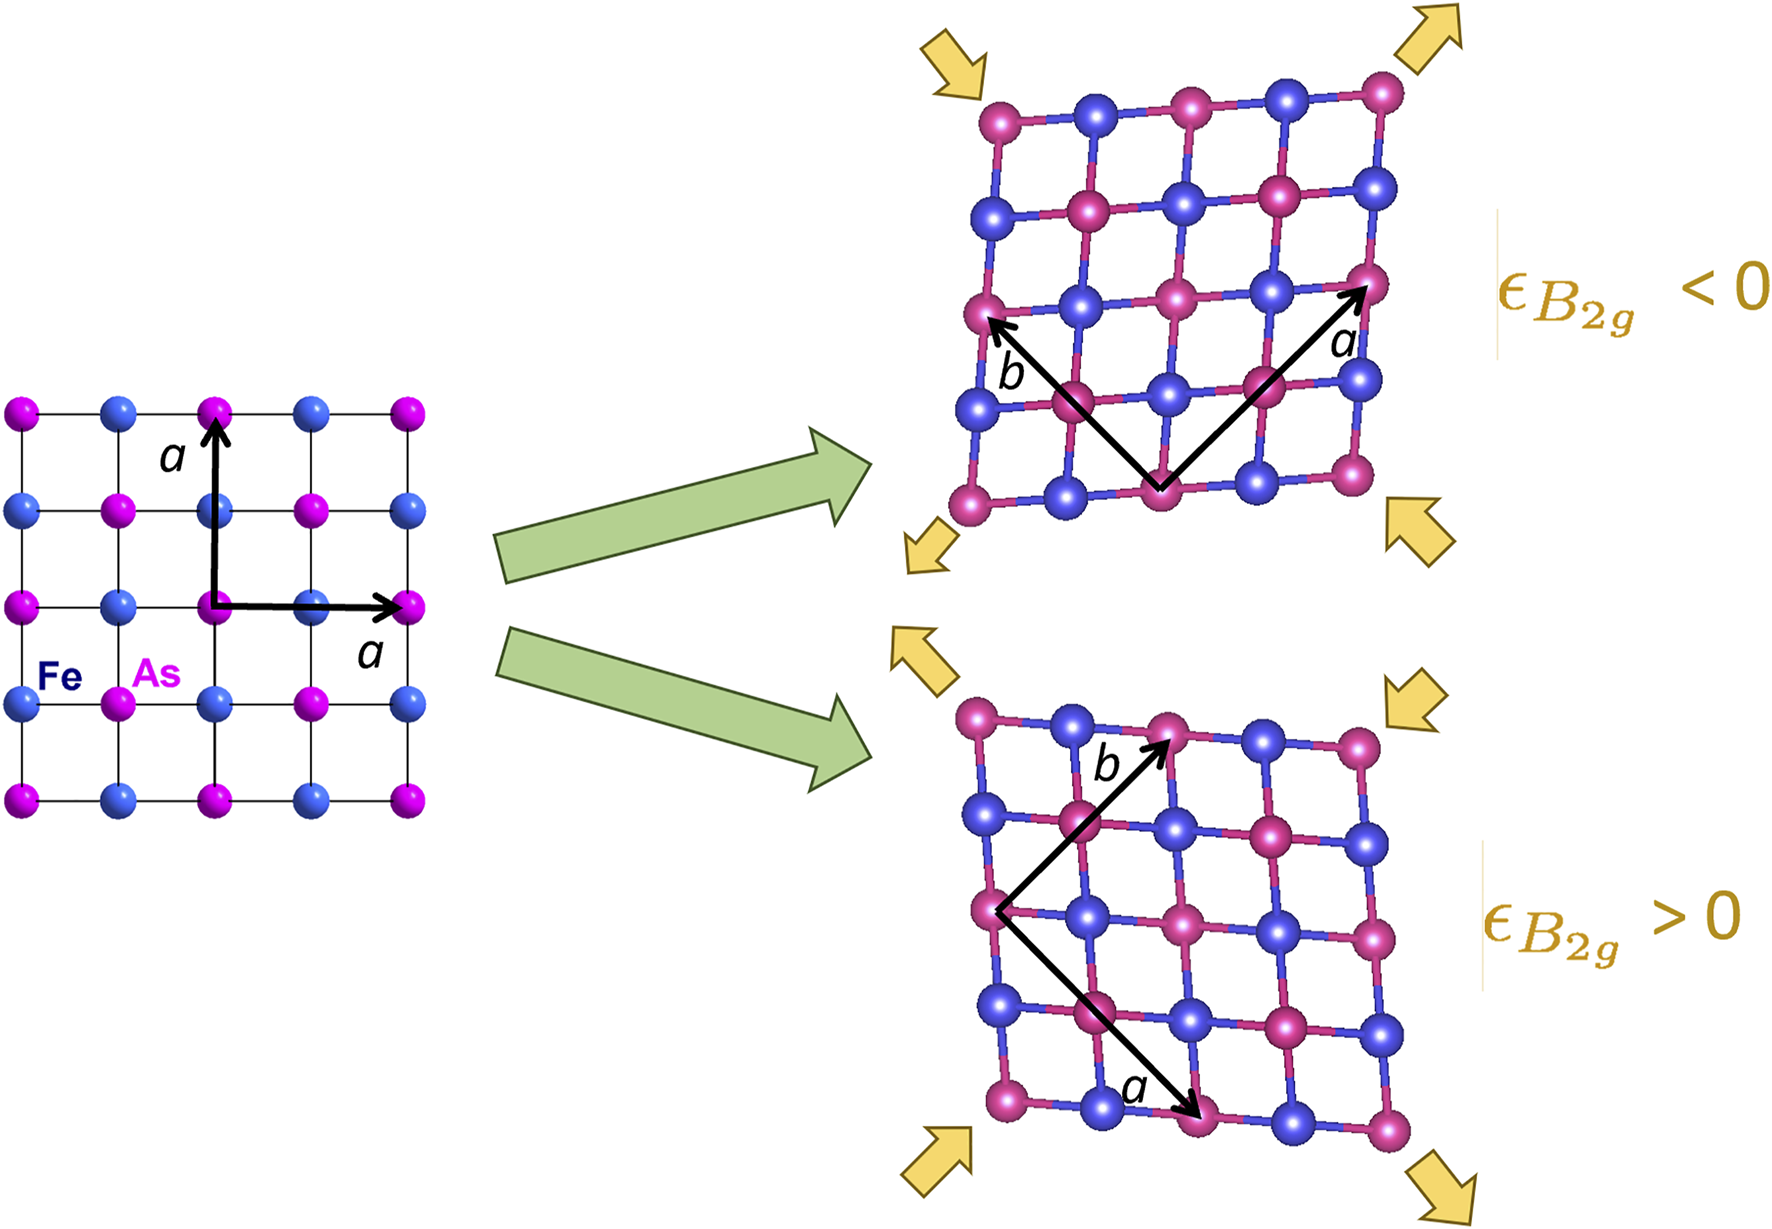
Fe-As plane in tetragonal and orthorhombic phase of BaFe2As2. Orange arrows indicate direction of displacements giving rise to two domains with positive and negative B2g strain. Strain is labeled by the unit cell of the tetragonal phase, so uniaxial strain along the [110]T direction of the tetragonal unit cell gives rise to a B2g distortion.
FIGURE 4
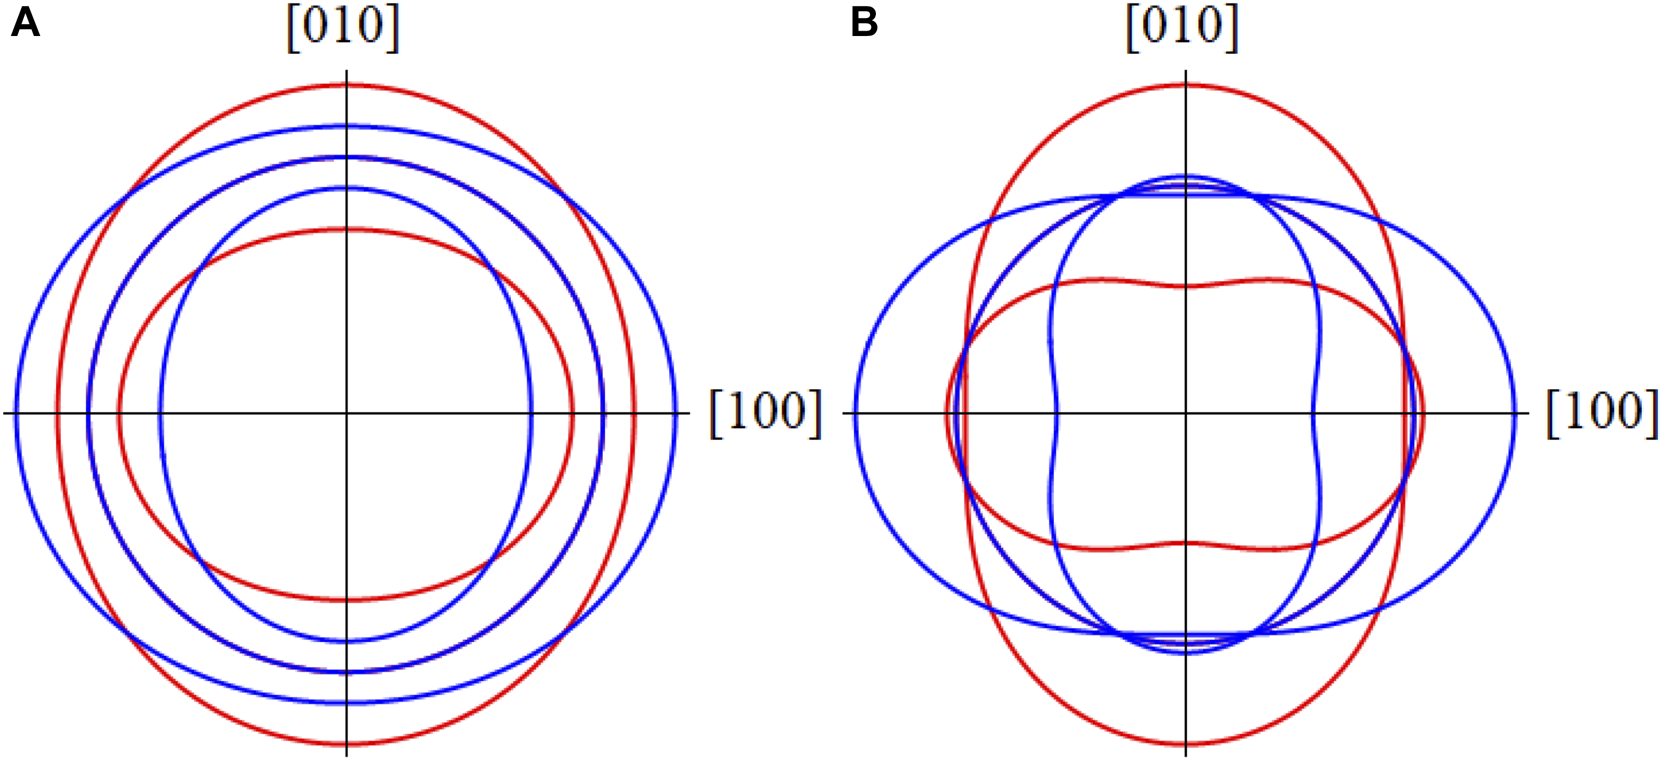
Polar plots of the three resonance frequencies of the As for |η| = 0.4 (A) and for |η| = 1.2 (B). Blue and red correspond to two nematic domains with ± η, as a function of in-plane field direction. In this case, we assume Kxx = Kyy. The directions [100] and [010] correspond to the orthorhombic unit cell directions. In general, there are five distinct transitions, but for certain angles the two sets of satellites overlap. When |η| > 1, the two satellites for each domain reverse, crossing the central transition.
When η is non-zero the nuclear spin Hamiltonian does not commute with , and the eigenstates, |i⟩, are superpositions of the |Iz⟩ states. In such cases it may be possible to observe hidden transitions when the matrix element does not vanish. This effect can arise when νzz ≳ γH, but in almost all cases there is an internal field, Hint, that develops in the antiferromagnetic state that accompanies the orthorhombic distortion. Typically γHint ≫ νzz is sufficiently large that such hidden transitions should not be evident. For CaFe2As2, however, νzz/γH ∼ 0.7 thus it may be possible to observe these transitions for small external fields H0 applied in the plane, as illustrated in Figure 5. To date no such transitions have been reported.
FIGURE 5
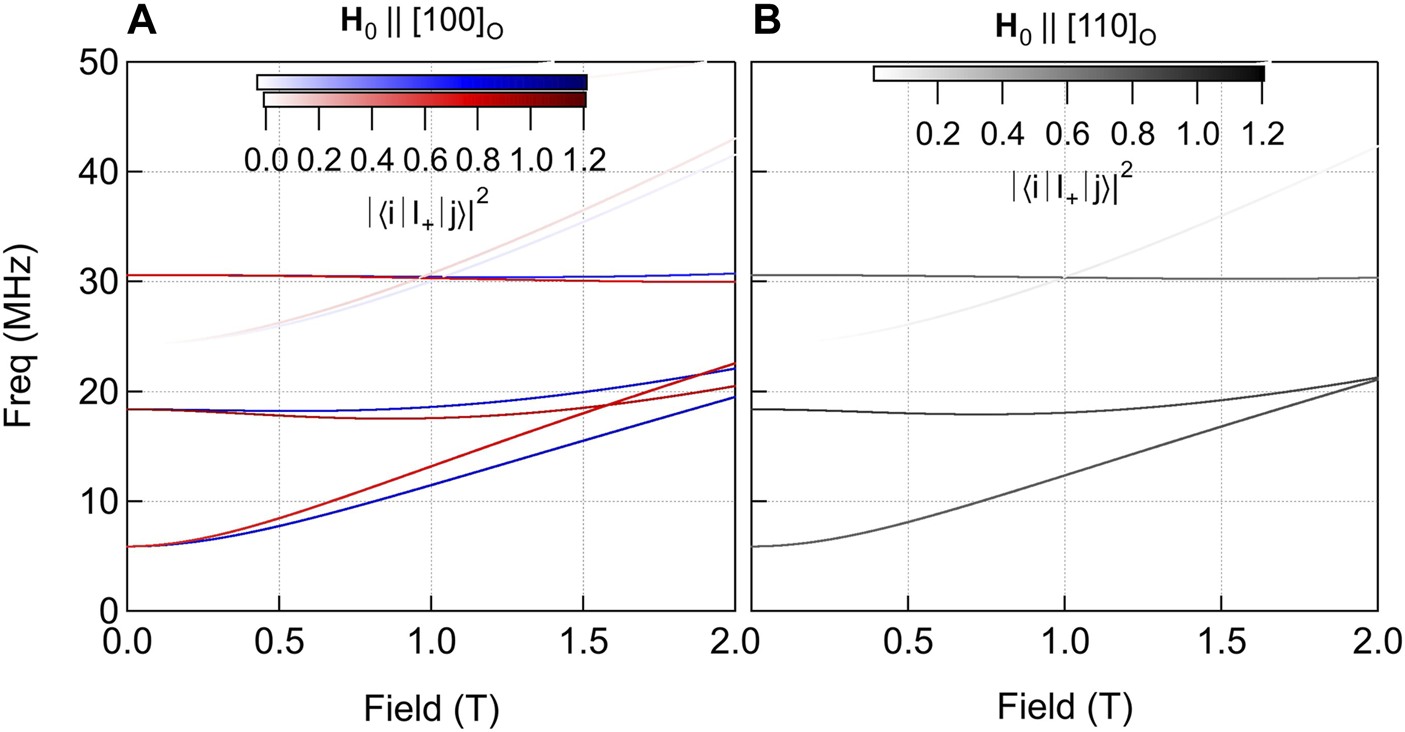
Resonance frequencies versus applied magnetic field, H0, oriented either along the orthorhombic [100] (A) or [110] directions (B) assuming an internal field of 2.5 T along c and an EFG of νzz = 12.4 MHz with η = 0.4, corresponding to the case of CaFe2As2. Red and blue correspond to the two nematic domains. The intensity of the transitions are given by the matrix elements |⟨i|I+|j⟩|2, where i, j correspond to eigenstates of the nuclear spin Hamiltonian. Hidden transitions should be visible for certain field ranges.
2.4 Relaxation Rate
The hyperfine field, Hhyp, and the EFG not only give rise to static spectral signatures, but their fluctuations can also drive relaxation of the nuclear spins. The nuclear spin energies are generally several order of magnitude smaller than the relevant electron energies, and thus the nuclear spin ensemble can easily be manipulated to have a non-equilibrium distribution among the energy levels. The nuclear spins will return to thermal equilibrium with the “lattice,” or the electronic spin system, over a time scale, T1, known as the spin-lattice relaxation time. This rate, , can be measured with high precision and is determined by the couplings described above in Section 2.1, Section 2.2. In essence, the nuclear spins act as quantum sensors that probe the noise spectra of the electronic spin and charge degrees of freedom. There are three important spectral densities that may play a role:where is an ensemble average. Here h± = Hhyp,x ± iHhyp,y, V± 1 = Vxz ± iVyz, and V± 2 = (Vxx − Vyy)/2 ± iVxy [45]. J(ω) and J(1,2)(ω) are the spectral densities of the hyperfine and EFG fluctuations, respectively. The measurements probe these spectral functions at the nuclear resonance frequency, ωN, typically on the order of 100 MHz (eV). This frequency is nearly vanishing in comparison to the relevant electronic energies, typically on the order of meV. If there is only one type of fluctuation, then is directly related to the appropriate spectral density. For example, for pure magnetic fluctuations, (e.g., V± 1,2 = 0), then , or if h± = 0 and V± 1 = 0, then , or if h± = 0 and V± 2 = 0 then . On the other hand, if multiple types of fluctuations are present, then the nuclear spin relaxation is a complex function of multiple spectral functions and it is not straightforward to disentangle the different contributions to [46–48]. It is common for the magnetic fluctuations to dominate, in which case the contribution from quadrupolar contributions can be ignored. However, as we discuss below in Section 2.4.1, there is a significant quadrupolar contribution to the of the As in the pnictides.
When the electronic system is close to an thermodynamic instability, critical fluctuations will slow down and may have a dramatic effect on . As an example, consider the case where the magnetic fluctuations exhibit Lorentzian autocorrelation function: , where τc is the correlation time. In this case:
Usually ωNτc ≪ 1, but close to a phase transition where there is critical slowing down, τc can approach infinity as a power law. As a result, exhibits a peak at the phase transition temperature, as illustrated in Figure 6. This property has been exploited to investigate the critical dynamics of many correlated electron systems, especially the pnictides [39, 49].
FIGURE 6
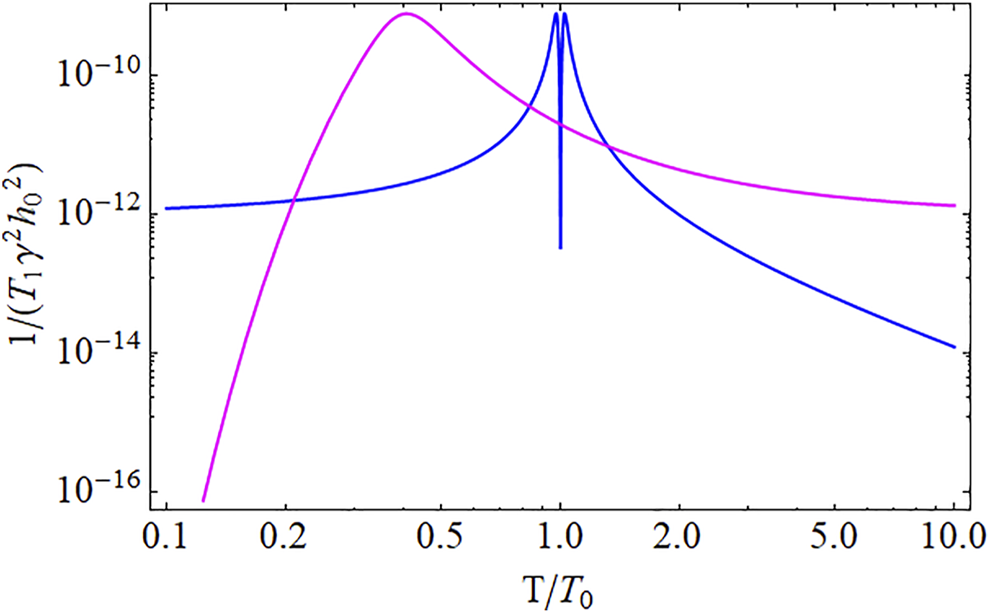
Calculated spin lattice relaxation rate versus temperature using Eq. 10 for two different models for the temperature dependence of the autocorrelation time, τc. The blue curve assumes a power law divergence: τc ∝|T − T0|−2, appropriate for critical slowing down at a phase transition. The sharp dip around T0 is usually not observable and there is only a single peak. The purple curve assumes an activated form: , where Ea is an activation energy, which is appropriate for a glassy system where the degrees of freedom gradually freeze out.
As discussed above in Section 2.3, the nuclear spin eigenstates become superpositions of the Iz states for non-zero values of η. In this case, it is important to consider spectral densities other than those described in Eqs 6, 7 to account for fluctuations in other directions. For example, hyperfine field fluctuations, Hhyp,z, may play a role in relaxing the nuclear spins. In such cases the form of the relaxation function is more complicated, and Eq. 8 will contain more terms.
2.4.1 Quadrupolar Relaxation From Nematic Fluctuations
Although magnetic relaxation is usually dominant, quadrupolar relaxation should also be present in the pnictides because the EFG changes dramatically at the nematic phase transition. This effect has been investigated in BaFe2(As1−xPx)2 by comparing the relaxation of the 75As to 31P [43]. The phosphorus isotope has spin I = 1/2, and does not have a quadrupolar moment. It therefore is only sensitive to magnetic fluctuations, whereas the As probes both magnetic and quadrupolar fluctuations. Importantly, both the As and the P are located in the same crystallographic site, and experience similar hyperfine interactions. In fact, the 75As exhibits a higher relaxation rate, indicating the presence of a second relaxation channel that is, not probed by the 31P. Moreover, the extra relaxation increases with decreasing temperature, and exhibits a peak at the nematic ordering temperature. An analysis of the extra relaxation rate suggests that the nematic susceptibility diverges below TN for the lightly doped system, and below Tc for the optimally doped system. It was not possible to quantitatively disentangle the contributions from the magnetic and quadrupolar channels separately, primarily because the doping introduced inhomogeneous relaxation, as discussed below in Section 4. The three relaxation channels (one magnetic and two quadrupolar) may also be coupled to one another. For example, a nematic fluctuation can give rise spectral densities J (ωN), J(1)(ωN), and J(2)(ωN). Nevertheless, this work provided direct proof of nematic fluctuations that diverge near the superconducting transition temperature, Tc. Theoretical work has suggested that nematic fluctuations may play a role in the superconducting pairing in these materials [9, 11].
3 Response to Uniaxial Strain
In the iron based superconductors, the electronic nematic degrees of freedom couple to lattice strain with B2g symmetry: ɛB2g = (ɛxx − ɛyy)/2, where x and y are defined with respect to the tetragonal unit cell as illustrated in Figure 3 [4]. This coupling gives rise to a linear response of the electronic nematicity to external strain on a crystal. Uniaxial strain can be applied via different techniques, however in recent years piezoelectric-based strain cells have demonstrated excellent properties that enable one to carefully control the level of strain even at cryogenic temperatures [50]. Even though piezoelectric actuators do not have linear response to control voltages, the strain can be controlled through feedback control algorithms for the long periods of time necessary for NMR experiments [51]. The strain is measured by a capacitive dilatometer. Note that even though the device applies a uniaxial stress, σ0, along the x direction, the response of the crystal is not a pure uniaxial strain. Rather, the non-zero stress tensor elements become: ɛxx = σ0/E and ɛyy = ɛzz = −νσ0/E, where E is the Young’s modulus and ν is the Poisson’s ratio of the material. This gives rise to strain in two symmetry channels:
On the other hand, the electronic nematicity has a much stronger response to B2g strain than A1g, thus uniaxial stress is sufficient to probe the intrinsic B2g nematic response [7].
3.1 Spectra
In BaFe2As2, uniaxial strain dramatically alters the EFG tensor and η ∝ɛxx, as illustrated in Figure 7 [32]. In the absence of strain, the crystal remains tetragonal down to the nematic transition temperature Ts = 135 K, in which case the EFG tensor spontaneously develops an asymmetry such that νxx ≠ νyy. However, in the presence of a finite strain field, η becomes finite above Ts. In fact, η ∝ɛxx and the constant of proportionality is the nematic susceptibility. As seen in Figure 7, the response is largest just above Ts, where the nematic susceptibility diverges. This behavior is illustrated in Figure 8, which reveals that dη/dɛxx ≈ 300 at Ts.
FIGURE 7
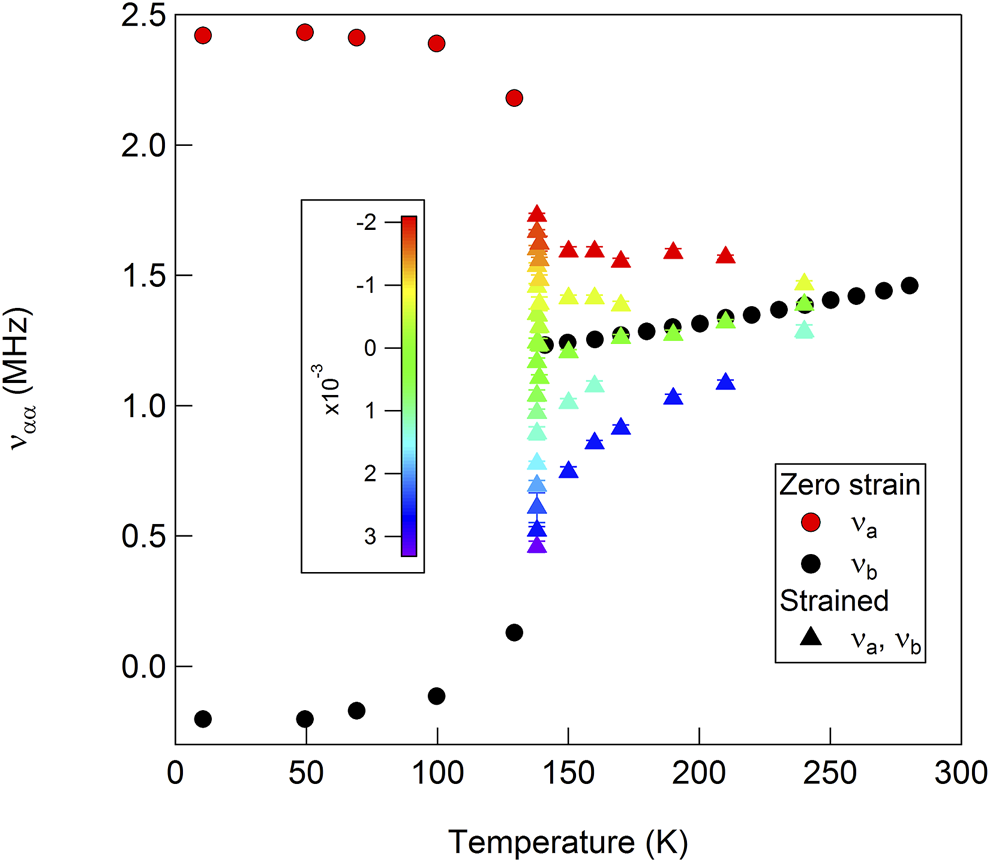
The As EFG components, νa = νxx and νb = νyy, as a function of temperature and uniaxial strain. The color bar indicates ɛxx. The circles are the measured values from [18].
FIGURE 8
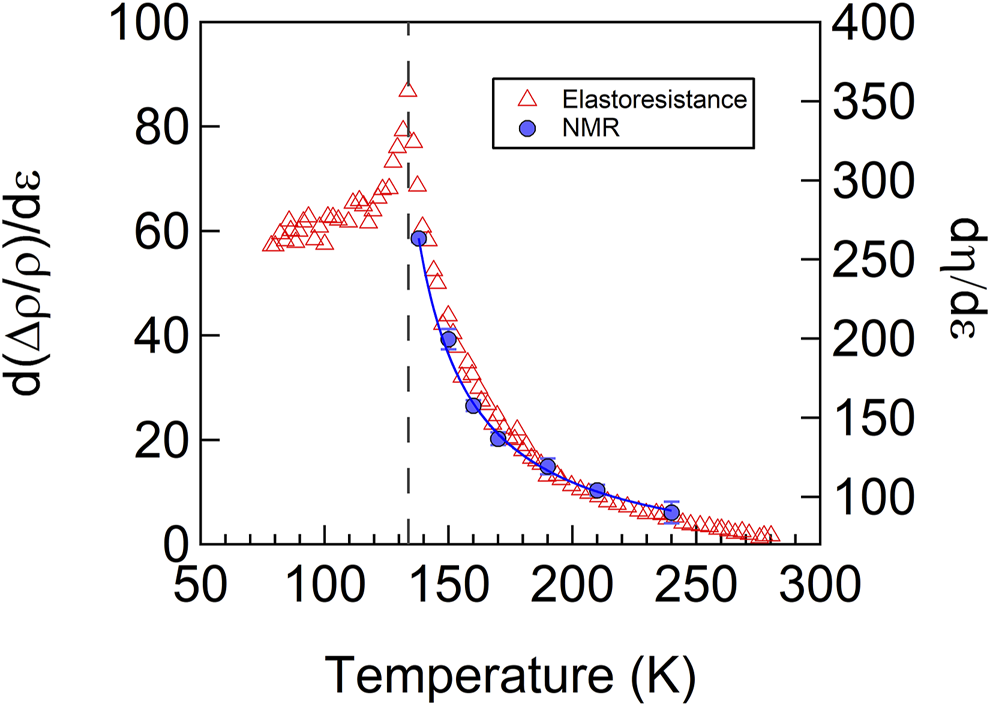
The nematic susceptibility measured by the EFG asymmetry parameter, η and via elastoresistance measurements in BaFe2As2. The solid line is a fit to a Curie-Weiss expression. Reproduced from [32].
Uniaxial stress has also been utilized to study the NMR spectra in LaFeAsO and FeSe [23]. In this case, compressive stress on the order of 10–20 MPa was applied by tightening a screw. A similar approach in which a crystal is suspended between the prongs of a horseshoe-shaped device was also utilized for NMR studies under tensile strain [52]. Neither approach directly measures the strain, precluding the possibility for feedback control. Moreover, differential thermal contraction may also give rise to finite strain fields even without applied stresses via the tightening screw. Nevertheless, such approaches can be used to mechanically detwin the crystal in the nematic phase [53]. If the crystal is cooled in a finite strain field, then a single nematic domain should nucleate below the transition. For a twinned crystal, there should be two sets of resonances as discussed above in Section 2.3. In detwinned or partially de-twinned crystals, the relative intensity changes. In FeSe, this approach enabled the identification of which resonance corresponds to which domain [23].
3.2 Relaxation Rate
The spin-lattice-relaxation rate varies strongly with uniaxial strain in BaFe2As2, as shown in Figure 9 [15]. Strain enhances the relaxation rate and the effect is anisotropic: the enhancement is stronger for in-plane fields than for out-of-plane fields. The enhancement can be understood qualitatively by realizing that strain enhances the antiferromagnetic ordering temperature, TN, thus for T > TN, the correlation length should grow with increasing strain. The correlation time τc grows with increasing correlation length, thus enhancing as illustrated in Figure 6.
FIGURE 9
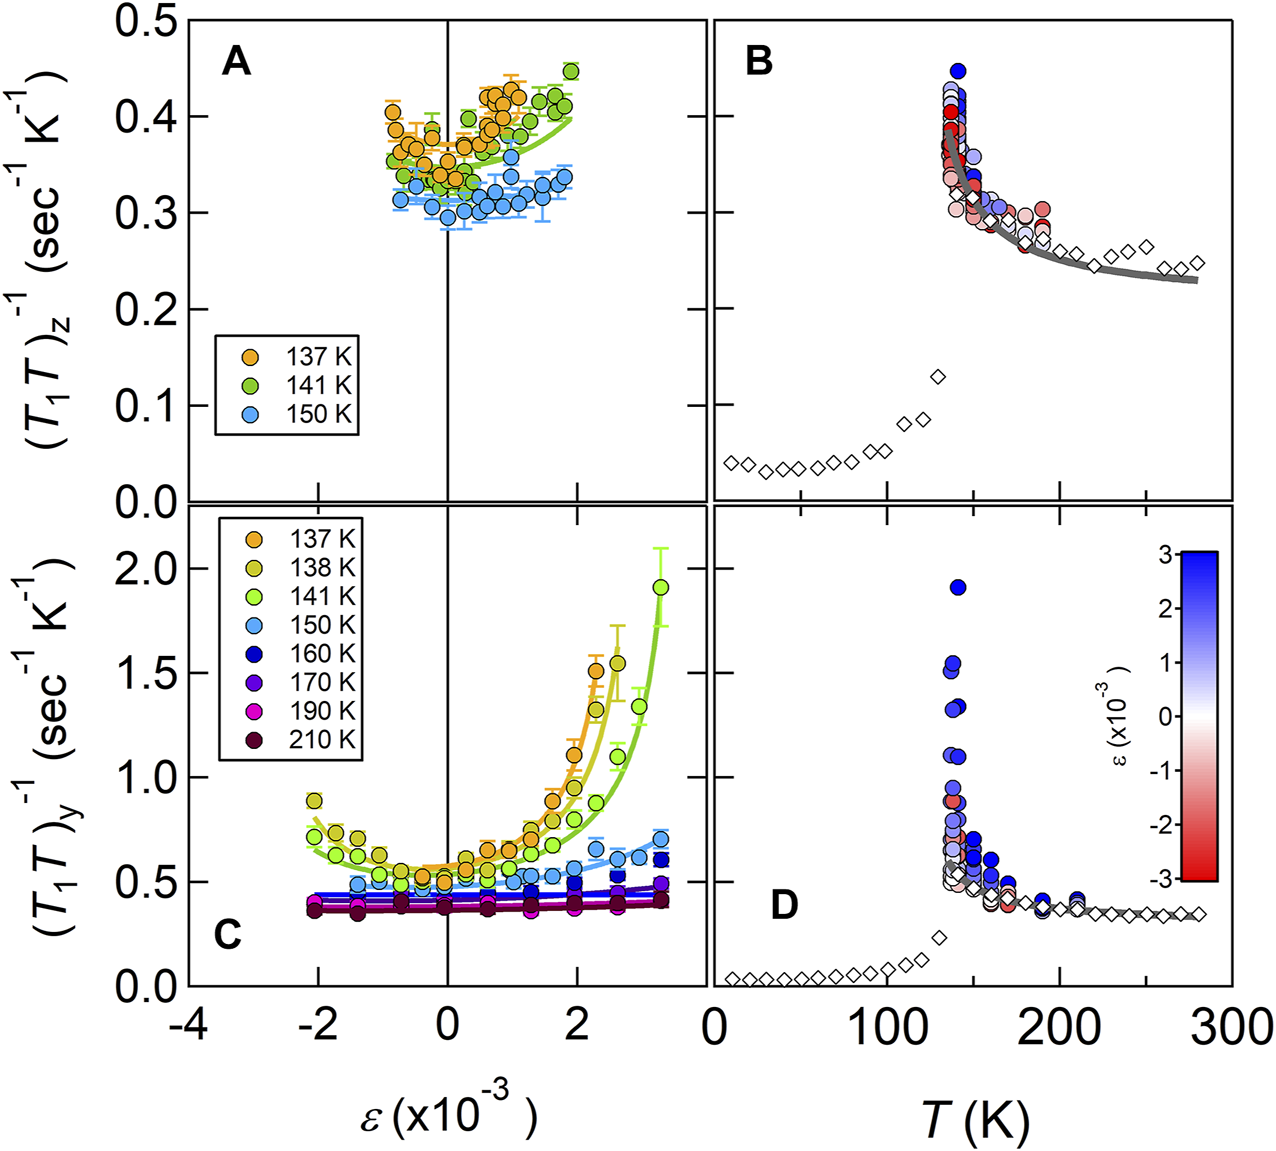
versus strain (A,C) and versus temperature (B,D). The solid lines are fits to the data. The y, z subscripts indicate the direction of the applied magnetic field, H0. Reproduced from [15].
A more complete picture of the nematicity and the antiferromagnetism can be obtained by analyzing the reciprocal-space structure of the spin susceptibility tensor, χαβ(q). In the disordered tetragonal phase, χxx(q) = χyy(q), but in the presence of nematicity these components are no longer equal. In the ordered phase, the susceptibility diverges at the antiferromagnetic ordering wavevectors, Q1 = (π, 0) in one domain, and Q2 = (0, π) in the other domain. A nematic order parameter can defined as [15]. By symmetry, the only non-vanishing components are ϕxy, ϕyx and ϕzz. In the ordered state, only ϕxy condenses, which corresponds to the spins oriented parallel to the antiferromagnetic ordering vector, as shown in the upper row of Figure 2. ϕzz order is illustrated in the second row of Figure 2. In this case, the spins are oriented along the c direction, and the hyperfine field is in-plane. Although this channel does not condense, ϕzz fluctuations are present and contribute to . ϕyx is illustrated in the bottom row, where the spins are oriented in-plane and are perpendicular to the antiferromagnetic ordering vector. For ϕyx order the hyperfine field vanishes, so is insensitive to these types of fluctuations.
The anisotropy of contains key information about these two nematic channels, ϕxy and ϕzz. The fluctuations hα(τ) of the hyperfine field that contribute to the spin-lattice-relaxation rate as described in Eq. 10 are perpendicular to the applied field, H0. If H0 ∥c, then the in-plane fluctuations driven by ϕzz fluctuations will dominate . If H0 ⊥c, then both ϕzz and ϕxy fluctuations will contribute. As seen in Figure 9, measured for H0 ⊥c has a much stronger variation with applied strain. This suggests that ϕzz fluctuations are enhanced under strain more than ϕxy fluctuations. In fact, a detailed analysis of the nematic susceptibilities, and indicates that the latter is largest, despite the fact that ϕxy condenses at zero strain [15]. These results imply that for sufficient strain, the system would order with the spins oriented along the c-axis. This interpretation was recently confirmed by polarized inelastic neutron scattering results [54].
4 Glassy Behavior
4.1 Relaxation
Measurements of the doped pnictides under strain are challenging because the doping introduces both static and dynamic inhomogeneities. The quadrupolar linewidths of the satellites broaden significantly with doping, thus it is more difficult to discern static changes in the resonances due to strain. Measurements of the spin-lattice-relaxation rate are more straightforward and do not require sharp resonances, but doping introduces a distribution of local hyperfine fields and autocorrelation times, τc, so that there is no longer a homogeneous value throughout the bulk of the materials [16].
4.1.1 Stretched Relaxation
Heterogeneous spin lattice relaxation is directly manifest in the behavior of the magnetization and leads to a stretching exponent. In this case, the nuclear magnetization is described by:where M0 is the initial magnetization, Meq is the thermal equilibrium magnetization, and 0 < β ≤ 1 is a stretching exponent [55]. β = 1 corresponds to homogeneous relaxation, but in several doped pnictides β ∼ 0.4–0.9 depending on the doping level and temperature [16, 56–60]. A typical temperature dependence is shown in Figure 10 for x = 0.06. For temperatures greater than approximately 100 K, the relaxation is homogeneous, but below this temperature β decreases from unity to approximately 0.4 at TN. The exponent β is a measure of the width of the distribution of local relaxation rates, , where W1 is the relaxation rate. , is the median of this distribution and β is related to the logarithmic FWHM of [55]. When β = 1, the distribution is a delta function, and as β decreases the width of increases exponentially. Figure 10 indicates that for x = 0.06 just above TN the distribution of relaxation rates is at least two to three orders of magnitude in width. Additionally, the average correlation time, τc, does not have a power law divergence, but rather an activated or Vogel-Fulcher behavior with temperature, which tends to broaden the peak in with temperature, as illustrated in Figure 6.
FIGURE 10
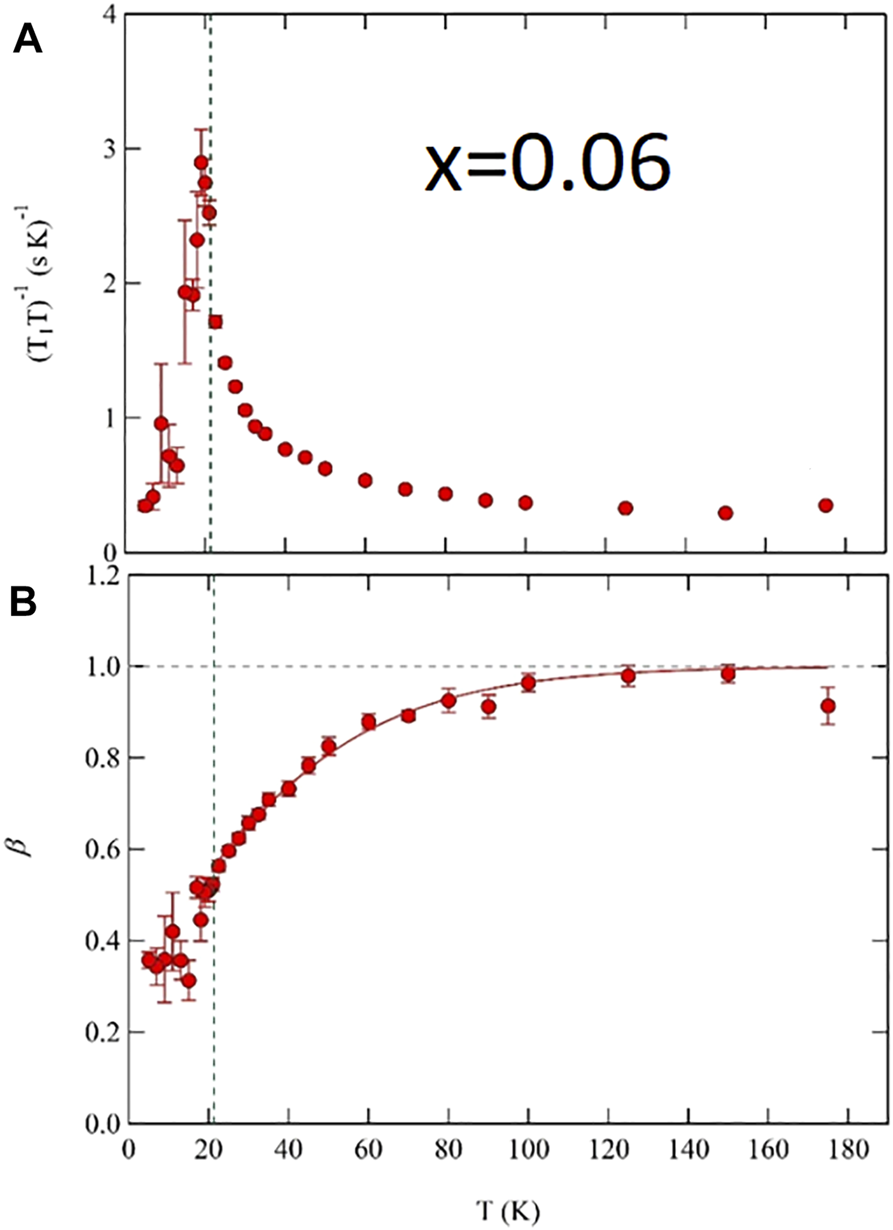
(A) and (B)β versus temperature measured in Ba(Fe1−xCox)2As2 with x = 0.06.
4.1.2 Inverse Laplace Transform
Rather than fitting the magnetization with a stretched exponent, as in Eq. 13, it is possible to fit the data assuming a particular form of . One such approach is via a log-normal distribution, where:
In this case the median of the distribution () is eμ, and the standard deviation is σ1 is roughly inversely proportional to β. The relaxation in the pnictides is well-captured by this form of the distribution [16].
An alternative approach is to extract directly from the data, rather than to assume a particular form. This is known as an inverse Laplace transform (ILT), and has been utilized to investigate a range of correlated electron systems [61–63]. Figure 11 displays representative data set with such a fit, and Figure 12 shows the distribution versus temperature extracted using this approach in Ba(Fe1−xCox)2As2 with x = 0.059. It is clear that both the median and width of this distribution change in the vicinity of TN, and that the width approaches several orders of magnitude. The ILT approach does not make any a priori assumptions about the distribution, and may uncover features that are not captured by Eq. 14. On the other hand, the ILT requires time series data with high a signal-to-noise ratio, a complicated analysis algorithm, and assumptions about the smoothness of the distribution [64]. The distribution shown in Figure 12 exhibits several structures for T ≪ TN that are likely artifacts due to the poor signal to noise at these temperatures. Ultimately, the most meaningful information about the distribution appear to be the median and width, which are well-captured by the stretched exponential approach. Note that although the 75As has I = 3/2 and hence a multi-exponential relaxation form even for homogeneous relaxation, the stretched exponential approach accurately captures the true distribution of relaxation rates, [64].
FIGURE 11
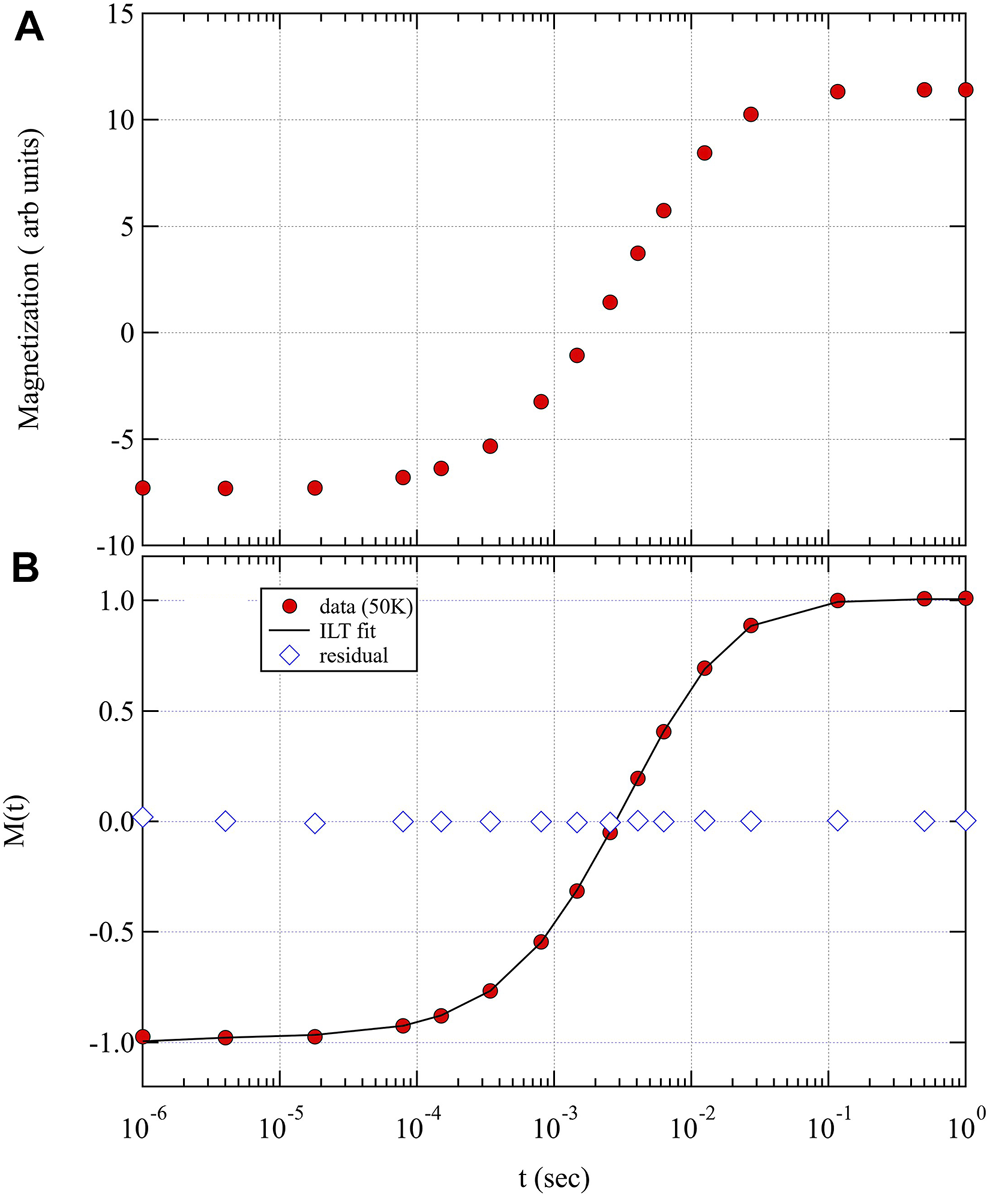
Magnetization versus recovery time measured at 50 K in Ba (Fe1−xCox)2As2 with x = 0.06. Panel (A) shows the raw data, and panel (B) shows the data after normalization such that M(∞) = 1 and M(0) = −1. The solid line shows the fit using the ILT algorithm.
FIGURE 12
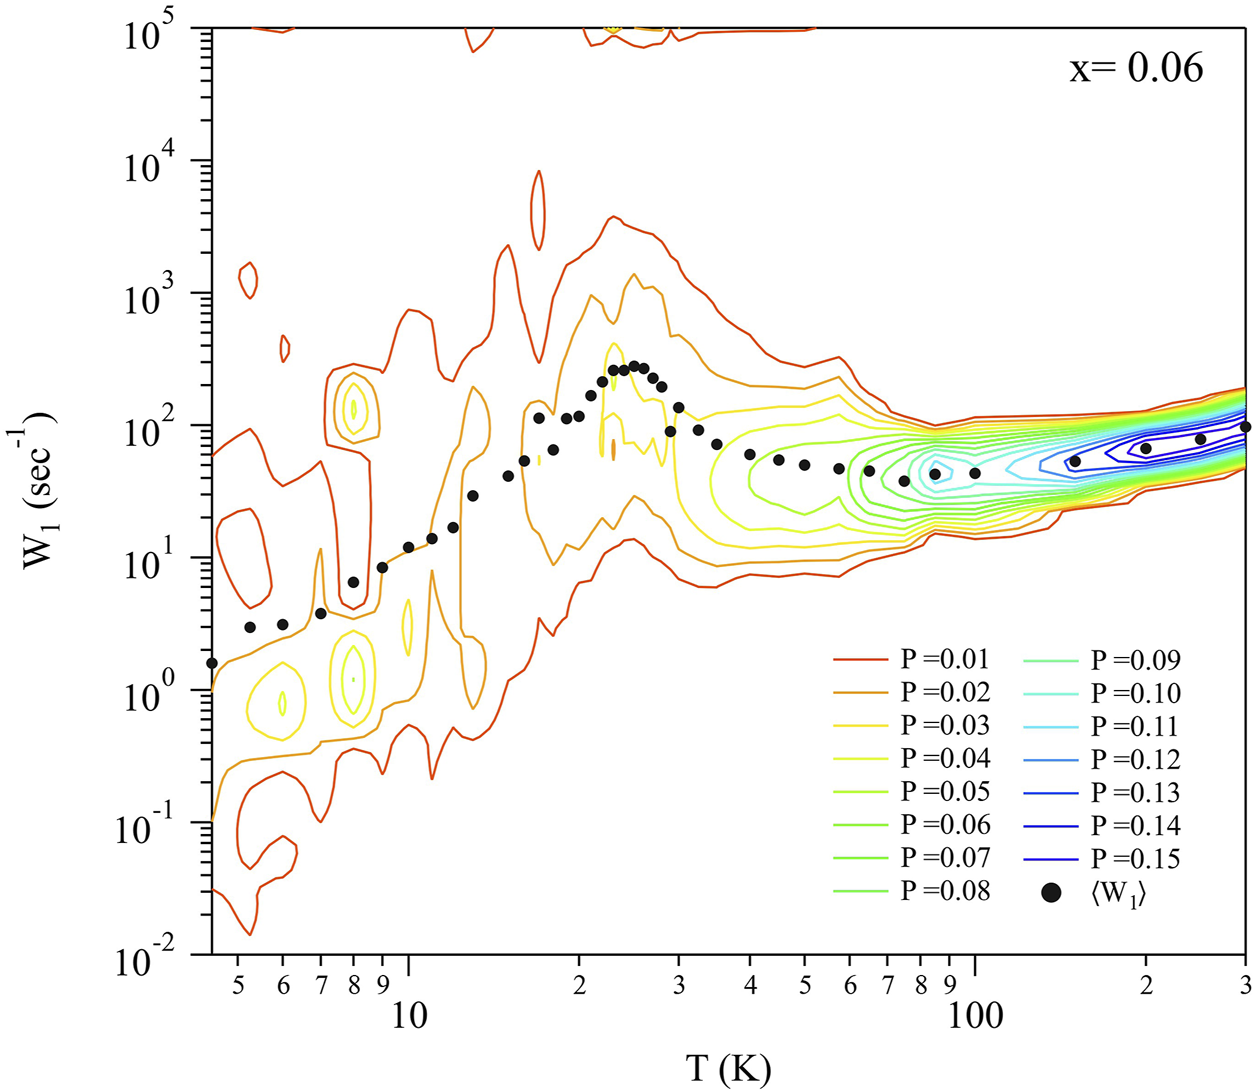
Distribution of relaxation rates, versus temperature shown as contour lines in Ba(Fe1−xCox)2As2 with x = 0.06, extracted by inverse Laplace transform. Contour lines are shown between to 0.15 in intervals of 0.01. The solid black circles shows the median of the distribution at teach temperature. The contributions near 105 sec−1 are artifacts introduced by normalization errors for early recovery times.
4.1.3 Nematicity and Dynamical Heterogeneity
Similar glassy behavior has been observed in the cuprates and been associated with stripe-glass behavior [65–73]. The cuprates, however, are doped Mott insulators, and the glassy behavior was attributed to intrinsic frustration between the competing effects of Coulomb repulsion and charge segregation [74–76]. The iron arsenides do not exhibit charge ordering and thus a different mechanism must be driving the glassy dynamics. This behavior is present for a range of doping levels, and is most pronounced near optimal doping where Tc reaches a maximum. Figure 13 shows a phase diagram for both Cu and Co doping. Like Co, Cu introduces extra electrons but it also suppresses superconductivity [77]. The color scale indicates the standard deviation of a log-normal distribution fit, σ1. As shown in Figure 13, the distribution exhibits the greatest width in the vicinity of a putative nematic quantum critical point near x ∼ 0.07 if there were no superconductivity. This behavior is striking because it bears a similarity to the divergent nematic susceptibility measured by elastoresistance in these materials [7, 8]. In other words, the width of the distribution of relaxation rates correlates with the magnitude of the nematic susceptibility.
FIGURE 13
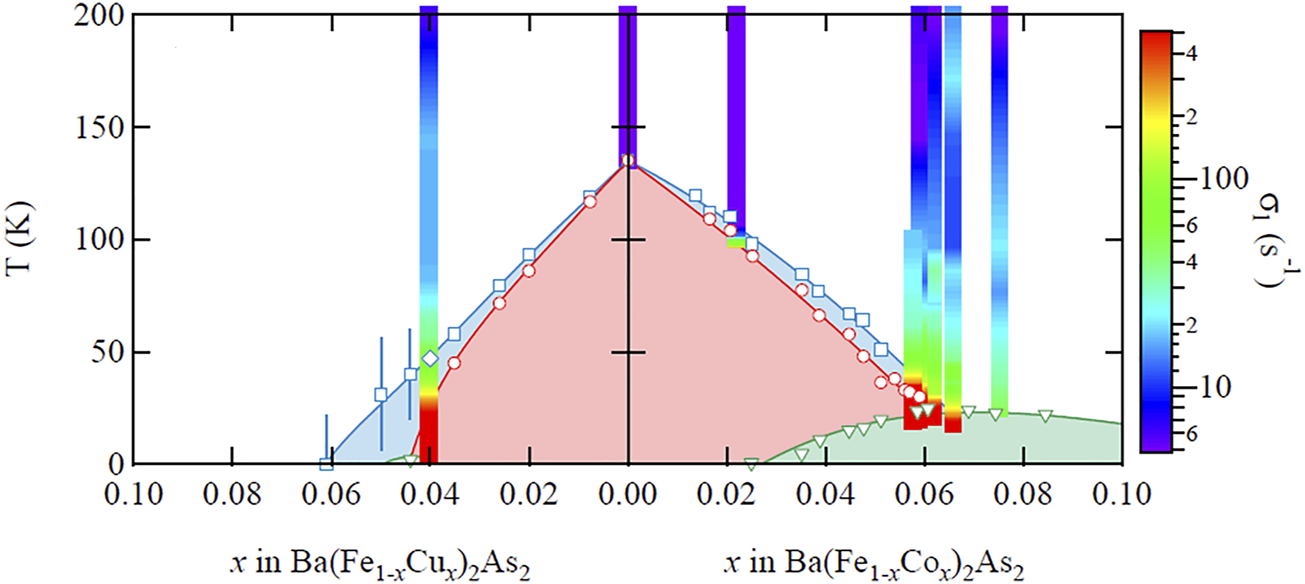
Phase diagram of Ba(Fe1−xCux)2As2 and Ba(Fe1−xCox)2As2 with the width of the distribution, σ1 shown as the color scale. The blue diamonds represent Ts, the red circles represent TN, and the green triangles represent Tc. Reproduced from [16].
What is the origin of this glassy behavior, and is there a physical connection with the nematic susceptibility? A compelling hypothesis is that the dopants introduce quenched random strain fields that couple to the nematic order parameter and give rise to a distribution of local correlation times, τc. Local strains can nucleate different nematic domains, even in absence of long range nematic order. The result is a nematic glass, in which a distribution of local nematic domains (with different orientations) exist throughout the sample, each fluctuating with a different correlations times. These nematic fluctuations in turn drive spin fluctuations that are reflected in the distribution .
Another hypothesis for the inhomogeneous dynamics is that static inhomogeneity of the EFG and Knight shift tensors induced by the dopants suppresses spin diffusion among the nuclear spins, so that they do not all relax with a common spin temperature. In principle, dipolar interactions between neighboring nuclear spins I1 and I2 may contain terms such as , which can give rise to mutual spin flips [78]. This effect could enable nuclei in regions that exhibit fast relaxation to transfer polarization with those in regions with slow relaxation, giving rise to a more homogeneous relaxation throughout the sample. If the static EFG and Knight shift tensors vary spatially, however, then mutual spin flips between neighbors would not conserve energy. In fact, spin diffusion should behave differently for a spin-1/2 versus a spin-3/2 nucleus. For the latter there are only six out of sixteen possible configurations where the two neighbors can undergo a mutual spin flip while conserving energy, whereas there are two out of four possibilities for the former. Thus spin-diffusion should be suppressed for 75As relative to 31P, and thus one might expect β to be closer to unity for the spin-1/2 31P. In fact, both sites exhibit similar values of β at all temperatures in BaFe2(As,P)2 [43]. These results suggest, therefore, that spin diffusion does not play a significant role in the observed glassy dynamics.
4.1.4 Edwards-Anderson Parameter
In a recent paper, Wiecki and collaborators pointed out that the NMR linewidth of 77Se in FeSe is directly proportional to the Edwards-Anderson parameter in a random-field Ising model of the nematicity [42]. Crystal defects provide local strain fields, hi, at site i, and the enhanced nematic susceptibility gives rise to large spatial variations of local nematicity, ϕi(hi) (we drop the distinction between ϕxy, ϕyx and ϕzz for simplicity). In this case, the Knight shift is known to vary linearly with ϕ, and the second moment of the NMR spectrum is directly proportional to the Edwards-Anderson parameter: , where the brackets indicate a thermal average and the overbar indicates an average over disorder configurations.
A similar approach can be utilized to analyze the distribution of relaxation rates, . In undoped BaFe2As2, the spin lattice relaxation rate is a function of the nematic order parameter:where α depends the correlation length, and is hence strongly temperature dependent [15]. In the doped system, we can model the distribution of relaxation rates by assuming a distribution of local strain fields, so that:where pσ(hj) is the disorder distribution [42]. The second moment of is , thus the second moment of the distribution measures the Edwards-Anderson order parameter.
As shown in Figure 13, σ1 is a strong function of temperature and doping. The magnitude of this quantity is given in part by the coefficient α, reflecting the growth of antiferromagnetic fluctuations. Note, however, that σ1 would be zero if qEA = 0. In other words, σ1 is finite because the Edwards-Anderson parameter is non-zero, which indicates the presence of a nematic glass. Higher order corrections to the relationship between W1 and strain, and the presence of other strain channels due the dopant atoms, are likely to modify the quantitative relationship between σ1 and qEA, and these issues should be addressed in future theoretical work.
4.2 Response to Strain
In principle, an external strain field of sufficient magnitude might overcome the local strain fields and give rise to more homogeneous relaxation. This hypothesis was tested in Ba(Fe1−xCox)2As2 with x = 0.048 under tensile strain [52]. Although the magnitude of changed in response to the strain field, no changes were observed to the stretching exponent. This observation suggests that the intrinsic strains around the dopants exceed the homogeneous external strain, so that remains unchanged under strain. In fact, the lattice strain around Co dopants in Ba(Fe1−xCox)2As2 can reach several percent [79]. The applied strain was only a fraction of a percent, thus it is not surprising that no change was observed in the width of the distribution.
4.3 Strain Hysteresis
Although the width of the does not change with externally applied strain, the median of the distribution does, and in a manner that depends on the strain history. Figure 14 illustrates a protocol to investigate such hysteretic effects. A crystal is strain-cooled either under compressive (or tensile) strain from room temperature down to a base temperature. The spin lattice relaxation is then measured for a series of different levels of increasing (or decreasing) strain at constant temperature. The sample is then returned to room temperature (where the relaxation is homogeneous and there is no glassy behavior), and then the process is repeated under the opposite direction. For a fully linear response, the spin lattice relaxation as a function of strain should be independent of whether it was tensile-cooled or compressive-cooled.
FIGURE 14
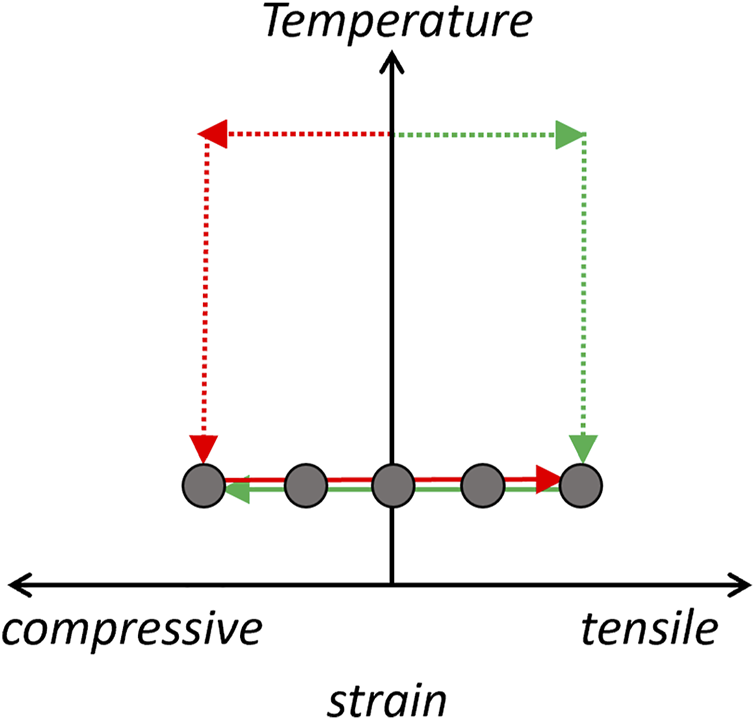
Protocol for strain hysteresis measurements. The sample is first cooled (red arrows) in a compressive strain field from room temperature. Spin lattice relaxation measurements are then conducted at several different increasing strain levels as the displacement increases. The sample is then returned to room temperature and zero strain. Finally the sample is strain cooled under tensile strain to the same base temperature and measurements are conducted for several values of decreasing displacement. Figure 15 compares the measured values for both protocols for various temperatures.
Figure 15 shows the results of such a study on Ba(Fe1−xCox)2As2 for four different base temperatures for x = 0.059. As expected, β decreases as temperature is reduced, but remains independent of the applied strain, and is the same for both tensile- and compressive-cooling. On the other hand, the median of the distribution, , is strain-dependent and is different under the two strain conditions at low temperature.
FIGURE 15
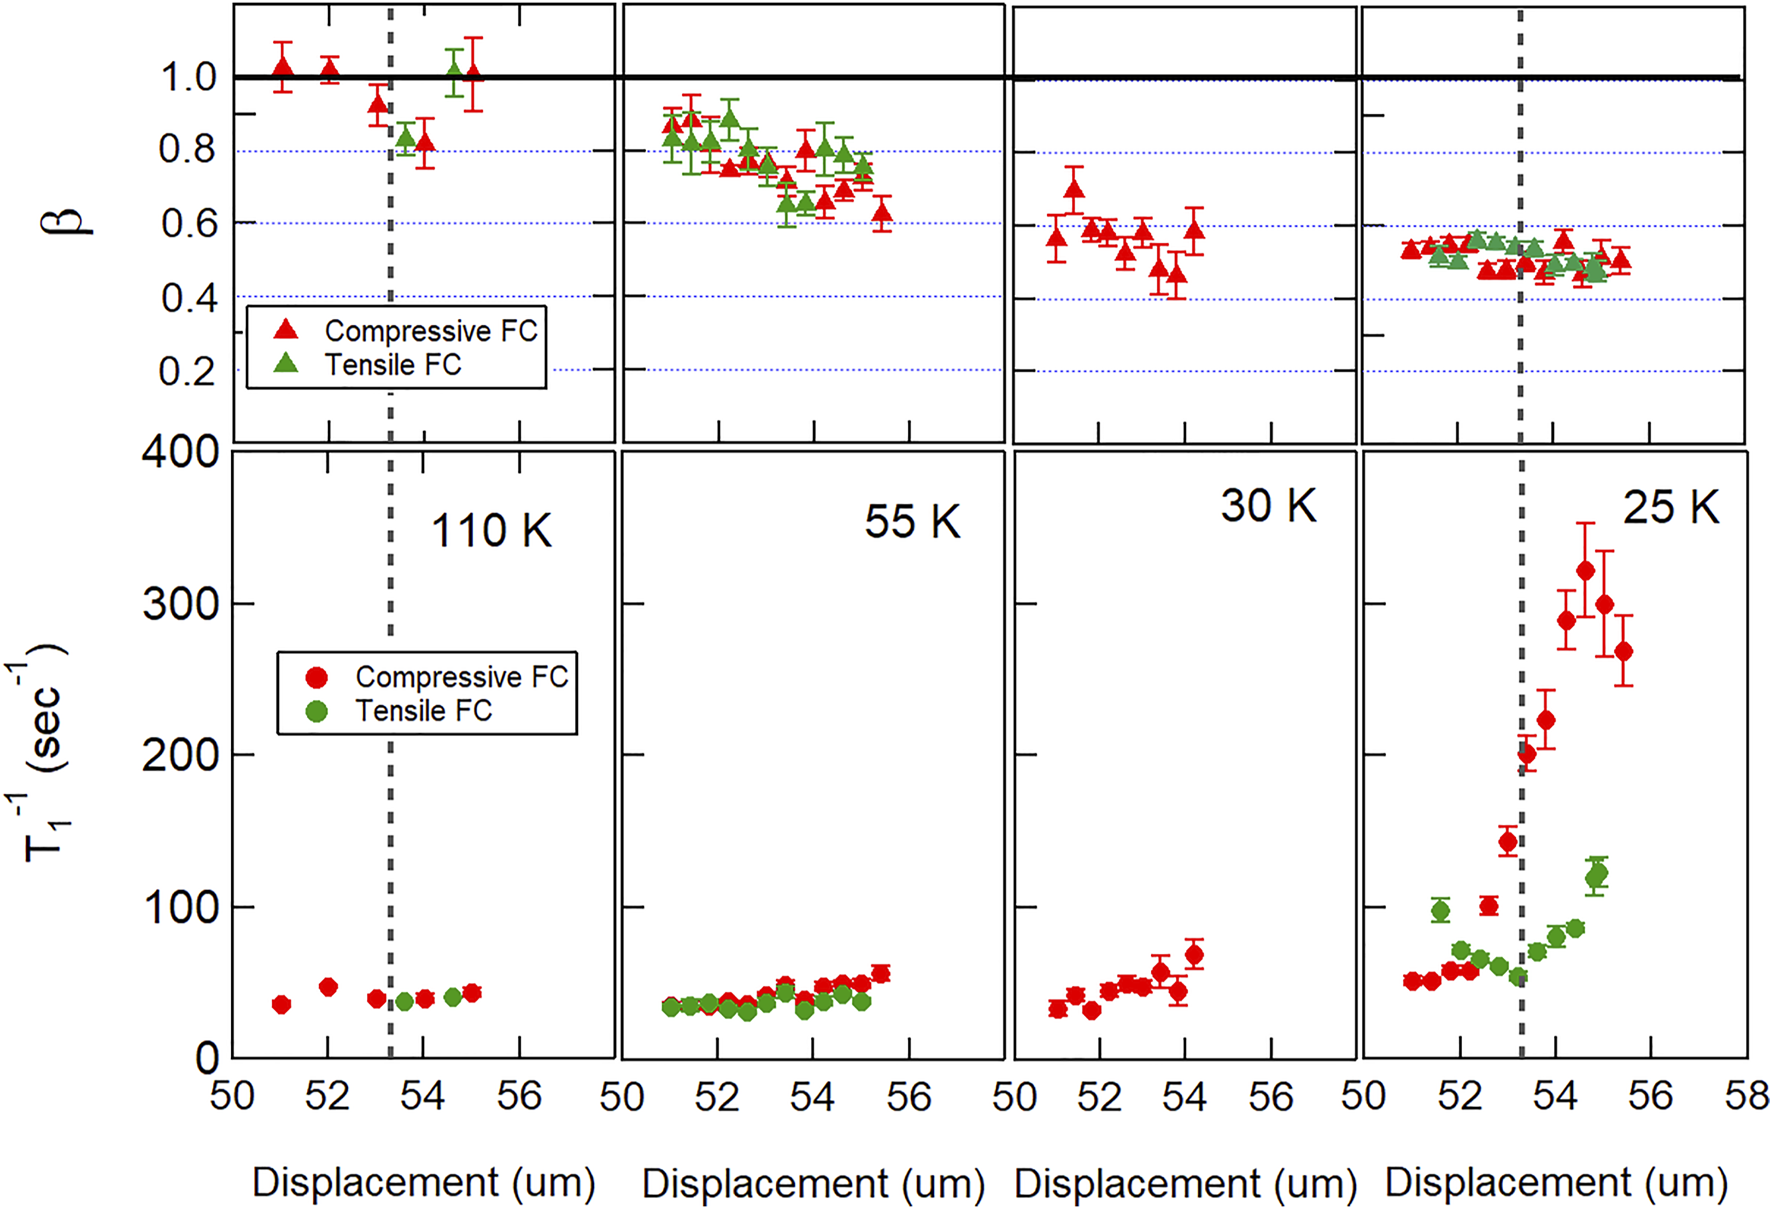
and β versus displacement for several different temperatures in Ba(Fe1−xCox)2As2 with x = 0.059. The red and green points represent data obtained during compressive field cooled and tensile field cooled protocols, as illustrated in Figure 14.
Note that the horizontal axes in Figure 15 are displacement, not strain. Strain is defined as ɛ = (d − d0)/L, where d is the displacement of the capacitative dilatometer, d0 is the equilibrium unstrained displacement, and L is the sample length. d0 can be determined at room temperature, but thermal contractions of both the sample and the strain device make it difficult to determine d0 under cryogenic conditions. It is best to utilize an independent measure of strain, such as the EFG tensor discussed in Section 3.1, to find the displacement corresponding to ɛ = 0. Such a calibration was not possible for the measurements in Figure 15. It is also important to note that the level of strain during the cooling part of the protocol in Figure 14 is likely temperature-dependent, rather than constant as illustrated. Again, this is due to differential thermal contractions between the sample and the strain device. The displacement measured by the dilatometer is the quantity that is held constant.
Despite these complications, these measurements reveal that , and presumably the distribution of local nematic domains, depends on the past history of applied strain. Hysteresis is commonly observed in ordered ferromagnets, in which the static bulk magnetization is hysteretic with the applied field. If the applied field exceeds the coercive field, the magnetization will saturate, and when the applied field is reduced to zero, a remnant magnetization remains. Similar behavior should be expected in an ordered nematic without quenched disorder, in which nematic domains can reorient in an external strain field [80]. The NMR measurements described here, on the other hand, are in a nematic glass phase with quenched disorder, and probe the distribution of local correlation times of different fluctuating domains. Hysteresis has been studied in magnetic materials with quenched disorder in both the weak-disorder limit in the paramagnetic phase, as well in the strong-disorder limit in the spin glass phase [81]. The particular domain pattern is likely determined by the combination of local strains and the external strain field applied during the cool down. The fluctuation time of the domains is a complicated function of these strain fields as well as the behavior of their neighboring nematic domains. As the external strain field changes, the local correlation times change, but in such a manner that the median of the distribution of correlation times changes, but not the standard deviation. If the system were homogenous and not glassy, then the nematic domains would be mobile and there would be a single average correlation time. The presence of a distribution of correlation times that is altered by external strain provides evidence for the formation of a nematic glass, in which some domains exhibit very large correlation times, whereas others have short correlation times and may be reoriented by small external strain fields.
4.4 Theoretical Models
A quantitative theory to connect the measured distribution of the spin-lattice-relaxation rate, , to the nematic domains and their dynamics in the presence of external strain, particularly in the context of the iron pnictides, is highly desirable. Although no such theory yet exists, there are important models that capture elements of the glassy behavior in these materials. Nematic ordering in the presence of random strain fields can be mapped onto the random field Ising model (RFIM) [80, 82, 83]. Detailed numerical simulations have uncovered a broad distribution of local correlation times, which agrees qualitatively with the observations of stretched relaxation in NMR experiments [16].
On the other hand, the iron pnictides exhibit both antiferromgnetism and nematicity, and there are two types of spin order for each of two possible nematic domains, as illustrated in Figure 2. Recently, a random Baxter-field model was proposed as an alternative to capture both the nematic and antiferromagnetic fluctuations in the presence of quenched random strain fields [84]. In this case, there are two Ising variables at each lattice site associated with the magnetic and the nematic degree of freedom. These two variables are coupled due to the next nearest neighbor coupling, J2, in the J1 − J2 model for the iron pnictides [4]. Random strain fields couple only to the nematic degree of freedom, but the magnetic variable is also affected and consequently the system breaks up into domains of all four configurations illustrated in the top row of Figure 2.
5 Summary and Conclusion
NMR is a powerful tool to investigate nematicity in the iron based superconductors, providing microscopic insight in the local antiferromagnetic and nematic order parameters. Investigations of the NMR response to uniaxial strain in BaFe2As2 and FeSe have revealed important information about the anisotropy of the dynamical and static spin susceptibilities. In particular, the temperature dependence of the spin fluctuations under strain reflect an unusual piezomagnetic response in which the antiferromagnetically ordered spins can change their orientation direction under sufficient strain.
The doped pnictides have been less studied under strain because static and dynamical heterogeneity present in these materials render interpretation of results more difficult. Strain fields surrounding dopants create random fields that couple to the nematic order parameter, which may have a large response at low temperature. As a result, the NMR spectra broaden significantly, reflecting a distribution of static EFGs, some of which may indicate static local nematic order. More importantly, the NMR spin lattice relaxation rate reveals a broad distribution of local spin fluctuations that gradually freeze out at lower temperatures. This distribution likely reflects the correlated nematic fluctuations breaking up into spatial domains in a nematic glass. This distribution depends on the history of the strain field, but remains broad even at the highest uniaxial strain levels applied. These results suggest that quenched disorder creates large random strain fields.
Future studies on other doped materials may shed important light on the nature of the nematic glass. For example, hole doping by substituting Ba with K may introduce milder levels of local strain fields, in which case external strain might be able to induce homogeneous relaxation. Studies of static hysteretic behavior with strain in the ordered nematic phase may also shed important light on the mesoscopic physics of the domain formation, the coercive strain fields, and remnant nematicity. Unfortunately, NMR studies under strain require small crystals, and the NMR signal in doped samples tends to be suppressed due to the same glassy physics giving rise to the stretched relaxation. These effects conspire to make such experiments on doped samples particularly challenging.
Statements
Data availability statement
The raw data supporting the conclusion of this article will be made available by the authors, without undue reservation.
Author contributions
TK acquired the NMR data on crystals grown and characterized by MT, RP, SB and PC, and NC conceived the experiments and wrote the manuscript.
Funding
Work at UC Davis was supported by the NSF under Grant No. DMR-1807889, and the UC Laboratory Fees Research Program (LFR-20-653926). Work at Ames Lab (PC, SB, RP, MT for growth and basic characterization of samples) was supported by the U.S. Department of Energy, Office of Basic Energy Science, Division of Materials Sciences and Engineering. Ames Laboratory is operated for the U.S. Department of Energy by Iowa State University under Contract No. DE-AC02-07CH11358.
Acknowledgments
We thank Erica Carlson, Karin Dahmen, Stylianos Gregoriou, Lamei Nie and Rafael Fernandes for stimulating discussions.
Conflict of interest
The authors declare that the research was conducted in the absence of any commercial or financial relationships that could be construed as a potential conflict of interest.
Publisher’s note
All claims expressed in this article are solely those of the authors and do not necessarily represent those of their affiliated organizations, or those of the publisher, the editors and the reviewers. Any product that may be evaluated in this article, or claim that may be made by its manufacturer, is not guaranteed or endorsed by the publisher.
References
1.
FradkinEKivelsonSALawlerMJEisensteinJPMackenzieAP. Nematic Fermi Fluids in Condensed Matter Physics. Annu Rev Condens Matter Phys (2010) 1:153–78. 10.1146/annurev-conmatphys-070909-103925
2.
KivelsonSAFradkinEEmeryVJ. Electronic Liquid-crystal Phases of a Doped Mott Insulator. Nature (1998) 393:550–3. 10.1038/31177
3.
VojtaM. Lattice Symmetry Breaking in Cuprate Superconductors: Stripes, Nematics, and Superconductivity. Adv Phys (2009) 58:699–820. 10.1080/00018730903122242
4.
FernandesRMChubukovAVSchmalianJ. What Drives Nematic Order in Iron-Based Superconductors?Nat Phys (2014) 10:97–104. 10.1038/nphys2877
5.
BaekS-HEfremovDVOkJMKimJSvan den BrinkJBüchnerB. Orbital-driven Nematicity in FeSe. Nat Mater (2015) 14:210–4. 10.1038/nmat4138
6.
CominRDamascelliA. Resonant X-ray Scattering Studies of Charge Order in Cuprates. Annu Rev Condens Matter Phys (2016) 7:369–405. 10.1146/annurev-conmatphys-031115-011401
7.
KuoH-HChuJ-HPalmstromJCKivelsonSAFisherIR. Ubiquitous Signatures of Nematic Quantum Criticality in Optimally Doped Fe-Based Superconductors. Science (2016) 352:958–62. 10.1126/science.aab0103
8.
ChuJ-HKuoH-HAnalytisJGFisherIR. Divergent Nematic Susceptibility in an Iron Arsenide Superconductor. Science (2012) 337:710–2. 10.1126/science.1221713
9.
MaierTAScalapinoDJ. Pairing Interaction Near a Nematic Quantum Critical point of a Three-bandCuO2model. Phys Rev B (2014) 90:174510. 10.1103/PhysRevB.90.174510
10.
SchattnerYLedererSKivelsonSABergE. Ising Nematic Quantum Critical point in a Metal: A Monte Carlo Study. Phys Rev X (2016) 6:031028. 10.1103/PhysRevX.6.031028
11.
LedererSSchattnerYBergEKivelsonSA. Superconductivity and Non-fermi Liquid Behavior Near a Nematic Quantum Critical point. Proc Natl Acad Sci U.S.A (2017) 114:4905–10. 10.1073/pnas.1620651114
12.
MalinowskiPJiangQSanchezJJMutchJLiuZWentP. Suppression of Superconductivity by Anisotropic Strain Near a Nematic Quantum Critical point. Nat Phys (2020) 16:1189–93. 10.1038/s41567-020-0983-9
13.
LedererSBergEKimEA. Tests of Nematic-Mediated Superconductivity Applied to Ba1−xSrxNi2As2. Phys Rev Res (2020) 2:023122. 10.1103/physrevresearch.2.023122
14.
CarrettaPPrandoG. Iron-based Superconductors: Tales from the Nuclei. La Rivista Del Nuovo Cimento (2020) 43:1–43. 10.1007/s40766-019-0001-1
15.
KissikovTSarkarRLawsonMBushBTTimmonsEITanatarMAet alUniaxial Strain Control of Spin-Polarization in Multicomponent Nematic Order of BaFe2As2. Nat Commun (2018) 9:1058. 10.1038/s41467-018-03377-8
16.
DioguardiAPLawsonMMBushBTCrockerJShirerKRNissonDMet alNMR Evidence for Inhomogeneous Glassy Behavior Driven by Nematic Fluctuations in Iron Arsenide Superconductors. Phys Rev B (2015) 92:165116. 10.1103/PhysRevB.92.165116
17.
LideD. CRC Handbook of Chemistry and Physics, 2000-2001. Boca Raton: CRC Press (2000).
18.
KitagawaKKatayamaNOhgushiKYoshidaMTakigawaM. Commensurate Itinerant Antiferromagnetism in BaFe2As2: 75As-NMR Studies on a Self-Flux Grown Single crystal. J Phys Soc Jpn (2008) 77:114709. 10.1143/JPSJ.77.114709
19.
SmeraldAShannonN. Angle-resolved NMR: Quantitative Theory of 75As T1 Relaxation Rate in BaFe2As2. Phys Rev B (2011) 84:184437. 10.1103/PhysRevB.84.184437
20.
O’HalloranJAgterbergDFChenMXWeinertM. Stabilizing the Spin Vortex crystal Phase in Two-Dimensional Iron-Based Superconductors. Phys Rev B (2017) 95:075104. 10.1103/PhysRevB.95.075104
21.
MeierWRDingQPKreyssigABud’koSLSapkotaAKothapalliKet alHedgehog Spin-Vortex crystal Stabilized in a Hole-Doped Iron-Based Superconductor. npj Quan Mater (2018) 3. 10.1038/s41535-017-0076-x
22.
DioguardiAPapRoberts WarrenNShockleyACBud’koSLNiNCanfieldPCet alLocal Magnetic Inhomogeneities Observed via 75As NMR in Ba(Fe1−xNix)2As2 with H0 ⊥ C-axis. J Phys Conf Ser (2012) 344:012022. 10.1088/1742-6596/344/1/012022
23.
ZhouRSchererDDMayaffreHToulemondePMaMLiYet alSingular Magnetic Anisotropy in the Nematic Phase of FeSe. npj Quan Mater (2020) 5:93. 10.1038/s41535-020-00295-1
24.
HeMWangLAhnFHardyFWolfTAdelmannPet alDichotomy between In-Plane Magnetic Susceptibility and Resistivity Anisotropies in Extremely Strained BaFe2As2. Nat Commun (2017) 8. 10.1038/s41467-017-00712-3
25.
ZhouRXingLYWangXCJinCQZhengG. Orbital Order and Spin Nematicity in the Tetragonal Phase of the Electron-Doped Iron Pnictides NaFe1−xCoxAs. Phys Rev B (2016) 93:060502. 10.1103/PhysRevB.93.060502
26.
HeMWangLHardyFXuLWolfTAdelmannPet alEvidence for Short-Range Magnetic Order in the Nematic Phase of FeSe from Anisotropic In-Plane Magnetostriction and Susceptibility Measurements. Phys Rev B (2018) 97:104107. 10.1103/physrevb.97.104107
27.
JiangKHuJDingHWangZ. Interatomic Coulomb Interaction and Electron Nematic Bond Order in FeSe. Phys Rev B (2016) 93:115138. 10.1103/PhysRevB.93.115138
28.
ChristensenMHFernandesRMChubukovAV. Orbital Transmutation and the Electronic Spectrum of FeSe in the Nematic Phase. Phys Rev Res (2020) 2:013015. 10.1103/PhysRevResearch.2.013015
29.
LongXZhangSWangFLiuZ. A First-Principle Perspective on Electronic Nematicity in FeSe. npj Quan Mater (2020) 5. 10.1038/s41535-020-00253-x
30.
BartlettJMSteppkeAHosoiSNoadHParkJTimmCet alRelationship between Transport Anisotropy and Nematicity in FeSe. Phys Rev X (2021) 11:021038. 10.1103/physrevx.11.021038
31.
IyeTJulienMHMayaffreHHorvatic̈MBerthierCIshidaKet alEmergence of Orbital Nematicity in the Tetragonal Phase of BaFe2(As1−xPx)2. J Phys Soc Jpn (2015) 84:043705. 10.7566/JPSJ.84.043705
32.
KissikovTSarkarRLawsonMBushBTTimmonsEITanatarMAet alLocal Nematic Susceptibility in Stressed BaFe2As2 from NMR Electric Field Gradient Measurements. Phys Rev B (2017) 96:241108. (R). 10.1103/physrevb.96.241108
33.
DioguardiAPCrockerJShockleyACapRoberts WarrenNLinCShirerKRet alAngular Dependent 75As NMR Study of the Electric Field Gradient in CaFe2As2. Supercond Sci Technol (2013) 26:025012. 10.1088/0953-2048/26/2/025012
34.
KawasakiSTabuchiTWangXFChenXHqing ZhengG. Pressure-induced Unconventional Superconductivity Near a Quantum Critical point in CaFe2As2. Supercond Sci Technol (2010) 23:054004. 10.1088/0953-2048/23/5/054004
35.
MaLJiGFDaiJSahaSRPaglioneJYuW. Quenched Fe Moment in the Collapsed Tetragonal Phase of Ca1−xPrxFe2As2. Chin Phys B (2012) 22:057401. 10.1088/1674-1056/22/5/057401
36.
KitagawaKKatayamaNOhgushiKTakigawaM. Antiferromagnetism of SrFe2As2 Studied by Single-crystal 75As-NMR. J Phys Soc Jpn (2009) 78:063706. 10.1143/JPSJ.78.063706
37.
BaekSHCurroNJKlimczukTBauerEDRonningFThompsonJD. First-order Magnetic Transition in Single-Crystalline CaFe2As2 Detected by As-75 Nuclear Magnetic Resonance. Phys Rev B (2009) 79. 10.1103/PhysRevB.79.052504
38.
BaekSHLeeHBrownSECurroNJBauerEDRonningFet alNMR Investigation of Superconductivity and Antiferromagnetism in CaFe2As2 under Pressure. Phys Rev Lett (2009) 102. 10.1103/PhysRevLett.102.227601
39.
NingFLAhilanKImaiTSefatASMcGuireMASalesBCet alContrasting Spin Dynamics between Underdoped and Overdoped Ba(Fe1−xCox)2As2. Phys Rev Lett (2010) 104:037001. 10.1103/PhysRevLett.104.037001
40.
ToyodaMIchikawaAKobayashiYSatoMItohM. In-plane Anisotropy of the Electric Field Gradient in Ba(Fe1−xCox)2As2 NMR. Phys Rev B (2018) 97:174507. 10.1103/PhysRevB.97.174507
41.
WieckiPNandiMBöhmerAEBud’koSLCanfieldPCFurukawaY. NMR Evidence for Static Local Nematicity and its Cooperative Interplay with Low-Energy Magnetic Fluctuations in FeSe under Pressure. Phys Rev B (2017) 96:180502. 10.1103/PhysRevB.96.180502
42.
WieckiPZhouRJulienMHBöhmerAESchmalianJ. Edwards-Anderson Parameter and Local Ising Nematicity in FeSe Revealed via NMR Spectral Broadening. Phys Rev B (2021) 104:125134. 10.1103/PhysRevB.104.125134
43.
DioguardiAPKissikovTLinCHShirerKRLawsonMMGrafeHJet alNMR Evidence for Inhomogeneous Nematic Fluctuations in BaFe2(As1−xPx)2. Phys Rev Lett (2016) 116:107202. 10.1103/PhysRevLett.116.107202
44.
YiMLuDHMooreRGKihouKLeeCHIyoAet alElectronic Reconstruction through the Structural and Magnetic Transitions in Detwinned NaFeAs. New J Phys (2012) 14:073019. 10.1088/1367-2630/14/7/073019
45.
SuterAMaliMRoosJBrinkmannD. Mixed Magnetic and Quadrupolar Relaxation in the Presence of a Dominant Static Zeeman Hamiltonian. J Phys Condens Matter (1998) 10:5977. 10.1088/0953-8984/10/26/022
46.
SuterAMaliMRoosJBrinkmannD. Separation of Quadrupolar and Magnetic Contributions to Spin–Lattice Relaxation in the Case of a Single Isotope. J Magn Reson (2000) 143:266–73. 10.1006/jmre.1999.1990
47.
SuterAMaliMRoosJBrinkmannD. Charge Degree of freedom and the Single-Spin Fluid Model inYBa2Cu4O8. Phys Rev Lett (2000) 84:4938–41. 10.1103/physrevlett.84.4938
48.
VinogradIShirerKRMassatPWangZKissikovTGarciaDet alSecond Order Zeeman Interaction and Ferroquadrupolar Order in TmVO4. arXiv:2112.05859 (2021).
49.
NakaiYIyeTKitagawaSIshidaKIkedaHKasaharaSet alUnconventional Superconductivity and Antiferromagnetic Quantum Critical Behavior in the Isovalent-Doped BaFe2(As1−xPx)2. Phys Rev Lett (2010) 105:107003. 10.1103/PhysRevLett.105.107003
50.
HicksCWBarberMEEdkinsSDBrodskyDOMackenzieAP. Piezoelectric-based Apparatus for Strain Tuning. Rev Sci Instrum (2014) 85:065003. 10.1063/1.4881611
51.
KissikovTSarkarRBushBTLawsonMCanfieldPCCurroNJ. Nuclear Magnetic Resonance Probe Head Design for Precision Strain Control. Rev Sci Instrum (2017) 88:103902. 10.1063/1.5002631
52.
KissikovTDioguardiAPTimmonsEITanatarMAProzorovRBud’koSLet alNMR Study of Nematic Spin Fluctuations in a Detwinned Single crystal of Underdoped Ba(Fe2−xCox)2As2. Phys Rev B (2016) 94:165123. 10.1103/PhysRevB.94.165123
53.
TanatarMABlombergECKreyssigAKimMGNiNThalerAet alUniaxial-strain Mechanical Detwinning of CaFe2As2 and BaFe2As2 Crystals: Optical and Transport Study. Phys Rev B (2010) 81:184508. 10.1103/PhysRevB.81.184508
54.
LiuPKlemmMLTianLLuXSongYTamDWet alIn-plane Uniaxial Pressure-Induced Out-Of-Plane Antiferromagnetic Moment and Critical Fluctuations in BaFe2As2. Nat Comm (2020) 11. 10.1038/s41467-020-19421-5
55.
JohnstonDC. Stretched Exponential Relaxation Arising from a Continuous Sum of Exponential Decays. Phys Rev B (2006) 74:184430. 10.1103/PhysRevB.74.184430
56.
HammerathFGräfeUKühneTKühneHKuhnsPLReyesAPet alProgressive Slowing Down of Spin Fluctuations in Underdoped LaFeAsO1−xFx. Phys Rev B (2013) 88:104503. 10.1103/physrevb.88.104503
57.
BossoniLCarrettaPHalperinWPOhSReyesAKuhnsPet alEvidence of Unconventional Low-Frequency Dynamics in the normal Phase of Ba(Fe1−xRhx)2As2 Iron-Based Superconductors. Phys Rev B (2013) 88:100503. 10.1103/PhysRevB.88.100503
58.
TakedaHImaiTTachibanaMGaudetJGaulinBDSaparovBIet alCu Substitution Effects on the Local Magnetic Properties of Ba(Fe1−xCux)2As2: A Site-Selective 75As and 63Cu NMR Study. Phys Rev Lett (2014) 113:117001. 10.1103/physrevlett.113.117001
59.
GrafeHJGräfeUDioguardiAPCurroNJAswarthamSWurmehlSet alIdentical Spin Fluctuations in Cu and Co Doped BaFe2As2 Independent of Doped Electrons. Phys Rev B (2014) 90:09451. 10.1103/PhysRevB.90.094519
60.
DioguardiAPCrockerJShockleyACLinCHShirerKRNissonDMet alCoexistence of Cluster Spin Glass and Superconductivity in Ba(Fe1−xCox)2As2 for 0.060 ≤ X ≤ 0.071. Phys Rev Lett (2013) 111:207201. 10.1103/PhysRevLett.111.207201
61.
SingerPMArsenaultAImaiTFujitaM. NMR Investigation of the Interplay between Lattice, Charge, and Spin Dynamics in the Charge-Ordered High- Tc Cuprate La1.875Ba0.125CuO4. Phys Rev B (2020) 101:174508. 10.1103/physrevb.101.174508
62.
ArsenaultAImaiTSingerPMSuzukiKMFujitaM. Magnetic Inhomogeneity in Charge-Ordered La1.885Sr0.115CuO4 Studied by NMR. Phys Rev B (2020) 101:184505. 10.1103/physrevb.101.184505
63.
WangJYuanWSingerPMSmahaRWHeWWenJet alEmergence of Spin Singlets with Inhomogeneous Gaps in the Kagome Lattice Heisenberg Antiferromagnets Zn-Barlowite and Herbertsmithite. Nat Phys (2021) 17:1109–13. 10.1038/s41567-021-01310-3
64.
ChoiHVinogradIChaffeyCCurroN. Inverse Laplace Transformation Analysis of Stretched Exponential Relaxation. J Magn Reson (2021) 331:107050. 10.1016/j.jmr.2021.107050
65.
CurroNHammelP. The Cu NMR echo Decay in Stripe Ordered La1.65Eu0.2Sr0.15CuO4. In: International Conference on Materials and Mechanisms of Superconductivity High Temperature Superconductors VI; FEB 20-25, 2000; HOUSTON, TEXAS, 341. Phys. C (2000). p. 1797–8. 10.1016/S0921-4534(00)01084-4
66.
CurroNHammelPSuhBHückerMBüchnerBAmmerahlUet alInhomogeneous Low Frequency Spin Dynamics in La1.65Eu0.2Sr0.15CuO4. Phys Rev Lett (2000) 85:642–5. 10.1103/PhysRevLett.85.642
67.
HuntAWSingerPMCederströmAFImaiT. Glassy Slowing of Stripe Modulation in (La,Eu,Nd)2−xSrxCuO4: a 63Cu and 139La NQR Study Down to 350 mK. Phys Rev B (2001) 64:134525. 10.1103/PhysRevB.64.134525
68.
HuntASingerPThurberKImaiT. 63Cu NQR Measurement of Stripe Order Parameter in La2−xSrxCuO4. Phys Rev Lett (1999) 82:4300–3. 10.1103/physrevlett.82.4300
69.
JulienMHCampanaARigamontiACarrettaPBorsaFKuhnsPet alGlassy Spin Freezing and NMR Wipeout Effect in the High-Tc Superconductor La1.90Sr0.10CuO4 Critical Discussion of the Role of Stripes. Phys Rev B (2001) 63:144508. 10.1103/PhysRevB.63.144508
70.
CurroNJ. Glassy Spin Dynamics in a Stripe Ordered Cuprate System. Proc SPIE (2004) 5469:114–24. 10.1117/12.537625
71.
CurroN. Probing Spatial Correlations in the Inhomogeneous Glassy State of the Cuprates by Cu NMR. J Phys Chem Sol (2002) 63:2181–5. 10.1016/S0022-3697(02)00231-7
72.
MitrovićVFJulienMHde VaulxCHorvatićMBerthierCSuzukiTet alSimilar Glassy Features in the 139La NMR Response of Pure and Disordered La1.88Sr0.12CuO4. Phys Rev B (2008) 78:014504. 10.1103/PhysRevB.78.014504
73.
FrachetMVinogradIZhouRBenhabibSWuSMayaffreHet alHidden Magnetism at the Pseudogap Critical point of a Cuprate Superconductor. Nat Phys (2020) 16:1064–8. 10.1038/s41567-020-0950-5
74.
SchmalianJWolynesPG. Stripe Glasses: Self-Generated Randomness in a Uniformly Frustrated System. Phys Rev Lett (2000) 85:836–9. 10.1103/PhysRevLett.85.836
75.
WestfahlHSchmalianJWolynesPG. Self-generated Randomness, Defect Wandering, and Viscous Flow in Stripe Glasses. Phys Rev B (2001) 64:174203. 10.1103/PhysRevB.64.174203
76.
NussinovZVekhterIBalatskyAV. Nonuniform Glassy Electronic Phases from Competing Local Orders. Phys Rev B (2009) 79:165122. 10.1103/PhysRevB.79.165122
77.
CanfieldPCBud’koSL. FeAs-based Superconductivity: A Case Study of the Effects of Transition Metal Doping on BaFe2As2. Annu Rev Condens Matter Phys (2010) 1:27–50. 10.1146/annurev-conmatphys-070909-104041
78.
SlichterCP. Principles of Nuclear Magnetic Resonance. 3rd ed.Springer-Verlag (1992).
79.
ParkKLoucaDLlobetAYanJQ. Evidence of Local Disorder in the Overdoped Regime of Ba(Fe1−xCox)2As2. Phys Rev B (2011) 84:024512. 10.1103/PhysRevB.84.024512
80.
CarlsonEWDahmenKA. Using Disorder to Detect Locally Ordered Electron Nematics via Hysteresis. Nat Commun (2010) 2:379. 10.1038/ncomms1375
81.
BanerjeeVPuriS. Hysteresis Effects in Spin Systems with Quenched Disorder. Phys Rev E (2001) 63:026106. 10.1103/physreve.63.026106
82.
LohCEWDahmenKA. Noise Predictions for STM in Systems with Local Electron Nematic Order. Phys.Rev B (2010) 81:224207. 10.1103/PhysRevB.81.224207
83.
CarlsonEWDahmenKAFradkinEKivelsonSA. Hysteresis and Noise from Electronic Nematicity in High-Temperature Superconductors. Phys Rev Lett (2006) 96:097003. 10.1103/PhysRevLett.96.097003
84.
MeeseWJVojtaTFernandesRM. Random-strain-induced Correlations in Materials with Intertwined Nematic and Magnetic Orders (2021). p. 05769. arXiv:2112.
Summary
Keywords
nuclear magnetic resonance, nematicity, uniaxial strain, glassy dynamics, spin lattice relaxation, quantum materials
Citation
Curro NJ, Kissikov T, Tanatar MA, Prozorov R, Bud’ko SL and Canfield PC (2022) Nematicity and Glassy Behavior Probed by Nuclear Magnetic Resonance in Iron-Based Superconductors. Front. Phys. 10:877628. doi: 10.3389/fphy.2022.877628
Received
16 February 2022
Accepted
21 March 2022
Published
14 April 2022
Volume
10 - 2022
Edited by
Laura Fanfarillo, International School for Advanced Studies (SISSA), Italy
Reviewed by
Pietro Carretta, University of Pavia, Italy
Kenji Ishida, Kyoto University, Japan
Rui Zhou, Institute of Physics (CAS), China
Updates
Copyright
© 2022 Curro, Kissikov, Tanatar, Prozorov, Bud’ko and Canfield.
This is an open-access article distributed under the terms of the Creative Commons Attribution License (CC BY). The use, distribution or reproduction in other forums is permitted, provided the original author(s) and the copyright owner(s) are credited and that the original publication in this journal is cited, in accordance with accepted academic practice. No use, distribution or reproduction is permitted which does not comply with these terms.
*Correspondence: N. J. Curro, njcurro@ucdavis.edu
This article was submitted to Condensed Matter Physics, a section of the journal Frontiers in Physics
Disclaimer
All claims expressed in this article are solely those of the authors and do not necessarily represent those of their affiliated organizations, or those of the publisher, the editors and the reviewers. Any product that may be evaluated in this article or claim that may be made by its manufacturer is not guaranteed or endorsed by the publisher.