Abstract
Autonomous oscillatory dynamics are ubiquitous at every level in Biology. At the cellular level, one of the most relevant and well characterized examples of periodic behavior is the cyclic assembly and disassembly of actomyosin networks. In Drosophila, these oscillations induce the robust contraction and expansion of individual cells required for correct dorsal closure, while in the follicular epithelium that surrounds the germline, periodic contractions of the basal actomyosin network are required for proper elongation of the egg chamber. While some studies suggest that actomyosin oscillations are driven by upstream signaling or mechanochemical features, we have recently proposed that they arise as a systems property from the competition between two well characterized features of the actomyosin machinery: 1) cooperative assembly of actin networks mediated by Actin crosslinker proteins and 2) tension-induced disassembly of actin networks mediated by myosin motors. Here, we perform experiments in amnioserosa and in the follicle cells of drosophila and simulations using a coarse-grained model of the actomyosin cortex to characterize the properties of the oscillations and how they depend on different features of the system. We also compare model and experiments to study the dynamics of actomyosin flows and the effect of mechanical coupling between cells in the tissue. In conclusion, our model is a powerful tool to study key features of actomyosin oscillations, from the effect of the individual components to network properties and finally supra-cellular organization of the oscillations at the tissue level.
1 Introduction
Many biological systems exhibit oscillatory dynamics. From circadian clocks to gene expression, oscillations have been shown to be underneath many important biological processes, at very different time and spatial scales. At the systems level, periodic dynamics has been shown to modulate the spatial and temporal organization of tissues, as well as to improve the precision in the control of biological processes [1]. This periodicity is very present in morphogenesis (i.e., the formation and organization of tissues during development), and its failure results in severe morphogenetic defects [2, 3]. In this direction, the study of the features that induce and regulate biological oscillations during developmental processes are of interest to many branches of biology, from regeneration to tissue engineering and cancer biology [4].
Arguably the most studied morphogenetic event that shows an oscillatory behaviour is the dorsal closure in Drosophila embryos [5, 6]. In this process, an opening at the dorsal midline of the embryo closes due to the fusion of two sheets of epithelial cells located at both sides of the embryo. An essential part of the process is driven by the cells of the amnioserosa, an epithelial extra-embryonic tissue whose cells exhibit periodic expansions and contractions [7]. As the amplitude of the oscillations in the cells of the amnioserosa increases, they start to internalize concomitant with the closing of the two epithelial sheets [8]. These oscillations are required for proper morphogenesis of the Drosophila larva [6, 8, 9], and their disruption results in failure in the process of closure [10].
Using Drosophila again as model organism, researchers have shown that oscillations in the basal surface of cells take place during maturation of the oocyte [11]. As the egg chamber increases around 1.7-fold in length, cells in the follicular epithelium (a sheet of cells that coat the oocyte) oscillate in shape with a periodicity of around 6.5 min. Similarly to apical oscillation in amnioserosa, these basal oscillations in the follicular epithelium are required for a correct maturation of the oocyte, and inhibition of the actomyosin contractions blocked the correct elongation of the egg chamber [12].
These cell-autonomous sequential contractions and expansions of the cell shape arise from the oscillations that occur at the level of the cytoskeleton [8]. The cytoskeleton is a dynamic network of protein microfilaments and microtubules in the cytoplasm of cells, ultimately responsible for the shape and mechanical properties of cells. The cytoskeleton is involved in virtually all cellular processes, and therefore, abnormal functioning of the cytoskeleton is linked to many severe diseases, including cardiovascular, neurodegeneration, cancer, cirrhosis, and fibrosis [13].
An essential part of the cytoskeleton mesh is the actomyosin, a protein complex composed of actin and myosin, which is the essential contractile substance of muscle fiber. Actomyosin is characterized by a very well studied set of dynamic properties that arise mainly from the interaction of its two main components: actin and myosin. Globular actin (G-actin) is the most abundant protein in most eukaryotic cells, and it is involved in more protein-protein interactions than any other protein [14]. One of its most important features is its ability to polymerize into long filaments of helical structure composed of several thousand G-actin subunits. These threads called “filamentous” or “F-actin” are very dynamic, and can be rapidly remodelled in the inner cell surfaces as a response to external or internal cues, as a fundamental aspect to cellular life.
Myosin motors are force-generating ATPases, meaning that they can catalyze the decomposition of ATP into ADP, and use the energy released to produce a mechanical force and move along F-actin. Myosin motors are also among the most abundant proteins with regard to biomass, and they are responsible for actin-based cell motility, intracellular transport, and muscle contraction.
Driven by this interaction between F-actin and Myosin, the actomyosin cortex has been characterized as an inherently contractile, highly dynamic structure, with the myosin motor proteins able to pull on actin filaments and remodel the network. In the inner cell membrane of eukaryote cells, the actomyosin complex organizes as a thin film of around 0.2 μm thickness [15], commonly refereed as the actomyosin cortex. Its main function is the control of animal cell morphogenesis [16] as a structural framework, and its assembly and properties are regulated by the interaction of G-actin with actin-membrane linkers [17], such as dystrophin, utrophin, talin, vinculin, integrin and annexins. This family of proteins is responsible for maintaining the cortex tightly attached to the plasma membrane [18], while also affecting strongly its properties and dynamics [19].
The dynamics of the actomyosin cortex are very rich and context dependent, and it is able to exhibit a wide variety of interesting nonlinear properties, such as traveling waves [20] or patterns [21]. It is also the main responsible for the oscillations in cell shape of amnioserosa and follicle cells described above. In brief, as the cortex assemblies, it drives contraction of the inner cell membrane that it is attached to. Then, at some point, the cortex disassembles and the area expands again, and the process of actomyosin assembly begins again.
Although the mechanisms underlying this cyclic process are not fully understood, several models and theoretical approximations have been developed in the last decades that propose potential explanations of its dynamics (see for instance ref [22] for a detailed review of models of dorsal closure). Models can be divided into two main categories, depending on the approach followed: mechanical-based or biochemical-based oscillations. Mechanical-based models assume that the source of oscillations are physical interaction, such as forces, pressure or elastic load [7, 11, 23–28]. Biochemical-based oscillations assume that the source of the oscillations is the nonlinear interactions in the biochemical network [29, 30].
In this direction of biochemical based approaches, we have recently proposed a semi-grand canonical coarse grained model, where some features of the actomyosin cortex are reproduced based on very few well characterized interactions between actin molecules, myosin motors and actin crosslinkers (ACs) [31].
In our model, autonomous periodic assembly and disassembly of the actomyosin cortex arises naturally from the interplay between two well known processes: cooperative F-actin assembly [32, 33] and tension induced disassembly [34–36].
Here, we use our framework to characterize the main parameters that control the dynamics and periodicity of the actomyosin oscillations, its robustness, the properties of the network and other features such as traveling waves and coupling dynamics. The most relevant aspects of the model are described in the Methods section, and a detailed explanation of the full framework can be found in ref. [31]. A scheme of the modeling framework is shown in Figure 1. To validate the model predictions, we performed experiments in two tissues of Drosophila that exhibit autonomous oscillations in actomyosin levels: follicle cells during marutation of the egg chamber, and cells of the amnioserosa during dorsal closure. Comparison between model predictions and our experimental observations suggest that, despite the highly simplified approach based on very few assumptions, our model is able to recapitulate many important properties of actomyosin oscillatory dynamics.
FIGURE 1
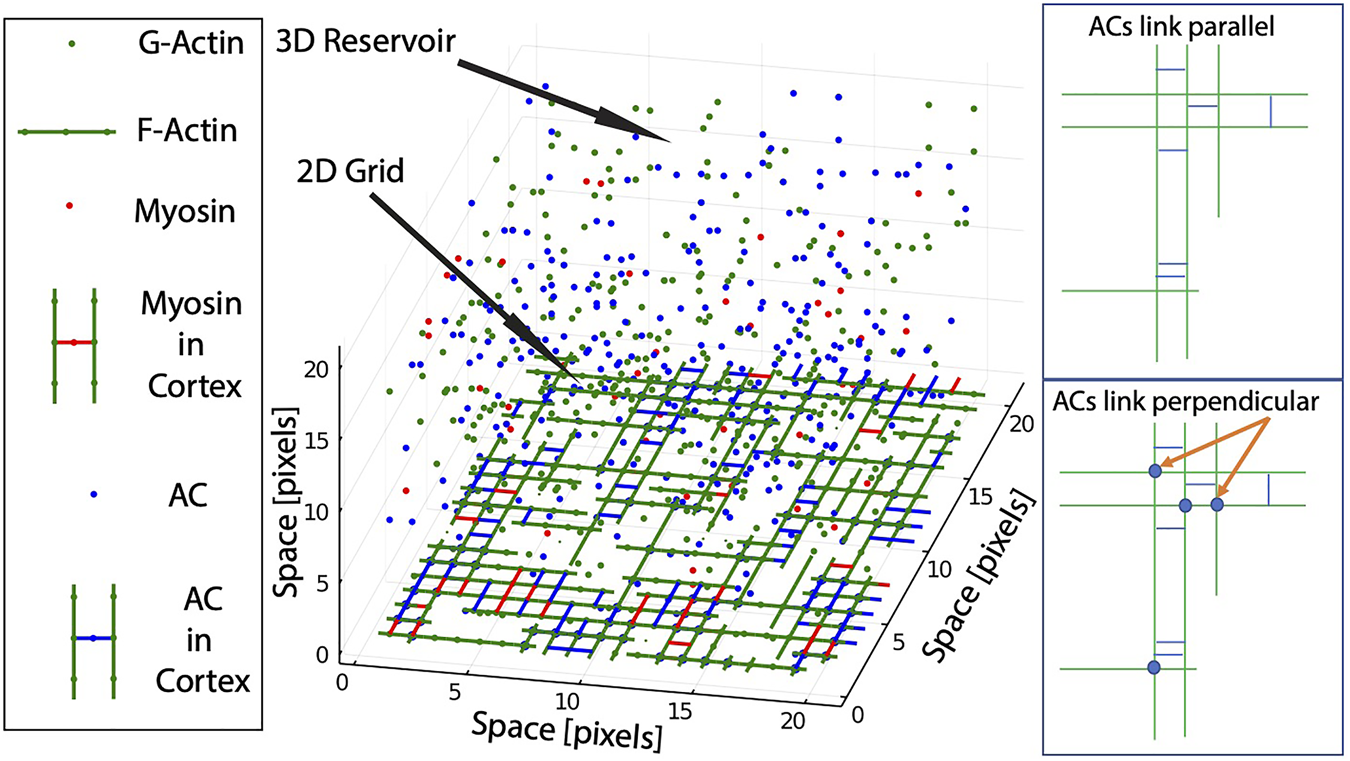
Scheme of the Coarse Grained framework. The model is composed of a two-dimensional grid that represents the inner cellular membrane connected to a three-dimensional reservoir, that represents the cytoplasm. Several molecule types are coexisting and interacting in the framework: G-Actin and F-Actin (green), Actin Crosslinkers ACs (blue), and Myosin (red). Molecules transit between grid and reservoir based on chemical potential (see Methods). Right panels show the effect of different classes of ACs in the link between parallel or perpendicular F-actin.
2 Methods
2.1 Model Design
In brief, the model is multi-compartment, composed of a two-dimensional grid that represents the inner cellular membrane connected to a three-dimensional reservoir, that represents the cytoplasm. Several molecule types are coexisting and interacting in the framework (G-actin, actin crosslinkers (ACs), and myosin), and can transit between the grid and the reservoir. The total number of molecules for each type (cortex + cytoplasm) remains constant throughout the simulation. For simplicity, diffusion in the cortex and other processes such as rotations are not allowed.
The code is written in Julia language [37], taking advantage of the following libraries: StatsPlots, Dates, KernelDensity, LightGraphs, FFTW, Plots, Random, Printf, Statistics, GLM. Code is available upon request.
Numerical simulations are performed using a Coarse Grained framework developed in house. The model is solved numerically using a Monte-Carlo computational algorithm. The dynamics for each event is accepted or rejected based on the Metropolis method [38]. The probability distribution of the different micro-states of the systems is evaluated statistically using a semi-grand canonical ensemble approach.
In brief, the model works as follows: 1) G-actin molecules in the cortex are allowed to polymerize directionally to form filaments (F-actin). 2) F-actin is then stabilized and linked by ACs, forming meshworks of parallel, anti-parallel and perpendicular filaments. 3) Myosin can bind to F-actin, and produce mechanical force. 4) When bound to two anti-parallel F-actin, the mechanical action of myosin results in tension or stress. 5) When the stress supported by a given F-actin is higher than its attachment to the membrane, the F-actin is released from the cortex to the cytoplasm, and part of its tension is redistributed to the rest of the network. Details and parameters for each of these processes are explained below (a more exhaustive and detailed explanation of the model can be found in ref. [31]).
2.2 Actin Dynamics
At every time step, a location and orientation (horizontal or vertical) in the grid is chosen. If the location is empty, an actin monomer (G-actin) can transition from the cytoplasm to that location in the cortex based on the value μ1 represents a chemical potential with the following form:where μ1,0 is a reference potential, N1,0 is the total number of actin molecules in the system, N1 is the number of actin molecules in the grid at a given time point. Parameter γ1 is a modifier of the slope of the function.
The potential function μ1 sets the probability of transition of a given molecule from the reservoir to the cortex. The change is accepted or rejected based on the Metropolis method. In the most rigorous definition of the chemical potential in thermodynamics, the units are energy units per molecule), but in the context of semi-grand canonical ensembles, the chemical potential is defined with no units.
To allow crossing of F-actin, each position in the grid can accept one G-actin molecule in vertical orientation and one in horizontal orientation. If insertion is successful, a link between G-actin and the cortex is established, with energy E1 (mimicking the effect of integrin molecules [19]). In addition, if another G-actin exists directly behind and with the same orientation, a link between the two molecules is established (with energy E0), and the filaments grows directionally.
On the contrary, if the location selected is already occupied, removal of the G-actin is evaluated using again the Metropolis method ad the value of P− = e−E, being E the sum of the energy of the links that affect the molecule. Directional de-polymerization is implemented by spontaneous release of the bond of the last G-actin of a F-actin (therefore, in this case).
2.3 Actin Crosslinkers Dynamics
ACs can occupy positions between pixels of the grid, so they can join filaments. Similarly to G-actin, we start by selecting a random location in the grid. If location is between two parallel, anti-parallel or perpendicular filaments, insertion is evaluated based on and the Metropolis method, with μ2 being a chemical potential for ACs:
If insertion is accepted, links of energy E2 are established between the AC and the two F-actin.
If the location already has an AC, removal is evaluated based on the value , and the Metropolis method. To study the properties of the actomyosin network, two classes of ACs are used: ACs that only link parallel F-actin, and ACs that can also link perpendicular F-Actin. A scheme of how the two mechanisms of action is shown in Figure 1 (right panel).
2.4 Myosin Dynamics
Myosin molecules work in our model similarly to ACs, with their own chemical potential μ3 and their link energy E3.
When linked to anti-parallel F-actin, myosin adds a certain amount of stress every time step. When the stress accumulated by a filament is higher than the energy attaching it to the cortex, it will be removed, and a fraction of its stress is communicated to the filaments that were connected to it. This way, the stress propagates through the network and it is progressively disassembled. This mechanism is at the core of the oscillatory behavior that we will analyze in the Results section.
2.5 Coupling
Changes in shape of a cell will affect the shape of its neighbors. To implement numerically this spatial coupling, we run simultaneously two numerical simulations corresponding to two neighboring cells (cell i and cell j), and make the value of a given parameter dependent on the total stress tension (TS, the sum of all tension in all filaments of the cell). For the coupling of the potential functions, we define the following function:
Another approach is to modulate the stress in 1 cell by the stress of the neighbour cell (if 1 cells compressed, the other experiences a relaxation in the network tension): to do that, we define the following function:in both previous equations α affects the maximum intensity of the coupling, β affects the inflection point and γ affects the slope. This way, the value of the parameter uncoupled in cell j is recalculated based on the value in the neighbor cell i, using the function that goes from 1 (no effect of neighbour) to α (full effect of neighbour). In all simulations, we use values of α = 5, γ = 5. These values have been chosen to provide an intermediate level of coupling (smaller values show very little effect, higher values suppress the oscillations in both cells). β is set as the half mean value of the total tension, which for the parameters used moves from 0 (minimum of oscillation), to around 10 (maximum total tension at the peak of the oscillation), therefore β = 5 also.
2.6 Model Calibration
Spatial and temporal calibration of this type of coarse grained models using experimental data is challenging because each interaction in the model often combines many biochemical steps (by design, the model is a very simplified version of the real system, and many molecular interactions are condensed as one simple step). The chemical potential is used as a tool that we use to maintaining a dynamic equilibrium between the molecules in the grid and in the reservoir, therefore it does not have a direct comparison with any experimental value (parameters of the chemical potential are chosen to maintain intermediate levels of cortex occupancy). Finally, bond energies are defined in terms of multiples of RT (being R the universal gas constant). Bonds mediated by ATP hydrolysis are on the order of 30 kJ/mol (RT = 2.47 kJ/mol). The power of Myosin in breaking the network is calibrated based on the time it takes in experiments to disassemble the actomyosin cortex (based on our own reference [30]).
2.7 Experiments
2.7.1 Drosophila Stocks and Genetics
Basal Follicle experiments: Flies were grown at 25°C and yeasted for 2 days before dissection. To visualize myosin, we used the Sqh:mCherry stock (see reference [30] for details). The spaghetti squash (Sqh) gene encodes the regulatory myosin light chain of nonmuscle myosin II. For live imaging 1–2-day-old females were fattened on yeast for 48–96 h before dissection. We then dissect ovarioles from ovaries in supplemented Schneider medium (GIBCO-BRL). Culture conditions and time-lapse microscopy are performed as described in [30, 39]. Egg chambers were mounted on a 35-mm glass bottom poly-D-lysine-coated dish (MatTek Corporation) without cover-slip, surrounded by wet tissue paper to preserve humidity around the culturing egg chambers.
Images were acquired on a Leica SP5 MP-AOBS confocal microscope equipped with a 40 × 1, 3 PL APO oil objective and Leica hybrid detectors (standard mode). Time-lapse movies are obtained using a confocal microscope (frame rate = 1/30 s−1). Each frame is a maximal projection of twelve Z-stacks (0.42 μm interval overlapping), to cover the entire basal surface of the cells.
2.7.2 Amnioserosa Experiments
For the imaging of the amnioserosa during dorsal closure, we used a recombinant fly stock carrying ubiECad- GFP to label cell membranes and zipperCPTI002907 to label Myosin-II (available from Kyoto Stock Center). Stage 12–13 Drosophila embryos were dechorionated, mounted in coverslips with the dorsal side glued to the glass and covered with Voltalef oil 10 S (Attachem). The amnioserosa was imaged at 25–28°C. using an inverted LSM710 laser scanning microscope with a 40X oil immersion Plan-Apochromat (NA = 1.3) objective. Imaging was performed with an argon laser and the emitted signal between 495 and 620 nm was collected using spectral detectors. Around 30 z-Sections 1μm apart were collected with a frame rate = 1/20 s−1). Signals specific to green fluorescent protein and yellow fluorescent protein were extracted using the linear un-mixing tool.
2.7.3 Image Processing and Data Analysis
For cell tracking and automated quantification of intensity levels, we first define the position of center of the cells in each frame manually using FIJI, and track the cell overtime, by identifying cellular characteristics between consecutive frames. Then, Python and OpenCV are used to obtain an average measure of intensity for the red channel (Sqh:mCherry, myosin) inside an area of fixed dimensions, surrounding the center of each cell. A movie of the cell tracking is shown as Supplementary Movie S5.
3 Results
3.1 Characterization of Actomyosin Oscillations
To understand the main features and properties of the oscillations in both main components of the actomyosin network (actin and myosin), we start with a characterization of the dependence of the dynamics on the model parameters, to define which aspects of the molecular interaction between actin, myosin and ACs affect the amplitude, period or robustness of the oscillations.
Figure 2A focuses on the effect of the reference chemical potential μ1,0, which regulates the affinity of the G-actin to transit from the cortex to the grid (therefore, it effectively affects the concentration of G-actin in the grid versus the cytoplasm). We can see that oscillations appear for an intermediate value of μ1,0 (low values result in very small amounts of G-actin unable to polymerize, while high values result in too high affinity of G-actin towards the cortex). In this situation, new G-actin enters the grid before the network is fully disassembled, and the system is driven out of the periodic regime towards a dynamic steady state situation (filaments are continuously being assembled and disassembled, but no periodicity arises as a global property of the system.
FIGURE 2
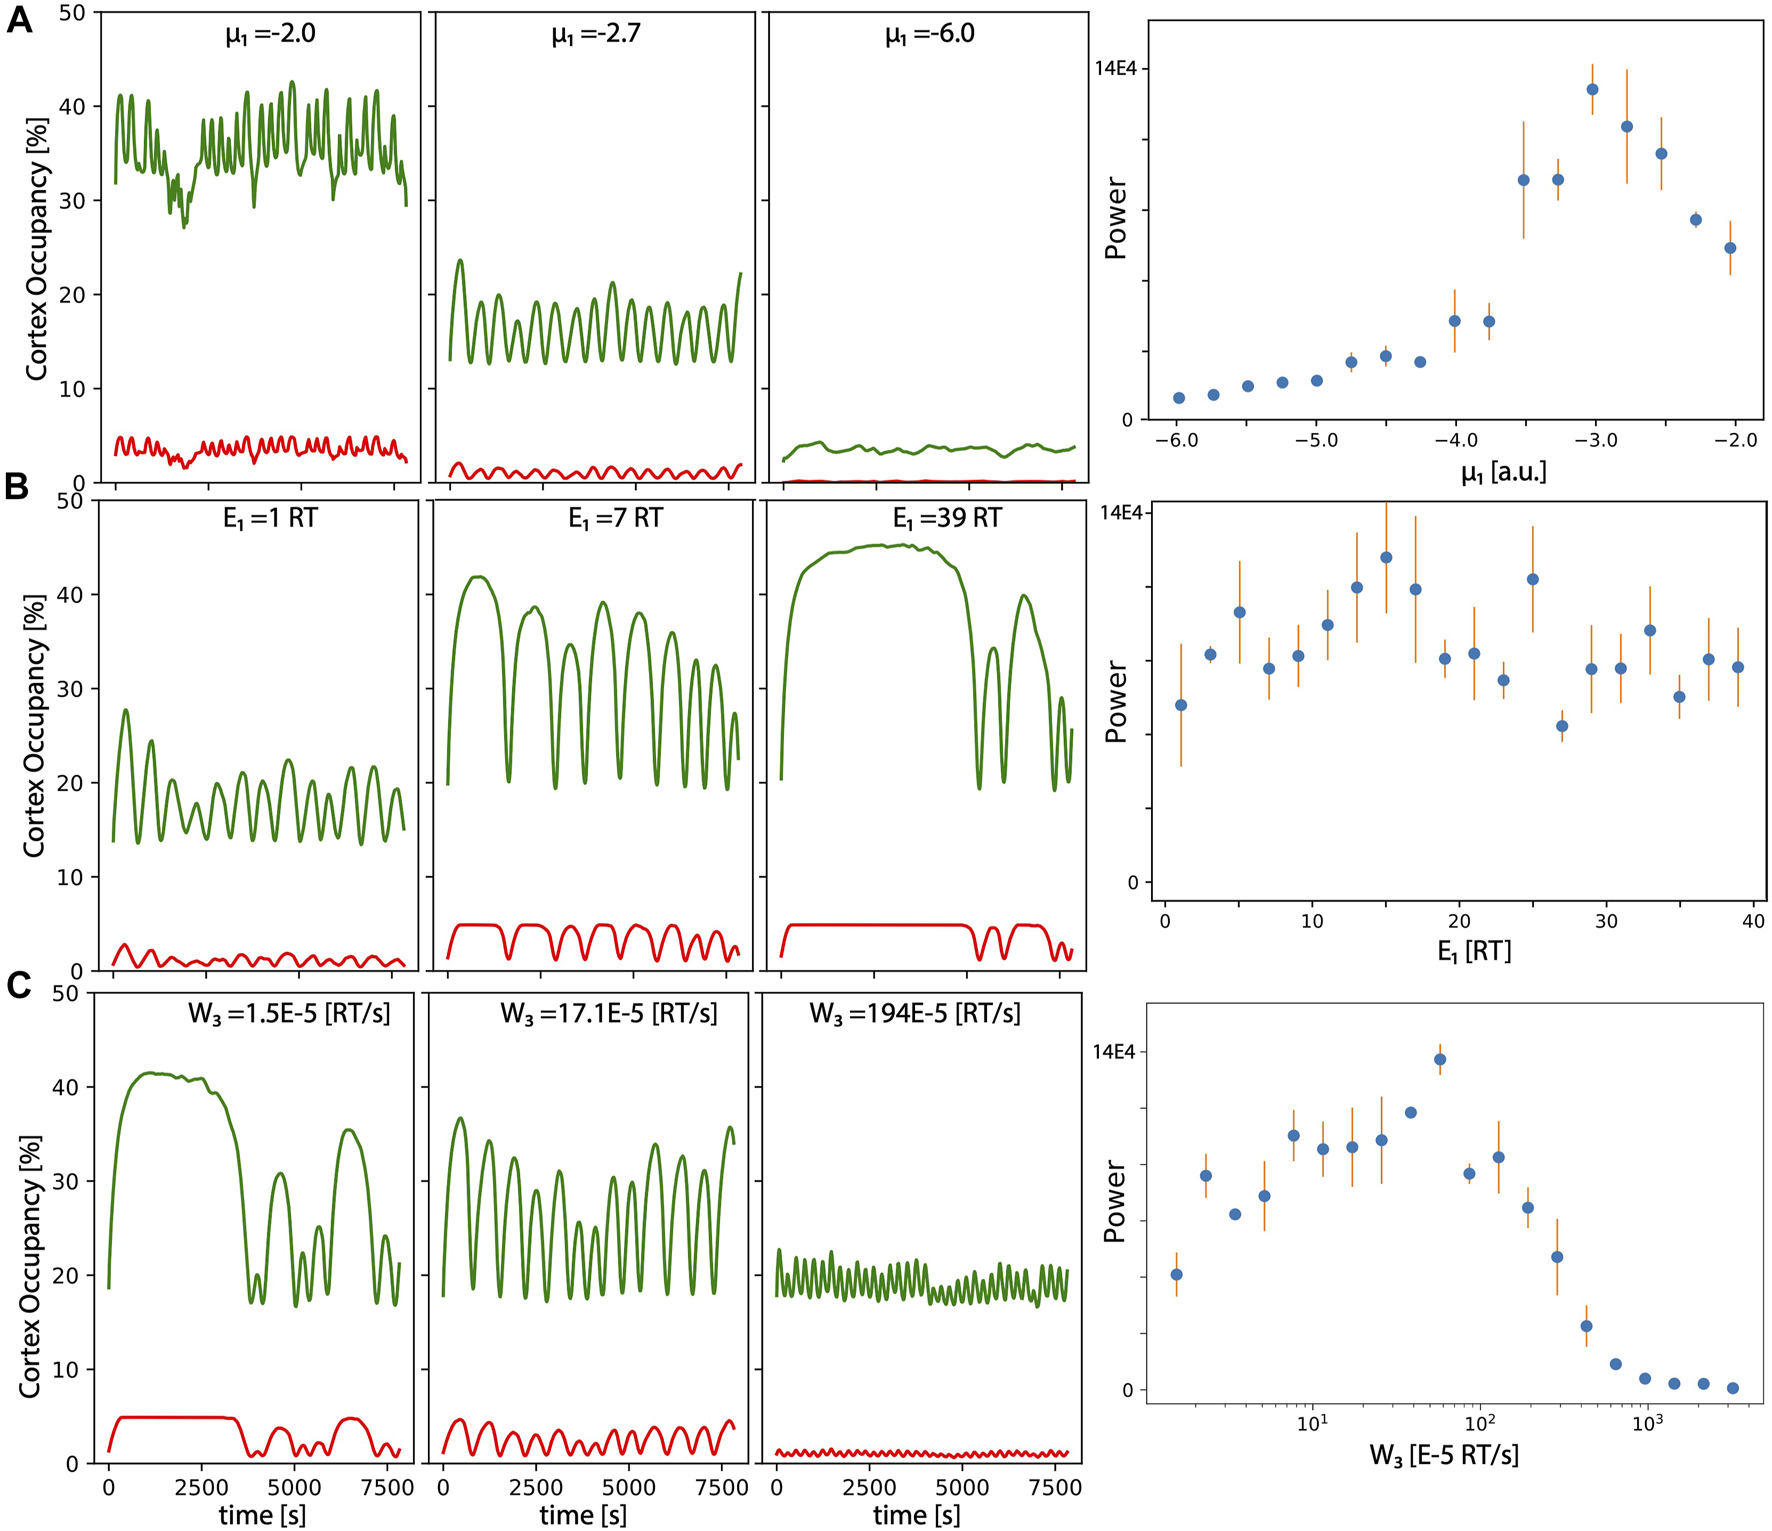
Characterization of the oscillations: Occupancy levels over time of the grid for actin (green) and myosin (red) for different values of the (A) reference chemical potential of for G-actin μ1,0, (B) link energy E1, and (C) energy per unit of time induced by mechanical force of myosin. Right panels correspond to the amplitude of the maximum of the Fourier transform of the G-actin levels (average over three independent numerical realizations of the model. Error bars correspond to standard deviation).
This is also illustrated in the left panel, where we plot the power of the highest peak of the corresponding Fourier transform of the amount of actin in the cortex overtime, computed for more values of μ1,0 (right panel). The maximum periodicity occurs for values of μ1,0 around −3.
Figure 2B focuses on the effect of the link energy between G-actin and the inner cell membrane E1 in the period and amplitude of the oscillations. We can see that oscillations are more clear for an intermediate value of E1 (low values of E1 result in very unstable filaments; high values of E1 result in filaments too attached, so myosin cannot produce the sufficient tension to release the filament, so disassembly occurs as a more stochastic and less periodic event). The representation of the maximum power of the Fourier spectrum, shows that the optimal values for periodicity occur around E1 = 7 RT, but it is more or less maintained for very high and very low values of the same parameter.
Finally, Figure 2C represents the effect of the power provided by myosin (W3), which regulates the energy that a given myosin motor produces per unit of time, once attached to two anti-parallel F-actin. Changes in these parameters seem to strongly affect the period of oscillations, with much longer and higher amplitude bursts as we move towards less power of myosin. This makes sense, since it takes longer to reach the threshold tension to detach a given filament. The longer it takes, more time for the filaments to grow in size and to fill the grid (therefore, amplitude is also increased). Again, optimal periodicity also occurs at intermediate values (see right panel for a maximum peak of the Fourier transform).
A more exhaustive analysis of the robustness of the oscillatory dynamics for each parameter of the model is presented in Table 1, where we include a brief statement explaining the biological meaning for each parameter, and the minimum and maximum values for clear and sustained oscillations. Model parameters used to produce this figure and the rest of the figures in the manuscript are liste in Table 2.
TABLE 1
| Parameter Name | Meaning | Range | Units |
|---|---|---|---|
| μ 1,0 | G-Actin References potential | -4: -2 | adimensional |
| μ 2,0 | ACs References potential | -10: 0 | adimensional |
| μ 3,0 | Myosin References potential | -20: 0 | adimensional |
| E 1 | G-Actin link energy to inner cell membrane | 0: 20 RT | KJ/Mol |
| E 2 | ACs link energy to inner cell membrane | 0: 20 RT | KJ/Mol |
| E 3 | Myosin link energy to inner cell membrane | 0: 20 RT | KJ/Mol |
| W 3 | Energy introduced by Myosin per second | 5e-6: 5e-2 RT | KJ/Mol/s |
| SF | Stress fraction propagated through the network | 0.1: 1 | adimensional |
Descriptions and ranges of values for the different parameters.
TABLE 2
| Figure | N 1,0 | N 2,0 | N 3,0 | μ 1,0 | μ 2,0, μ3,0 | E 1 | E 2, E3 | SF | W 3 |
|---|---|---|---|---|---|---|---|---|---|
| 2A | 5,000 | 3,000 | 500 | label | −5 | 3 | 3 | 1 | 0.0005 |
| 2B | 5,000 | 3,000 | 500 | −3 | −5 | label | 3 | 1 | 0.0001 |
| 2C | 5,000 | 3,000 | 500 | −3 | −5 | 3 | 3 | 1 | label |
| 3A,B | 5,000 | 3,000 | 500 | −2 | −5 | 2 | 3 | 1 | 0.001 |
| 4A,B | 20,000 | 12,000 | 2000 | −2 | −5 | label | 3 | 0.25 | 0.0005 |
| 5D,E,F | 5,000 | 3,000 | 500 | −3 | −5 | 5 | 3 | 1 | 0.0005 |
Values for the parameters used in the panels.
3.2 Analysis of the Properties of Actomyosin Networks
Since oscillations of the actomyosin cortex are in essence the assembly and disassemble of a interconnected network, we can use this analogy to study the properties of such network from a graph theory perspective. In this approach, we can define F-actin as the nodes of the network, and the links are the molecules capable of attaching to F-actin, i.e., ACs and myosin. This way, a poorly connected network represents a situation where F-actin molecules are linked to a small number of other filaments, while a highly connected network represents a situation where F-actin is linked to multiple other polymers.
To quantify this connectivity, we use the shortest path length L (also called geodesic distance, i.e., the minimum number of links required to connects two nodes in a network), calculated using the Dijkstra algorithm [40]. The average shortest path length corresponds to this value averaged for all shortest paths from each node to each node in the network. For simplicity, we use the maximum connected component size transformed in a simple graph, without weights. To minimize the effect of networks of different sizes, we divide by the average shortest path length for an equivalent network of the same number of nodes and links, but where connections are established randomly. Therefore, high values of represent a highly ordered network, while values of around 1 represent a network structure similar to random.
Since our inner cell membrane is simplified as a simple square grid of discrete pixels, this will strongly affect the architecture of the network. To study different configurations and different situations of the graph, we first analyze a condition of networks composed of only parallel and anti-parallel F-actin (see Methods and Figure 1). This situation illustrates the structure and properties of bundles linked only by Fascin and similar ACs [41].
Figure 3A represents this first scenario. The left panel is a plot comparing the value of as a function of time (purple line), with the oscillations in the amount of actin in the cortex (green line). We can see that the value of increases and decreases in time, concomitant with the cortex occupancy, suggesting that as the network grows, it differs more from a random-like connectivity (since only parallel and anti-parallel filaments can be connected, two filaments that are placed far away from each other will have a very long L).
FIGURE 3
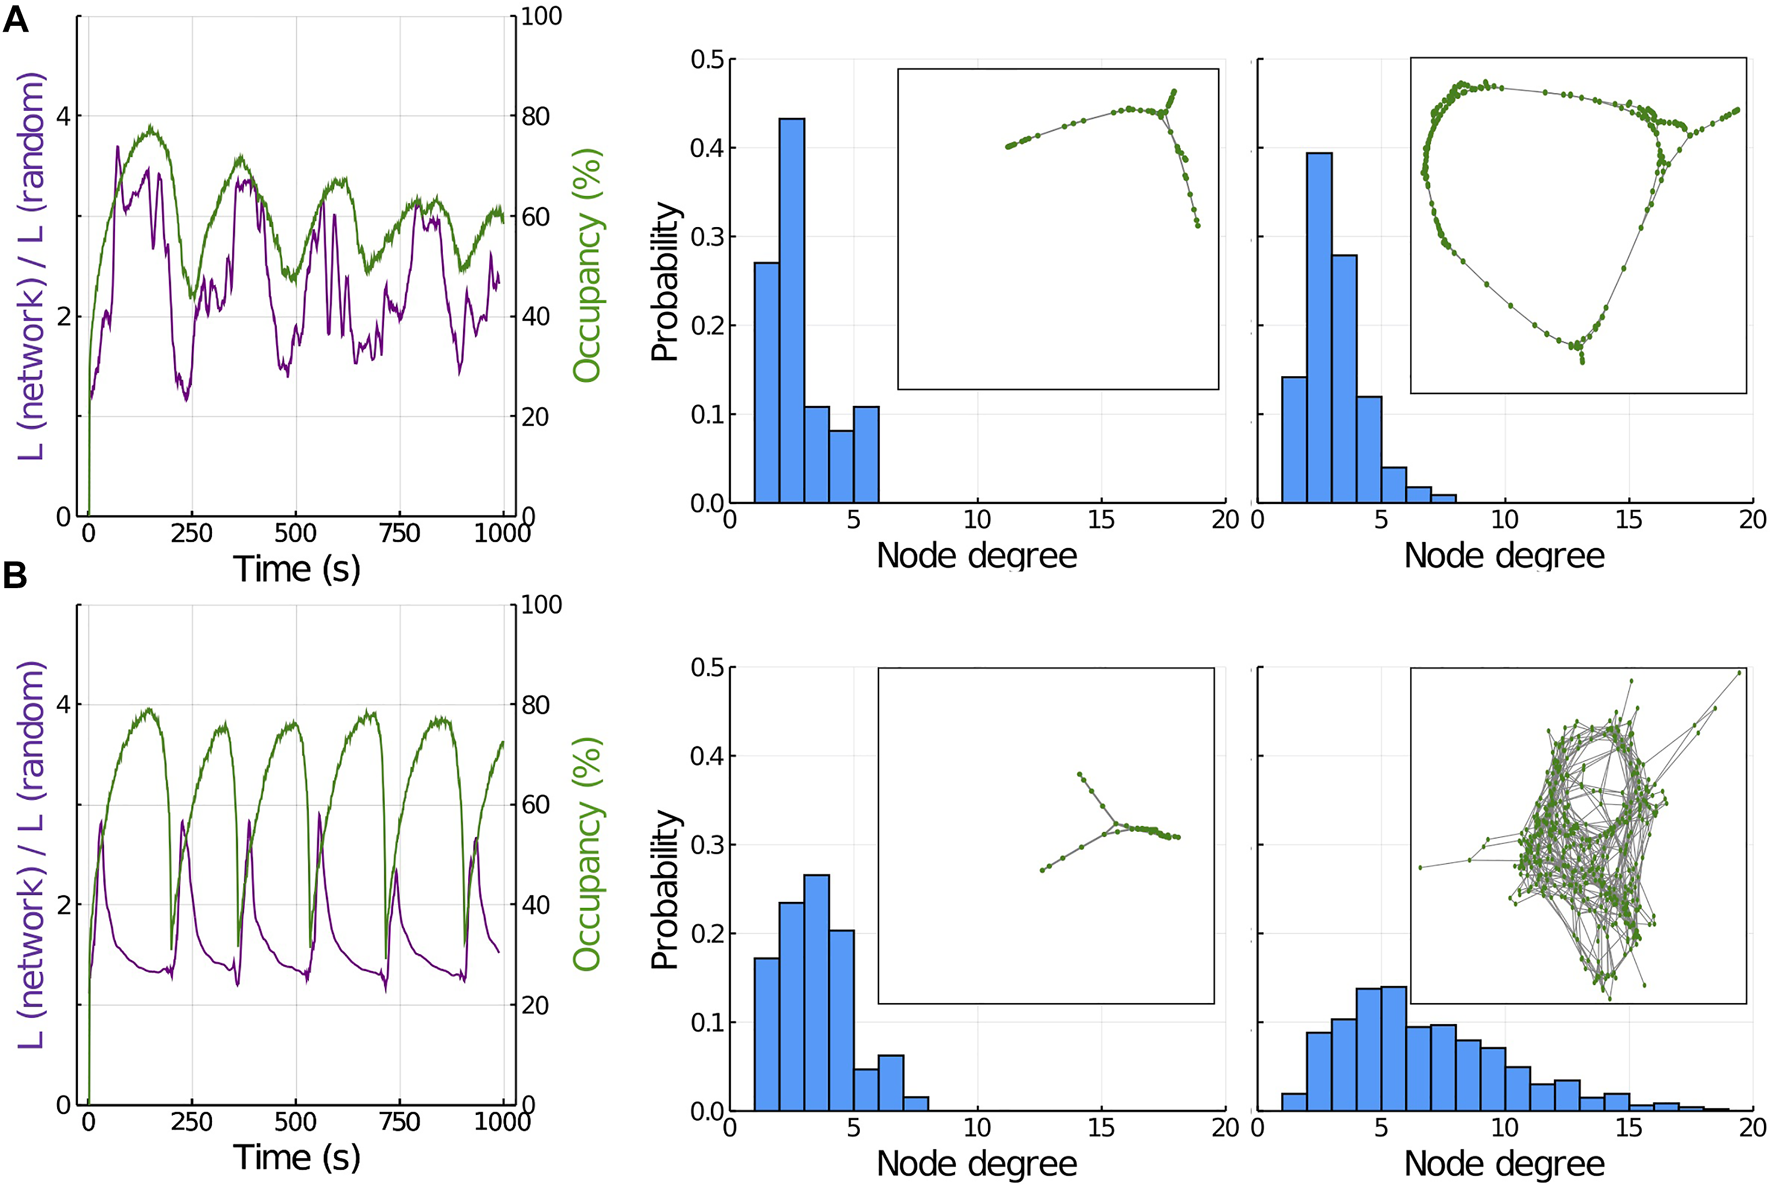
Analysis of the actomyosin network properties. (A) Parallel and anti-parallel F-actin networks. Left panel represents the average shortest path length (purple) and occupancy (green) during several oscillations. Central panel represents the degree distribution in a minimum of occupancy (insert is a graphical representation of the network at this time point). Right panel represents the degree distribution when occupancy is at its maximum level (insert is a graphical representation of the network at this time point). (B) Perpendicular F-actin networks. Left panel represents the average shortest path length (purple) and occupancy (green) during several oscillations. Central panel represents the degree distribution in a minimum of occupancy (insert is a graphical representation of the network at this time point). Right panel represents the degree distribution when occupancy is at its maximum level (insert is a graphical representation of the network at this time point).
If we compute the degree distribution at the point of minimum (central panel) and maximum (right panel) of the oscillation, we see that in both situations, the maximum probability is slightly above two (since F-actin can only bind in this scenario to parallel or anti-parallel neighbors, most of the filaments are only linked to two other F-actin, and only a few filaments are linked to a higher number of F-Actin). The inserts in each panel correspond to spatial representations of the graph at these two time points. The network develops with few connections per node towards a highly regular configuration at its maximum size (occupancy , % ) (the ring form occurs because the boundaries in our model are defined as periodic).
Figure 3B represents the scenario of F-actin being able to link also perpendicularly (see Methods and Figure 1). This situation represents the properties of actomyosin networks where ACs are also able to link perpendicular F-actin polymers, mimicking the role of ACs such as the αActinin family [42]. The value of (purple line, left panel) again oscillates in time, but now the average shortest distance decreases as the network size increases i.e., as the network grows, it resembles more a random network. This behavior corresponds to the opposite scenario of Figure 3A. The explanation for this difference is the following: when the network is beginning to form, the most probable connections are between parallel and anti-parallel filaments (perpendicular filaments can only be joined by their intersection point). These initial connections result in an increase in , similar to the case in Figure 3A. However, as soon as connection between perpendicular filaments appear, falls drastically to a value near one, meaning that the average shortest path length is much more similar to what would be expected in a random graph.
This different connectivity impacts how tension and energy is being redistributed in the network, which in the end affects the amplitude of the oscillations (green line, left panel). The addition of perpendicular links results in larger oscillations that become more asymmetric in their shape, compared to smaller and more sinusoidal oscillations in parallel networks (Figure 3A, left panel). This asymmetry in the shape of the oscillation occurs because the higher connectivity makes the tension travel faster and further across the network, resulting in a more sudden and organized disassembly.
The central panel in Figure 3B shows the degree distribution at the minimum occupancy point, with an average degree slightly above 2 and small clusters being formed (similar to panel A). The right panel in Figure 3B corresponds to the maximum point of occupancy, with a much broader distribution (average degree around 6) and a much larger network structure (more connections, see insert for a graphical representation of the network in graph form), resulting in a connectivity very close to random.
3.3 The Model Reproduces Traveling Actomyosin Waves
The actomyosin cortex is an active adaptive material, capable of a wide range of dynamic behaviours, from bulk pulse contractions [26] to anisotropic polarized flows [43–45]. These traveling waves of actomyosin play pivotal roles in cell division, cell motility, and morphogenesis. Wound healing experiments in Drosophila show perhaps the clearest example of these cortical flows, with a single pulse of actomyosin filaments assembling from cell to cell toward the margin of the wound [46]. Another key example of actomyosin waves occurs during contraction and protrusion in Dictyostelium discoideum [47].
In our previous publication, we have demonstrated how our minimal model is able to reproduce the bulk oscillations of the actomyosin responsible for the periodic contraction of cells. In this section, we take advantage of the fact that our model has been constructed as spatiotemporal to study the conditions that will result in the arising of polarized actomyosin flows.
Figure 4A represents three snapshots of the system for conditions of bulk oscillations. We can see how the cortex transits from full (t1) to less crowded (t2) to almost full again (t3). A time lapse movie of the system for these conditions is presented as Supplementary Movie S1. On the other hand, if we reduce the value of E1 (Figure 4B), instead of bulk oscillations, the system starts to exhibit traveling waves that swipe the system directionally. In this regime, the total occupancy levels do not change so drastically along the simulation, but still we observe oscillations in local levels if we focus on a small region of the system. A time lapse movie of the system for these conditions is presented as Supplementary Movie S2.
FIGURE 4
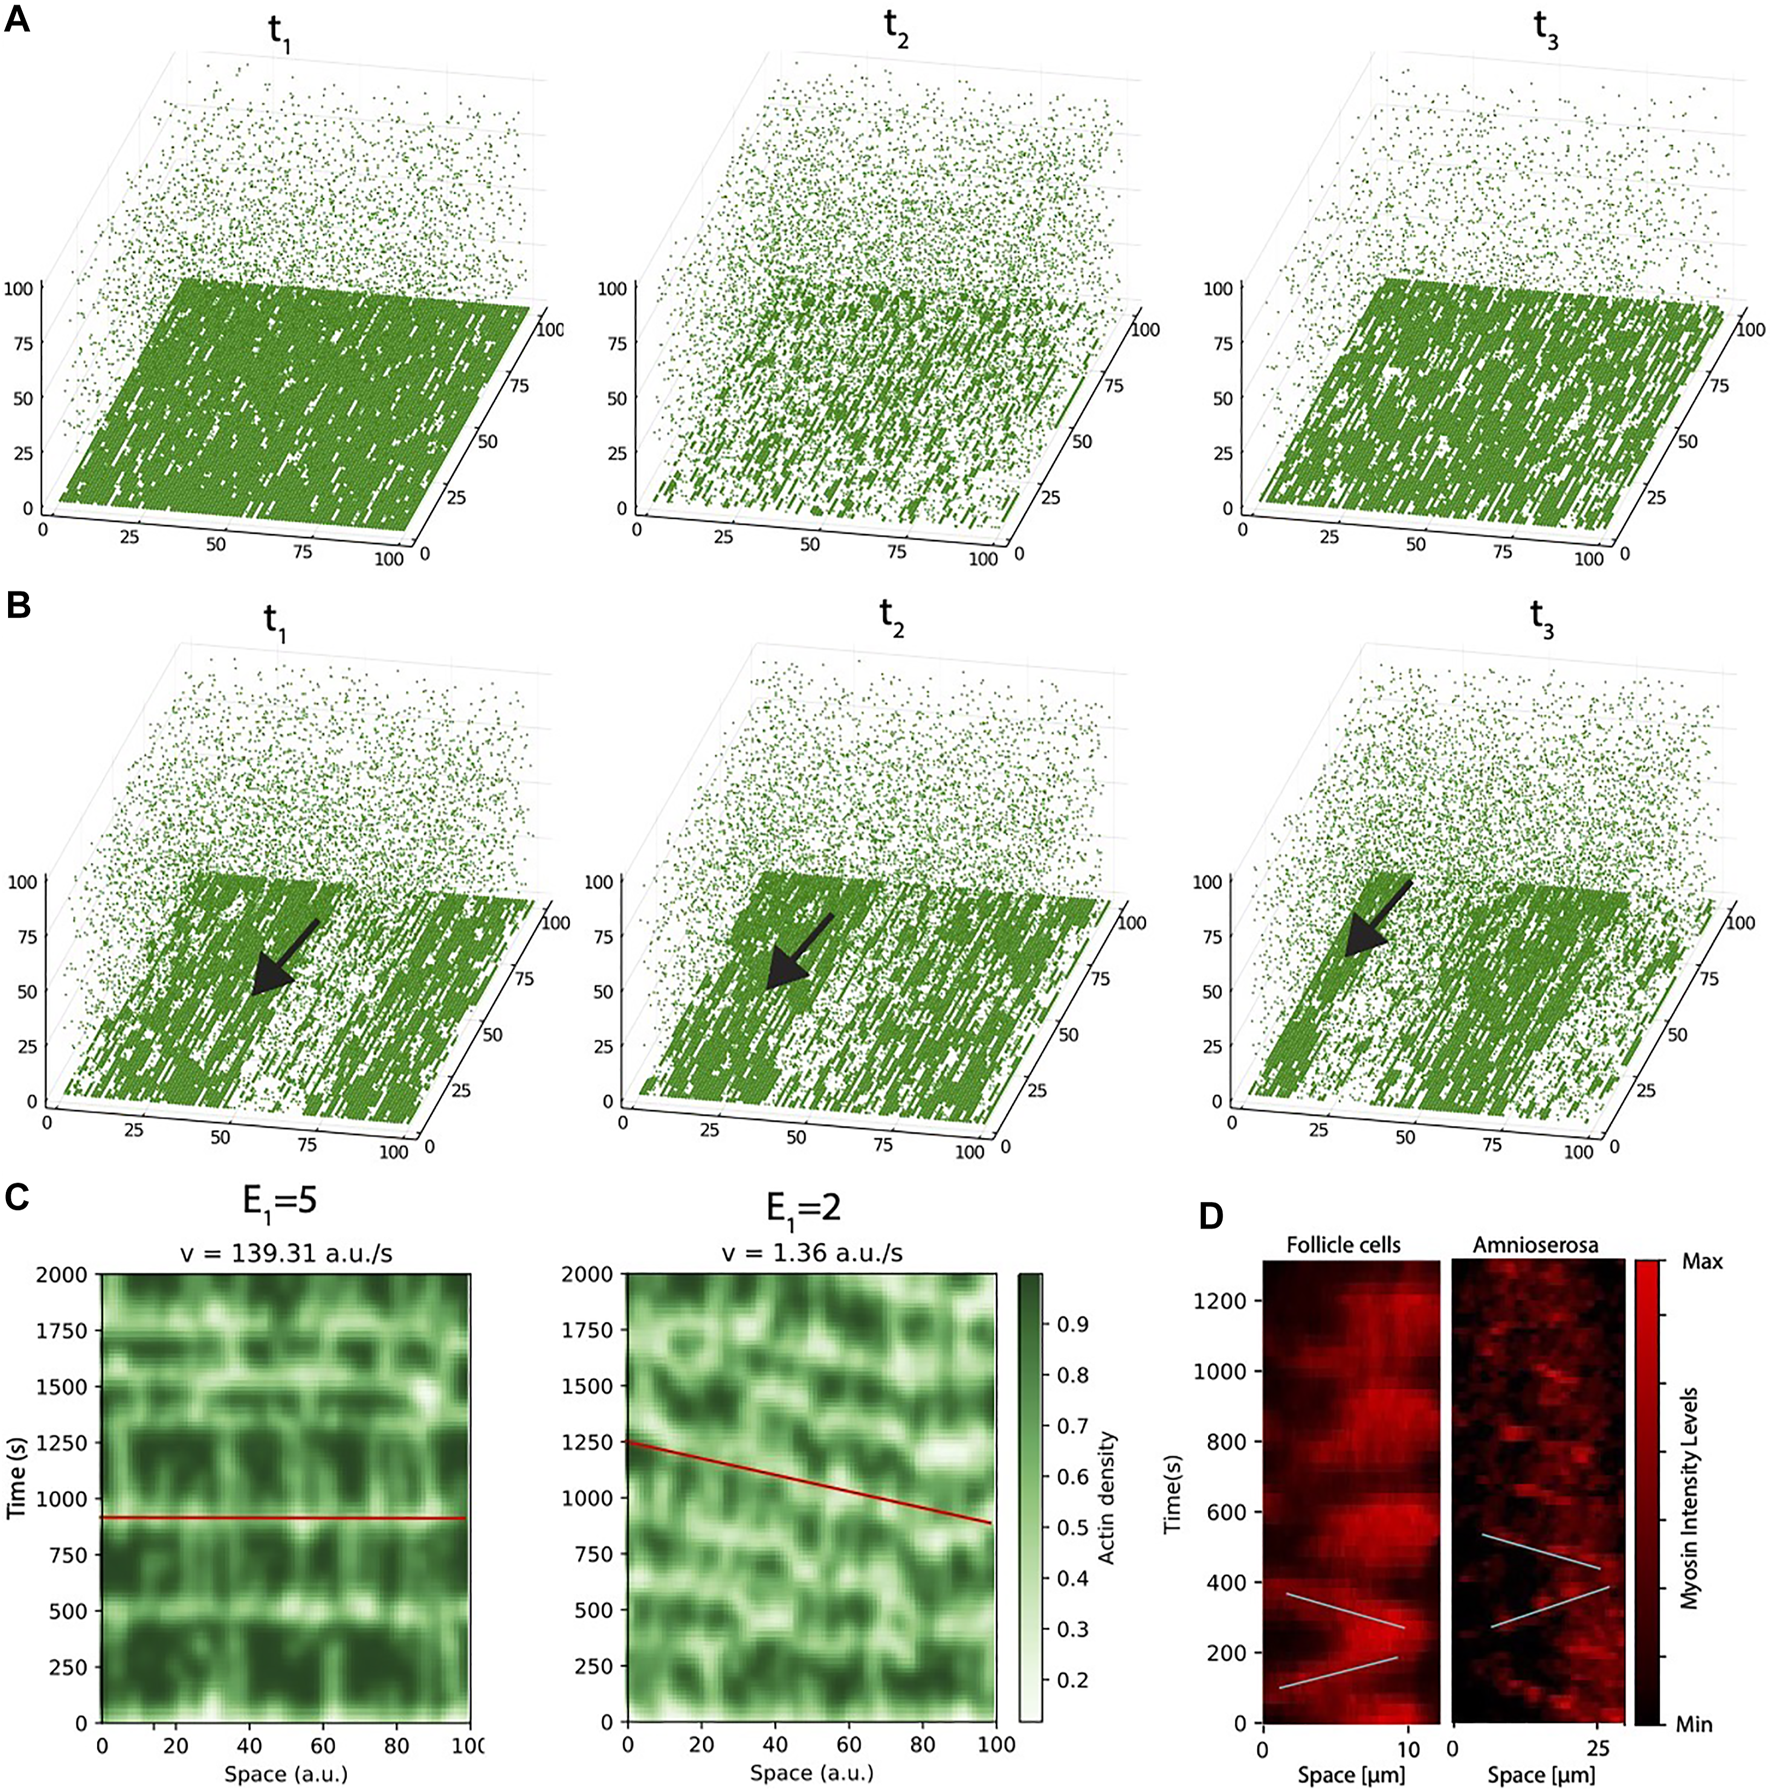
The model reproduces the arising of actomyosin waves. (A) Snapshots of the system at three different time points of the same simulation, for conditions of strong link between G-actin and inner cell membrane (E1 = 5 RT). (B) Snapshots of the system at three different time points of the same simulation, for conditions of weak link between G-actin and inner cell membrane (E1 = 2 RT). Arrow points to a traveling wave, that moves from right to left. (C) Space-time plots of the conditions of high (left panel) and low (right panel) values of E1. The red line is drawn as a guide to the eye to follow the speed of the waves. (D) Space-time plots of myosin dynamics for a single cell in Follicle cells (left) and amnioserosa (right) generated using the levels of myosin.
To further illustrate the difference between these two dynamic regimes, we generated space-time plots (Figure 4C), where we pile the intensity levels for the same pixels at different time points of a given simulation. The left panel represents a situation of bulk oscillations, where all the actomyosin is disassembled from the cortex simultaneously. From this plot, it can be seen that the periodicity is highly regular since very early in the simulation, and the collapse of the network is almost instantaneous (illustrated by a red horizontal line).
The right panel corresponds to the situation of low E1. Now, instead of full sudden collapse of the network, the system transits into a regime where disassemble occurs initially disordered in small clusters that, as time progresses, become more organized in the form of spatio-temporal waves.
Next, we compare these two potential scenarios with the dynamics observed in experiments performed in the basal region of Drosophila follicle cells, as well as in amnioserosa cells during dorsal closure (see Methods). In brief, to analyze myosin dynamics in the basal side of Drosophila follicle cells, we performed live imaging of egg chambers expressing the in vivo marker for myosin, Sqh:mCherry. To analyze myosin dynamics in the apical side of amniserosa cells, we use Drosophila embryos stably expressing zipperCPTI002907 to label myosin.
To do this, we recorded time lapse movies and monitor the changes in intensity levels and the spatial redistribution of the actomyosin cortex. Figure 4D illustrate the dynamics in the experiments in the form of a space time plot (the full movie for myosin oscillations in follicle cells is presented as Supplementary Movie S3, the full movie for myosin oscillations in amnioserosa cells is presented as Supplementary Movie S4). To monitor the oscillatory dynamics in the experiments, we compute the levels of myosin instead of F-actin, because myosin staining allows us to distinguish better single cells (as seen in our previous publications [30], the dynamics of both actin and myosin are very similar).
Left panel in Figure 4D corresponds to a single cell quantification of the follicle tissue (Supplementary Movie S3). The changes in intensity levels show a dynamic that initially resembles wave-like oscillations (marked with oblique lines as a guide to the eye) but later in time, the dynamics is more bulk-like (there is no clear direction in the assembly and disassembly). On the other hand, in amnioserosa, (right panel, the waves can be clearly distinguished during the 20 min of the experiment (see Supplementary Movie S4). Interestingly, although the speed of the waves in both tissues is around the same order (slope of the lines), the waves are very different in shape (myosin waves in amnioserosa are much thinner, i.e., disassembly occurs almost immediately after assembly, while in basal follicle cell oscillations, the disassemble takes longer, suggesting that tension accumulates more slowly). Based on the model analysis, we hypothesize that both experimental tissues represent different in regions of the phase space: basal follicle cell oscillations are more similar to oscillations of high attachment (Figure 4A), while amnioserosa oscillations resemble a situation of low energy attachment. In addition, we have to take into account the inherent experimental differences between both systems (see Methods), and that neighboring cells are also oscillating and probably affecting the dynamics of their neighbours. This effect of the coupling between cells in close proximity is studied in the next section.
3.4 Coupling
There is vast evidence that confirms that actomyosin oscillations are cell autonomous, rather that arising as a dynamic property of the system. On the other hand, since cells are not isolated, but coupled mechanically as part of a larger tissue, it is safe to assume that the dynamics of a given cell will be influenced by the dynamics of their neighbours. Since the integrity of epithelial tissues such as the amnioserosa or follicle cells has to be maintained during morphogenesis, the expansion (or contraction) of a cell in a particular direction has to be coupled with a complementary contraction (or expansion) of its neighbours. In this direction, a clear experimental evidence of the effect of neighbors in the dynamics of the oscillation has been described during wound healing, where the process of cell expansion is simply a result of the absence of tension by the actomyosin, combined with tension being generated in neighboring cells [48].
Previous studies focused on the inter-relation between the changes in cell shape at the tissue level show that the axis of maximum contraction tend to organize in their orientation, showing for the first time a supra-cellular organization during dorsal closure [8]. This is consistent with actomyosin waves that can expand several cell diameters, but authors did not focus on this characterization.
A more detailed studied of the spatiotemporal coordination of the pulses during the invagination of the Drosophila ventral furrow, establishing a link between the myosin intensity and the change in area of the cell [49]. Here, authors find that in wild type conditions, the tissue is not governed by force balance, meaning that the reduction in area of a given cell is not affected by peaks in myosin levels in neighboring cells.
To investigate if the mechanical interaction between neighboring cells in the tissue affects in some way the dynamics of the actomyosin cortex, we use again experiments in Drosophila follicle cells (see Methods). We perform cell tracking of a set of cells in the tissue and measure the intensity levels of myosin overtime. A time lapse movie of the process is presented as Supplementary Movie S5. Next, for each cell, the oscillations are fitted to a sinusoidal function to extract parameters of the dynamics, such as amplitude and phase of the oscillation. Finally, these two parameters are compared between neighbors to identify potential coupling or the existence of supra-cellular organization.
Results of the quantification are summarized in Figures 5A–C. Panel A represents a snapshot of the time lapse movie, with the labeled cells part of the analysis. Figure 5B corresponds to the oscillation frequency of all the cells analyzed, plotted in levels from blue (low) to red (high frequency). Our data suggests that cells coordinate in the form of arrays with similar frequency of oscillations (illustrated by orange lines). This supra-cellular organization in the form of long lines of cells is similar to the arrays presented in ref [8], and suggest that, a similar organization to the compression and expansion is also taking place at the level of the frequency of oscillation. Interestingly, the frequency values (lower panel) show a distribution that resembles a bimodal shape, but a more extensive analysis (more cells, more movies) will be required to conclude this with mode confidence.
FIGURE 5
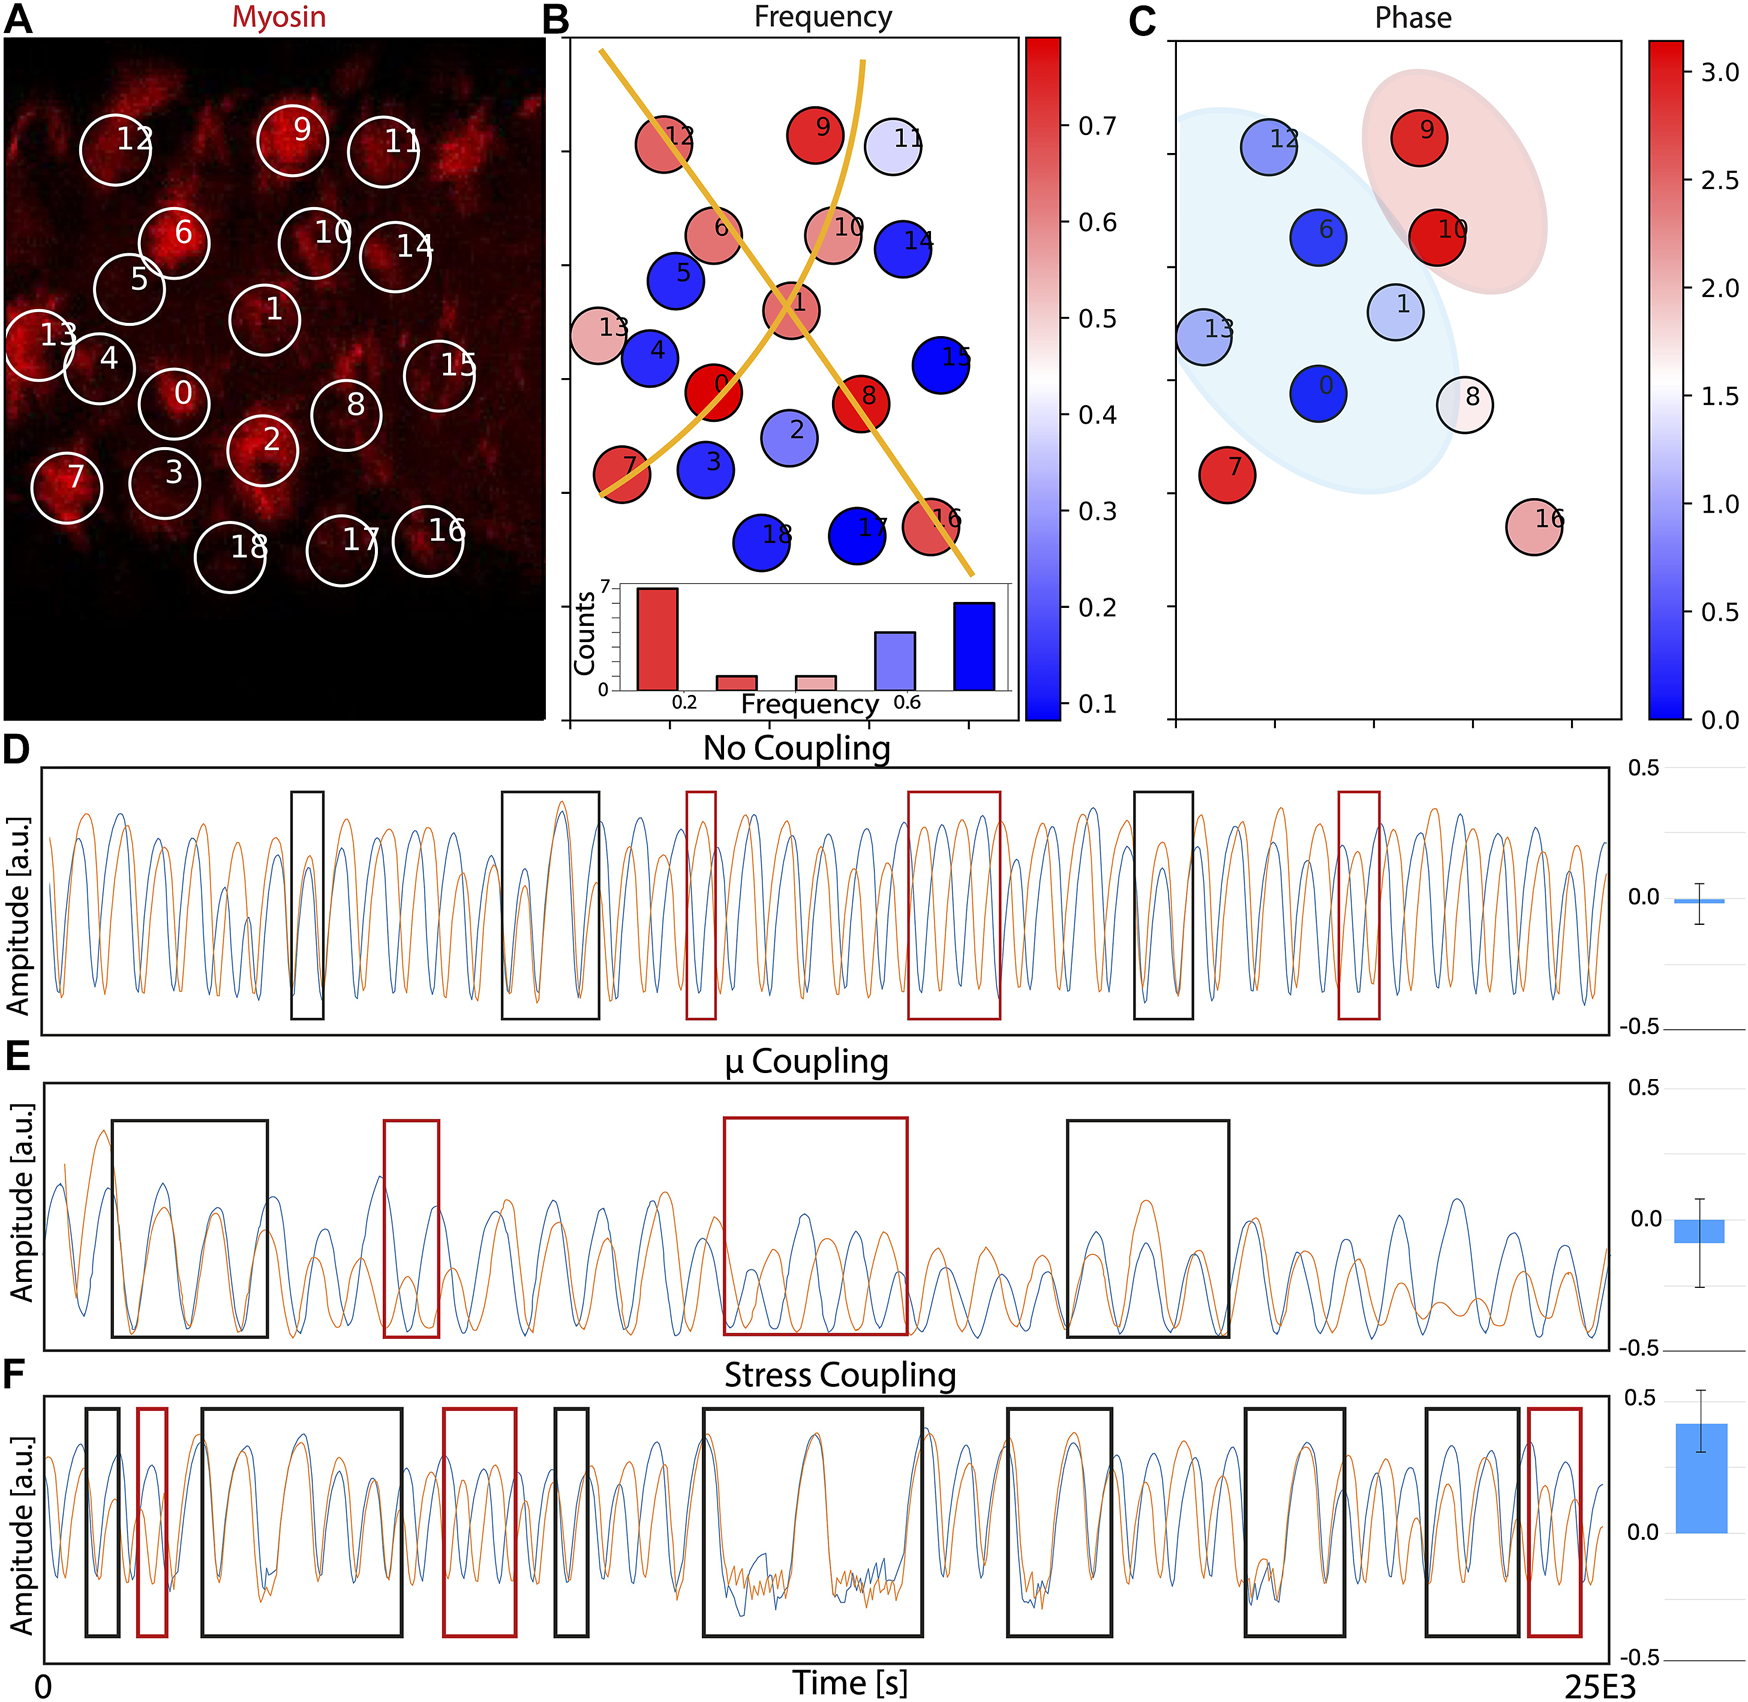
Supra-cellular coordination and coupling of actomyosin oscillations. (A) Snapshot of the time-lapse movie used to track myosin levels (red) in different cells. The full movie is shown as Supplementary Movie S5. Cells are labeled and the intensity of signal inside the circle is fitted to a sinusoidal function for posterior analysis. Some of the circles appear to be empty because they are at the minimum of the oscillation, but they will become visible in posterior frames. (B) Plot of the frequency of the oscillations of each cell. Cells with high frequency of oscillations are colored towards the red. Cells with low frequency are colored towards the blue. The orange lines are drawn as a guide to the eye to help identify supra-cellular organization. A histogram representing the frequency distribution suggest a bimodal organization. (C) Comparison of the differences in phase of the oscillations between cells with a similar frequency, taking cell “O” as reference. Cells labeled in blue have similar phase, and cells labeled in red have a dynamics close to full anti-phase. Blue region is used as a mark to the eye to illustrate clusters of cells with similar phase. Red region is used as a mark to the eye to illustrate clusters of cells in anti-phase with cell “O”. (D–F) Numerical simulations of 2 cells in conditions of (D) no coupling, (E) coupling via chemical potential and (E) coupling via tension. Black and red rectangles indicate regions of phase and anti-phase synchronization, correspondingly. Blue bars on the left plot the correlation terms of the correlation matrix between pairs (three repeats, bars correspond to the standard deviation).
Supra-cellular actomyosin waves should result in spatial coordination in the phase of the oscillations between neighboring cells. This quantification is presented in Figure 5C, where the phase relative to cell 0 is represented in a color-bar (restricted to cells with a similar frequency, since comparison of phase is only informative when performed between cells with similar dynamic characteristics). Interestingly, cells closer to our reference cell have a similar phase, while cells further in the tissue oscillate in anti-phase with the reference cell. These results points towards the existence of close coupling in terms of actomyosin levels, suggesting that, despite the lack of coordination in area changes (see ref [49]), the actomyosin levels seem to be coupled between neighbours.
Next, we go back to our model to study potential scenarios for inter-cellular actomyosin coupling that can reproduce the experimental observations. To do that, we generated two parallel numerical simulations of 2 cells simultaneously, and tested different scenarios for the coupling. Details of how the coupling is implemented are described in the Methods section. The first scenario corresponds to coupling in via chemical potential. The rationale is that, in a tissue, the contraction of cell i should result in expansion of cell j. Therefore, an increase in area may correspond to a reduction in local concentration (represented in our model by the reference chemical potential μ0,i). The actin levels of the 2 cells in this situation are represented in Figure 5E, where we mark with black and red rectangles the regions where the 2 cells oscillate in phase and anti-phase, correspondingly. Comparing this situation of μ0,i coupling with Figure 5D (no coupling), we cannot see real differences in the phase (rather than an decrease in the frequency of both cells). Increasing the dependence between both cells seems to suppress the oscillations, rather that increasing the synchronization. In addition, to quantify how this coupling we affect the synchronization between the 2 cells, we compute the correlation matrix for each pair of simulations and compare the correlation terms. For the case where no coupling is present, the correlation obtained is -0.02 ± 0.08 (blue bars in right column of Figure 5D). When we add the coupling term to the calculation of the chemical potential, the value is similarly low (-0.09 ± 0.17), implying that there is no coupling or that the periods of phase and anti-phase are very similar and cancel each other.
Next, we performed simulations where the coupling is set to occur at the level of the tension. The rationale behind this scenario is the following: since a compression of a cell results in expansion of the neighbor, this expansion may correspond to a release in the local tension of the network (due to local breakup of links between network and inner cell membrane, for instance). The resulting oscillations in this scenario are represented in Figure 5F. Compared to the control simulations with no coupling (Figure 5D), there seems to appear more regions where locking between the two phases occur. Interestingly, the synchronization is more marked in phase (black rectangles) that in anti-phase (red rectangles), which agrees with the experimental observation that cells in close proximity seem to be oscillating in phase (Figure 5C, blue region). Correlation analysis when the systems are coupled through their total stress results in a value of 0.42. ± 0.12, meaning that this approach is causing a more important effect than the previous two (blue bars in right column of Figure 5D). Again, higher intensity in the coupling seems to suppress the oscillation, rather than increase the synchronization.
4 Discussion
Coarse Grained simplifications of biological systems allow us to study the properties that arise from molecular interactions, using large amounts of particles and during long periods of time. In addition, the use of a semi-grand canonical ensemble allows us to simulate mixtures of a finite number of entities, an approach much more suitable to models biological systems than the most traditional canonical or grand-canonical ensembles. Coarse Grained approaches are a form of rule-based models, and compared to systems of differential equations, allow direct implementation of compartmentalization, molecule orientation, and other restrictions based on direct experimental observations. Ultimately, coarse grained semi-grand canonical approaches constitute an optimal framework to understand biological processes using computational models.
Here, we use a Coarse Grained model that has been shown to reproduce many features of the actomyosin cortex to study the properties of the emerging actomyosin oscillations. Although the mechanism underlying these oscillations is not fully characterized, it is clear that turnover of the main components is a key aspect in the process [50]. Another main advantage of our model is that turnover is a built-in feature, regulated by potential functions that sets the transport between the two compartments.
The architecture of networks is a key property that determines its dynamics, how information travels, and how force, tension and energy are distributed. In the case of actomyosin networks, their structure is of special importance, because it fully determines force transmission mediated by myosin motors [51], and in consequence, the dynamics of compression (shown beautifully in Refs. [52, 53]). Our framework allows us to directly apply graph theory to characterize the structure of the actomyosin network in the cortex. Our analysis shows that networks generated by both parallel and perpendicular F-actin filaments produce more robust and regular oscillations, due to a faster and more widespread redistribution of energy and tension.
Time-lapse movies of actomyosin oscillations in basal follicle cells show that assembly and disassembly occur almost simultaneously throughout the cell, while in apical oscillations of the amnioserosa, it resembles more a wave-like type of oscillations, that start in one region of the cell and travels directionally. Our model shows that one possibility to transition from bulk to flow oscillations is to reduce the link strength between G-actin and the cortex, mediated by anchor proteins such as the Integrin family of proteins. In a previous publication [31], we over-expressed members of the Integrin family to test the effect of increased attachment. A future interesting experiment will be to reduce Integrin levels and see if we observe a more traveling wave-like behavior.
Finally, it is well established that actomyosin within individual cells can collectively generate tissue-level force during morphogenesis [5]. How this coordination and coupling occurs is not fully understood. Previous studies suggest that oscillations occur mainly in anti-phase between neighboring cells [7], but when cells are part of a tissue with many neighbours, it is simply not possible for each cell in the tissue to be in anti-phase with all of their neighbours.
Our analysis shows that actomyosin oscillations are indeed coupled between short distance neighbours, in both frequency and phase. Unfortunately, our analysis is not able to unequivocally distinguish the existence of supra-cellular actomyosin waves, similarly to the well characterized actomyosin cables [54, 55], the structures that appear during embryonic stem cell colony growth [56] or during wound healing [46], where a single pulse of actomyosin forms around the wound edge and flows toward the margin of the wound.
Our model shows that this coupling can arise based on mechanical interaction, but the conclusions derived from the model are limited because we are only using 2 cells, rather than a tissue where cells have many neighbours. Although many other scenarios can be tested, our results suggests that mechanical coupling can only induce partial synchronization, and that maybe synchronization in the experimental system takes place via other mechanisms, such as biochemical communication, for instance.
The whole topic of coupling and the arising of supra-cellular actomyosin organization is very interesting, and an stimulating approach will be to use the model to couple more than 2 cells and observed synchronization and systems organization. To do that, we will need to fully parallelize the framework, and use of high performance workstations or clusters. This effort will be part of future research project from our lab.
In conclusion, our model is able to reproduce many important aspects of actomyosin cortex oscillations, and can be used to explore the role of each main component of the actomyosin cortex. Moreover, the spatial characteristics of the model allow direct comparison with experimental actomyosin flows or the arising of supra-cellular actomyosin organization.
Statements
Data availability statement
The raw data supporting the conclusions of this article will be made available by the authors, without undue reservation.
Author contributions
MH-D-V performed research and wrote the manuscript. AV-E, MM-B, and NG Performed experiments. DM designed research, provided funding and wrote the manuscript.
Funding
DM acknowledges funding to the Spanish Ministerio de Econoíma y Competitividad (BFU2014-53299-P, RTI2018-096953-B-I00), funding to IFIMAC-UAM, through the ‘María de Maeztu’ Programme for Units of Excellence in R&D from the Spanish Ministerio de Economía y Competitividad (CEX2018-000805-M), and funding from Comunidad de Madrid (PEJD-2018- PRE/BMD-7980). Institutional grants by Fundación Ramón Areces and Banco de Santander to the CBMSO are also acknowledged. The authors declare that this study received funding from Banco de Santander, via institutional grants. The funder was not involved in the study design, collection, analysis, interpretation of data, the writing of this article or the decision to submit it for publication.
Conflict of interest
The authors declare that the research was conducted in the absence of any commercial or financial relationships that could be construed as a potential conflict of interest.
Publisher’s note
All claims expressed in this article are solely those of the authors and do not necessarily represent those of their affiliated organizations, or those of the publisher, the editors and the reviewers. Any product that may be evaluated in this article, or claim that may be made by its manufacturer, is not guaranteed or endorsed by the publisher.
Supplementary material
The Supplementary Material for this article can be found online at: https://www.frontiersin.org/articles/10.3389/fphy.2022.881384/full#supplementary-material
References
1.
Rapp PE . Why Are So Many Biological Systems Periodic?Prog Neurobiol (1987) 29:261–73. 10.1016/0301-0082(87)90023-2
2.
Ray HJ Niswander L . Mechanisms of Tissue Fusion During Development. Development (2012) 139:1701–11. 10.1242/dev.068338
3.
Clarke DN Martin AC . Actin-based Force Generation and Cell Adhesion in Tissue Morphogenesis. Curr Biol (2021) 31:R667–R680. 10.1016/j.cub.2021.03.031
4.
Gorfinkiel N . From Actomyosin Oscillations to Tissue-Level Deformations. Dev Dyn (2016) 245:268–75. 10.1002/dvdy.24363
5.
Martin AC Gelbart M Fernandez-Gonzalez R Kaschube M Wieschaus EF . Integration of Contractile Forces during Tissue Invagination. J Cell Biol (2010) 188:735–49. 10.1083/jcb.200910099
6.
Martin AC Kaschube M Wieschaus EF . Pulsed Contractions of an Actin-Myosin Network Drive Apical Constriction. Nature (2009) 457:495–9. 10.1038/nature07522
7.
Solon J Kaya-Çopur A Colombelli J Brunner D . Pulsed Forces Timed by a Ratchet-like Mechanism Drive Directed Tissue Movement during Dorsal Closure. Cell (2009) 137:1331–42. 10.1016/j.cell.2009.03.050
8.
Blanchard GB Murugesu S Adams RJ Martinez-Arias A Gorfinkiel N . Cytoskeletal Dynamics and Supracellular Organisation of Cell Shape Fluctuations During Dorsal Closure. Development (2010) 137:2743–52. 10.1242/dev.045872
9.
Hayes P Solon J . Drosophila Dorsal Closure: An Orchestra of Forces to Zip Shut the Embryo. Mech Development (2017) 144:2–10. 10.1016/j.mod.2016.12.005
10.
Pasakarnis L Frei E Caussinus E Affolter M Brunner D . Amnioserosa Cell Constriction but Not Epidermal Actin Cable Tension Autonomously Drives Dorsal Closure. Nat Cell Biol (2016) 18:1161–72. 10.1038/ncb3420
11.
Koride S He L Xiong L-P Lan G Montell DJ Sun SX . Mechanochemical Regulation of Oscillatory Follicle Cell Dynamics in the Developing drosophila Egg Chamber. MBoC (2014) 25:3709–16. 10.1091/mbc.e14-04-0875
12.
He L Wang X Tang HL Montell DJ . Tissue Elongation Requires Oscillating Contractions of a Basal Actomyosin Network. Nat Cell Biol (2010) 12:1133–42. 10.1038/ncb2124
13.
Ramaekers FC Bosman FT . The Cytoskeleton and Disease. J Pathol (2004) 204:351–4. 10.1002/path.1665
14.
Dominguez R Holmes KC . Actin Structure and Function. Annu Rev Biophys (2011) 40:169–86. 10.1146/annurev-biophys-042910-155359
15.
Clark AG Dierkes K Paluch EK . Monitoring Actin Cortex Thickness in Live Cells. Biophysical J (2013) 105:570–80. 10.1016/j.bpj.2013.05.057
16.
Chugh P Paluch EK . The Actin Cortex at a Glance. J Cell Sci (2018) 131:jcs186254. 10.1242/jcs.186254
17.
Wang P Hawkins TJ Hussey PJ . Connecting Membranes to the Actin Cytoskeleton. Curr Opin Plant Biol (2017) 40:71–6. 10.1016/j.pbi.2017.07.008
18.
Winder SJ Ayscough KR . Actin-binding Proteins. J Cell Sci (2005) 118:651–4. 10.1242/jcs.01670
19.
Santa-Cruz Mateos C Valencia-Expósito A Palacios IM Martín-Bermudo MD . Integrins Regulate Epithelial Cell Shape by Controlling the Architecture and Mechanical Properties of Basal Actomyosin Networks. Plos Genet (2020) 16:e1008717. 10.1371/journal.pgen.1008717
20.
Masters TA Sheetz MP Gauthier NC . F-actin Waves, Actin Cortex Disassembly and Focal Exocytosis Driven by Actin-Phosphoinositide Positive Feedback. Cytoskeleton (2016) 73:180–96. 10.1002/cm.21287
21.
Moore T Wu SK Michael M Yap AS Gomez GA Neufeld Z . Self-organizing Actomyosin Patterns on the Cell Cortex at Epithelial Cell-Cell Junctions. Biophysical J (2014) 107:2652–61. 10.1016/j.bpj.2014.10.045
22.
Aristotelous AC Crawford JM Edwards GS Kiehart DP Venakides S . Mathematical Models of Dorsal Closure. Prog Biophys Mol Biol (2018) 137:111–31. 10.1016/j.pbiomolbio.2018.05.009
23.
Dierkes K Sumi A Solon J Salbreux G . Spontaneous Oscillations of Elastic Contractile Materials with Turnover. Phys Rev Lett (2014) 113:148102. 10.1103/physrevlett.113.148102
24.
Lo WC Madrak C Kiehart DP Edwards GS . Unified Biophysical Mechanism for Cell-Shape Oscillations and Cell Ingression. Phys Rev E (2018) 97:062414. 10.1103/PhysRevE.97.062414
25.
Dureau M Alessandri A Bagnerini P Vincent S . Modeling and Identification of Amnioserosa Cell Mechanical Behavior by Using Mass-spring Lattices. Ieee/acm Trans Comput Biol Bioinform (2016) 14:1476–81. 10.1109/TCBB.2016.2586063
26.
Sedzinski J Biro M Oswald A Tinevez J-Y Salbreux G Paluch E . Polar Actomyosin Contractility Destabilizes the Position of the Cytokinetic Furrow. Nature (2011) 476:462–6. 10.1038/nature10286
27.
Machado PF Blanchard GB Duque J Gorfinkiel N . Cytoskeletal Turnover and Myosin Contractility Drive Cell Autonomous Oscillations in a Model of drosophila Dorsal Closure. Eur Phys J Spec Top (2014) 223:1391–402. 10.1140/epjst/e2014-02197-7
28.
Gorfinkiel N . Mechano-chemical Coupling Drives Cell Area Oscillations during Morphogenesis. Biophysical J (2013) 104:1–3. 10.1016/j.bpj.2012.11.3822
29.
Wang Q Feng JJ Pismen LM . A Cell-Level Biomechanical Model of drosophila Dorsal Closure. Biophysical J (2012) 103:2265–74. 10.1016/j.bpj.2012.09.036
30.
Valencia-Expósito A Grosheva I Míguez DG González-Reyes A Martín-Bermudo MD . Myosin Light-Chain Phosphatase Regulates Basal Actomyosin Oscillations during Morphogenesis. Nat Commun (2016) 7:10746–11. 10.1038/ncomms10746
31.
Hernández-del Valle M Valencia-Expósito A López-Izquierdo A Casanova-Ferrer P Tarazona P Martín-Bermudo MD et al A Coarse-Grained Approach to Model the Dynamics of the Actomyosin Cortex. BMC Biol (2022) 20:90–11. 10.1186/s12915-022-01279-2
32.
Korkmazhan E Tompa P Dunn AR . The Role of Ordered Cooperative Assembly in Biomolecular Condensates. Nat Rev Mol Cell Biol (2021) 22:647–8. 10.1038/s41580-021-00408-z
33.
Baumgartner R Fu H Song Z Lin Y Cheng J . Cooperative Polymerization of α-helices Induced by Macromolecular Architecture. Nat Chem (2017) 9:614–22. 10.1038/nchem.2712
34.
Matsui TS Kaunas R Kanzaki M Sato M Deguchi S . Non-muscle Myosin Ii Induces Disassembly of Actin Stress Fibres Independently of Myosin Light Chain Dephosphorylation. Interf Focus. (2011) 1:754–66. 10.1098/rsfs.2011.0031
35.
Huang W Matsui TS Saito T Kuragano M Takahashi M Kawahara T et al Mechanosensitive Myosin Ii but Not Cofilin Primarily Contributes to Cyclic Cell Stretch-Induced Selective Disassembly of Actin Stress Fibers. Am J Physiology-Cell Physiol (2021) 320:C1153–C1163. 10.1152/ajpcell.00225.2020
36.
Sonal KA Ganzinger KA Vogel SK Mücksch J Blumhardt P Schwille P . Myosin-II Activity Generates a Dynamic Steady State with Continuous Actin Turnover in a Minimal Actin Cortex. J Cell Sci (2018) 132. 10.1242/jcs.219899.Jcs219899
37.
Bezanson J Karpinski S Shah VB Julia EA . A Fast Dynamic Language for Technical Computing. arXiv preprint arXiv:1209.5145 (2012).
38.
Metropolis N Ulam S . The Monte Carlo Method. J Am Stat Assoc (1949) 44:335–41. 10.1080/01621459.1949.10483310
39.
Prasad M Montell DJ . Cellular and Molecular Mechanisms of Border Cell Migration Analyzed Using Time-Lapse Live-Cell Imaging. Developmental Cel (2007) 12:997–1005. 10.1016/j.devcel.2007.03.021
40.
Dijkstra EW . A Note on Two Problems in Connexion with Graphs. Numer Math (1959) 1:269–71. 10.1007/bf01386390
41.
Bashirzadeh Y Redford SA Lorpaiboon C Groaz A Moghimianavval H Litschel T et al Actin Crosslinker Competition and Sorting Drive Emergent Guv Size-dependent Actin Network Architecture. Commun Biol (2021) 4:1136–11. 10.1038/s42003-021-02653-6
42.
Sjöblom B Salmazo A Djinović-Carugo K . α-Actinin Structure and Regulation. Cell. Mol. Life Sci. (2008) 65:2688–701. 10.1007/s00018-008-8080-8
43.
Rauzi M Lenne P-F Lecuit T . Planar Polarized Actomyosin Contractile Flows Control Epithelial junction Remodelling. Nature (2010) 468:1110–4. 10.1038/nature09566
44.
Mayer M Depken M Bois JS Jülicher F Grill SW . Anisotropies in Cortical Tension Reveal the Physical Basis of Polarizing Cortical Flows. Nature (2010) 467:617–21. 10.1038/nature09376
45.
Vogel SK Wölfer C Ramirez-Diaz DA Flassig RJ Sundmacher K Schwille P . Symmetry Breaking and Emergence of Directional Flows in Minimal Actomyosin Cortices. Cells (2020) 9:1432. 10.3390/cells9061432
46.
Antunes M Pereira T Cordeiro JV Almeida L Jacinto A . Coordinated Waves of Actomyosin Flow and Apical Cell Constriction Immediately after Wounding. J Cell Biol (2013) 202:365–79. 10.1083/jcb.201211039
47.
Ghabache E Cao Y Miao Y Groisman A Devreotes PN Rappel WJ . Coupling Traction Force Patterns and Actomyosin Wave Dynamics Reveals Mechanics of Cell Motion. Mol Syst Biol (2021) 17:e10505. 10.15252/msb.202110505
48.
Jayasinghe AK Crews SM Mashburn DN Hutson MS . Apical Oscillations in Amnioserosa Cells: Basolateral Coupling and Mechanical Autonomy. Biophysical J (2013) 105:255–65. 10.1016/j.bpj.2013.05.027
49.
Xie S Martin AC . Intracellular Signalling and Intercellular Coupling Coordinate Heterogeneous Contractile Events to Facilitate Tissue Folding. Nat Commun (2015) 6:7161–13. 10.1038/ncomms8161
50.
Salbreux G Charras G Paluch E . Actin Cortex Mechanics and Cellular Morphogenesis. Trends Cell Biology (2012) 22:536–45. 10.1016/j.tcb.2012.07.001
51.
Murrell M Oakes PW Lenz M Gardel ML . Forcing Cells into Shape: the Mechanics of Actomyosin Contractility. Nat Rev Mol Cell Biol (2015) 16:486–98. 10.1038/nrm4012
52.
Gardel ML Shin JH MacKintosh FC Mahadevan L Matsudaira P Weitz DA . Elastic Behavior of Cross-Linked and Bundled Actin Networks. Science (2004) 304:1301–5. 10.1126/science.1095087
53.
Alvarado J Sheinman M Sharma A MacKintosh FC Koenderink GH . Molecular Motors Robustly Drive Active Gels to a Critically Connected State. Nat Phys (2013) 9:591–7. 10.1038/nphys2715
54.
Röper K . Supracellular Actomyosin Assemblies during Development. Bioarchitecture (2013) 3:45–9. 10.4161/bioa.25339
55.
Harris TJC . Sculpting Epithelia with Planar Polarized Actomyosin Networks: Principles from drosophila. Semin Cell Dev Biol (2018) 81:54–61. 10.1016/j.semcdb.2017.07.042
56.
Du J Fan Y Guo Z Wang Y Zheng X Huang C et al Compression Generated by a 3d Supracellular Actomyosin Cortex Promotes Embryonic Stem Cell colony Growth and Expression of Nanog and Oct4. Cell Syst (2019) 9:214–20. 10.1016/j.cels.2019.05.008
Summary
Keywords
actomyosin, coarse-grained, proteins, oscillations, cytoskeleton, biophyiscs
Citation
Hernández-Del-Valle M, Valencia-Expósito A, Gorfinkiel N, Martín-Bermudo MD and Míguez DG (2022) Analysis of Actomyosin Oscillatory Dynamics Using a Coarse-Grained Model. Front. Phys. 10:881384. doi: 10.3389/fphy.2022.881384
Received
22 February 2022
Accepted
25 April 2022
Published
19 May 2022
Volume
10 - 2022
Edited by
Federico Rossi, University of Siena, Italy
Reviewed by
Saúl Ares, National Center for Biotechnology (CSIC), Spain
Ryan McGorty, University of San Diego, United States
Updates
Copyright
© 2022 Hernández-Del-Valle, Valencia-Expósito, Gorfinkiel, Martín-Bermudo and Míguez.
This is an open-access article distributed under the terms of the Creative Commons Attribution License (CC BY). The use, distribution or reproduction in other forums is permitted, provided the original author(s) and the copyright owner(s) are credited and that the original publication in this journal is cited, in accordance with accepted academic practice. No use, distribution or reproduction is permitted which does not comply with these terms.
*Correspondence: David G. Míguez, david.miguez@uam.es
This article was submitted to Physical Chemistry and Chemical Physics, a section of the journal Frontiers in Physics
Disclaimer
All claims expressed in this article are solely those of the authors and do not necessarily represent those of their affiliated organizations, or those of the publisher, the editors and the reviewers. Any product that may be evaluated in this article or claim that may be made by its manufacturer is not guaranteed or endorsed by the publisher.