Abstract
In recent years, the transmission of healthcare-associated infections (HAIs) has led to substantial economic loss, extensive damage, and many preventable deaths. With the increasing availability of data, mathematical models of pathogen spreading in healthcare settings are becoming more detailed and realistic. Here, we make use of spatial and temporal information that has been obtained from healthcare workers (HCWs) in three hospitals in Canada and generate data-driven networks that allow us to realistically simulate the spreading of an airborne respiratory pathogen in such settings. By exploring in depth the dynamics of HAIs on the generated networks, we quantify the infection risk associated with both the spatial units of the hospitals and HCWs categorized by their occupations. Our findings show that the “inpatient care” and “public area” are the riskiest categories of units and “nurse” is the occupation at a greater risk of getting infected. Our results provide valuable insights that can prove important for measuring risks associated with HAIs and for strengthening prevention and control measures with the potential to reduce transmission of infections in hospital settings.
1 Introduction
Healthcare-associated infections, or nosocomial infections, are infections transmitted within healthcare settings. For every one hundred patients admitted to hospitals, between seven and ten will acquire at least one type of HAI [1]. Nosocomial infections also play an important role in the spreading of pandemics, as the recent SARS-CoV-2 pandemic has shown [2, 3]. As such, they have become an important public health concern [4–7] because the prevalence of HAIs not only yields losses of financial resources but also causes substantial morbidity and mortality [8–10]. The control or mitigation of HAIs is challenging since, in modern healthcare systems, there exists a variety of potential risk factors contributing to the spread of HAIs [11, 12]. For instance, in terms of environmental aspects, the relatively restricted spaces in hospitals provide the conditions for the repeated and prolonged exposure to HAIs. Moreover, the various categories of spatial units play different roles in the transmission of HAIs as a consequence of their function.
Previous studies have shown that close contact is a major mode of transmission of healthcare-associated infections. Thus, the daily activities of healthcare workers, that form temporal networks of interactions, can potentially increase the risk of infection to patients and themselves [13–15]. In addition, the occupational nature of some healthcare workers also contributes to a certain extent to the transmission of HAIs between hospital units, making it necessary to adopt a system-wide view of all possible transmission paths. In summary, the risks associated with HAIs are heterogeneous and could depend on the characteristics of the categories to which the units belong and the various occupations of healthcare workers.
Over the last decade, measures aimed at preventing and containing HAIs have been developed, also accounting for the previously mentioned variability of transmission routes [16–18]. For instance, increasing hand hygiene and the regular use of personal protective equipment (PPE) are the most basic infection prevention and control strategies [12]. Although the implementation of disinfection measures has a significant effect on restraining the spread of HAIs, understanding the dynamics of HAIs that are transmitted by respiratory mechanisms can open the path for optimizing current strategies.
In terms of mathematical modeling of disease spreading, early on it was already shown that social networks in healthcare facilities are different from other networks since individuals have very particular roles, such as nurses and medical doctors [19]. Most models focus mainly on a single ward—usually ICUs—or in simplified hospital settings [20, 21]. Others focus on certain pathogens, or on the transmission from patient to patient and across hospitals [22, 23]. Yet, not much attention has been devoted to the different roles that healthcare workers’ profiles—besides nurses and medical doctors—can play.
In this work, we use data collected from anonymous surveys carried out in three hospitals on the behavior of workers to study the propagation of airborne respiratory pathogens. We construct the interaction network of workers within the hospital using a data-driven approach and simulate the transmission of respiratory disease [24, 25]. Our aim is to evaluate the infection risks of certain occupations, and how they are distributed through the different units of the hospital. To this end, we assess the infection risk of each spatial unit by calculating the disease hitting time and the number of infections produced in each location. We also evaluate the risk of different HCWs by computing the probability of getting infected and their potential infection capacities.
Our findings show that the transmission dynamics of a potential disease are very similar in the three hospitals analyzed, even though they are very different in terms of size and specialties. In particular, transmission is the highest in inpatient care units, and nurses are the HCWs at the highest risk, in line with previous studies based in different countries [26]. It is also noteworthy that these results could provide a valuable reference for monitoring the transmission of airborne infectious diseases within hospital settings and improve preventive measures to ultimately reduce the incidence of HAIs.
2 Materials and Methods
Site-specific surveys were created for three Canadian hospitals as part of the CONNECT I study (henceforth, hospitals A, B, and C, in order of size, being A the largest). In the survey, employees were asked to provide information on the amount of time they spent at each location of the hospital during a normal week. The survey identified 19 different HCW occupational categories and over 100 different locations in each hospital. These were further grouped into seven HCW occupational categories (nurses, physicians, researchers, technologists, administration personnel, and clerks) and six unit categories (auxiliary rooms, inpatient areas, medical-staff rooms, other-staff rooms, outpatient areas, and public areas) using domain knowledge from the hospital administrations. The total number of employees in the three hospitals was over 8,000 (, and in hospitals A, B, and C, respectively). In total, 38% of them responded to the surveys, with administration personnel and nurses being the two categories with the largest response rates. For further details on the CONNECT I study, we refer the reader to [15] in which a more complete description of the dataset is given.
In Figure 1, we report some of the results of the survey from hospital B (see also Supplementary Figure S1). We observe that there was an important heterogeneity in the weekly routines of different HCW groups. For instance, nurses and physicians did not visit auxiliary rooms, while administrative assistants and those that reported their category as other could be easily found there. Similarly, it is easier to find physicians in medical-staff rooms and public areas than nurses. Regarding their daily number of contacts with other co-workers, nurses were the single-category reporting the largest number, followed by administrative assistants and physicians. The category labeled as other was composed of very different HCWs and, thus, their contact patterns were also quite heterogeneous.
FIGURE 1
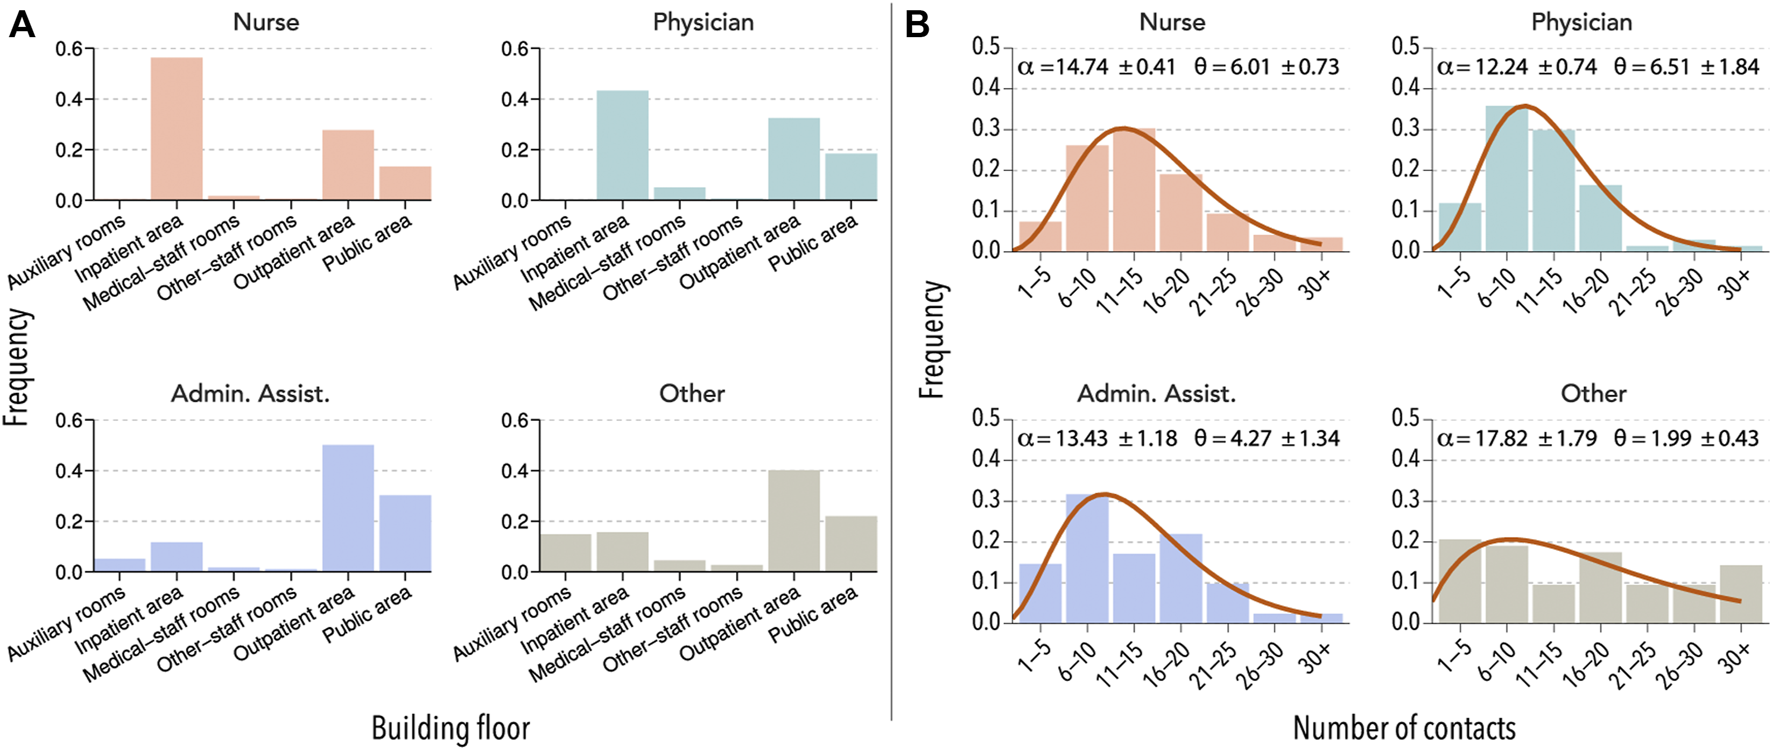
Interaction patterns of HCW. (A) Units visited by four selected HCW groups in hospital B during a normal week. (B) The number of direct contacts with other HCWs reported by members of each category during a typical day. The distributions are fitted to a right-censored negative binomial distribution, with α representing the mean and θ the dispersion parameter.
With this information, we applied a data-driven approach to construct the network of HCW interactions. Due to the lack of precise information, we did not include any patient interactions. Therefore, rather than analyzing the impact of a potential outbreak in the hospital, we focused on understanding how would an airborne disease spread throughout the hospital. To do so, we first assumed that two individuals can interact only if they have reported visiting the same unit. The connection relationship is denoted bywhere δi,u = 1 if the healthcare worker i has visited unit u and δi,u = 0 otherwise. To leverage the detailed information contained in the survey, we further took into account the amount of time that each individual spent in the said location with the aim of weighting the interaction. Therefore, in the generated network, each individual represents one node, and the weighted link between two nodes i and j in unit u is given by:where Ti,u represents the amount of time that individual i spent in a spatial unit u and Ti represents the total amount of time in the hospital reported by individual i. In Figure 2A, we schematically represent the connection relationship among the healthcare workers in our network. Figure 2B shows an example of the networks obtained with this technique. We can see that technologists tend to cluster together in a few locations, while nurses, who also tend to cluster together, can be found all over the hospital.
FIGURE 2
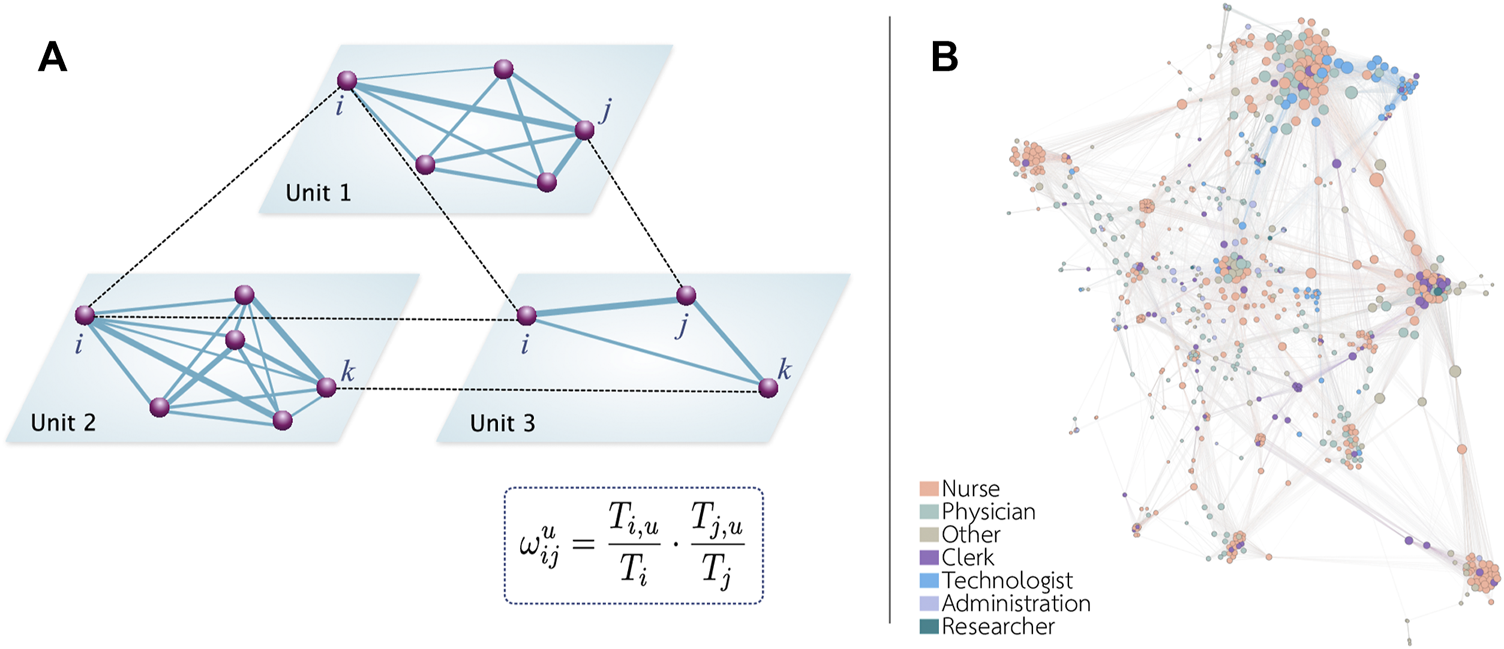
Schematic representation of the network. (A) The spatial activities of each individual allow us to determine if two individuals could potentially interact. We assume that there is a link between two individuals if they visit the same unit. The weight of each link depends on the time proportion spent by each individual in that unit. (B) Representation of the network obtained in hospital B. To facilitate the visualization, only links with a weight larger than 0.1 are shown.
To simulate the spread of an airborne infectious disease, we implemented an SIR model on top of the network of HCW interactions. In the model, a worker might be in one of three states: susceptible (S), infected (I), or recovered (R). An infected individual, i, transmits the disease to a susceptible individual j with probability P(S → I) = 1−exp (−βwijΔt), where β is the per-contact transmission probability. This process is run synchronously for all infected individuals at each time step t. Then, those individuals that were already infected at time t might recover with probability P(I → R) = 1−exp (−μΔt). We set β = 0.01 and μ = 0.10. The average strength (sum of all the weights of each node) in each network was 31, 23, and 18 for hospitals A, B, and C, respectively, yielding a value of R0 in the homogeneous approximation of 3.1, 2.3, and 1.8 [27]. Another possibility would be to fix R0 and obtain the corresponding value of the per-contact transmission probability that would yield that reproduction number in the hospital. The results that we report in this study do not change with this choice, and thus we have not included them in this work.
3 Results
3.1 Risk of Units
In this section, we assess the risk of each location in terms of its potential to spread an outbreak. Note that this does not capture where the outbreak originates. Instead, it was assumed that one HCW gets infected, either by a patient in the hospital, or outside, and then the outbreak spread through the other HCWs. This process was simulated by randomly choosing one node in the system and moving it into the infected compartment. Due to the stochasticity of the model, the results were averaged over 10,000 independent runs. In the Supplementary Material, we also explored the impact of some of these assumptions. In particular, Supplementary Figures S2, S3 show the effect of adding a constant flux of infections from the outside and Supplementary Tables S1, S2 the impact of the seed selection.
3.1.1 Hitting Time
The hitting time is defined as the average amount of time that it takes for the disease to reach a specific location [28]. In the case of hospital units, we defined it as the time until one HCW located in unit l gets infected, HTl. Therefore, the smaller the hitting time, the more at risk a location is. We then gauged the risk of each location in comparison to the rest by dividing each HTl by the average hitting time in the hospital, ⟨HT⟩. In Figure 3A, we show the risk computed using this procedure for each type of unit. We observe that in the three hospitals, the disease would arrive sooner in units under the category of inpatient area. Note also that, even though most locations categorized as public areas are at an average risk, the riskiest locations belong to the previously mentioned category. These are mainly cafeterias, which are visited by many employees and, thus, it is easy for the disease to reach them.
FIGURE 3
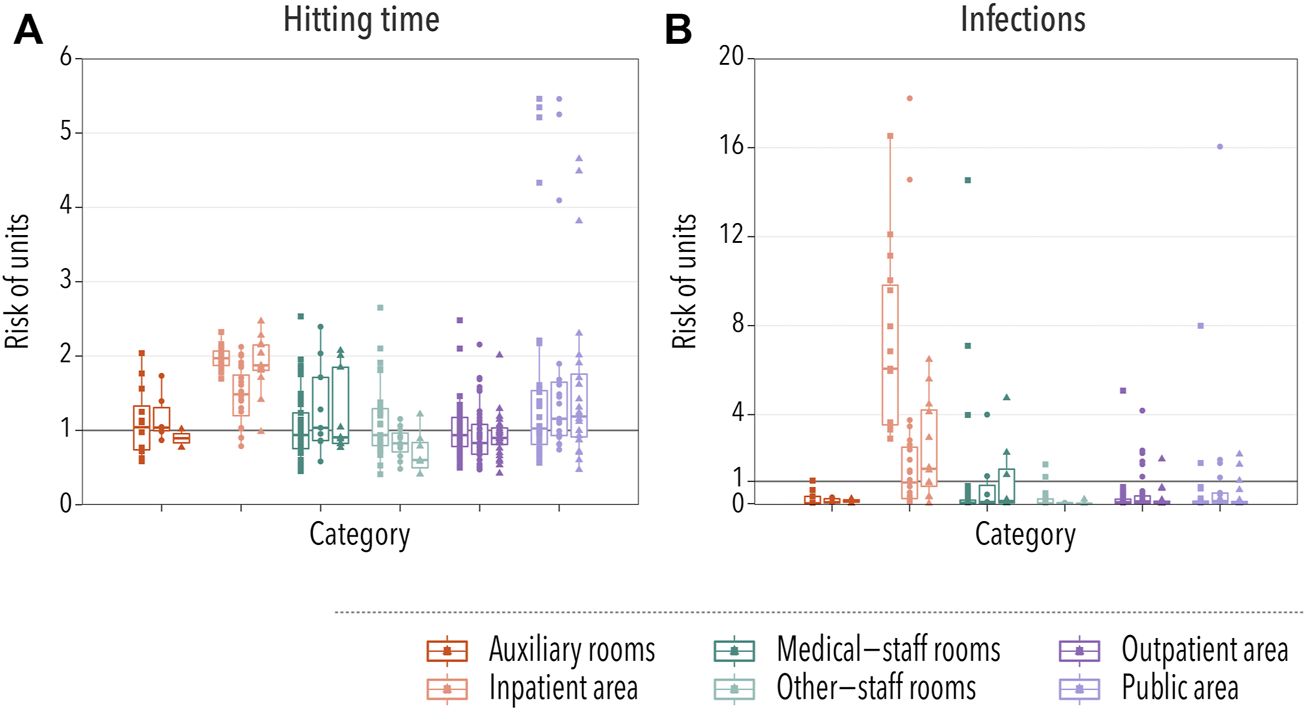
Spatial spreading of a disease in hospital settings. In all cases, each box-plot represents the median and the interquartile range of the risk associated with units under each category. Dots indicate the average risk of each individual location within the category, with squares, circles, and triangles representing hospitals A, B, and C, respectively. In panel (A), the relative risk of infection is gauged using the hitting time, while in panel (B) it is measured by taking into account the number of infections produced within each unit. The category of a unit was provided by the management of hospital A, and the same grouping criteria were used for the other hospitals. Two groups represent patient-care areas (inpatient area or outpatient area) while the other four groups are composed of units that are predominantly non-patient-care areas.
3.1.2 Number of Infections
We further explored the risk posed by each unit by computing the average number of infections produced in each unit, NIl. As in the previous case, we normalized this number by the average number of infections produced in any unit ⟨NI⟩ in order to compare different hospitals. The results, Figure 3B, agree with the previous observation that the inpatient area was the highest risk category. However, we observed an important contribution of some medical-staff rooms. A closer inspection revealed that these locations are laboratories and research locations, in which the number of different HCWs was not that large, but the ones that visit those areas were likely to spend an important amount of time there. Thus, even though it took longer for the disease to arrive, once it did, it could easily spread throughout the workers located in those rooms.
To briefly sum up, the results obtained from two methods reveal that the risk of spatial units belonging to inpatient care and public area categories is relatively higher than others in both methods. The units at lower risk were other-staff rooms (accounting and administration) and auxiliary rooms (laundry and housekeeping).
3.2 Risk of Individuals
As we saw in Figure 1, there was an important degree of heterogeneity across HCW occupations and their roles in different units. In what follows, we explore the risk associated with each occupation category in order to better understand the dynamics of the spreading. In [15], the 19 self-reported occupations identified in the surveys were grouped in four categories, but given the results from the previous section, we extracted two groups of HCW from the “other HCW” used in the study: technologist and researcher (note that in hospital C no one reported anything related to research as their occupation). We also split the “Admin/Support” category into administration and clerk due to the relatively large number of individuals in each category.
3.2.1 Probability of Getting Infected
A basic observable of the risk carried by an individual is the probability of getting infected. To obtain it, we ran 10,000 stochastic simulations and computed the probability that each individual got infected, PIi. Then, we divided it over the average probability of getting infected for all individuals, ⟨PI⟩, and grouped them according to their occupation, Figure 4A. In order to clearly show the differences in the risk between different groups of HCWs, we transform the box-plot into Table 1. In the table, the values of the median and interquartile range of the risk for each occupational group of HCWs are listed for each hospital. In this case, we observe that nurses and technologists were the HCWs at higher risk. In contrast, people working in administration were at a lower risk of getting infected. Note that interactions with patients were not included, and it is expected that nurses will have more contact with patients than other occupations. Yet, the probability of getting infected is greater for them, purely based on their contacts with other HCWs. These observations are largely consistent with the reality in hospital settings, highlighting the role that occupational heterogeneity plays in the spreading risk of HAIs.
FIGURE 4
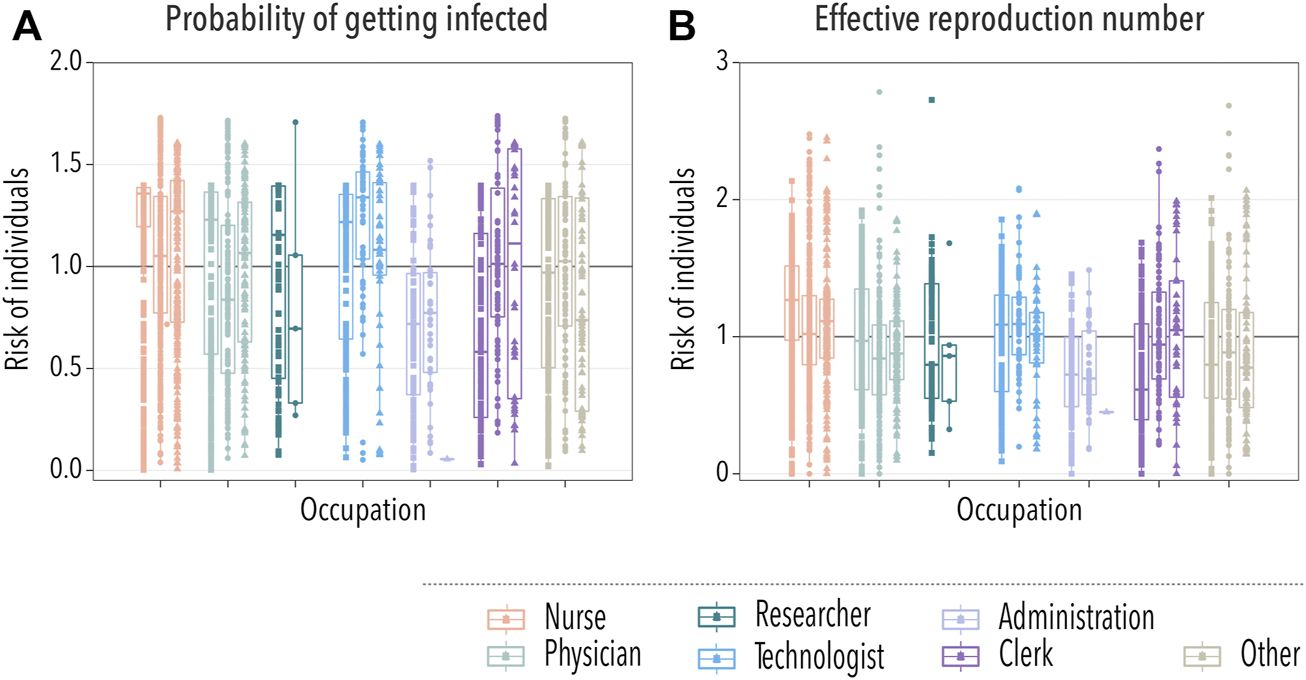
Spreading of the disease across HCWs. In all cases, each box-plot represents the median and interquartile range of the risk associated with each group of HCWs. Dots indicate the average risk of each worker within the category, with squares, circles, and triangles representing workers from hospitals A, B, and C, respectively. In panel (A), we show the relative risk measured as the probability of getting infected during an outbreak. In panel (B), the risk is gauged using the average number of infections produced by an individual during an outbreak.
TABLE 1
| Risk of getting infected | ||||||
| Category | Hospital A | Hospital B | Hospital C | |||
| Nurse | 1.36 | [1.20–1.39] | 1.05 | [0.77–1.34] | 1.27 | [0.73–1.42] |
| Physician | 1.23 | [0.57–1.37] | 0.84 | [0.48–1.20] | 1.07 | [0.63–1.32] |
| Researcher | 1.17 | [0.46–1.39] | 0.70 | [0.33–1.06] | – | – |
| Technologist | 1.21 | [0.63–1.36] | 1.34 | [1.04–1.46] | 1.08 | [0.96–1.41] |
| Administration | 0.71 | [0.38–0.97] | 0.78 | [0.48–0.97] | 0.06 | [0.06–0.06] |
| Clerk | 0.58 | [0.27–1.17] | 1.01 | [0.75–1.38] | 1.11 | [0.35–1.58] |
| Other | 0.95 | [0.50–1.33] | 1.03 | [0.71–1.34] | 0.74 | [0.29–1.34] |
Risk of HCWs assessed by the probability of getting infected. We show the median and interquartile range of the relative risk for each occupational group of HCWs in the box-plot. The values in bold represent the top two high-risk categories in each hospital.
3.2.2 Effective Reproduction Number
Last, we computed the effective reproduction number of each individual. That is, the average number of secondary infections they produce during an outbreak, Ri. We divided this quantity over the average effective reproduction number, ⟨R⟩, to gauge the risk posed by each individual. Then, we grouped them again according to their occupation, Figure 4B. In Table 2, we show the median and interquartile range of the risk associated with each group of HCWs for each hospital. In line with the previous observation, nurses were the category with the highest risk in terms of the effective reproduction number. Thus, not only it was more likely for nurses to get infected but also to spread the disease. As such, they should be a priority when implementing new protection measures against HAIs. On the other extreme, working under the administration category was relatively less risky.
TABLE 2
| Effective reproduction number | ||||||
| Category | Hospital A | Hospital B | Hospital C | |||
| Nurse | 1.27 | [0.98–1.52] | 1.02 | [0.80–1.30] | 1.12 | [0.85–1.28] |
| Physician | 0.97 | [0.61–1.35] | 0.84 | [0.58–1.09] | 0.88 | [0.69–1.11] |
| Researcher | 0.80 | [0.56–1.39] | 0.86 | [0.53–0.94] | – | – |
| Technologist | 1.09 | [0.60–1.30] | 1.09 | [0.87–1.29] | 1.02 | [0.81–1.18] |
| Administration | 0.72 | [0.49–0.99] | 0.70 | [0.58–1.04] | 0.45 | [0.45–0.45] |
| Clerk | 0.63 | [0.41–1.10] | 0.94 | [0.69–1.33] | 1.05 | [0.56–1.41] |
| Other | 0.80 | [0.55–1.23] | 0.89 | [0.55–1.20] | 0.77 | [0.48–1.18] |
Risk of HCWs measured using the effective reproduction number. We show the median and interquartile range of the risk for each occupational group of HCWs in the box-plot. The values in bold represent the top two high-risk categories in each hospital.
4 Discussion
In this work, we have considered the spatial and temporal information self-reported by healthcare workers in three hospitals in Canada to generate data-driven networks of interactions between HCWs. In hospital settings, the functional characteristics of some categories of units result in a particularly high risk of spreading healthcare-associated infections. On the other hand, the heterogeneity of the daily activities of HCWs might also constitute an important risk factor for the transmission of HAIs. Therefore, the main purpose of this work was to quantify the differences across categories of spatial units and workers. Accordingly, we delved into the dynamics of HAIs by implementing an SIR model on the generated networks to simulate the spread of an infectious disease within the hospital settings. This simplified model allowed us to understand the dynamics of the system without having to focus on the specific characteristics of a certain type of pathogen.
For the units, we proposed two risk indicators given by the disease hitting time and the number of infections generated per unit. The first metric allows quantifying how fast a given disease could reach different units in the hospital, while the second provides a measure of the spreading potential of a unit. We found that the risk levels of units exhibit heterogeneous and spatially distributed characteristics. In particular, the units labeled as inpatient care or public area showed higher risks of spreading a disease than others. On the contrary, the other-staff rooms and auxiliary rooms categories were comparatively at a lower spreading risk. Similarly, we quantitatively assessed the risk of groups of HCWs using two metrics. We focused on the impact of the diversity of occupations on the risks of HCWs by calculating the probability of getting infected and the effective reproduction number. The results indicate that HCWs belonging to the nurse category were the most susceptible to being infected and, at the same time, nurse was the occupation with the largest spreading potential in terms of the capacity to generate new infected individuals. In addition, most of the HCWs labeled as administration are comparatively less likely to get infected and transmit the disease to others. Therefore, overall, our results indicate which units and occupations should be preferentially targeted by prevention plans aimed at reducing, the probability of getting infected, the likelihood of generating infections, and the spreading of HAIs in hospital settings.
Last, a few remarks are in order. First, we observe that merely the size of the hospital already produces denser and more connected networks, which increases the value of R0 and thus facilitates the propagation of this type of infectious disease. Second, the networks were constructed using only the self-reported information on the interaction patterns among co-workers, disregarding the risk that some specific units might pose to the people working there, or the possibility of patients contributing to the spreading. However, we believe this limitation highlights something important. Based solely on the amount of time spent at each location, we have identified which areas and occupations are at the highest risk in terms of HAIs. These, in turn, are precisely areas with many patients and in which riskier activities take place, which can only increase their role in spreading HAIs. Thus, special attention should be paid to these interactions, rather than focusing only on patient-worker interactions. To conclude, it is important to note that this type of agent-based model requires the estimation of many parameters to calibrate them to real-world disease data, something beyond the scope of this study. However, there are promising inference techniques that have demonstrated their potential to make these mathematical models useful in real-world settings [29–33].
In summary, the data-driven model presented here provides insights into the dynamics of healthcare-associated infections in hospital settings. The findings reveal the key role of the diversity of categories of units and various occupations of HCWs on the risk of transmitting infectious diseases. In terms of controlling the transmission of HAIs, we believe that appropriate interventions could be developed through quantitatively assessing the risks of both units and individuals using data of the nature employed here. Finally, our work constitutes the first step towards more sophisticated analyses and models whose purpose is the optimization of the spatial organization of units and occupations of real settings to reduce the inherent risks of HAIs.
Statements
Data availability statement
The data analyzed in this study is subject to the following licenses/restrictions: The data collected in the surveys are not publicly available due to the inclusion of hospital administrative and human resources data. The networks constructed using the data extracted from the surveys can be downloaded from https://github.com/aaleta/hospital_networks or https://doi.org/10.5281/zenodo.6561171.
Author contributions
DL, AA, and YM designed the study. DL and AA carried out the research. DL, AA, and YM analyzed and interpreted the results. DL wrote the first draft of the manuscript. DL, AA, and YM contributed to the writing and have approved this manuscript.
Funding
The original work leading to the construction of the networks of interactions was supported by grants from the Canadian Institutes of Health Research (CIHR). DL acknowledges support from the China Scholarship Council through a PhD fellowship. AA and YM acknowledge partial support from the Government of Aragon and FEDER funds, Spain through grant E36-20R (FENOL), by MCIN/AEI and FEDER funds (grant PID2020-115800GB-I00), from Banco Santander (Santander-UZ 2020/0274) and by Soremartec S.A. and Soremartec Italia, Ferrero Group. The funders had no role in study design, data collection and analysis, decision to publish, or preparation of the manuscript.
Acknowledgments
We are deeply indebted to our friend and colleague Babak Pourbohloul, who sadly passed away at a very early stage of this project. He provided the data and was actively engaged in designing the study.
Conflict of interest
The authors declare that the research was conducted in the absence of any commercial or financial relationships that could be construed as a potential conflict of interest.
Publisher’s note
All claims expressed in this article are solely those of the authors and do not necessarily represent those of their affiliated organizations, or those of the publisher, the editors, and the reviewers. Any product that may be evaluated in this article, or claim that may be made by its manufacturer, is not guaranteed or endorsed by the publisher.
Supplementary material
The Supplementary Material for this article can be found online at: https://www.frontiersin.org/articles/10.3389/fphy.2022.882314/full#supplementary-material
References
1.
HaqueMMcKimmJSartelliMDhingraSLabricciosaFMIslamS. Strategies to Prevent Healthcare-Associated Infections: A Narrative Overview. RMHP (2020) 13:1765–80. Sep. 10.2147/rmhp.s269315
2.
LiYHuangXQianH. Role of Air Distribution in SARS Transmission during the Largest Nosocomial Outbreak in Hong Kong. Indoor Air (2005) 15(2):83–95. Apr. 10.1111/j.1600-0668.2004.00317.x
3.
Aaron RichtermanMD. Hospital-Acquired SARS-CoV-2 Infection: Lessons for Public Health. JAMA (2020) 324(21):2155–6. Dec. 10.1001/jama.2020.21399
4.
StonePW. Economic burden of Healthcare-Associated Infections: an American Perspective. Expert Rev Pharmacoeconomics Outcomes Res (2009) 9(5):417–22. oct. 10.1586/erp.09.53
5.
RevelasA. Healthcare - Associated Infections: A Public Health Problem. Niger Med J (2012) 53(2):59. 10.4103/0300-1652.103543
6.
ZimlichmanEHendersonDTamirOFranzCSongPYaminCKet alHealth Care–Associated Infections. JAMA Intern Med (2013) 173(22):2039. dec. 10.1001/jamainternmed.2013.9763
7.
DattaPRaniHChauhanRGombarSChanderJ. Health-care-associated Infections: Risk Factors and Epidemiology from an Intensive Care Unit in Northern India. Indian J Anaesth (2014) 58(1):30. 10.4103/0019-5049.126785
8.
AngelisGDMurthyABeyersmannJHarbarthS. Estimating the Impact of Healthcare-Associated Infections on Length of Stay and Costs. Clin Microbiol Infect (2010) 16(12):1729–35. dec. 10.1111/j.1469-0691.2010.03332.x
9.
UmscheidCAMitchellMDDoshiJAAgarwalRWilliamsKBrennanPJ. Estimating the Proportion of Healthcare-Associated Infections that Are Reasonably Preventable and the Related Mortality and Costs. Infect Control Hosp Epidemiol (2011) 32(2):101–14. feb. 10.1086/657912
10.
CalfeeDP. Crisis in Hospital-Acquired, Healthcare-Associated Infections. Annu Rev Med (2012) 63(1):359–71. feb. 10.1146/annurev-med-081210-144458
11.
DavisGSSevdalisNDrumrightLN. Spatial and Temporal Analyses to Investigate Infectious Disease Transmission within Healthcare Settings. J Hosp Infect (2014) 86(4):227–43. apr. 10.1016/j.jhin.2014.01.010
12.
HaqueMSartelliMMcKimmJBakarMBA. Health Care-Associated Infections - an Overview. Infect Drug Resist (2018) 11:2321–33. nov. 10.2147/idr.s177247
13.
GopalakrishnaGChooPLeoYSTayBKLimYTKhanASet alSARS Transmission and Hospital Containment. Emerging Infect Dis (2004) 10(3):395–400. mar. 10.3201/eid1003.030650
14.
MarcelJPAlfaMBaqueroFEtienneJGoossensHHarbarthSet alHealthcare-associated Infections: Think Globally, Act Locally. Clin Microbiol Infect (2008) 14(10):895–907. oct. 10.1111/j.1469-0691.2008.02074.x
15.
EnglishKMLangleyJMMcGeerAHupertNTellierRHenryBet alContact Among Healthcare Workers in the Hospital Setting: Developing the Evidence Base for Innovative Approaches to Infection Control. BMC Infect Dis (2018) 18(1). apr. 10.1186/s12879-018-3093-x
16.
FergusonJK. Preventing Healthcare-Associated Infection: Risks, Healthcare Systems and Behaviour. Intern Med J (2009) 39(9):574–81. sep. 10.1111/j.1445-5994.2009.02004.x
17.
PolgreenPMTassierTLPemmarajuSVSegreAM. Prioritizing Healthcare Worker Vaccinations on the Basis of Social Network Analysis. Infect Control Hosp Epidemiol (2010) 31(9):893–900. sep. 10.1086/655466
18.
WeberDJAndersonDRutalaWA. The Role of the Surface Environment in Healthcare-Associated Infections. Curr Opin Infect Dis (2013) 26(4):338–44. aug. 10.1097/qco.0b013e3283630f04
19.
UenoTMasudaN. Controlling Nosocomial Infection Based on Structure of Hospital Social Networks. J Theor Biol (2008) 254(3):655–66. Oct. 10.1016/j.jtbi.2008.07.001
20.
van KleefERobothamJVJitMDeenySREdmundsWJ. Modelling the Transmission of Healthcare Associated Infections: a Systematic Review. BMC Infect Dis (2013) 13(1):1–13. Dec. 10.1186/1471-2334-13-294
21.
AssabRNekkabNCrépeyPAstagneauPGuillemotDOpatowskiLet alMathematical Models of Infection Transmission in Healthcare Settings: Recent Advances from the Use of Network Structured Data. Curr Opin Infect Dis (2017) 30(4):410–8. Aug. 10.1097/qco.0000000000000390
22.
LeeBYMcGloneSMWongKFYilmazSLAveryTRSongYet alModeling the Spread of Methicillin-Resistant Staphylococcus aureus (MRSA) Outbreaks throughout the Hospitals in Orange County, California. Infect Control Hosp Epidemiol (2011) 32(6):562–72. Jun. 10.1086/660014
23.
RochaLECSinghVEschMLenaertsTLiljerosFThorsonA. Dynamic Contact Networks of Patients and MRSA Spread in Hospitals - Scientific Reports. Sci Rep (2020) 10(9336):1–10. Jun. 10.1038/s41598-020-66270-9
24.
AletaAMartin-CorralDy PionttiAPAjelliMLitvinovaMChinazziMet alModeling the Impact of Social Distancing, Testing, Contact Tracing and Household Quarantine on Second-Wave Scenarios of the COVID-19 Epidemic. Nat Hum Behav (2020) 4(9):964–71. aug. 10.1038/s41562-020-0931-9
25.
AletaAde ArrudaGFMorenoY. Data-driven Contact Structures: From Homogeneous Mixing to Multilayer Networks. PLOS Comput Biol (2020) 16(7):e1008035. jul. 10.1371/journal.pcbi.1008035
26.
van NiekerkJMSteinADotingMHELokateMBraakman-JansenLMAvan Gemert-PijnenJEWC. A Spatiotemporal Simulation Study on the Transmission of Harmful Microorganisms through Connected Healthcare Workers in a Hospital ward Setting. BMC Infect Dis (2021) 21(1):1–14. Dec. 10.1186/s12879-021-05954-7
27.
AndersonRMMedleyGFMayRMJohnsonAM. A Preliminary Study of the Transmission Dynamics of the Human Immunodeficiency Virus (HIV), the Causative Agent of AIDS. Math Med Biol (1986) 3(4):229–63. Jan. 10.1093/imammb/3.4.229
28.
BrockmannDHelbingD. The Hidden Geometry of Complex, Network-Driven Contagion Phenomena. Science (2013) 342(6164):1337–42. Dec. 10.1126/science.1245200
29.
CooperBSMedleyGFBradleySJScottGM. An Augmented Data Method for the Analysis of Nosocomial Infection Data. Am J Epidemiol (2008) 168(5):548–57. Sep. 10.1093/aje/kwn176
30.
PeiSMoroneFLiljerosFMakseHShamanJL. Inference and Control of the Nosocomial Transmission of Methicillin-Resistant Staphylococcus aureus. eLife (2018). Dec.
31.
ThomasAKhaderKReddALeecasterMZhangYJonesMet alExtended Models for Nosocomial Infection: Parameter Estimation and Model Selection. Math Med Biol (2018) 35(Suppl. ment_1):i29–i49. Apr. 10.1093/imammb/dqx010
32.
EyreDWLaagerMWalkerASCooperBSWilsonDJ. On Behalf of the CDC Modeling Infectious Diseases in Healthcare Program (MInD-Healthcare). Probabilistic Transmission Models Incorporating Sequencing Data for Healthcare-Associated Clostridioides Difficile Outperform Heuristic Rules and Identify Strain-specific Differences in Transmission. Plos Comput Biol (2021) 17(1):e1008417. Jan. 10.1371/journal.pcbi.1008417
33.
SenPFredrikLJeffreyS. Identifying Asymptomatic Spreaders of Antimicrobial-Resistant Pathogens in Hospital Settings. Proc Natl Acad Sci USA (2021) 118(37):e2111190118. Sep.
Summary
Keywords
epidemic modeling, interaction patterns, survey data, hospital infections, networks
Citation
Lu D, Aleta A and Moreno Y (2022) Assessing the Risk of Spatial Spreading of Diseases in Hospitals. Front. Phys. 10:882314. doi: 10.3389/fphy.2022.882314
Received
23 February 2022
Accepted
22 April 2022
Published
08 June 2022
Volume
10 - 2022
Edited by
Feng Fu, Dartmouth College, United States
Reviewed by
Sen Pei, Columbia University, United States
Yitong Huang, Northwestern University, United States
Updates
Copyright
© 2022 Lu, Aleta and Moreno.
This is an open-access article distributed under the terms of the Creative Commons Attribution License (CC BY). The use, distribution or reproduction in other forums is permitted, provided the original author(s) and the copyright owner(s) are credited and that the original publication in this journal is cited, in accordance with accepted academic practice. No use, distribution or reproduction is permitted which does not comply with these terms.
*Correspondence: Alberto Aleta, albertoaleta@gmail.com
This article was submitted to Social Physics, a section of the journal Frontiers in Physics
Disclaimer
All claims expressed in this article are solely those of the authors and do not necessarily represent those of their affiliated organizations, or those of the publisher, the editors and the reviewers. Any product that may be evaluated in this article or claim that may be made by its manufacturer is not guaranteed or endorsed by the publisher.