 Jiachen Ye
 Qitong Hu
 Peng Ji
 Marc Barthelemy5,6*
- 1Institute of Science and Technology for Brain-Inspired Intelligence, Fudan University, Shanghai, China
- 2Key Laboratory of Computational Neuroscience and Brain-Inspired Intelligence (Fudan University), Ministry of Education, Shanghai, China
- 3MOE Frontiers Center for Brain Science, Fudan University, Shanghai, China
- 4School of Mathematical Sciences, Shanghai Jiao Tong University, Shanghai, China
- 5Institut de Physique Théorique, Université Paris Saclay, CEA, CNRS, Paris, France
- 6Centre d’Analyse et de Mathématique Sociales, (CNRS/EHESS), Paris, France
Understanding how interurban movements can modify the spatial distribution of the population is important for transport planning but is also a fundamental ingredient for epidemic modeling. We illustrate this on vacation trips for all transportation modes in China during the Lunar New Year and compare the results for 2019 with the ones for 2020 where travel bans were applied for mitigating the spread of a novel coronavirus (COVID-19). We first show that inter-urban travel flows are broadly distributed and display both large temporal and spatial fluctuations, making their modeling very difficult. When flows are larger, they appear to be more dispersed over a larger number of origins and destinations, creating de facto hubs that can spread an epidemic at a large scale. These movements quickly induce (in about a week for this case) a very strong population concentration in a small set of cities. We characterize quantitatively the return to the initial distribution by defining a pendular ratio which allows us to show that this dynamics is in general very slow and even stopped for the 2020 Lunar New Year due to travel restrictions. Travel restrictions obviously limit the spread of the diseases between different cities, but have thus the counter-effect of keeping high concentration in a small set of cities, a priori favoring intra-city spread, unless individual contacts are strongly limited. These results shed some light on the statistics of interurban movements and how they modify the national distribution of populations, a crucial ingredient for devising effective control strategies at a national level.
Introduction
The 2020 Chinese Lunar New Year period witnessed the outbreak of a novel coronavirus (COVID-19) in Wuhan, China, which quickly infected other countries before becoming a pandemic [1]. The proximity of this outbreak with the Chinese Spring Festival, a period of travel with high traffic loads, provided terrible conditions for the spread of this disease. With an increasing amount of confirmed cases, more attention has been devoted to modeling the spread of COVID-19 from various aspects such as determining the value of the reproductive number [2–7], of the incubation period [8–10]. In general, analytical modeling plays of course an important role in the prediction of the spread and allows in particular to test control strategies [11], which was verified in this case too [12–22]. Particularly important was the estimatimation of probability to export the disease in other countries [19, 23, 24], and were how effective travel restrictions inside China [19].
Demographic information and mobility, either under the form of data or given by transportation models (see for example the review [25]), are crucial for modeling infectious diseases [26], including this COVID-19. This sort of data is also useful for transport planning [27], city livability [28], for congestion analysis and prediction. Mobility in general concerns either the global scale with movements between countries [18–21], or the national scale between cities, or even inside cities [20–22]. Here we will mostly focus on inter-urban mobility for all types of transport modes, and in contrast with most of the epidemiological studies, we will not model the spread of the disease and instead but will focus on two –interrelated– aspects. First we will focus on statistical properties of movements between cities (in a holiday period) and how the population distribution is affected by these large scale seasonal migrations. This leads us to the second aspect that we will consider, namely, the possible impact of these movements on the epidemic spread between cities. More precisely, we will investigate the statistical properties of traffic flows between cities during the Chinese Spring Festival in 2020 and in 2019. These movements are essentially due to workers coming back to their hometown for the new year holidays and must not be confused with interurban migration where individuals change their town residence. An important point to note is that the comparison of the traffic flows for 2019 and for 2020, where travel restrictions took place, gives us an opportunity to uncover some fundamental properties of mobility. This knowledge is fundamental for understanding and modeling mobility at the national scale. Additionally, it is worth to note that network measure for spatial-temporal weighted networks could also provide fundamental information and deserves future attention [29, 30].
Results
Statistics of interurban flows
We will first study standard statistical properties of interurban flows, obtained from migration data provided by Baidu Qianxi (see Material and Methods). This dataset enables us to monitor the traffic flows between cities. For each day d (d = 1, 2, …, T), we extract the number of individuals N (i, j, d) going from city i to city j with any travel mode. The migration data can thus be taken as a directed, weighted network of flows between the set of n = 296 cities of China whose populations are also known (see Material and Methods). We collected the data for the Spring Festival of 2020 (from Jan. 1st to Feb. 12th, 2020), and for assessing the impact of travel bans, we also collected the data for the Spring Festival of 2019 (which according to the Chinese lunar calendar takes place from Jan. 12th to Feb. 23rd, 2019).
Large heterogeneity of flows
We first consider the distribution of all flows of individuals N (i, j, d) for all cities i and j and all days d, as shown in Figure 1A. The maximum flow is of order 105 and the average of order 103 indicates a broad distribution. A power law fit is consistent with this picture with an exponent α ≈ 2.3 (Figure 1A). This heterogeneity is confirmed in Figure 1B which shows both the average value μd and the standard deviation σd computed over all inter-city flows (for each day d). For most days, the relative dispersion σd/μd is of order 5–10. This heterogeneity is probably due to the large diversity of cities, which serve as origins or destinations of flows (see below for further analysis). An important feature that Figure 1B exhibits the sharp drop of the standard deviation after Jan. 25th, the Lunar New Year (LNY), which is mainly due to the travel ban (Supplementary Figures S1, S3 in the Supplementary Material (SM) for a detailed discussion) as shown below.
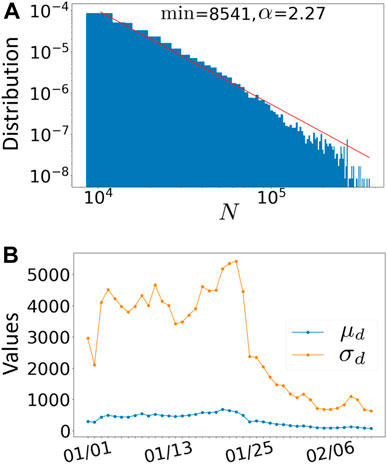
FIGURE 1. Statistics of interurban flows. (A) Distribution of all traffic flows N (i, j, d) in loglog. The line is a power law fit of the form N−α with exponent α = 2.27 with fitting method described in [29]. (B) Average and standard deviation of the flows N (i, j, d) averaged over traffic flows versus the date d (from 1st January to 12th February).
Temporal versus spatial fluctuations
In order to understand the nature of the different fluctuations affecting the flows N (i, j, d), we compute the relative standard deviation
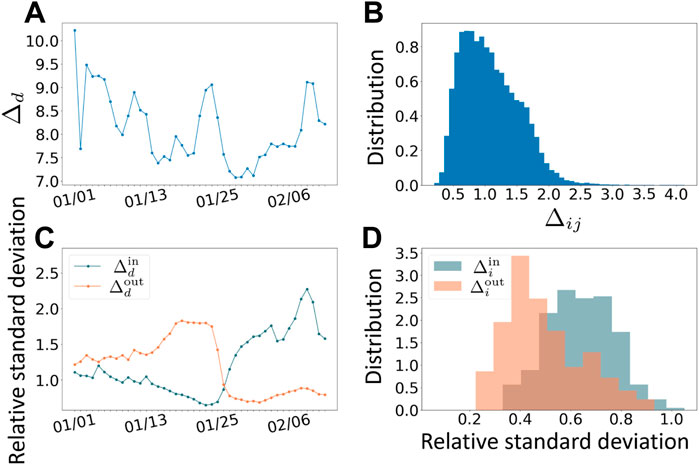
FIGURE 2. Temporal versus spatial fluctuations. (A) Relative standard deviation of the flows N averaged over traffic flows and represented here versus time. (B) Distribution of the relative standard deviation of N averaged over time. (C) Relative standard deviation of Nin(i, d) and Nout(i, d) averaged over cities and shown here versus time. (D) Distribution of the relative standard deviation of Nin and Nout averaged over time.
The next natural quantities, which can be computed over this network, are the incoming flows Nin(i, d) and outgoing flows Nout (i, d) defined by
respectively. We measure in the same way as above various measures of fluctuations, either averaged over cities or over time, leading to the quantities
Structure of incoming and outgoing flows
The value of incoming or outgoing flows gives information about the volume of migrations, but not about the number of important origins or destinations. In order to characterize the dispersion over different cities, we denote by
where O and D represent the number of elements of the sets
We plot these Gini indices computed for each city versus the traffic flows to or from this city. These Figures 3A,B show that on average the larger the traffic flows are, the more dispersed they are over a larger number of origins or destinations. In terms of epidemic control, it is clear that cities with a large flow Nin and a small Gini index Gin is the most critical, in the sense that many people from many different cities are converging to the same place. Equally, cities with a large Nout and a small Gout should be particularly monitored, since they can act as hubs in spreading the disease over the inter-city network. Figures 3C,D show the top 5 critical cities, including Beijing, Shanghai, Chongqing and Guangzhou for both the incoming and outgoing flows, Shenzhen for the incoming flows, and Dongguan for the outgoing flows.
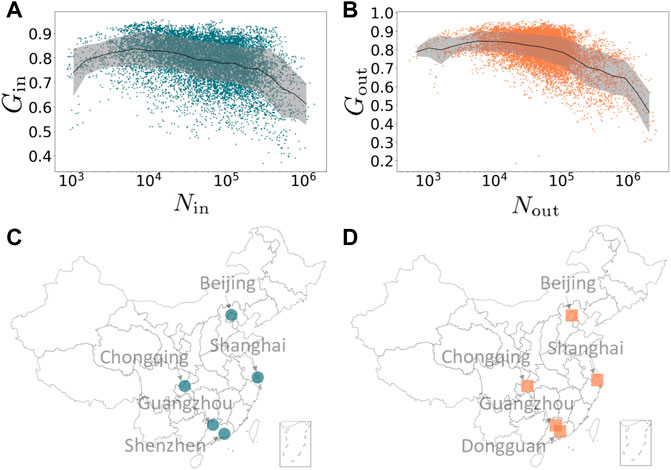
FIGURE 3. Relationship between Gini index and incoming/outgoing flows. (A) Gin versus Nin for all cities and days. (B) Gout versus Nout for all cities and days (shown in loglog). The thick line indicates the average of Gin (Gout) versus of Nin (Nout) and the shaded area represents the standard deviation of the average. Top 5 critical cities for (C) incoming flows and (D) outgoing flows.
Statistical structure of the national population
An important effect of incoming and outgoing flows is that they change the population structure. Some cities will receive a large number of individuals while for others we expect a decrease of their population. Migration thus affects the statistical structure of the national population and in this section we will characterize this effect.
Temporal evolution of population structure
In order to characterize the disparity of the population distribution and how it varies during seasonal migrations, we consider the population of city i at time d given by
where P0(i) represents the population of city i without incoming and outgoing flows. The Gini index for the city population of the whole country at day d is then given by
where
This quantity captures the degree of population concentration without any traffic flows, where
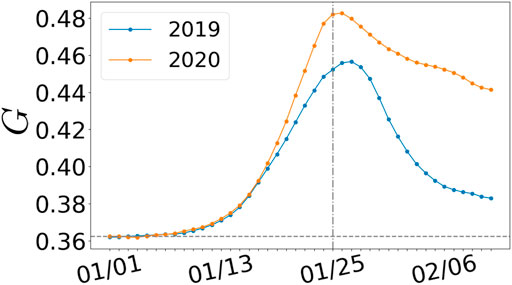
FIGURE 4. Variation of the Gini index. Temporal variations around the Spring Festival holidays of the population Gini index for 2019 and 2020. The horizontal dotted line represents the value “at rest”. The vertical line indicates the day of the LNY.
We plot both the results for 2019 and 2020. In both cases we see an important increase of the Gini index in a short time (about a week): When the LNY is approaching, people go back from workplaces to hometowns for reunion with families. A smaller set of cities concentrates these meetings with the number of important cities reaching its minimum and the Gini index reaching its peak on the LNY. Based on the Gini index, we estimate the number of “important” cities where the concentration takes place through [n (1 − G)], where [⋅] denotes the integer part (Supplementary Material for details where we show in Supplementary Figure S6 this number versus time and indeed observe an important drop when approaching the LNY). After the LNY (Jan. 25th), individuals are going back home and the Gini coefficient relaxes back to its original value, but much slower. We observe that in 2020, the increase of the Gini index is larger and, due to travel bans, the decrease even slower than normal. The reason may be that after the outbreak of COVID-19, almost all regions have deferred the time of resuming works and classes after the Spring Festival holiday. For example, Shanghai proposed that companies not crucial to the nation should not resume works before Feb. 10th and that schools should provide online classes. At this point, the population structure at the national level is far from being back to normal. These different results show that these seasonal movements induce a strong concentration of individuals in a relative small set of cities, and that travel bans tend to keep this situation of high concentration.
Return to “equilibrium”: Pendular ratio
We observe in Figure 4 that after the LNY there is a decrease of the Gini index indicating a return to normal state characterized by a lower concentration of individuals. In order to characterize quantitatively this return to the original state (before holidays), we measure the gap between individuals going out from a city before the LNY and coming back after it. This gap defines a ‘pendular ratio’ given by
where df is a range of days around the LNY
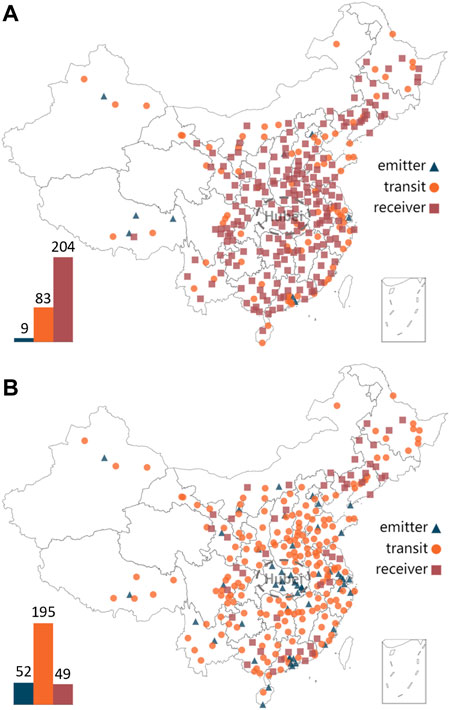
FIGURE 5. Spatial distribution of different categories of cites. (A) Emitter, receiver and transit cities according to the value of R (i, 1) for 2019 with the number of three categories of cites at lower left corner. (B) Emitter, receiver and transit cities according to the value of R (i, 1) for 2020 with the number of three categories of cites at lower left corner.
We show in Figures 6A,B the pendular ratio for 2019 and 2020 for all cities and we highlight 5 cities: Wuhan, Beijing, Tianjin, Chongqing, and Shanghai, corresponding to the origin place of COVID-19 and four province-level municipalities. We note here that the curve corresponding to Wuhan is at the bottom of all cities in Figures 6B, reflecting the success of sealing off Wuhan from all outside contact to stop the spread of the disease since Jan. 23rd.
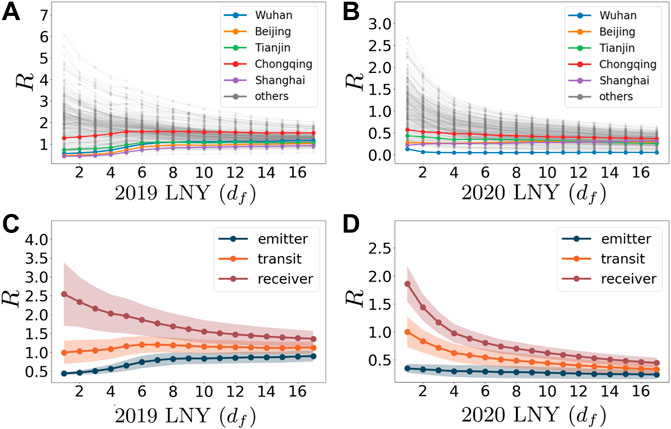
FIGURE 6. Pendular ratio comparison. (A) Pendular ratio for all cities versus days df from LNY in 2019. We highlight five important cities. (B) Pendular ratio for all cities versus days df from LNY in 2020 with highlight of 5 cities. (C) Average values of the pendular ratio over cities according to the classification (receiver, emitter or transit cities) versus days from LNY in 2019. The colored areas correspond to one standard deviation. (D) Mean value of the pendular ratio over cities according to the classification versus days from LNY in 2020 with the shaded area representing the corresponding standard deviation.
In Figures 6C,D, we show this pendular ratio for 2019 and 2020 for the different types of cities (we average over cities in a given category, emitter, receiver or transit). Results show that the standard deviation is small for the three groups adding credit to their definition. In addition, compared to 2019, the values of R (i, 1) corresponding to 2020 are much smaller. In 2019, the pendular ratio of all the three types of cities returns to 1, meaning that the majority of individuals who went away for the holidays came back. The situation for 2020 is very different with a pendular ratio for all types of cities that converges to a value less than 1 (even less than 0.5), indicating that the majority of people who went away for the holidays did not come back yet. This result remains consistent with the conclusion of Gini index (Figure 3) about a larger concentration in cities and the effect of travel bans.
Finally, we note here that we additionally implemented our whole analysis at the province level (Supplementary Material) and the results obtained are similar to those obtained at the city level.
Discussion
Our findings thus concern four different aspects. First, the traffic flows between cities are very heterogeneous not only spatially but also from a temporal perspective. Such a large heterogeneity could be induced by the large flows observed during this particular period of the Spring Festival and also by travel bans. We note here that similar results apply also to an aggregated level, i.e. the incoming and outgoing flows for provinces also display important heterogeneities. This heterogeneity aspect is crucial for understanding and modeling epidemic spreading for which we know its importance [31, 32] and more generally for most processes on networks [33]. We quantify the dispersion of origins/destinations of the incoming/outgoing flows showing that for larger flows we have a larger variety of origins and destinations. We also show that during these seasonal migrations of the Spring Festival, the national structure of population changes quickly with a larger concentration in a small set of cities. This concentration decays normally in time after the festivities but travel bans slow down this return to the initial state. It is natural to try to stop the geographical spread of the disease by interurban movements, but on the other hand, large concentration in cities can favor the spread at the city level and increase the number of infected cases. This concentration can be compensated by a more important control at the individual contact level which is what was done in cities such as Wuhan. These results are in line with epidemic modeling results [21], where travel quarantine is effective only when combined with a large reduction of intra-community transmission.
The study presented here focuses on this particular and very important event of the Chinese Lunar New Year, and it would be interesting to test these properties for other events and for other countries where a large fraction of the population moves within the country. Our results highlight the importance of mobility studies for modeling a variety of processes and in particular for understanding and modeling the spread of epidemics. Effective mitigating strategies need to take into account the change of population structure that we exhibited here.
Methods
Data
We obtained the migration data from Baidu Qianxi (http://qianxi.baidu.com), by using Baidu Location Based Services, and Baidu Tianyan, for all transportation modes. It provides the following two datasets: Migration index reflecting the size of the population moving into or out from a city/province, and migration ratio capturing the proportion of each origins and destination. We collected the data during Chinese Spring Festival period of 2020 (from Jan. 1st to Feb. 12th, 2020). For parallel comparison, the migration index during the same period of 2019 (re-scaled according to Chinese lunar calendar, from Jan. 12th to Feb. 23rd, 2019) is also used.
In addition to the migration data, we collected the demographic from China Statistical Yearbook (http://www.statsdatabank.com), an annual statistical publication, which reflects comprehensively economic and social development of China. It covers key statistical data in recent years at both the city level and the province level. We collected the data of population of 31 province-level regions and 296 city-level regions from China Statistical Yearbook 2019, the latest edition provided.
Data availability statement
The original contributions presented in the study are included in the article/Supplementary Material, further inquiries can be directed to the corresponding author.
Author contributions
PJ and MB designed the study, QH collected the data, and JY performed calculations. PJ and MB analyzed and interpreted the data and wrote the manuscript.
Acknowledgments
PJ acknowledges National Science and Technology Innovation 2030 Major Program (2021ZD0204500, 2021ZD0204504), National Natural Science Foundation of China (62076071), and Shanghai Municipal Science and Technology Major Project (No. 2018SHZDZX01). MB thanks the cityof Paris (Paris 2030) for funding.
Conflict of interest
The authors declare that the research was conducted in the absence of any commercial or financial relationships that could be construed as a potential conflict of interest.
Publisher’s note
All claims expressed in this article are solely those of the authors and do not necessarily represent those of their affiliated organizations, or those of the publisher, the editors and the reviewers. Any product that may be evaluated in this article, or claim that may be made by its manufacturer, is not guaranteed or endorsed by the publisher.
Supplementary material
The Supplementary Material for this article can be found online at: https://www.frontiersin.org/articles/10.3389/fphy.2022.967870/full#supplementary-material
References
1. Hernández Jc Wee S, McNeil DG. W.h.o. declares global emergency as wuhan coronavirus spreads. The New York Times (2020).
2. Cao Z, Zhang Q, Lu X, Pfeiffer D, Jia Z, Song H, Zeng DD. Estimating the effective reproduction number of the 2019-ncov in China. medRxiv (2020).
3. Tang B, Wang X, Qian L, Tang S, Xiao Y, Wu J. Estimation of the transmission risk of the 2019-ncov and its implication for public health interventions. J Clin Med (2020) 9(2):462. doi:10.3390/jcm9020462
4. Riou J, Althaus CL. Pattern of early human-to-human transmission of wuhan 2019 novel coronavirus (2019-ncov), december 2019 to january 2020. Eurosurveillance (2020) 25(4):2020. doi:10.2807/1560-7917.es.2020.25.4.2000058
5. Zhao S, Lin Q, Ran J, Musa SS, Yang G, Wang W, et al. Preliminary estimation of the basic reproduction number of novel coronavirus (2019-ncov) in China, from 2019 to 2020: A data-driven analysis in the early phase of the outbreak. International Journal of Infectious Diseases (2020).
6. Park SW, Champredon D, Earn DJD, Li M, Weitz JS, Grenfell BT, Dushoff J. Reconciling early-outbreak preliminary estimates of the basic reproductive number and its uncertainty: A new framework and applications to the novel coronavirus (2019-ncov) outbreak. medRxiv (2020). doi:10.1098/rsif.2020.0144
7. Zhang J, Litvinova M, Wang W, Wang Y, Deng X, Chen X, et al. Evolving epidemiology of novel coronavirus diseases 2019 and possible interruption of local transmission outside hubei province in China: A descriptive and modeling study. medRxiv (2020).
8. Backer JA, Klinkenberg D, Wallinga J. Incubation period of 2019 novel coronavirus (2019-ncov) infections among travellers from wuhan, China, 20–28 january 2020. Eurosurveillance (2020) 25(5):2000062. doi:10.2807/1560-7917.es.2020.25.5.2000062
9. Read JM, JessicaBridgen RE, DerekCummings AT, Ho A, Jewell CP. Novel coronavirus 2019-ncov: Early estimation of epidemiological parameters and epidemic predictions. medRxiv (2020).
10. Liu T, Hu J, Kang M, Lin L, Zhong H, Xiao J, et al. Transmission dynamics of 2019 novel coronavirus (2019-ncov) (2020).
11. Heesterbeek H, Anderson RM, Andreasen V, Bansal S, Angelis D, Dye C, et al. Modeling infectious disease dynamics in the complex landscape of global health. Science (2015) 347(6227):aaa4339. doi:10.1126/science.aaa4339
12. Liang Y, Xu D, Fu S, Gao K, Huan J, Xu L, Jia-da L. A simple prediction model for the development trend of 2019-ncov epidemics based on medical observations (2020). arXiv preprint arXiv:2002.00426.
13. Chen Y, Cheng J, Jiang Y, Liu K. A time delay dynamical model for outbreak of 2019-ncov and the parameter identification (2020). arXiv preprint arXiv:2002.00418.
14. Ming W-K, Huang J, Zhang CJP. Breaking down of healthcare system: Mathematical modelling for controlling the novel coronavirus (2019-ncov) outbreak in wuhan, China. bioRxiv (2020).
15. Majumder M, Mandl KD. Early transmissibility assessment of a novel coronavirus in wuhan, China. China (2020). p. 2020.
16. Chen Z, Zhang W, Lu Y, Guo C, Guo Z, Liao C, et al. From sars-cov to wuhan 2019-ncov outbreak: Similarity of early epidemic and prediction of future trends. CELL-HOST-MICROBE-D-20-00063 (2020).
17. Li J. A robust stochastic method of estimating the transmission potential of 2019-ncov (2020). arXiv preprint arXiv:2002.03828.
18. Wu JT, Leung K, Leung GM. Nowcasting and forecasting the potential domestic and international spread of the 2019-ncov outbreak originating in wuhan, China: A modelling study. The Lancet (2020) 395. doi:10.1016/S0140-6736(20)30260-9
19. Chinazzi M, Jessica T, Gioannini C, Litvinova M, Pastore A, Rossi L, et al. Preliminary assessment of the international spreading risk associated with the 2019 novel coronavirus (2019-ncov) outbreak in wuhan city. USA: Center for Inference and Dynamics of Infectious Diseases (2020).
20. Lai S, Bogoch I, Watts A, Khan K, Li Z, Tatem A. Preliminary risk analysis of 2019 novel coronavirus spread within and beyond China (2020).
21. Chinazzi M, JessicaDavis T, Ajelli M, Gioannini C, Litvinova M, Merler S, et al. The effect of travel restrictions on the spread of the 2019 novel coronavirus (2019-ncov) outbreak. Science (2020).
22. Qian X, Sun L, Ukkusuri SV. Scaling of contact networks for epidemic spreading in urban transit systems (2020). arXiv preprint arXiv:2002.03564.
23. Pullano G, Pinotti F, Valdano E, Boëlle P, Poletto C, Colizza V. Novel coronavirus (2019-ncov) early-stage importation risk to Europe, january 2020. Eurosurveillance (2020) 25(4):2020. doi:10.2807/1560-7917.es.2020.25.4.2000057
24. Gilbert M, Pullano G, Pinotti F, Valdano E, Poletto C, Boëlle P-Y, et al. Preparedness and vulnerability of african countries against importations of Covid-19: A modelling study. The Lancet (2020) 395. doi:10.1016/S0140-6736(20)30411-6
25. Barbosa H, Barthelemy M, Ghoshal G, James CR, Lenormand M, Louail T, et al. Human mobility: Models and applications. Phys Rep (2018) 734:1–74. doi:10.1016/j.physrep.2018.01.001
26. Balcan D, Colizza V, Gonçalves B, Ramasco J, Vespignani A. Multiscale mobility networks and the spatial spreading of infectious diseases. Proc Natl Acad Sci U S A (2009) 106(51):21484–9. doi:10.1073/pnas.0906910106
28. Bassolas A, Barbosa-Filho H, Dickinson B, Dotiwalla X, Paul E, Gallotti R, et al. Hierarchical organization of urban mobility and its connection with city livability. Nat Commun (2019) 10(1):4817–0. doi:10.1038/s41467-019-12809-y
29. Alstott J, Bullmore E, Powerlaw DP. A Python package for analysis of heavy-tailed distributions. Plos One (2014) 9:e85777. doi:10.1371/journal.pone.0085777
30. Dixon PM, Weiner J, Mitchell-Olds T, Woodley R. Bootstrapping the gini coefficient of inequality. Ecology (1987) 68(5):1548–51. doi:10.2307/1939238
31. Pastor-Satorras R, Vespignani A. Epidemic spreading in scale-free networks. Phys Rev Lett (2001) 86(14):3200–3. doi:10.1103/physrevlett.86.3200
32. Barthélemy M, Barrat A, Pastor-Satorras R, Vespignani A. Velocity and hierarchical spread of epidemic outbreaks in scale-free networks. Phys Rev Lett (2004) 92(17):178701. doi:10.1103/physrevlett.92.178701
Keywords: COVID-19, interurban movements, spatial distribution, transportation modes, baidu qianxi
Citation: Ye J, Hu Q, Ji P and Barthelemy M (2022) The effect of interurban movements on the spatial distribution of population. Front. Phys. 10:967870. doi: 10.3389/fphy.2022.967870
Received: 13 June 2022; Accepted: 25 July 2022;
Published: 25 August 2022.
Edited by:
Ye Wu, Beijing Normal University, ChinaReviewed by:
Deniz Eroglu, Kadir Has University, TurkeyPing Li, Southwest Petroleum University, China
Copyright © 2022 Ye, Hu, Ji and Barthelemy. This is an open-access article distributed under the terms of the Creative Commons Attribution License (CC BY). The use, distribution or reproduction in other forums is permitted, provided the original author(s) and the copyright owner(s) are credited and that the original publication in this journal is cited, in accordance with accepted academic practice. No use, distribution or reproduction is permitted which does not comply with these terms.
*Correspondence: Peng Ji, cGVuZ2ppQGZ1ZGFuLmVkdS5jbg==; Marc Barthelemy, bWFyYy5iYXJ0aGVsZW15QGlwaHQuZnI=