 Vlad Avrigeanu
 Marilena Avrigeanu
- Horia Hulubei National Institute for Physics and Nuclear Engineering (IFIN-HH), Magurele, Romania
A concurrent assessment of all measured excitation functions for various reactions induced by neutrons on 93Nb, in addition to the results of TENDL-2021 and default parameters in TALYS-1.96, is given in this work. We use consistent parameter sets that were formerly obtained or validated by the analysis of other independent data, while no empirical rescaling factors of γ and/or neutron widths have been used. The correlation between the measured error bars of the primary data providing the consistent input parameters and the final uncertainty bands of the calculated results have been pointed out. At the same time, a proper account in this work of all available data for competitive reaction channels prevented compensation effects of less accurate model parameters. Remaining questions and the need for additional measurements are emphasized.
1 Introduction
The interest in niobium has followed its application in structural materials of nuclear reactors, activation monitor in reactor dosimetry, 14 MeV neutron flux determination, and element of superconductor alloys in fusion reactors. A consequent large body of experimental data for neutron interactions with the 93Nb nucleus also guided its use as a “sample problem” [1] in statistical Hauser–Feshbach (HF) [2] and pre-equilibrium emission (PE) [3] model calculations [4–10]. However, rather sparse measured data, for neutron-induced reactions on this only Nb natural isotope are yet pointing out a need of more accurate measurements to settle its evaluation [11–13].
Moreover, the concurrent assessment of all measured excitation functions for various reactions induced by neutrons on 93Nb, in addition to the results of using default parameters within the worldwide used computer code TALYS-1.96 [14] and the currently related TENDL-2021 evaluation [15], remains an actual goal of further nuclear model analysis. This demand has been confirmed within a recent assessment of the α-particle emission in neutron-induced reactions on Zr, Nb, and Mo stable isotopes [16]. Furthermore, we look for a proper account of all available data for competitive reaction channels to prevent compensation effects of less accurate model parameters.
Consequently, we have paid more attention to the use of consistent parameter sets that are formerly obtained or validated by the analysis of other independent data [17]. Thus, no empirical rescaling factors of γ and/or neutron widths are involved. On the other hand, detailed analyses based on consistent input parameter sets are needed to eventually improve the global parameters for involvement in large-scale evaluations. Such a case has been that of the α-particle optical model potential [18] adopted as the corresponding default option of TALYS, whose suitable setup and confirmation [19–22] made use of consistent parameter sets.
Nonetheless, the accuracy of the independent data formerly involved in the setup of a consistent parameter set entirely determines the appropriateness of these parameters and, finally, the uncertainties of the calculated reaction cross-sections. Thus, the use of consistent parameters leads to increased accuracy of model calculations, but only within the limits of actual knowledge about the primary data triggering the input parameters. This is why, in this work, we look for the definite relation between the measured error bars of the primary data providing the consistent input parameters, the corresponding limits of these parameters, and, finally, the uncertainty bands of the calculated results. On the other hand, the use of no empirical rescaling factors completes the consistency of both input parameters and calculation results by agreeing with something previously obtained and always behaving in a similar way.
This work completes Ref. [16] with reference to the target nucleus 93Nb, and the only additional HF+PE model parameters for neutron-induced reactions on this nucleus are given in Section 2. Comparison of HF+PE results and all available related data are discussed in Section 3. Conclusions are finally given in Section 4.
2 Nuclear models and parameters
The HF+PE reaction analysis and collective inelastic scattering cross-section assessment have been carried out using the same models, codes [14, 23–25], and previous local approaches [16, 26]. Moreover, the same parameters, consistently established or validated by means of distinct data, have been involved for the 1) back-shifted Fermi gas (BSFG) [27] nuclear-level density (NLD), 2) particle transmission coefficients through optical model potentials (OMPs) [18, 28], and 3) γ-ray transmission coefficients through radiative strength functions (RSFs) [29, 30]. The same NLD and OMP parameters have been used in the framework of the HF+PE models, with additional pickup direct-reaction (DR) contribution to the α-particle emission.
NLD parameters for the main reaction products concerned in the present work in addition to Ref. [16] are given in Table 1, including the corresponding uncertainties. The last ones correspond first to the fit of the s-wave nucleon-resonance spacing
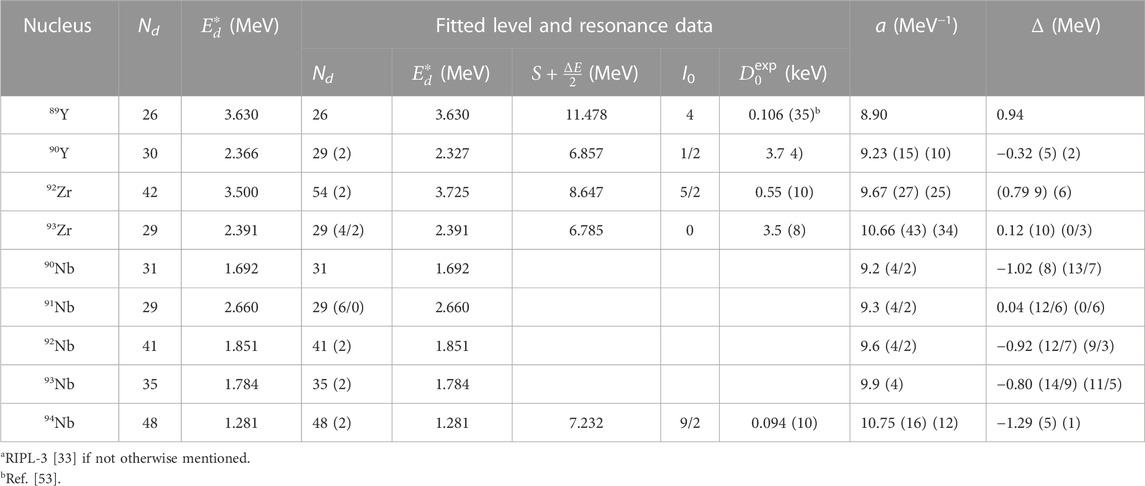
TABLE 1. Low-lying levels number Nd up to excitation energy
The neutron transmission coefficients have been obtained using the global and local OMPs of Koning and Delaroche [28], and their additional analysis by means of the SPRT method [36] within the energy range of this work. Thus, these OMP results for the s- and p-wave neutron strength functions S0 and S1, respectively; the potential scattering radius R′; and the energy dependence of the neutron total cross-section σT(E) are compared in Figure 1 with the available data [32, 33, 36]. We found that the global parameter set [28] provides a particularly better agreement of the measured and calculated σT(E) in comparison to the related local parameter set within this energy range. So, we used the aforementioned global parameter set [28]. Nevertheless, the corresponding changes also shown in Figure 1 for the reaction cross-sections σR(E), of notable importance around 1 MeV for the competition between the neutron and charged-particle decay of excited compound nuclei (CNs), have no importance.
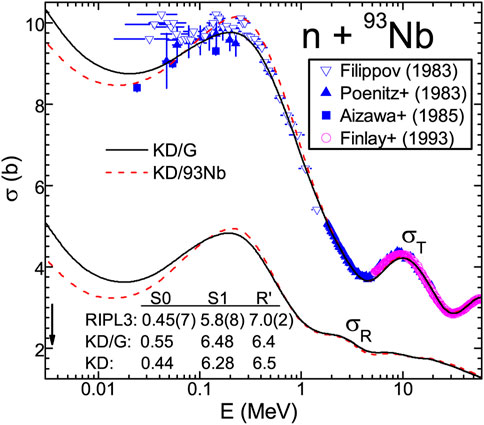
FIGURE 1. Comparison of measured [37] and calculated neutron total cross-sections (upper curves) of 93Nb using the global (solid curves) and local (dashed curves) OMP parameters [28]. The calculated reaction cross-sections (lower similar curves) corresponding to the same OMPs are also shown.
Moreover, the same OMP parameters provided the collective inelastic scattering component within the distorted-wave Born approximation (DWBA) method, the code DWUCK4 [24], and the deformation parameters [4] of the first 2+ and 3− collective states. It goes up to ∼7% of σR for incident energies around 4 MeV and then decreases slightly below 5% at energies above 20 MeV. A corresponding decrease in σR has been then taken into account within the PE+HF analysis of various reaction channels.
The proton transmission coefficients of a similar alternative have been solved by the usual analysis of the (p,n) cross-sections at energies (≥3 MeV) where this reaction channel has cross-sections close to the optical potential σR. However, because only earlier measured data have been available for this reaction on neighboring Zr isotopes (Figure 2B,C), more recent data on the (p,γ) reaction have been used below the (p,n) reaction effective threshold, where its cross-sections are yet to come close to σR values. Then, the comparison of measured and calculated cross-sections shown in Figure 2A led to the further involvement in this work of the global proton OMP [28].
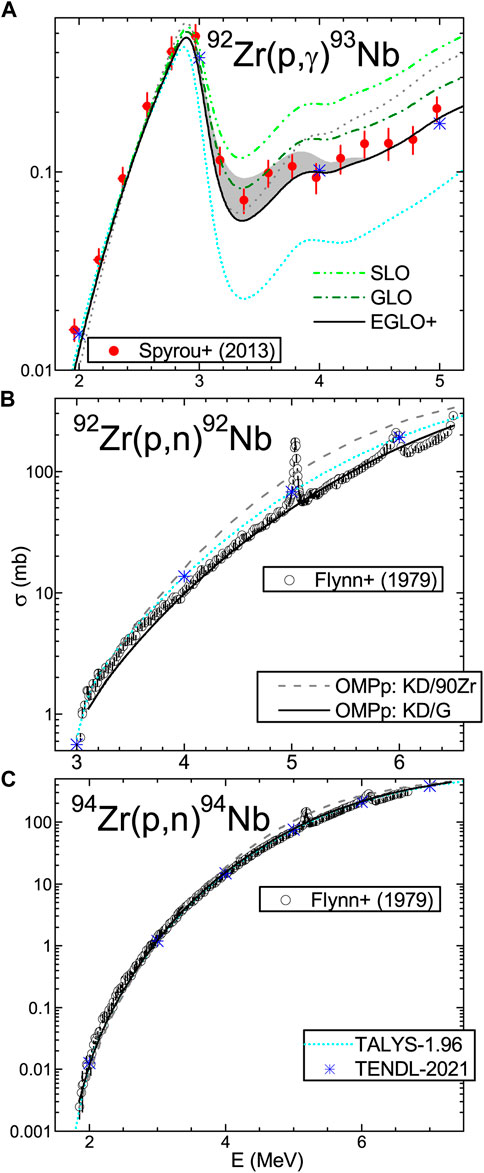
FIGURE 2. Comparison of cross-sections measured [37], evaluated [15] (*), and calculated with the code TALYS-1.96 [14] (short-dotted curves) and in this work, using proton global OMP parameters [28] and E1-radiation EGLO strength functions (solid curves) for (A) (p,γ) reaction on 92Zr, and (B, C) (p,n) reaction on 92,94Zr, respectively. (A) The results for the alternative use of E1-radiation GLO (dash-dotted) and SLO (dash-dot-dotted) models are also shown, and the uncertainty band corresponds to values between 1 and 2 of the WFC number of degrees of freedom for the χ2 partial-width distribution.
The α-particle transmission coefficients corresponding to the α-particle OMP [18] have just been proved to be well suited for α-emission in neutron-induced reactions in the mass range A ∼90 including 93Nb nucleus [16]. A still-open question to be answered in this work may concern only the role of the uncertainties related to the competitive reaction channels (Section 3).
The γ-ray transmission coefficients involve RSFs, which unfortunately have no confident parametrization despite the widespread systematics [30, 37] performed even recently. So, we have adopted the giant dipole resonance (GDR) parameters of Kopecky and Uhl [39] within the former Lorentzian (SLO) [40], the generalized Lorentzian (GLO) [39], and the enhanced generalized Lorentzian (EGLO) [41] models for the electric-dipole RSF. The additional M1 upbend parameters found recently to describe the RSF data for 92,94Mo nuclei, i.e., the middle resonance parameters given in Table II of Ref. [42], have been used for 93,94Nb nuclei too.
Comparison of the results obtained within the aforementioned models for the E1-radiation in Figure 2A showed that the EGLO model has led to an enhanced RSF description over the whole energy range of the measured (p,γ) cross-sections [43]. Furthermore, an eventual uncertainty band of the calculated results corresponding to the values between 1 and 2 for the number of degrees of freedom for the χ2 partial-width distribution within Moldauer’s width fluctuation correction (WFC) [44] has fully covered the scattered experimental data around the excitation function minimum just above the (p,n) reaction threshold.
A similar analysis to be shown hereafter for the neutron capture on 93Nb comes to the same conclusion concerning the average s-wave radiation widths Γγ. Thus, the SLO and GLO models have led to larger captured cross-sections and Γγ values in comparison to the measured data [33, 36].
The pre-equilibrium emission account within the geometry-dependent hybrid (GDH) model [45], generalized through the inclusion of the angular momentum and parity conservation [46] and knockout α-particle emission, has a main parameter of pre-formation probability φ [3]. Its suitable values have been recently obtained [16] by the analysis of several energy spectra measurements around the incident energy of 14 MeV. On the other hand, the GDH intra-nuclear transition rates were calculated also using the aforementioned imaginary OMP parameters within the local density approximation ([45] and Refs. therein). Local-density Fermi energy was similarly related to various partial waves and a central-well Fermi energy value F = 40 MeV.
Moreover, the revised version of the advanced particle-hole-level densities (PLD) [47, 48] was used with the Fermi–gas energy dependence of the single-particle level (s.p.l) density [49]. The s.p.l. density gα of the pre-formed α-cluster, which behaves like an exciton [3, 45], has been related to the level-density parameter a through the usual equidistant spacing–model relation g=(6/π2)a.
The DR pickup mechanism has also been used to describe the α-particle emission in neutron-induced reactions, similar to recent analyses in the mass ranges A ∼60 [21, 22] and A ∼90 [16] including 93Nb. However, the lack of measured angular distributions for the (n, α) reaction again made impossible the current DWBA assessment of related pickup cross-sections using spectroscopic factors (SFs) obtained by the analysis of α-particle angular distributions.
Thus, one-step reaction has also been considered through the pickup of 3He clusters. However, the “spectator model” [50, 51] was used for the pair of transferred protons in 93Nb(n,α)90Y reaction, with the corresponding SFs given by Glendenning [52]. Then, the SFs for the picked neutron were obtained on account of their similarity with the picked-proton SFs found by the analysis of the α-particle angular distributions of the pickup reaction 91Zr (t,α)90Y toward the same residual nucleus [16]. The DWBA formalism with prior-form transition amplitudes and finite-range interactions within the code FRESCO [25] have been used. Last, the description of the α-particle angle–integrated energy distributions around 14 MeV induced by neutrons on 93Nb has validated the α-particle’s both PE and DR components [16].
3 Results and discussion
The (n, γ) excitation-function analysis is of general interest due to the significant activation of various isomeric states by neutrons incident on 93Nb. The former validation of the γ-ray transmission coefficients has confirmed the adopted NLD spin cut-off factors, which then trigger all isomeric cross-sections. Therefore, a good agreement between the more recent experimental data and the calculated results shown in Figure 3 is particularly important.
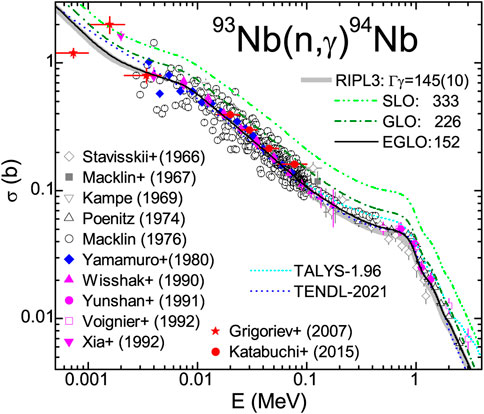
FIGURE 3. Figure 2A includes evaluated cross-sections [15] (short-dashed curve), but for (n, γ) reaction on 93Nb [37], with the uncertainty band of the calculated cross-sections corresponding to the error bar of RIPL-3 average s-wave radiation widths Γγ [33]. The Γγ values provided by the use of E1-radiation RSF of EGLO (solid curve), GLO (dash-dotted), and SLO (dash-dot-dotted) models are also included.
At the same time, it should be pointed out that a good agreement has also been obtained for the related RIPL-3 average s-wave radiation width, even within quite a narrow error bar [33]. Actually, the narrow uncertainty band of the calculated cross-sections corresponding to the Γγ limits (Figure 3) is close to the more recently measured data. On the other hand, replacing the EGLO model for the E1-radiation RSF with GLO and especially SLO models, a notable overestimation follows both for the calculated excitation function and Γγ values. Thus, the use of the GLO model leads to increased cross-sections and Γγ values by ∼37% and ∼50%, respectively, around the incident energy of 1 MeV, while the SLO model corresponds to over two times larger values.
The (n, 2n) reaction analysis has the shortcoming of no total cross-section data available within the last 40 years. Fortunately, there are recent measurements for the isomeric cross-sections corresponding to the 2+ state of 92Nb nucleus at 136 keV, as shown in Figure 4A. First, the agreement between the calculated and recently measured isomeric cross-section at the incident energy of ∼14 MeV, i.e., on the flat maximum of this excitation function should be noted. Second, it is also notable that the concurrent suitable account of both the isomeric state and total (n, 2n) excitation functions is obtained. At the same time, the TALYS-1.96 results are in better agreement with only the latter data, while TENDL-2021 fits to a greater extent the former excitation function. There is thus support for the neutron OMP and the NLD spin distribution corresponding to the aforementioned spin cut-off factors.
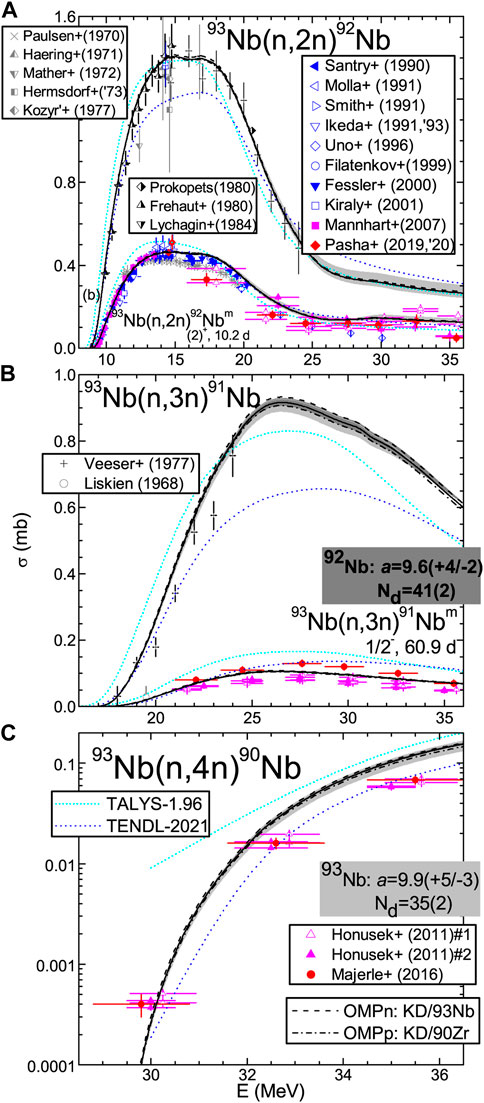
FIGURE 4. Comparison of cross-sections measured [37], evaluated [15] (short-dashed curves), and calculated with the code TALYS-1.96 [14] (short-dotted curves) and in this work, using proton global OMP parameters [28] (solid curves) for (A) (n, 2n), (B) (n, 3n), and (C) (n, 4n) reactions on 93Nb. Results obtained with the alternative use of the corresponding local OMP parameters [28] of either neutrons on 93Nb (dashed) or protons on 90Zr (dash-dotted) are shown, and the uncertainty bands related to NLD-parameter error bars (Table 1) of the target nucleus (light gray) and residual nucleus 92Nb (gray) are also shown.
The size of the NLD effects on calculated cross-sections closely follows the NLD-parameter uncertainty related to the error bars of the fitted
Thus, Figure 4A shows the bands related to the NLD-parameter limits of the residual nuclei 92,93Nb, which deserve the following comments. The wider uncertainty bands are related to the limits of the NLD parameters for 93Nb nucleus populated through the excited nucleus 94Nb decay by neutron emission. However, even these bands, rather similar for the total and isomeric cross-sections, are larger than ∼1% only for incident energies above 20 MeV. Then, it becomes either higher or lower than the calculated cross-sections at the incident energy of 37 MeV by ∼14% and ∼8%, respectively. At the same time, the uncertainty bands corresponding to the limits of the NLD parameters for the residual nucleus 92Nb of the (n, 2n) reaction are overall below 1%.
The changes in the calculated (n, 2n) reaction cross-sections due to an eventual use of the neutron local OMP [28] have also been only from about 1% at the excitation function maximum to ∼2% around 35 MeV. The replacement of the aforementioned proton local OMP [28] has led to the changes below 1% at all incident energies. One may thus conclude that there is quite a low model–parameter dependence of the calculated (n, 2n) cross-sections, particularly below the incident energy of 20 MeV, for the case of consistent parameters determined formerly by the analysis of independent data.
The (n, 3n) reaction analysis has shown quite similar results in Figure 4B, particularly for the agreement with the recently measured isomeric cross-sections. Uncertainty bands similar to the case of the (n, 2n) reaction have been obtained, with only about 1% larger limits. Comparable changes have followed the use of either neutron or proton local OMPs [28]. The latter now becomes distinct from those related to the global proton OMP for 93Zr, for the total (n, 3n) excitation function, but close to it. On the other hand, the uncertainty bands corresponding to the NLD parameters of the residual nucleus 91Nb have widths within 3% of the calculated excitation functions and thus cannot be distinguished.
The (n, 4n) reaction-calculated cross-sections shown in Figure 4C are in good agreement with the measured data around the incident energy of 30 MeV but overestimated around 35 MeV. This disagreement remains even beyond the uncertainty band related to the NLD parameters of the residual nucleus 93Nb within the (n, n′) reaction. Despite the width of this band going from 14% to 23%, for energies from 30 to 37 MeV, it is yet above the measured data by 2–3 times, while the threshold energy for the (n, 5n) reaction is above 39 MeV. Lower changes due to the use of local OMPs [28] for either neutrons or protons, of only about +2% and −6%, respectively, cannot improve the measured data description. Eventually, a less suitable PE energy-dependence account at these higher energies may explain this variance and should be a concern within further studies.
The (n, xp) reaction analysis has to overcome the shortcoming of no measured excitation function. Only several angle-integrated energy distributions of proton emission induced by neutrons on 93Nb around the incident energy of 14 MeV have provided proton total-emission cross-sections at this energy. On the other hand, the overall account of the measured energy spectra, in the limit of the error bars (Figure 11D of Ref. [16]), have particularly supported an appropriate description of proton PE in neutron-induced reactions on 93Nb at least within this energy range. Moreover, there is a good agreement between the corresponding measured proton total-emission cross-sections and the model calculation results, as shown in Figure 5.
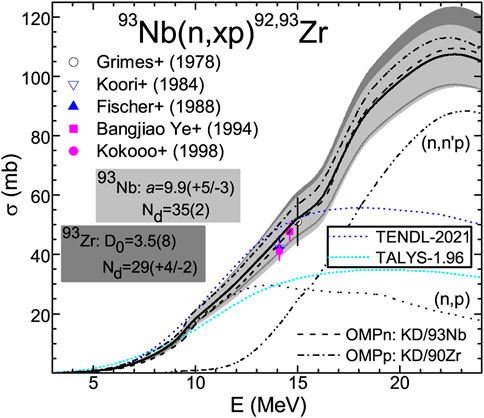
FIGURE 5. Comparison of cross-sections measured [37] and calculated in this work using proton global OMP parameters [28] (solid curves) for (n, xp) reactions on 93Nb. Results obtained with the alternative use of the corresponding local OMP parameters [28] of either neutrons on 93Nb (dashed) or protons on 90Zr (dash-dotted) are shown, and the uncertainty bands related to NLD-parameter error bars (Table 1) of the residual nuclei 93Nb (light gray) and 93Zr (gray) are also shown. The (n, p) and (n, n′p) components are shown as well (dotted and dash-dot-dotted curves, respectively), with a comparison of the former with the evaluated [15] (short-dashed curve) and calculated with the code TALYS-1.96 [14] (short-dotted curve) results, too.
In this case, a comparison is possible between the NLD effects on calculated cross-sections due to NLD-parameter uncertainty related to either the adopted limits of the average a-value for the residual nucleus 93Nb, or the error bars of the fitted
Under these conditions, the corresponding uncertainty bands of the calculated excitation functions (Figure 5) are both large compared to those for the (n, xn) reactions. Thus, the uncertainty band related to NLD parameters for 93Nb has a width going from 29%, at the incident energy of 14.8 MeV, to 19% at the maximum of the proton-emission excitation function, which is around 23 MeV. The width of the uncertainty band related to NLD parameters for 93Zr, from 28% to 25% between the same incident energies, is evidently larger at the higher energies. It thus pointed out the importance of the higher accuracy of the
On the other hand, changes due to the use of the neutron local OMP [28] are only between −2% and 4% for the same incident energies from 14.8 to 23 MeV. Somewhat larger ones, from 9% to −6%, correspond to the use of the local OMP [28] for protons. Nevertheless, while the former are yet within the error bars of the measured proton total-emission cross-sections, the latter match similarly only to the larger earlier data errors.
The (n, xα) reaction analysis has already been discussed [16], with the main points only briefly mentioned hereafter. Thus, the spectroscopic factors provided by an analysis of the α-particle angular distributions from 91Zr (t,xα)89,90Y led to a significant DR component for only 14 levels up to ∼ 2.5 MeV excitation energy by the 93Nb(n,α)90Y reaction. Therefore, a minor pickup DR contribution has been found to the total cross-sections of this reaction in Figure 6A. The same is the case of the 7+ isomer of the residual nucleus 90Y, which was also recently measured, as shown in Figure 6B, for energies from the effective threshold to above 20 MeV. On the other hand, the suitable account of the whole higher energy side of the emitted α-spectrum around 14 MeV validated the value φ = 0.14 of the aforementioned α-particle PE parameter [3, 45]. Then, the agreement of the measured and CN + PE calculated cross-sections within the error bars of the recent data made possible the assessment of a PE uncertainty band corresponding to Δφ = 0.02 [16]. The width of this uncertainty band increases from ∼19%, around the incident energy of 10 MeV, to ∼30% at 20 MeV.
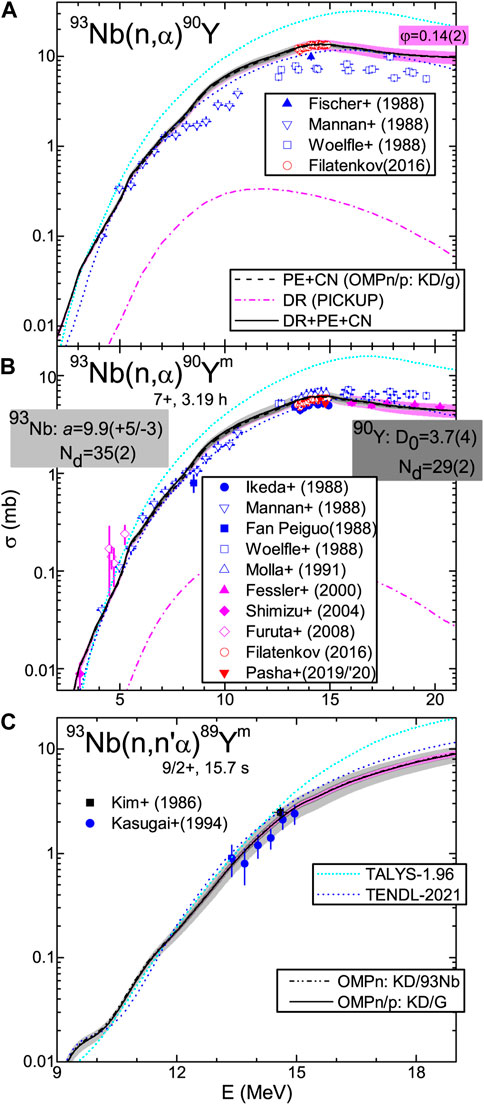
FIGURE 6. Similar to that shown in Figure 4, but for (A) 93Nb(n,α)90Y reaction [37], (B) the corresponding 7+ isomeric state 90Ym activation, and (C) 93Nb(n,n′α)89Ym reaction [37]. (A, B) The DR (dash-dotted curve) and PE + CN (dashed) components of (n, α) reaction are additionally shown, while PE + CN uncertainty bands also related to NLD-parameter error bars (Table 1) of the residual nucleus 90Y (gray) and PE parameter φ (magenta) are also shown. (C) The alternative use of the local OMP parameters [28] of neutrons on 93Nb (dash-dot-dotted) is shown as well.
Similar results were obtained for the 7+ isomeric-state 90Ym activation and that of the 9/2+ isomer through the 93Nb(n,n′α)89Ym reaction shown in Figure 6C. The only difference in the latter case is that there is no distinct PE uncertainty band. A related parallel with the accuracy of the measured data was thus not possible either, while the main aim to validate the α-particle OMP [18] was entirely proved by the suitable CN + PE account of all α-emission data.
Moreover, a comparison has been possible between the NLD effects due to uncertainties of the average a-value for the residual nucleus 93Nb, and the a-value of the residual 90Y, which corresponds to the error bar of the fitted
Hence, larger calculated cross-section uncertainties are at lower energies, due to average level-density parameters, while rather similar values are related to the PE account at higher energies. Notably, the former aforementioned uncertainties become comparatively much lower as the energy increases, whereas the latter have significant values also at lower energies. Nevertheless, changes due to the use of local OMPs [28] for neutrons are higher than 1% only from the incident energy of 14 MeV and up to 2% at 20 MeV. At the same time, the local OMP [28] for protons led to the changes below 1% in the whole energy range.
Finally, the same analysis of the activation of 9/2+ isomers through the 93Nb(n,n′α)89Ym reaction makes possible a better understanding of the balance between the experimental and calculated cross-sectional uncertainties. Its enlarged illustration in Figure 6C facilitates the note of the calculated cross-section PE uncertainty band with a width from ∼2%–16% for incident energies between 10 and 20 MeV. However, it is well below the uncertainty band related to NLD parameters for 93Nb, with a width of around 23% at the same energy, but rather close to that related to NLD parameters for 90Y. For the sake of completeness, an increase due to the use of the local OMP [28] for neutrons from 4%– 2% within the same energy range should be mentioned. Therefore, one may see, in this case, a close matching of the experimental and calculated cross-section uncertainties and the latter truly corresponding to the limits of the distinct data that are previously involved within the consistent parameter assessment.
4 Conclusion and outlook
A concurrent assessment of all measured excitation functions for various reactions induced by neutrons on 93Nb, in addition to the results of using default parameters within the worldwide used computer code TALYS-1.96 [14] and the currently related TENDL-2021 evaluation [15], is reported. The use of consistent parameter sets that are formerly obtained or validated by analysis of other independent data is mainly concerned. Moreover, no empirical rescaling factors of the γ and/or neutron widths have been used.
A proper account of all available data for competitive reaction channels has prevented compensation effects of less accurate model parameters. On the other hand, detailed analyses based on consistent input parameter sets are really needed to eventually improve the global parameters for involvement in large-scale evaluations. Moreover, the consistency of input parameters may lead to a similar condition of the model calculation results, agreeing with the data obtained previously and always behaving in a similar way.
The correlation between the measured error bars of the primary data providing the consistent input parameters and the final uncertainty bands of the calculated results has been pointed out. Thus, e.g., comparison between the nuclear-level density effects due to the uncertainty of either the average-level density parameter a for the residual nucleus 93Nb or the fitted
Finally, matching of the experimental and calculated cross-section uncertainties has been obtained and its correspondence to the limits of the distinct data previously involved in the consistent parameter assessment. Remaining questions and the need for additional measurements are emphasized.
Data availability statement
The original contributions presented in the study are included in the article. Further inquiries can be directed to the corresponding author.
Author contributions
All authors listed have made a substantial, direct, and intellectual contribution to the work and approved it for publication.
Funding
This work has been partly supported by the Executive Unit for the Financing of Higher Education, Research, Development and Innovation (UEFISCDI) (Project No. PN-III-ID-PCE-2021-1260) and carried out within the framework of the EUROfusion Consortium, funded by the European Union via the Euratom Research and Training Programme (Grant Agreement No. 101052200—EUROfusion). Views and opinions expressed are, however, those of the author(s) only and do not necessarily reflect those of the European Union or the European Commission. Neither the European Union nor the European Commission can be held responsible for them.
Acknowledgments
The support by the Nuclear Energy Agency (NEA) Data Bank, Paris, in providing their services hosting the progress meetings, is gratefully acknowledged.
Conflict of interest
The authors declare that the research was conducted in the absence of any commercial or financial relationships that could be construed as a potential conflict of interest.
Publisher’s note
All claims expressed in this article are solely those of the authors and do not necessarily represent those of their affiliated organizations, or those of the publisher, the editors, and the reviewers. Any product that may be evaluated in this article, or claim that may be made by its manufacturer, is not guaranteed or endorsed by the publisher.
References
1. Gruppelaar H, Nagel P. International nuclear model and code comparison on pre-equilibrium effects. In: Tech. rep. Vienna, Austria: INDC(NEA)6, IAEA (1985). Available from: https://www-nds.iaea.org/publications/indc/indc-nea-0006/ (Accessed 15 10, 2022).
2. Hauser W, Feshbach H. The inelastic scattering of neutrons. Phys Rev (1952) 87:366–73. doi:10.1103/PhysRev.87.366
4. Kalbach C. Surface and collective effects in preequilibrium reactions. Phys Rev C (2000) 62:044608. doi:10.1103/PhysRevC.62.044608
5. Watanabe Y, Aoto A, Kashimoto H, Chiba S, Fukahori T, Hasegawa K, et al. Feshbach-Kerman-Koonin model analysis of preequilibrium (p,p’) and (p,n) reactions at 12 to 26 MeV. Phys Rev C (1995) 51:1891–907. doi:10.1103/PhysRevC.51.1891
6. Demetriou P, Hodgson PE, Marcinkowski A, Watanabe Y. A consistent analysis of (n, n′), (p, p′), (n, p), and (p, n) multistep reactions using the Feshbach - kerman - Koonin theory. J Phys G: Nucl Part Phys (1996) 22:629–40. doi:10.1088/0954-3899/22/5/010
7. Avrigeanu M, Harangozo A, Avrigeanu V, Antonov AN. Nuclear surface localization of preequilibrium reactions at low energies. Phys Rev C (1996) 54:2538–46. doi:10.1103/PhysRevC.54.2538
8. Avrigeanu M, Harangozo A, Avrigeanu V, Antonov AN. Average strength of the effective interaction in multistep direct reactions. Phys Rev C (1997) 56:1633–6. doi:10.1103/PhysRevC.56.1633
9. Kalbach C. Toward a global exciton model; lessons at 14 MeV. J Phys G: Nucl Part Phys (1998) 24:847–66. doi:10.1088/0954-3899/24/4/014
10. Koning A, Rochman D. Modern nuclear data evaluation with the talys code system. Nucl Data Sheets (2012) 113:2841–934. doi:10.1016/j.nds.2012.11.002
11. Ichihara A. Calculation of cross sections for metastable state production in the (n, γ), (n, n′), (n, 2n) and (n, 3n) reactions of 93Nb. J Nucl Sci Tech (2016) 53:2049–55. doi:10.1080/00223131.2016.1192005
12. Liang H, Wu Z, Zhang Z, Han Y, Jiao X. Calculations and analysis of n+93Nb reaction. Nucl Sci Eng (2017) 187:107–26. doi:10.1080/00295639.2017.1295699
13. Naik H, Kim G, Kim K, Zaman M, Nadeem M, Sahid M. Neutron-induced reaction cross-sections of 93Nb with fast neutron based on 9Be(p,n) reaction. Nucl Phys A (2018) 970:156–68. doi:10.1016/j.nuclphysa.2017.11.011
14. Koning AJ, Hilaire S, Duijvestijn MC. Talys-1.0. In: O Bersillon, F Gunsing, E Bauge, R Jacqmin, and S Leray, editors. Proceedings of the International Conference on Nuclear Data for Science and Technology - ND2007; April 22-27, 2007; Nice, France. Les Ulis, France: EDP Sciences (2008). p. 211–4. Available from: http://www.talys.eu (Accessed 15 10, 2022).
15. Koning A, Rochman D, Sublet JC, Dzysiuk N, Fleming M, van der Marck S. TENDL: Complete nuclear data library for innovative nuclear science and technology. Nucl Data Sheets (2019) 155:1–55. doi:10.1016/j.nds.2019.01.002
16. Avrigeanu M, Avrigeanu V. Optical potential for incident and emitted low-energy α particles. III. Non-statistical processes induced by neutrons on Zr, Nb, and Mo nuclei (2022). Submitted to Phys. Rev. C; Report arXiv:2302.09845 [nucl-th]. doi:10.48550/arXiv.2302.09845
17. Arthur ED. Parameter determination and application to nuclear model calculations of neutron-induced reactions on yttrium and zirconium isotopes. Nucl Sci Eng (1980) 76:137–47. doi:10.13182/NSE80-A19446
18. Avrigeanu V, Avrigeanu M, Mănăilescu C. Further explorations of the α-particle optical model potential at low energies for the mass range A ≈ 45–209. Phys Rev C (2014) 90:044612. doi:10.1103/PhysRevC.90.044612
19. Avrigeanu V, Avrigeanu M. Analysis of uncertainties in α-particle optical-potential assessment below the coulomb barrier. Phys Rev C (2016) 94:024621. doi:10.1103/PhysRevC.94.024621
20. Avrigeanu V, Avrigeanu M. Role of consistent parameter sets in an assessment of the α-particle optical potential below the coulomb barrier. Phys Rev C (2019) 99:044613. doi:10.1103/PhysRevC.99.044613
21. Avrigeanu V, Avrigeanu M. Validation of an optical potential for incident and emitted low-energy α-particles in the A ≈ 60 mass range. Eur Phys J A (2021) 57:54. doi:10.1140/epja/s10050-020-00336-0
22. Avrigeanu V, Avrigeanu M. Validation of an optical potential for incident and emitted low-energy α-particles in the A ≈ 60 mass range. II. Neutron–induced reactions on Ni isotopes. Eur Phys J A (2022) 58:189. doi:10.1140/epja/s10050-022-00831-6
23. Avrigeanu M, Avrigeanu V. Recent improvements of the STAPRE-H95 preequilibrium and statistical model code. In: Tech. rep. Bucharest: Institute for Physics and Nuclear Engineering Report NP-86-1995 (1995). Available from: http://www.oecd-nea.org/tools/abstract/detail/iaea0971/ (Accessed 15 10, 2022).
24.[Dataset] Kunz PD. DWUCK4 user manual (1984). Available from: http://spot.colorado.edu/∼kunz/DWBA.html, http://www.oecd-nea.org/tools/abstract/detail/nesc9872/ (Accessed 15 10, 2022).
25. Thompson IJ. Coupled reaction channels calculations in nuclear physics. Comp Phys Rep (1988) 7:167–212. doi:10.1016/0167-7977(88)90005-6
26. Avrigeanu V, Avrigeanu M. Consistent optical potential for incident and emitted low-energy α particles. II. α emission in fast-neutron-induced reactions on Zr isotopes. Phys Rev C (2017) 96:044610. doi:10.1103/PhysRevC.96.044610
27. Vonach H, Uhl M, Strohmaier B, Smith BW, Bilpuch EG, Mitchell GE. Comparison of average s-wave resonance spacings from proton and neutron resonances. Phys Rev C (1988) 38:2541–9. doi:10.1103/PhysRevC.38.2541
28. Koning AJ, Delaroche JP. Local and global nucleon optical models from 1 keV to 200 MeV. Nucl Phys A (2003) 713:231–310. doi:10.1016/S0375-9474(02)01321-0
29.[Dataset] UiO/OCL. UiO/OCL Level densities and gamma-ray strength functions (2022). Available from: http://ocl.uio.no/compilation (Accessed 15 10, 2022).
30. Kawano T, Cho Y, Dimitriou P, Filipescu D, Iwamoto N, Plujko V, et al. IAEA photonuclear data library 2019. Nucl Data Sheets (2020) 163:109–62. doi:10.1016/j.nds.2019.12.002
31.[Dataset] ENSDF. Evaluated nuclear structure data file (ENSDF) (2022). Available from: https://www.nndc.bnl.gov/ensdf/(Accessed 15 10, 2022).
32. Avrigeanu V, Glodariu T, Plompen AJM, Weigmann H. On consistent description of nuclear level density. J Nucl Sci Tech (2002) 39:746–9. doi:10.1080/00223131.2002.10875205
33. Capote R, Herman M, Obložinský P, Young PG, Goriely S, Belgya T, et al. RIPL – reference input parameter library for calculation of nuclear reactions and nuclear data evaluations. Nucl Data Sheets (2009) 110:3107–214. doi:10.1016/j.nds.2009.10.004
34.[Dataset] Nuclear Data Services. Average neutron resonance parameters and other data collected in Beijing (1998). Available from: https://www-nds.iaea.org/ripl/resonances/other_files/beijing_dat.htm (Accessed 15 10, 1998).
35. Johnson CH. Statistical model radiation widths for 75 < A < 130 and the enhancement of P-wave neutron capture for A ≈ 90. Phys Rev C (1977) 16:2238–48. doi:10.1103/PhysRevC.16.2238
36. Delaroche JP, Lagrange C, Salvy J. Handbook for calculations of nuclear reaction data, RIPL-2. In: Tech. rep. Vienna, Austria: IAEA-190, IAEA (1976). Available from: https://www-nds.iaea.org/publications/tecdocs/iaea-0190-vol.1/ (Accessed 15 10, 2022).
37. Otuka N, Dupont E, Semkova V, Pritychenko B, Blokhin A, Aikawa M, et al. Towards a more complete and accurate experimental nuclear reaction data library (EXFOR): International collaboration between nuclear reaction data centres (NRDC). Nucl Data Sheets (2014) 120:272–6. doi:10.1016/j.nds.2014.07.065
38. Goriely S, Dimitriou P, Wiedeking M, Belgya T, Firestone R, Kopecky J, et al. Reference database for photon strength functions. Eur Phys J A (2019) 55:172. doi:10.1140/epja/i2019-12840-1
39. Kopecky J, Uhl M. Test of gamma-ray strength functions in nuclear reaction model calculations. Phys Rev C (1990) 41:1941–55. doi:10.1103/PhysRevC.41.1941
40. Axel P. Electric dipole ground-state transition width strength function and 7-mev photon interactions. Phys Rev (1962) 126:671–83. doi:10.1103/PhysRev.126.671
41. Kopecky J, Uhl M, Chrien RE. Radiative strength in the compound nucleus 157Gd. Phys Rev C (1993) 47:312–22. doi:10.1103/PhysRevC.47.312
42. Tveten GM, Spyrou A, Schwengner R, Naqvi F, Larsen AC, Eriksen TK, et al. Completing the nuclear reaction puzzle of the nucleosynthesis of 92Mo. Phys Rev C (2016) 94:025804. doi:10.1103/PhysRevC.94.025804
43. Spyrou A, Quinn SJ, Simon A, Rauscher T, Battaglia A, Best A, et al. Measurement of the 90,92Zr(p, γ)91,93Nb reactions for the nucleosynthesis of elements near A = 90. Phys Rev C (2013) 88:045802. doi:10.1103/PhysRevC.88.045802
44. Moldauer P. Statistics and the average cross section. Nucl Phys A (1980) 344:185–95. doi:10.1016/0375-9474(80)90671-5
45. Blann M, Vonach HK. Global test of modified precompound decay models. Phys Rev C (1983) 28:1475–92. doi:10.1103/PhysRevC.28.1475
46. Avrigeanu M, Ivascu M, Avrigeanu V. Nuclear level densities below 40 MeV excitation energy in the mass region A ∼50. Z Phys A - At Nuclei (1990) 335:299–313. doi:10.1007/BF01304709
47. Avrigeanu M, Avrigeanu V. Partial level densities for nuclear data calculations. Comp Phys Commun (1998) 112:191–226. doi:10.1016/S0010-4655(98)00050-2
48. Harangozo A, Şteţcu I, Avrigeanu M, Avrigeanu V. Particle-hole state densities with nonequidistant single-particle levels. Phys Rev C (1998) 58:295–306. doi:10.1103/PhysRevC.58.295
49. Kalbach C. Surface effects in the exciton model of preequilibrium nuclear reactions. Phys Rev C (1985) 32:1157–68. doi:10.1103/PhysRevC.32.1157
50. Smits J, Siemssen R. Semi-microscopic description of three-nucleon transfer and the Sn(p,α)In reaction. Nucl Phys A (1976) 261:385–412. doi:10.1016/0375-9474(76)90154-8
51. Smits J, Siemssen R, Van Der Werf S, Van Der Woude A. The 58,60,62,64ni(p,α)55,57,59,61co reactions and their description by the semi-microscopic model for three-nucleon transfer. Nucl Phys A (1979) 319:29–49. doi:10.1016/0375-9474(79)90169-6
52. Glendenning NK. Tables of nuclear structure amplitudes for two-nucleon transfer involving light projectiles (a ≤ 4). At Data Nucl Data Tables (1975) 16:1–134. doi:10.1016/0092-640X(75)90031-5
Keywords: nuclear reactions, cross-sections, nuclear models, optical potential, nuclear level density, model calculation uncertainty bands
Citation: Avrigeanu V and Avrigeanu M (2023) Consistent assessment of neutron-induced activation of 93Nb. Front. Phys. 11:1142436. doi: 10.3389/fphy.2023.1142436
Received: 11 January 2023; Accepted: 07 March 2023;
Published: 22 March 2023.
Edited by:
Giuseppe Verde, National Institute for Nuclear Physics of Catania, ItalyReviewed by:
Nicola Colonna, National Institute for Nuclear Physics of Bari, ItalyIan Thompson, Lawrence Livermore National Laboratory (DOE), United States
Copyright © 2023 Avrigeanu and Avrigeanu. This is an open-access article distributed under the terms of the Creative Commons Attribution License (CC BY). The use, distribution or reproduction in other forums is permitted, provided the original author(s) and the copyright owner(s) are credited and that the original publication in this journal is cited, in accordance with accepted academic practice. No use, distribution or reproduction is permitted which does not comply with these terms.
*Correspondence: Vlad Avrigeanu, dmxhZC5hdnJpZ2VhbnVAbmlwbmUucm8=