- 1School of Telecommunication Engineering, Xidian University, Xi’an, China
- 2Photodetection Theory and Application Laboratory, School of Physics, Xidian University, Xi’an, China
When analyzing the transmission characteristics of LEDs for long-distance lighting and communication applications, the light field is commonly assumed to be fully incoherent. However, in reality, the LED light source emits partially coherent light with a spatial coherence length on the order of microns. This paper is based on the generalized higher-order Lambert model of LEDs and aims to construct a Gaussian-Schell model for the LED beam (LED-GSM) on the near-field source plane, with a half-power angle of no more than 10o. Utilizing the cross-spectral density function transmission theory for partially coherent light, this paper provides the LED-GSM model’s spatial coherence length and beam radius at different distances and designs an experiment for measuring the spatial coherence length of LED beams. Experimental measurements of the spatial coherence length and beam spot size of LED beams at different distances are carried out using a Thorlabs LED528EHP light source. The experimental results match well with the theoretical simulations of the LED-GSM model, thus validating its effectiveness. Then, the proposed LED-GSM model is utilized to investigate the long-distance transmission characteristics of partially coherent narrow-beam LED light. Simulation results indicate that the spatial coherence length of the LED light field can reach tens to hundreds of millimeters over transmission distances of several kilometers. The beam radius is much smaller than that of the beam radius based on the fully incoherent model, and the beam intensity distribution also displays distinct differences.
1 Introduction
The high electro-optical efficiency, strong radiation power, long lifespan, and low cost of LEDs have made them widely used in various fields, including lighting, display, and optical communication. In the past decades, the coherence of light fields has been studied in the context of LED applications such as optical communication [1,2], digital holographic displays [3], and interferometric measurements [4,5]. Measurements of the spatial coherence of LED light fields indicate that they are not completely incoherent, but instead, contain partially coherent light with spatial coherence lengths varying from a few to several tens of micrometers [6,7]. The size of the spatial coherence length is linked to the LED light source material and the structure of the emitting chip [8]. Mehta et al. [9] conducted a comprehensive investigation on the spectral and temporal coherence of LEDs. Lin et al. [10] experimentally determined the spatial coherence length of LEDs with various emitting chip shapes over transmission distances of several meters. The findings suggest that with an increase in transmission distance, the spatial coherence length of the optical field will extend to the millimeter scale. The spatial coherence of partially coherent light from LEDs [11] at close range is often overlooked and assumed to be completely incoherent[12]. Nonetheless, its partial coherence cannot be disregarded in long-distance transmission. With the growing prominence of decoherence properties in laser transmission theory[13], there is an increasing focus on analyzing the spatial coherence characteristics of partially coherent optical transmission theories, including the typical Gaussian-Schell model (GSM)[14]. This theoretical approach is capable of dealing with partially coherent as well as fully incoherent light sources [15], which provides a theoretical basis for investigating the spatial coherence of partially coherent LED light in a vacuum environment.
With the advancements in LED materials and light source design [16], LED light sources that exhibit excellent directionality and high power [17] have become a fundamental component for long-distance lighting and optical communication applications. Currently, LED light source systems that encapsulate light-emitting chips and use focused lenses are often considered as fully incoherent light sources in research on communication channel characteristics. However, the transmission characteristics of partially coherent light fields suggest that [18], during long-distance transmission, the spatial coherence and beam radius of the light field differ from those of fully incoherent light. Therefore, it is crucial to investigate the partial coherence properties of LED light using the theory of partially coherent light transmission.
Based on the near-field measurement results of the lateral spatial coherence length and beam radius of LED, a partially coherent light model for LEDs with micro-scale spatial coherence length at the near-source plane is developed through theoretical simulations and experimental measurements. During the beam propagation, the study examines the impact of factors such as spatial complex coherence, source size, and transmission distance on the spatial coherence length and beam radius of the light field on the observation plane.
2 LED-GSM model and transmission theory
2.1 Light field of LED
The illuminance distribution of LED is generally described using the generalized Lambertian model. (H and M, 2008)
Where z denotes the distance between the light source and the observation plane,
Since
Where
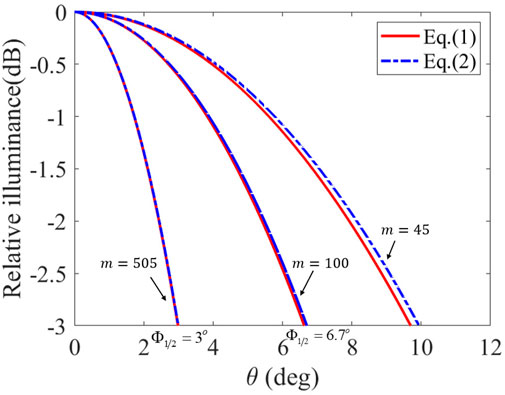
Figure 1 shows the relationship between relative illuminance and θ at different values of m. From the curve in the figure, a larger m corresponds to a narrower beam. Commercially available LED lenses can shape the beam of the Lambertian-type LEDs into
2.2 LED-GSM model
When researching the radiation transmission theory, it is typically required to construct a complex amplitude expression for the outgoing light field. To distinguish z, it is assumed that the illumination distribution on the z1 plane follows Gaussian distribution characteristics, where z represents the distance of light transmission. In the case of the LED illumination distribution expressions (1) (2) and the consideration of
Where
By applying the theory of partially coherent light propagation, the spatial coherence of a monochromatic light wave field with a wavelength of λ on any plane in space can be described through the Cross-Spectral Density Function (CSDF). The definition of W (s1, s2) is as follows:
Where s1 and s2 are the position vectors of any two points in the source plane,
where σ is the spatial coherence length of the z1 plane light field. The larger it is, the better the spatial coherence of the beam, and vice versa, the worse the spatial coherence becomes.
After reviewing the literature [6–8], it is evident that the spatial coherence length, σ, of LED emitting chips typically falls within the micrometer range. It is important to take into account the size of the LED light source following processing and optical packaging, as the spatial coherence length of the emitted light on the exit plane generally ranges from several to tens of micrometers. This relationship is closely tied to factors such as the material and size of the LED chip, the divergence angle of the beam, and the emission mode of the light source.
Looking at Figure 1, it becomes apparent that the intensity of the LED follows a Gaussian distribution when z1 is sufficiently large (e.g., z1 = 0.1 m, m ≥ 45). Taking into account the design and dimensions of the LED light source structure, the light plane at a constant value of z1 can be viewed as the output light field of the entire LED transmission system, referred to as the LED-GSM light source plane. The radius size of the light beam at the light source plane can be defined as
Where
Notably, Equation 6 is the coherent optical field model for the partial coherent light of LED-GSM proposed in this paper, which is valid when
2.3 LED-GSM optical transmission
According to the theory of light transmission in a vacuum for partially coherent light [13,14], under the approximation of the generalized Huygens-Fresnel principle, the CSDF distribution of any two points, such asρ1 and ρ2, on the observation plane at z distance from the source plane is given as
Where k = 2π/λ is the wave number. λ is the main wavelength of the narrow beam LED. When ρ1 = ρ2 = ρ, the intensity of light on the observation plane at z distance is obtained as
Based on the definition of spatial complex coherence [21], while ρ1 = ρ, ρ2 = 0, the spatial complex coherence of LED-GSM beam can be calculated as Equation 9. Letting
Where
From Equations 10, 11, it can be seen that in the transmission of LED-GSM beams, the spatial coherence length and beam width of the light field are related to the size of the light source and spatial coherence length, and they also vary with the increase of the transmission distance. In this paper, numerical analysis and experimental measurements of the LED-GSM beam transmission characteristics at different distances will be carried out. The effectiveness of LED-GSM will also be experimentally verified by using Equation 12.
3 Experimental verification of LED-GSM model
Regarding the validation of the narrow beam
3.1 Validation against literature comparison
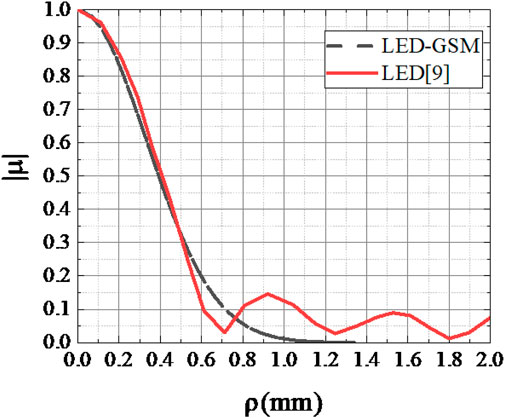
Literature [10] provides the spatial complex coherence curve of a red LED chip with a central wavelength of 623.3 nm and a 3 mm square side of the light-emitting area. This curve exhibits a Sinc function distribution at the observation plane 5 m away, as shown by the red line in Figure 2. By utilizing Equations 6, 10, the spatial complex coherence curve of the LED-GSM (ws = 1.5 mm, σ = 15 μm) follows a Gaussian function distribution, represented by the black dashed line in Figure 2. The good agreement at a spatial coherence length of
3.2 Experimental verification of spatial coherence
The experiment used a Thorlabs LED528EHP green LED
Measurement of spatial coherence of partially coherent light from a narrow beam LED is performed using Young’s double-slit interference experiment, as shown in Figure 3A. As stated in Section 2.2, the distance between the LED-GSM light source plane and the LED source is z1, determined by the condition of
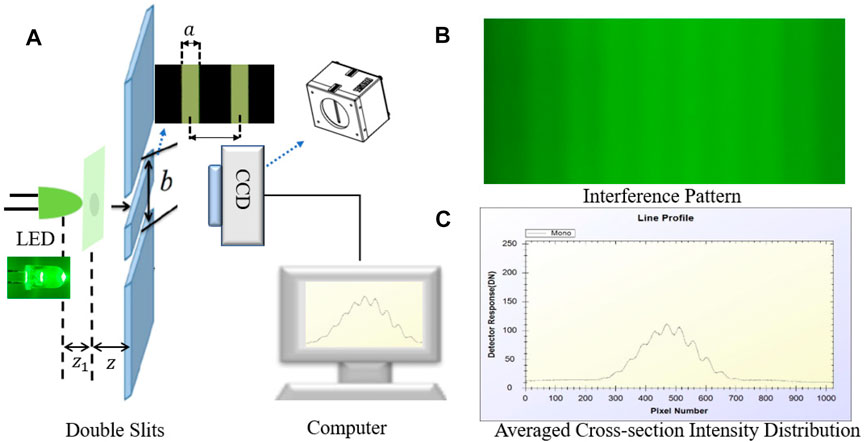
FIGURE 3. The experiment system. (A)Double slit. (B)Interference pattern. (C)Averaged cross-section intensity distribution.
In the experiment, to ensure consistency with theoretical calculations, the selected transmission distance and double-slit conditions in the optical path fall within the paraxial approximation range. It is assumed that the diffracted light emitted from points P1 and P2 combine at point Q to produce interference fringes, with the distance between the double slits being b. In the interference field of the double slits, the intensity of light at a particular point Q in space can be expressed as[24].
Where
Where
Due to the influence of background light and other noise, there are errors in determining the accurate values of Imax and Imin. To address this, the Gaussian fitting of the maximum and minimum points of the interference fringes is considered, and the maximum value of each obtained Gaussian curve is taken as the respective values of Imax and Imin.
Figure 4 shows the interference pattern of the intensity of the interference fringes at z = 0.3 m after passing through the double slits (a = 0.06 mm, b = 0.2 mm). By normalizing and smoothing the collected interference fringes, removing background light and other noise, and fitting the two Gaussian envelopes of the interference fringes, the red and blue curves correspond to the Gaussian curves obtained using the maximum and minimum points, respectively. Therefore, Imax = 0.376 and Imin = 0.304 are determined and substituted into Equation 13 to calculate the spatial complex coherence value of the light field at the double slits, which is denoted as
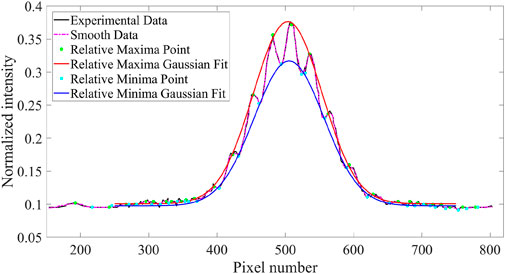
FIGURE 4. Diffraction patterns. The crest (maxima points) and trough (minima points) are represented by green and cyan marks, respectively. (z1 = 0.1 m, z = 0.3 m, a = 0.06 mm, b = 0.2 mm).
The experiment in this paper used 5 sets of double slits with different spacing, whose specific parameters are shown in Table 1. The widths of the double slits (a) and the separations between them (b) have been finely adjusted and customized based on actual conditions. Through repeated experimentation, clear interference fringes can be obtained to achieve the most accurate measurement of spatial coherence length. Based on the measurement method of Young’s double-slit interference experiment introduced above, the spatial complex coherence of the optical field was measured using different double slits at different distances, and the relationship between the spatial complex coherence and the double-slit size was obtained. Figure 5 shows the relative spatial complex coherence curve relationship of the narrow beam LED at different double slit spacings, which are 0.7, 0.9, 1.1, 1.3, 1.5, 1.7, and 1.9 m, respectively. Although the number of experimental points is relatively small, the experimental measurement results in z = 0.7m still show that the amplitude of spatial complex coherence of
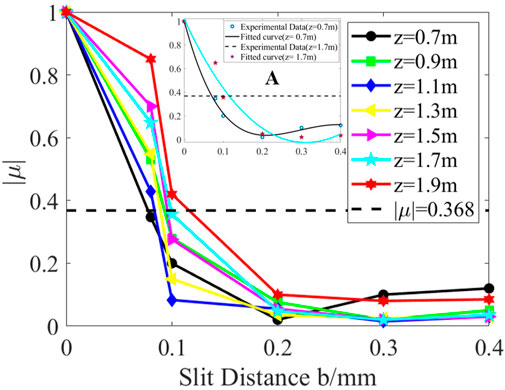
FIGURE 5. The curve of changes in
Using the method described above, we can determine the spatial coherence length of the optical field at various distances. The results are shown in Figure 6, where the scattered points represent the experimental measurement results. Due to experimental constraints, measuring the spatial coherence length of the optical field at z1 plane directly is not feasible. Nonetheless, we can use a combination of Equation 10 and experimental data, and optimize them using the least squares method to determine the spatial coherence length of σ = 41 μm at z1 = 0.1 m. At this juncture, the residual between the theoretical simulation and experimental measurement values is approximately ±0.02.
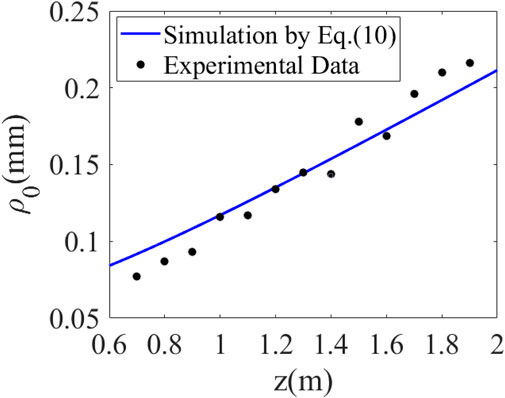
FIGURE 6. Determine the initial spatial coherence length of the model by means of simulation and experimental measurements. (z1 = 0.1 m).
The observation plane of the light beam at z1 = 0.1 m serves as the initial light source plane for the LED-GSM model. The value of σ = 41 μm obtained from this plane is substituted into Equation 9 to calculate the curves that illustrate the relationship between the spatial complex coherence amplitude
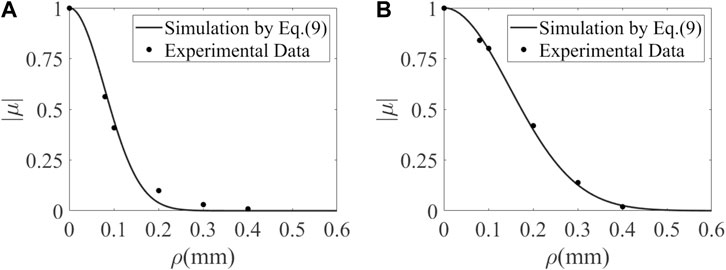
FIGURE 7. Simulation and experimental results comparing the variation of spatial complex coherence amplitude with respect to ρ. (A) z = 0.9 m, σ = 41 μm. (B) z = 1.9 m, σ = 41 μm.
Equation 11 indicates that the beam radius of
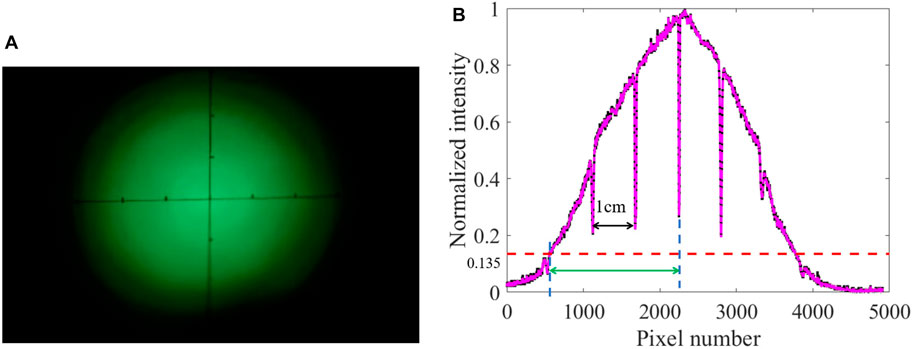
FIGURE 8. Experimental measurement results of spot radius. (z1 = 0.1 m) (A) Spot pattern. (B) Fitting LED beam using Gaussian distribution.
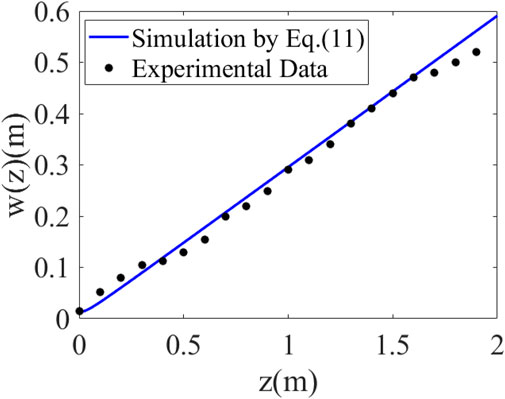
The normalized intensity distribution is shown in Figure 8B, and the spot radius size is obtained using the equation of w(z) = I(z)/e2, First, the calibrated pixel spot size is 6.5 μm, as shown in the black mark. Further, the effective spot radius can be calculated as 1.4 cm, as shown by the green mark. Similarly, the spot size can be obtained from z = 0 to z = 1.9 m, i.e., the spot size on the observation plane at different distances, as shown in Figure 9 for the discrete points.
By substituting σ = 41 μm into Equation 11 of the LED-GSM model, we can observe a curve of the beam radius increasing with distance. As shown in Figure 9, the beam radius obtained from the LED-GSM model simulation agrees well with the experimental measurements as the distance increases, and the error range of the simulation and experiment is within ±0.04 m. As shown in Equation 12, the ratio of the spatial coherence length to the beam radius is constant of α, regardless of the optical transmission distance. The value of αsim = 3.60 × 10⁻⁴ can be determined from the model simulation results. By combining the experimental measurements from Figure 6 and Figure 9, we can obtain the ratio of the coherence length to the spot radius as shown in Table 2, with a constant coefficient of αexp = 3.86 × 10⁻⁴. Thus, considering the margin of error, it can be concluded that αsim≅αexp, implies that the ratio of α is associated with the parameters of the light source and transmission distance. This finding is consistent with the rule derived from Friberg’s study on GSM beam vacuum transmission (T and J, 1982). Additionally, it provides further evidence that the coherence length of the light source plays a crucial role in determining the spot radius.
4 LED-GSM long-distance transmission characteristics
A simulation study was conducted on the partial coherence transmission characteristics of LED optical fields in long-distance optical transmission for narrow-beam LED optical communication applications. Using Equations 10, 11, the far-field coherence length and beam radius of the LED-GSM source was simulated and calculated at different spatial coherence lengths on the LED source plane, showing how they change with distance. Simulation parameters λ = 525 nm, ws = 3 mm, α with values of 0, 5 μm, 10 μm and 41 μm taken separately. Here, σ = 0 corresponds to the case where the LED source is considered as fully incoherent light, with a transmission distance up to 10,000 m.
Figure 10A illustrates the correlation between the normalized intensity distribution on the observation plane and the increasing spot radius. The figure demonstrates that the normalized light intensity distribution is significantly influenced by the size of σ, and the spot size at the normalized intensity of
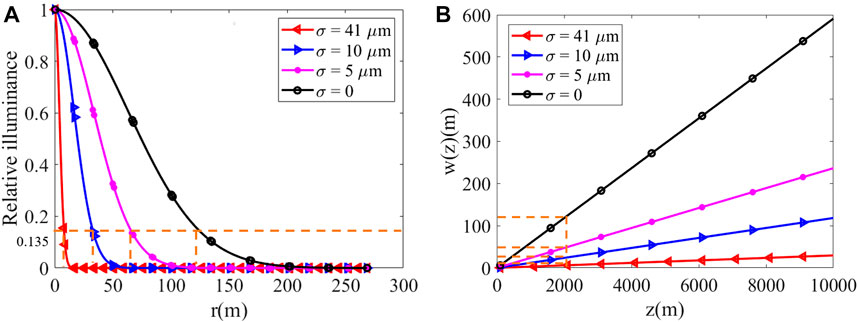
FIGURE 10. Variation in relative intensity distribution and beam radius with different σ. (A) Relative intensity vs. r (z = 2,000 m). (B) Beam radius vs. z.
Figure 11 depicts the relationship between the complex degree of coherence
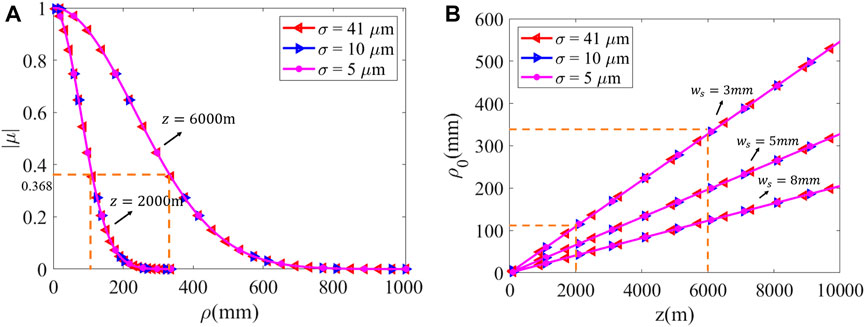
FIGURE 11. Changes in the amplitude of spatial complex coherence and the spatial coherence length at different values of σ. (A)
5 Conclusion
This paper is based on the generalized higher-order Lambert model and proposes the LED-GSM model for LED beams with a half-angle of no more than 10° in the region surrounding the light source plane. The validity and accuracy of the LED-GSM model are preliminarily verified by comparing the spatial complex coherence curves obtained from experiments with the approximate LED source model in reference (Lin H and M, 2012). This comparison supports the application of cross-spectral density transfer theory for studying the propagation of LED beams. Secondly, the spatial coherence length and spot size are measured experimentally at different distances using the Thorlabs LED528EHP model light source. The results show good agreement with those corresponding to the theoretical simulation of LED-GSM beam transmission at CSDF, thereby verifying the validity of the proposed LED-GSM model. Finally, by carrying out a study of the long-distance transmission characteristics of the LED-GSM model, it was found that the far-field beam radius decreases significantly with the increase of σ on the LED-GSM light source plane, and the spatial complex coherence amplitude remains unchanged but is distinctly different from the fully incoherent light of σ = 0. In particular, the spatial coherence length on the observation plane can reach tens to hundreds of millimeters at transmission distances of several kilometers. With increasing distance, the spatial coherence length increases significantly linearly, especially as ws = 8 mm decreases to ws = 3 mm, where ρ0 on the observation plane at z = 6,000 m is about three times larger than at z = 2,000 m.
The results presented above can be utilized to solve problems related to near-range holographic displays, interferometry, and the design of long-distance atmospheric light detection and communication systems. They also offer a valuable mathematical theoretical analysis of LED atmospheric transmission, providing a dependable theoretical basis for the development of outfield experiments. Moreover, this study addresses the limitation of treating LEDs as a fully incoherent light source during long-distance light transmission. It establishes a theoretical framework for investigating the impact of attenuation, scattering, atmospheric turbulence, and ambient light interference on narrow-beam LED arrays during long-distance optical transmission channels.
Data availability statement
The original contributions presented in the study are included in the article/Supplementary Material, further inquiries can be directed to the corresponding authors.
Author contributions
XH and ZM proposed the project. ZM and FL conducted the equation derivation, simulation, ZM and PZ conducted experimental research and image processing. ZM and XH wrote the manuscript. FL and QL helped to modify the documentation. All authors reviewed the manuscript. All authors contributed to the article and approved the submitted version.
Funding
This work was supported by the Fundamental Research Funds for the Central Universities (ZYTS23077, ZYTS23073).
Conflict of interest
The authors declare that the research was conducted in the absence of any commercial or financial relationships that could be construed as a potential conflict of interest.
Publisher’s note
All claims expressed in this article are solely those of the authors and do not necessarily represent those of their affiliated organizations, or those of the publisher, the editors and the reviewers. Any product that may be evaluated in this article, or claim that may be made by its manufacturer, is not guaranteed or endorsed by the publisher.
References
1. Eduard Z. Analysis and experiment of wireless optical communications in applications dedicated to mobile devices with applicability in the field of road and pedestrian safety. Sensors (Basel) (2022) 22:1023. doi:10.3390/s22031023
2. Feng R, Yanyan C, Xurui M. Beam tracking algorithm for marine applications using visible light communication. Appl Opt (2020) 59:6751–9. doi:10.1364/ao.394597
3. Lim S, Jeon H, Ahn S, Hahn J. Optimal spatial coherence of a light-emitting diode in a digital holographic display. Appl Sci (2022) 12:4176. doi:10.3390/app12094176
4. Khaidarov ELZ, Paniagua-Domínguez R, Ha ST, Valuckas V, Liang X, Akimov Y, et al. Controlof led emission with functional dielectric metasurfaces. Laser Photon Rev (2020) 14:1900235. doi:10.1002/lpor.201900235
5. Srisuphaphon S, Buathong S, Deachapunya S. Realization of an optical vortex from light-emitting diode source by a vortex half-wave retarder and using talbot effect based detection. Opt Laser Tech (2022) 1:107746. doi:10.1016/j.optlastec.2021.107746
6. Chen GTH, Lin H, Chen Z, Pu J. Spectral spatial coherence of high-power multi-chip leds. Optoelectronics Lett (2012) 8:422–5. doi:10.1007/s11801-012-2322-6
7. Deng Y, Chu D. Coherence properties of different light sources and their effect on the image sharpness and speckle of holographic displays. Scientific Rep (2017) 7:5893. doi:10.1038/s41598-017-06215-x
8. Xie G, Chen M, Mazilu M, Zhang S, Bansal A, Dholakia K, et al. Measuring and structuring the spatial coherence length of organic light-emitting diodes. Laser Photon Rev (2016) 10:82–90. doi:10.1002/lpor.201500065
9. Mehta D, Saxena K, Dubey SK, Shakher C. Coherence characteristics of light-emitting diodes. J Lumin (2010) 130:96–102. doi:10.1016/j.jlumin.2009.07.027
10. Lin H, Hua T, Meng H, Ji-Xiong P. Measuring and structuring the spatial coherence length of organic light-emitting diodes. Acta Optica Sinica (2012) 32:7. doi:10.3788/AOS201232.0323003
11. Zmija A, Deiml P, Malyshev D, Zink A, Anton G, Michel T, et al. Led as laboratory test source for astronomical intensity interferometry. Opt Soc America (2020) 28:5248–56. doi:10.1364/OE.28.005248
12. Li Z, Qiu G, Zhao L, Jiang M. Dual-mode led aided visible light positioning system under multi-path propagation: Design and demonstration. IEEE Trans Wireless Commun (2021) 20:5986–6003. doi:10.1109/TWC.2021.3071469
13. Nixon M, Redding B, Friesem AA, Cao H, Davidson N. Efficient method for controlling the spatial coherence of a laser. Opt Lett (2013) 38:3858–61. doi:10.1364/OL.38.003858
14. He Q, Turunen J, Friberg AT. Propagation and imaging experiments with Gaussian schell-model beams. Opt Commun (1988) 67:245–50. doi:10.1016/0030-4018(88)90143-5
15. Carter WH, Wolf E. Coherence properties of lambertian and non-lambertian sources. J Opt Soc America (1975) 65:1067–71. doi:10.1364/JOSA.65.001067
16. Wang Q, Zhang K, Lin D, Liang X, Liu Y, Zhang S, et al. Introducing an n-type electron deceleration layer to enhance the luminous efficiency of algan-based duv-leds. Front Phys (2023) 11:1118946. doi:10.3389/fphy.2023.1118946
17. Jacobs VFS, Rombauts P, Hanselaer P. Near-field and far-field goniophotometry of narrow-beam led arrays. Lighting Res Tech (2015) 47:470–82. doi:10.1177/1477153514530139
18. Lu W, Liu L, Sun J, Yang Q, Zhu Y. Change in degree of coherence of partially coherent electromagnetic beams propagating through atmospheric turbulence. Opt Commun (2007) 271:1–8. doi:10.1016/j.optcom.2006.09.058
19. Yang H, Bergmans JWM, Schenk TCW, Linnartz JPMG, Rietman R. An analytical model for the illuminance distribution of a power led. Opt express (2008) 16:21641–6. doi:10.1364/OE.16.021641
20. Duarte FJ, Liao L, Vaeth KM. Coherence characteristics of electrically excited tandem organic light-emitting diodes. Opt Lett (2005) 30:3072–4. doi:10.1364/OL.30.003072
21. Emil W. Introduction to the theory of coherence and polarization of light. Cambridge: Cambridge University Press (2007).
22. Foley JT, Zubairy MS. The directionality of Gaussian schell-model beams. Opt Commun (1978) 26:297–300. doi:10.1016/0030-4018(78)90205-5
23. Friberg AT, Sudol RJ. Propagation parameters of Gaussian schell-model beams. Opt Commun (1982) 41:383–7. doi:10.1016/0030-4018(82)90161-4
24. Craford MG, Holonyak N, Kish FA. In pursuit of the ultimate lamp. Scientific Am (2001) 284:62–7. doi:10.1038/scientificamerican0201-62
Keywords: LEDs (light-emitting diodes), narrow beam angle, Gaussian-Schell model, long-distance, spatial coherence, beam expansion
Citation: Miao Z, Zhang P, Lu F, Han X and Li Q (2023) Light field analysis for modeling and transmission characteristics of partially coherent light-emitting diodes. Front. Phys. 11:1181343. doi: 10.3389/fphy.2023.1181343
Received: 07 March 2023; Accepted: 18 April 2023;
Published: 04 May 2023.
Edited by:
Bin Zhang, Sichuan University, ChinaReviewed by:
Liguo Wang, Xi’an Technological University, ChinaChaoliang Ding, Luoyang Normal University, China
Copyright © 2023 Miao, Zhang, Lu, Han and Li. This is an open-access article distributed under the terms of the Creative Commons Attribution License (CC BY). The use, distribution or reproduction in other forums is permitted, provided the original author(s) and the copyright owner(s) are credited and that the original publication in this journal is cited, in accordance with accepted academic practice. No use, distribution or reproduction is permitted which does not comply with these terms.
*Correspondence: Xiang’e Han, eGVoYW5AbWFpbC54aWRpYW4uZWR1LmNu
 Zhifang Miao
 Pengfei Zhang
 Fang Lu2