 Arshad Mehmood
 Bashir Salah
 Syed Sajid Ullah
 Shahbaz Khan
 Razaullah Khan
- 1Department of Mechanical Engineering, University of Engineering and Technology, Peshawar, Pakistan
- 2Industrial Engineering Department, College of Engineering, King Saud University, Riyadh, Saudi Arabia
- 3Department of Information and Communication Technology, University of Agder (UiA), Grimstad, Norway
- 4Department of Mechanical Engineering, Institute of Manufacturing, University of Engineering and Applied Sciences, Swat, Pakistan
In this study, we employ a parallel Computational Fluid Dynamics (CFD) code integrated with the VTDIRECT95 algorithm, a parallel deterministic global optimization method, to conduct global optimization for an oscillating circular cylinder. We conduct numerical simulations for the flow at a Reynolds number of 500 within the parameter range of
1 Introduction
The flow past a circular cylinder is a classic and challenging problem that has garnered considerable attention from researchers due to its relevance in numerous engineering disciplines. The flow past a circular cylinder exhibits a wide range of phenomena, including boundary layer formation, separation, wake formation, and vortex shedding. The formation of a boundary layer, a thin layer of fluid near the cylinder’s surface, plays a crucial role in determining the flow characteristics. It experiences shear forces and influences the overall flow behavior. Separation occurs when the fluid detaches from the cylinder’s surface, leading to the formation of a wake region behind the cylinder. This wake region is characterized by the shedding of vortices, resulting in unsteady flow patterns and fluctuating forces acting on the cylinder.
Understanding the flow regimes and associated forces in the flow past a circular cylinder is of paramount importance for predicting and controlling the resulting aerodynamic forces. The drag force, acting in the direction of the flow, is responsible for the resistance experienced by the cylinder. The lift force, perpendicular to the flow direction, can have significant implications for stability and lift-based applications. It is important to note that the interaction between amplitude, frequency, and the resulting effects on the lift force and vortex shedding can be highly complex. It often requires experimental measurements or computational simulations to precisely understand the specific behavior for a given cylinder geometry and flow conditions. Researchers often conduct systematic investigations, varying the amplitude and frequency of oscillation, to study the resulting changes in vortex shedding, lift force, and other relevant parameters. This helps in gaining insights into the fluid-structure interaction and optimizing the performance of various engineering applications involving cylinders, such as bluff bodies, heat exchangers, and oscillating hydrofoils.
Studying the movement of fluid around a cylinder that vibrates is a well-known problem in understanding different aspects of how fluid flows. Researchers [1–8] have employed both experimental methods and numerical simulations to explore vibrations that occur along perpendicular to the fluid flow direction. Their objective is to gain a deeper understanding of the impact of vibration frequency and intensity on the dynamics of fluid flow, specifically in relation to vortex shedding, which can cause vibrations in the cylinder. On the other hand, only a small number of research studies [9–12] have focused on the synchronization that can occur between the pattern of fluid movement and the back-and-forth motion of the cylinder along the same direction as the fluid flow (inline oscillations). It was observed that, if the external force is strong enough and its frequency is similar to the natural frequency at which shedding occurs, synchronization occurs, causing the shedding to happen at the same frequency as the external force. Tanida, Okajima and Watanabe [9] analyzed the stability of a cylinder that was oscillating along the flow direction. They measured the forces acting on the cylinder as it oscillated, both when it was alone and when there were two cylinders placed one after the other. In the two-cylinder case, they made the downstream cylinder oscillate either sideways or in the same direction as the fluid flow. They found that the cylinder’s oscillation caused it to synchronize with the fluid’s natural frequency of oscillation. This only happened at low fluid speeds for the two-cylinder case. At high speeds, synchronization happened regardless of the distance between the cylinders. They also found that the oscillation of the downstream cylinder became unstable when it was synchronized with the fluid’s oscillation. Marzouk and Nayfeh [10] utilized a finite-difference method to investigate how a circular cylinder in a uniform stream behaves when it moves back and forth in a certain way. They looked at when the forces acting on the cylinder (lift and drag) become synchronized with the motion and found that when this happens, the lift force becomes very small and the drag force becomes steady, no matter how fast or slow the cylinder is moving. However, the amount of drag force that oscillates depends on the speed of the cylinder’s motion. These changes in forces are caused by changes in the flow of the fluid around the cylinder. They also looked at how the Reynolds number, which is a measure of the fluid’s viscosity, affects the synchronization. Moreover, they also have discovered that when the forces acting on the cylinder are synchronized, it changes the relationship between lift and drag.
Lu et al. [13] conducted an experiment aimed at reducing the lift force on a circular cylinder in a steady flow at low Reynolds numbers. Their approach involved rotating the cylinder around its axis with a specific speed that was controlled based on the feedback signal of the lift coefficient. They used a numerical model to determine the optimal control parameter for different Reynolds numbers and found that it could significantly reduce lift force without causing an increase in drag force, as long as the control parameter remained below a certain threshold. They also observed lift shift phenomena when the control parameter exceeded the critical value. In a separate study, Chen et al. [14] investigated the vibrations of two circular cylinders located near a wall when fluid flowed around them. The cylinders were only able to move in a longitudinal or in both a lateral and longitudinal direction. They examined how the distance between the cylinders and the wall, as well as the speed of the fluid flow, influenced the cylinder vibrations. They observed that the presence of the wall had a significant effect on the vibrations, causing them to move differently and with varying amplitudes.
Canpolat and Sahin [15] experimentally analyzed the flow control mechanism of a single groove on a circular cylinder surface. The main focus of their investigation was on the angular position of the groove with respect to the forward stagnation point of the cylinder. Notably, they identified a critical angular position of the groove at θ = 80°. Below this threshold (θ < 80°), effective control of flow separation was observed. However, at θ = 80°, flow separation initiated in the upstream direction. The presence of the groove also introduced instability within the shear layer, characterized by frequencies that differed from the Karman vortex shedding frequency. Philippe et al. [16] examined the flow behavior around a circular cylinder at a Reynolds number of Re = 3,900. They employed both numerical simulations utilizing large eddy simulation and experimental techniques involving hot-wire anemometry and particle image velocimetry. They observed that achieving accurate statistical estimation necessitates significant integration times, leading to higher computational expenses and introducing an uncertainty of around 10% for most of the flow characteristics investigated in their study. Dong et al. [1] examined the characteristics of the near wake of a cylinder at various Reynolds numbers, which corresponded to the onset and progression of shear-layer instabilities. By employing a combination of quantitative experimental imaging using particle image velocimetry (PIV) and direct numerical simulations, they observed significant modifications in the flow structure. Specifically, at higher Reynolds numbers (Re = 3,900, 4,000, and 10,000), both the wake bubble and the separating shear layer exhibited considerable reductions in length. Additionally, the velocity fluctuations and Reynolds stress patterns associated with the flow were observed to contract closer to the base of the cylinder.
Cetin et al. [17] conducted a study focusing on the suppression of periodic vortex shedding around a circular cylinder using a concentrically located perforated cylinder under laminar flow conditions at a Reynolds number of Re = 200. They investigated the effects of porosity and gap ratio variations. Their findings revealed that the porosity has a more pronounced impact on the flow characteristics around the solid cylinder compared to the gap ratio. Increasing the porosity resulted in the enlargement of low-velocity and low-pressure regions in the transverse direction. When the gap ratios were low, the separated layers originating from the solid and perforated cylinders merged. Conversely, larger gap ratios combined with low porosity values exhibited individual movement of these layers. They achieved successful suppression of periodic vortex shedding in cases where the gap ratios were 3.5 and the porosity was either 0.5 or 0.6, as well as in cases where the gap ratio was 3 and the porosity was 0.5. In another paper Cetin [18] conducted a study examining the flow characteristics around a circular cylinder featuring a single longitudinal groove pattern on its surface. They investigated six different rectangular groove sizes, varying the angular position of the groove from the forward stagnation point of the cylinder within the range of 0°–150°. To analyze the flow field downstream of the cylinder, the researchers utilized the particle image velocimetry (PIV) technique while subjecting the cylinder to a uniform flow with a Reynolds number of Re = 5,000. The study revealed that the presence of the groove on the cylinder surface exerted a significant influence on both the flow structure in the near wake region and the turbulence statistics. The frequency of Karman vortex shedding exhibited a strong correlation with the size of the groove. Additionally, the presence of the groove induced shear layer instability on the grooved side, resulting in the emergence of additional frequencies within the flow.
To model the flow over a circular cylinder, one needs to use mathematical equations to describe the motion of the fluid. The Navier-Stokes equations are a set of equations used to describe fluid flow and can be solved numerically using different computational methods. To model the flow around a cylinder, the geometry of the cylinder is defined and boundary conditions for the fluid flow are set. The fluid domain is then divided into small cells or control volumes, and the properties of the flow such as velocity and pressure are calculated at each cell using the Navier-Stokes equations. The results of the simulation can be used to study the flow characteristics such as vortices, lift and drag forces, and the impact of different parameters on flow behavior. This modeling is used in various fields like aerodynamics, fluid mechanics, and marine engineering. Zang, Street and Koseff [19] used curvilinear coordinates to solve the Navier-Stokes equations in three dimensions, defining velocity and pressure at the center of a control volume and volume fluxes at the midpoint of their respective cell faces. They used a technique called “approximate factorization” to solve the momentum equations about the way the fluid pushes and pulls. Leonard [20] proposed a new method to model fluid flow that addresses stability issues related to central differencing and inaccuracies caused by numerical diffusion of upstream differencing. The technique combines both convection and diffusion and requires similar computations as the standard upstream-plus-central differencing method but provides more accurate results with larger grid spacing. This leads to faster computation and less storage requirements. Blackburn and Henderson [21] modeled the wake patterns and flow dynamics of the flow around a circular cylinder, both when it is stationary and when it undergoes simple harmonic cross-flow oscillation using an accelerated reference frame technique. He et al. [22, 23] developed a massively parallel version of the DIRECT algorithm, which is widely used in multidisciplinary design optimization applications. They tested how well it worked by using both theoretical and real-world problems with many variables. They found that their new method worked well for many different problems and can be used to make other optimization tools work better too.
This paper presents a systematic investigation into the flow characteristics and forces in the flow. We aim to find ways to reduce the lift force on a circular cylinder in an efficient way when fluid flows past a cylinder that is oscillating in the direction of the flow at Re = 500 and 1,000. Testing many different combinations of the speed and amplitude of the movement can take a long time, so we use a special method to quickly find the best settings. We combine a computer program that simulates how fluid flows around the cylinder with a tool that searches for the best settings. We look at two things, how far (i.e., amplitude) and how fast (i.e., frequency) the cylinder moves, and test many different possibilities to see which ones reduce the lifting force the most. Next, we explored the impact of three-dimensional flow and evaluated the suitability of utilizing the Reynolds number to describe the flow conditions. The manuscript follows the following organization: In Section 2, we provide a comprehensive discussion on the numerical approach, encompassing the methodology as well as its validation for fluid-structure coupling. Section 3 delves into the results obtained from the study and thoroughly explores their underlying physics. Finally, Section 4 presents the conclusions drawn from our investigation.
2 Numerical simulations and validation
2.1 Governing equations
There are different ways to simulate moving boundaries in fluid mechanics, such as the immersed boundary (IB) method [11], the arbitrary Lagrangian-Eulerian (ALE) method, and the accelerating reference frame (ARF) method [21]. In this study, the ARF method is used as it is a suitable approach for simulating moving boundaries. This method couples the momentum equations with the cylinder motion by adding a frame acceleration term. It also adjusts the boundary conditions to account for the moving reference frame. This results in equations that describe the motion of the incompressible fluid relative to the structure in a Cartesian reference frame.
where i, j = 1, 2, 3. At the domain boundary, the velocity boundary condition is modified to include the effect of moving body, such that
In the current method, the equation describing the motion of the cylinder is modeled as a simple harmonic motion in the direction of the flow. This motion is caused by an external force acting on the cylinder:
Where
These equations that govern the system are solved using a non-staggered grid topology [19]. We calculated the spatial differences using a second order central difference method, except for convective differences, which used QUICK discretization [20]. For time advancement, we used a fractional step approach, where the predictor step predicted an intermediate velocity, and the corrector step updated the velocity by solving the pressure-Poisson equation for the new time step. We used a semi-implicit scheme with Adams-Bashforth method to discretize the convection terms and the Crank-Nicolson scheme to discretize the diffusion terms. To simulate the flow over a circular cylinder, an “O”-type grid is used as depicted in Figure 1. The boundary conditions at the inflow are specified using Dirichlet boundary conditions, while the outflow boundaries use Neumann boundary conditions. At the surface of the cylinder, a no-slip and no-penetration boundary condition is enforced. We used domain decomposition approach for parallel computing. In this approach, we divide a large computational domain into smaller sub-domains that can be processed independently by different processors as shown in Figure 2. The processors exchange data at the interfaces between the sub-domains to ensure that the calculations are performed correctly. This technique enables the parallelization of large-scale simulations, which would otherwise require an impractical amount of time to execute on a single processor, and each sub-domain is processed independently by the corresponding processor [24–26].
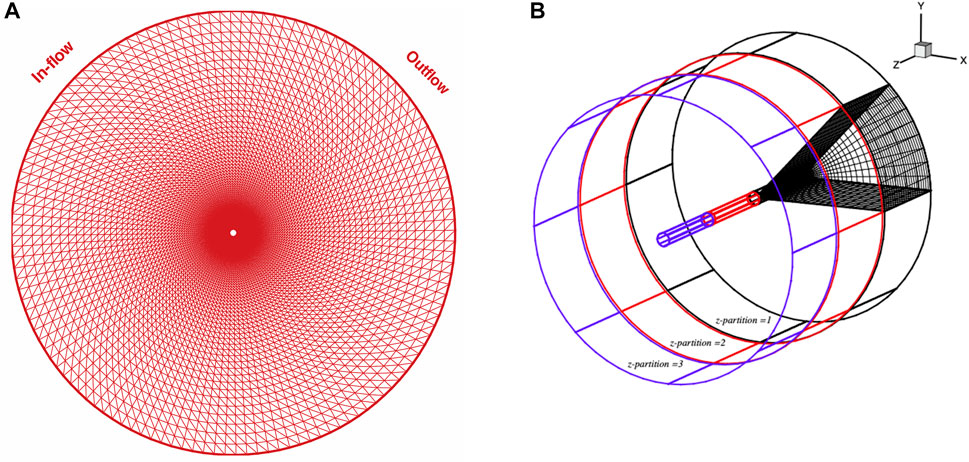
FIGURE 1. A depiction of a (A) two-dimensional and (B) three-dimensional grids featuring an “O” shape in the (r, θ)-plane.
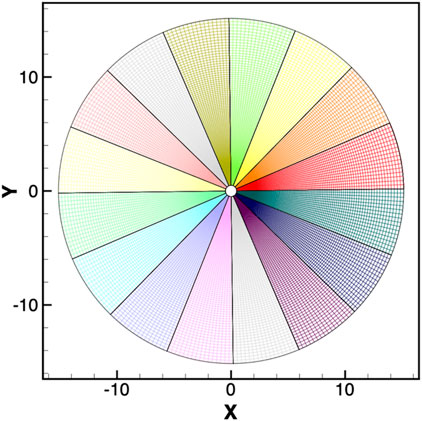
FIGURE 2. Splitting of the grid using domain decomposition approach.
To calculate the forces exerted on a cylinder by a fluid, the pressure and shear stress over the cylinder’s surface are integrated. The pressure force is determined by integrating the pressure, while the shear force is determined by integrating the shear stress. The resulting fluid force is then separated into appropriate coordinate system components. Two components, lift and drag, are used to describe the net fluid force on the cylinder. The nondimensional lift coefficient (
Here,
2.2 Validation
To verify the accuracy of the parallel CFD solver’s [24, 24] for inline oscillations, we compared the current simulation results with the data observed experimentally by Tanida, Okajima and Watanabe [9]. In their experiments, they used oil at a flow Reynolds number of 80 and an inline motion amplitude of
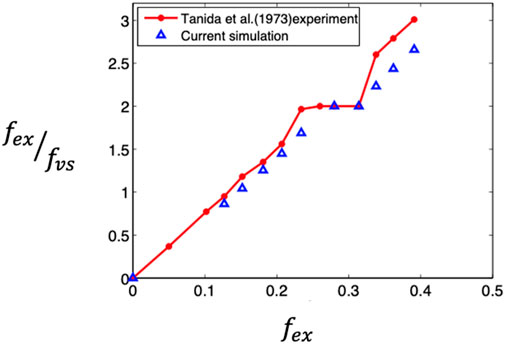
FIGURE 3. Comparison between our CFD simulations with the results obtained by Tanida et al. [8] for how the frequency ratio between the forcing and the shedding frequency in relation to the non-dimensional frequency of the cylinder’s movement.
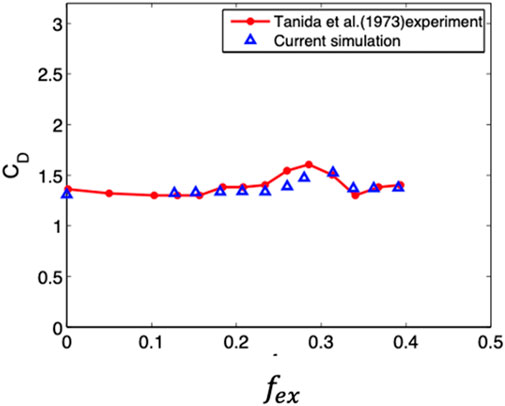
FIGURE 4. Comparison between our CFD simulations with the results obtained by Tanida et al [8] for how the mean drag coefficient changes with the non-dimensional frequency of the cylinder’s movement.
2.3 Coupling of CFD solver with the VTdirect
We integrated the parallel CFD code [24] with the parallel deterministic global optimization algorithm VTDIRECT95 [22, 23] to achieve global optimization. We did this by utilizing an interface function that calculates the lift coefficient for the flow past a circular cylinder undergoing inline oscillation. VTDIRECT95 is a package written in Fortran 95, designed for deterministic global optimization. The package includes the subroutines VTdirect (serial) and pVTdirect (parallel), which implement a variant of the DIRECT algorithm [7]. This algorithm is widely utilized in physical science applications and multidisciplinary engineering problems due to its efficiency in avoiding local optimum points and searching for global optimum points through three key operations:
1. Identifying boxes with high potential for containing the global optimum point.
2. Collecting data by sampling points within those boxes.
3. Dividing the boxes that were identified in step 1 into smaller sub-boxes.
For further information about the VTdirect code, including its serial and parallel implementations, please refer to [22, 23]. Deterministic algorithms like VTDIRECT95 are notable for their efficient utilization of function evaluations, unlike population-based evolutionary algorithms. In our investigation, we consider a uniform flow where a circular cylinder undergoes one-dimensional harmonic motion in the inline direction at a Reynolds number of 500. Our goal is to reduce the fluctuating component of the fluid force perpendicular to the flow. We use a mathematical way of measuring this called the root mean square (RMS) value of that perpendicular force. We frame the optimization problem as follows
Subject to
where
Integrating the CFD solver with the optimization code VT-DIRECT95 has significant advantages. Previous studies [9, 10] investigating the reduction of lift through inline oscillatory motion of circular cylinders have mostly explored variations of a single control parameter. In such cases, identifying the optimal point requires a thorough sweep within a specified range of the control parameter. For instance, to minimize lift force, researchers usually consider the forcing frequency as the control parameter while keeping the amplitude of oscillation constant. Including more control parameters would necessitate a large number of experimental or numerical runs to determine the optimal point where the lift force is minimized. The lift force on a circular cylinder can be decreased or eliminated by causing it to undergo inline oscillation at specific frequencies and amplitudes. This reduction in lift force is caused by the interaction between the shed vortices and the oscillating cylinder, resulting in modifications to the flow structure and shedding pattern. Experiments were conducted by Tanida, Okajima and Watanabe [9, 10] while Marzouk and Nayfeh [10] performed numerical simulations. According to their findings, they observed a complete suppression of lift within a specific frequency range, where the forcing frequency reached twice the Strouhal frequency. Finding this regime required conducting many experiments, simulations, and spending a significant amount of computation time to explore the frequency range.
In order to test how well VTdirect works, we did a study where we changed the frequency of the inline oscillation in one direction while keeping the amplitude the same. We only varied the frequency within a certain range (0.5
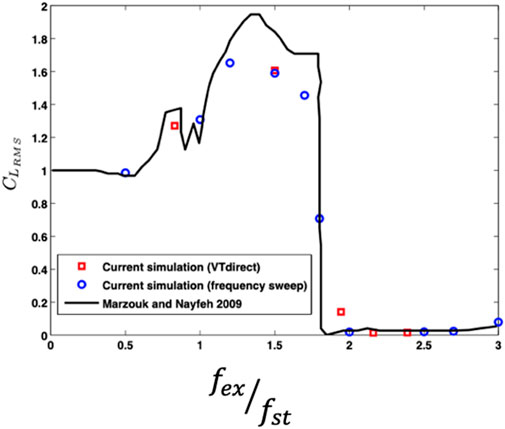
FIGURE 5. Changes in the root mean square (rms) value of the lift coefficient.
3 Results and discussion
3.1 Lift reduction in 2-D flow
We explore various possibilities for the magnitude of cylinder’s displacement and its speed (frequency). The minimum and maximum values for these options, which we will employ in our CFD simulations, are displayed in Table 1. We find these values based on the optimal location identified in previous studies [9]. These options encompass a broad spectrum that includes both synchronous and nonsynchronous regimes, and will aid us in achieving our objective more efficiently. Marzouk and Nayfeh [10] conducted research on the oscillation of cylinders and found that at an amplitude of 0.2, the lift decreased significantly from 1.696 at
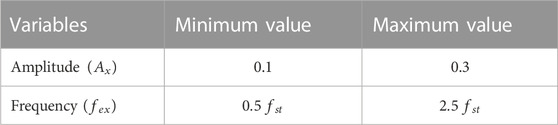
TABLE 1. Limitations on controlled variables.
We established conditions to determine when the optimizer should stop running, such as limiting the number of iterations, minimum change in the objective function, and minimum box diameter. We used an interface module that combined VTdirect with the CFD solver to identify the synchronization region, as shown in Figure 6. In this figure, the
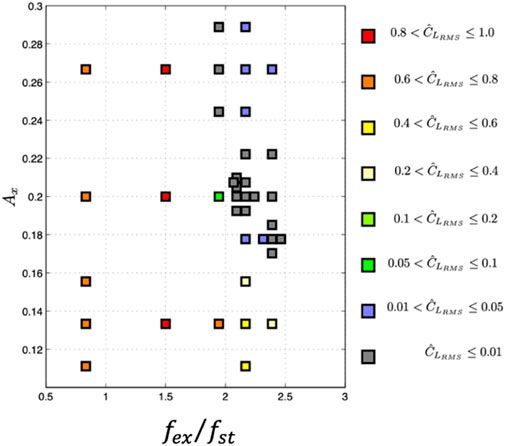
FIGURE 6. The data points that were selected by VTdirect.
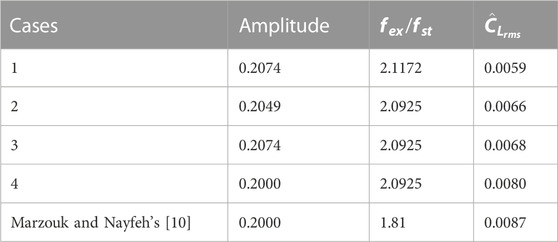
TABLE 2. Overview of the best settings.
The plot in Figure 7 illustrates how the lift coefficient varies over time or the best values of the parameters found using VTdirect. The plot indicates that the root mean square value of
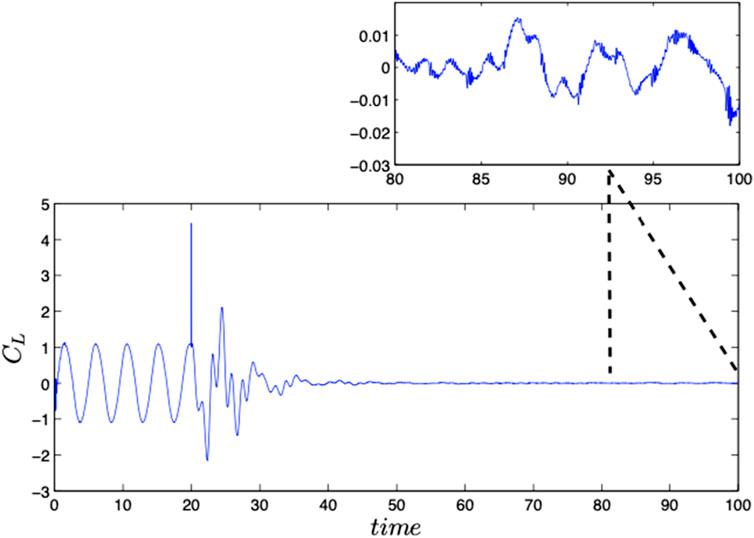
FIGURE 7. Time trace of the lift coefficient for the optimal case as identified by VTdirect.
To comprehend the flow physics of the synchronized configurations better, we have added vorticity contour plots for two cases, shown in Figures 8, 9. In a non-synchronized case as shown in Figure 8, where the cylinder is vibrating along the direction of flow, the vortices shed alternatively because of the shedding frequency of vortices in the wake, resulting in lift generation on the cylinder surface. In the non-synchronized case, it alternately creates a low-pressure region on one side of the cylinder and then the other. This causes the vortices to shed alternatively from one side to the other. In a synchronized case as shown in Figure 9, where a cylinder is vibrating along the direction of flow, the vortices shed simultaneously due to lock-in/synchronization. Lock-in occurs when the frequency of the cylinder vibration matches the natural frequency of the vortices in the wake, causing the shedding of vortices to become synchronized with the cylinder vibration. This synchronized shedding of vortices can significantly reduce the lift force on the cylinder, as both the vortices cancel the effect of each other.
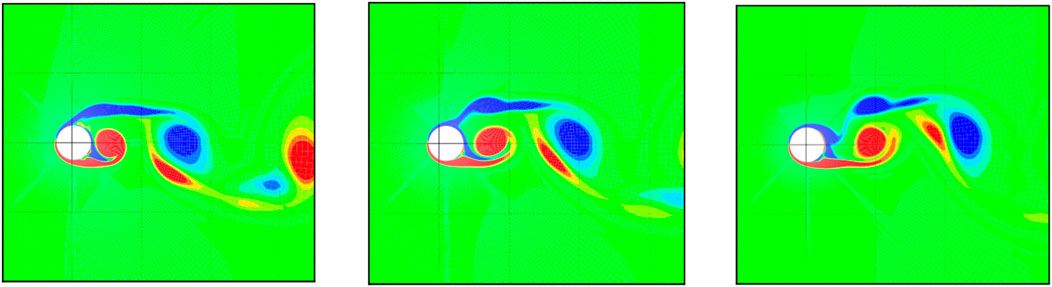
FIGURE 8. The contours of vorticity are shown at
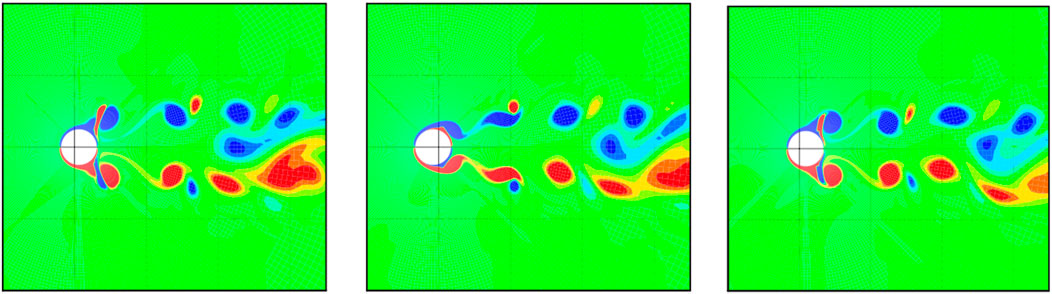
FIGURE 9. The contours of vorticity are shown at
3.2 2-D and 3-D simulations
Reducing upward force (lift suppression) can be useful in situations where sideways forces are not desirable [11]. However, in real-world applications, we need to take into account three-dimensional (3-D) effects. This is because when the fluid flow becomes unstable at Re of around 180 for Mode A and around 260 for Mode B, the 3-D structures of the swirling fluid can have a big impact on the way that the fluid moves behind the object (the wake) [5, 6, 27, 28]. This means that CFD simulations that only consider two dimensions (2-D) and do not capture these swirling vortices in the direction of fluid flow cannot accurately predict the way that the fluid will move. Moreover, as shown in Table 3, simulations that take 3-D effects into account can provide more accurate predictions of how the fluid will move compared to simulations that only consider 2-D effects.
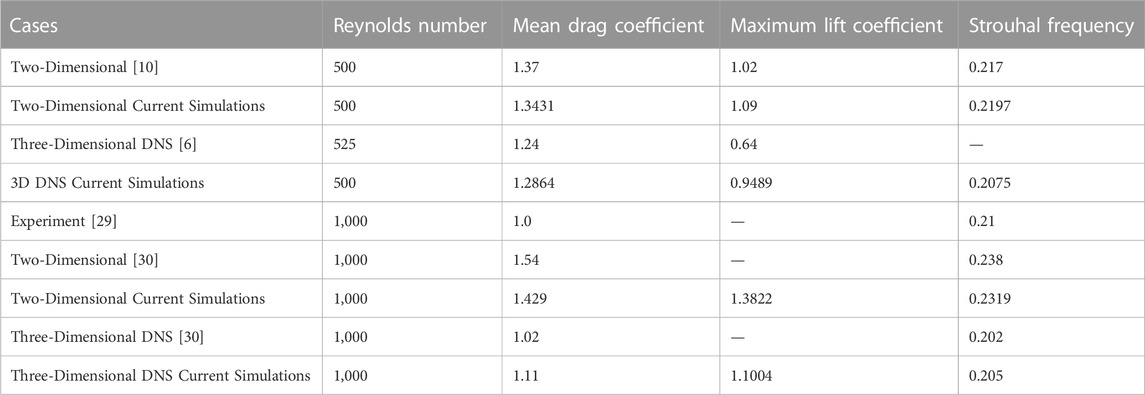
TABLE 3. Flow parameters computed from different simulations and experiments.
In numerical simulation of 2-D flow, we used a grid of size 192
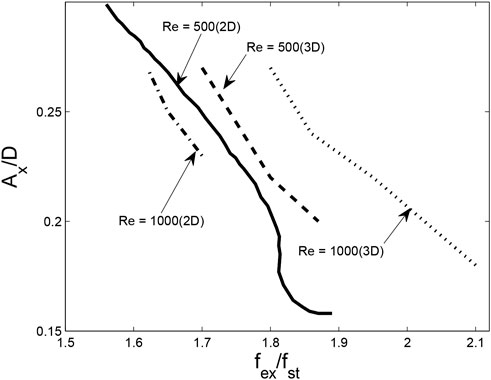
FIGURE 10. Synchronization maps comparison obtained by Marzouk and Nayfeh [10] for a 2-D setup with Reynolds number of 500 (represented by a solid line) to the ones we obtained through our simulations. Our simulations were conducted with 3-D setups and included Reynolds numbers of 500 (represented by a dashed line) and 1,000 (represented by a dotted line for 3-D and a dashed-dot line for 2-D).
To better understand how synchronization starts to occur, we conducted numerous simulations of fluid flow using both 2-Dimensional and 3-Dimensional setups. In our numerical computations, we varied the amplitude and frequency of the cylinder’s movement and recorded the resulting synchronization maps for Reynolds numbers of 500 and 1,000. We plotted the results in Figure 10, which shows the non-dimensional amplitude of the cylinder’s movement (
1. During our 2-D simulations, we noticed that when the Reynolds number was increased from 500 to 1,000, the synchronization boundary shifted towards the left. This suggests that a smaller amplitude of movement was required to synchronize at the same frequency. In contrast, our 3-D simulations showed that when the Reynolds number was increased from 500 to 1,000, the synchronization boundary shifted towards the right. This indicates that a larger amplitude of movement was required to synchronize at the same frequency.
2. We observed that the slope of the synchronization boundary remained almost unchanged in both our 2-D and 3-D simulations.
3. We noticed that for both Reynolds numbers of 500 and 1,000, achieving synchronization in 3-D flow required a higher frequency of movement compared to 2-D flow with the same amplitude of movement.
To investigate how the frequency of movement affects lift suppression, we kept the amplitude of movement constant and varied the frequency of oscillation for two different Reynolds numbers. We chose a frequency range of 1.6–2.3 times the vortex shedding frequency and performed 3-D simulations. In Figure 11, we plotted the root mean square of the lift coefficient relative to the stationary cylinder for four different amplitudes of movement and two Reynolds numbers. We noticed that before synchronization occurred, the amplitude of lift was higher than that of the stationary cylinder. However, once synchronization took place, the amplitude of lift decreased sharply and lift was completely suppressed. The mean drag coefficient also exhibited similar behavior, but it only reduced by 20% and then remained constant irrespective of the frequency of movement.
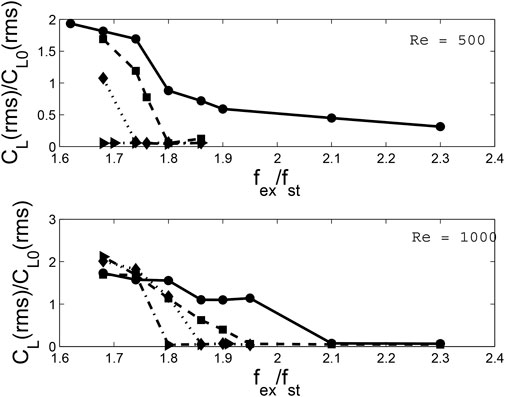
FIGURE 11. 3-D simulated relative root-mean-square (rms) lift coefficient (CL) changes with the non-dimensional ratio of the forcing-to-shedding frequency (
To reduce lift in three-dimensional flows, stronger amplitude and frequency are needed. This is because of the vortical structures that form in the wake. When a flow passes over a stationary cylinder, increasing the Reynolds number from 500 to 1,000 causes the structured wake to become unstable, resulting in the breakdown of larger vortices, as seen in Figures 12A, B. These findings agree with previous studies by Williamson [2] and Mittal et al [6, 27]. If the cylinder oscillates in a non-synchronous regime, vortex shedding occurs in an alternating manner, leading to changes in the lift force on the cylinder, as demonstrated in Figures 12C, D. In the synchronous regime, however, symmetric vortices are shed from both sides of the cylinder, as shown in Figures 12E, F.
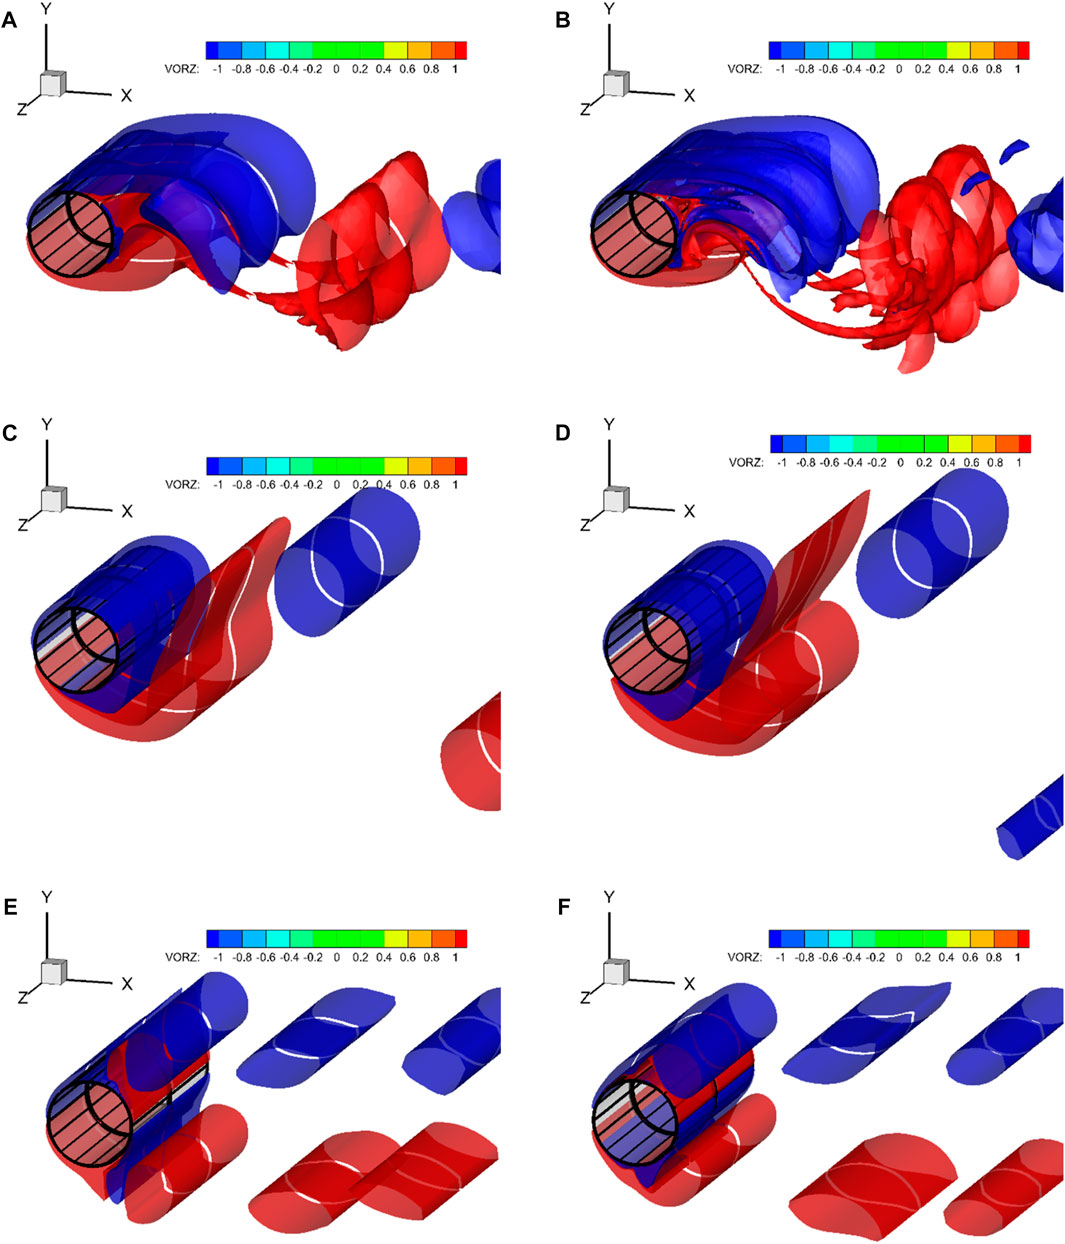
FIGURE 12. Images showing the vorticity contours in a three-dimensional flow at Reynolds numbers of 500 [(A)-Stationary-(C) non-Synchronous, and (E)-non-Synchronous] and 1,000 [(B)-Stationary-(D) non-Synchronous, and (F)-non-Synchronous] were captured.
Synchronization in dynamical systems happens when the natural frequency coincides with the frequency of the external force. When synchronization is achieved, the cylinder’s movement in the flow direction takes precedence over the formation of alternating vortex shedding. Consequently, vortices are shed simultaneously from both the top and bottom surfaces of the cylinder, resulting in symmetrical flow in the flow direction, which is known as “inertia coupling” to avoid confusion. This leads to a symmetrical pressure distribution with respect to the flow direction, resulting in the suppression of lift. In essence, this illustrates the synchronization phenomenon.
We provide reasoning for each event depicted in Figure 10 with the following arguments:
1. For the two-dimensional case, as the Reynolds number increases from 500 to 1,000, the synchronization curve moves to the left. This is because the wake’s vorticity increases, causing the vortices to be more tightly packed. As a result, inertia coupling occurs at lower frequencies and amplitudes. However, in three-dimensional flows, increasing the Reynolds number causes the wake to become unstable. As a result of this, the wake becomes less densely populated and comprises intricate vortical patterns, including ribs, hairpin, and horseshoe vortices. Consequently, greater energy (in the form of increased inline frequency ratio or amplitude) is required to induce inertia coupling in the flow.
2. The behavior of inertia coupling is generally consistent across all the cases presented in this study. It can be used as an indication of the amount of energy needed to sustain this coupling on a frequency-amplitude graph. Nonetheless, this pattern deviates from linearity when frequencies and amplitudes are extremely high or low.
3. After the occurrence of Mode A instability at a constant Reynolds number, the flow destabilizes in the spanwise direction due to the introduction of the third dimension. This results in the creation of intricate vortical structures in the wake, necessitating greater inertia to overcome and attain synchronization. Thus, for Reynolds numbers of both 500 and 1,000, the synchronization curve shifts to the right. This shift is more significant for a Reynolds number of 1,000 than for 500, as the wake’s structures become more complex at higher Reynolds numbers.
Understanding the influence of variations in the wake and spanwise direction is vital in exploiting the suppression of lift force connected with the inline forcing of circular cylinders in engineering and industrial contexts. This investigation focuses on the suppression of lift force that materializes when the speed of inline oscillations is approximately two times the frequency of vortex shedding. Our results demonstrate that the synchronization maps shift towards higher frequency ratios and amplitudes of oscillations, revealing that accomplishing synchronization in three-dimensional flows necessitates greater energy.
4 Conclusion
We employed a parallel 3-D Computational Fluid Dynamics (CFD) code along with a global optimization algorithm called VTdirect95 to optimize the performance of a cylinder undergoing inline oscillations with the flow direction. We obtained optimal values for the amplitude and frequency of the cylinder’s motion, which led to a significant reduction in lift compared to previous studies. The lift coefficient’s time trace in the optimal case showcased a steady-state flow field with minimal lift magnitude. Additionally, vorticity contour plots provided further insight into the flow physics, highlighting the impact of synchronized shedding of vortices on lift force reduction.
To account for three-dimensional effects and achieve accurate predictions of fluid flow behavior, we conducted both 2-D and 3-D simulations. The results demonstrated that incorporating swirling vortices in the wake through 3-D setups improved prediction accuracy compared to 2-D simulations. We analyzed synchronization maps and the root mean square of the lift coefficient for various Reynolds numbers and amplitude-frequency variations. This analysis illustrated the influence of 3-D effects on lift suppression. Notably, we observed that synchronization occurred when the cylinder’s frequency matched the natural frequency of the vortices in the wake, resulting in symmetrical shedding and subsequent lift suppression. The behavior of synchronization was influenced by factors such as Reynolds number, wake vorticity, wake instability, and spanwise direction effects.
Overall, our research enhances the understanding of lift suppression and provides valuable insights into optimal parameters for achieving synchronization and reducing lift in fluid flow scenarios. The significance of considering three-dimensional effects and the influence of wake structures in future studies and real-world applications is underscored by our findings.
Data availability statement
The raw data supporting the conclusion of this article will be made available by the authors, without undue reservation.
Author contributions
All authors listed have made a substantial, direct, and intellectual contribution to the work and approved it for publication.
Funding
This study received funding from King Saud University, Saudi Arabia through researchers supporting project number (RSP2023R145). Additionally, the APCs were funded by King Saud University, Saudi Arabia through researchers supporting project number (RSP2023R145).
Acknowledgments
The authors would like to thank King Saud University, Riyadh, Saudi Arabia, with researchers supporting project number RSP2023R145.
Conflict of interest
The authors declare that the research was conducted in the absence of any commercial or financial relationships that could be construed as a potential conflict of interest.
Publisher’s note
All claims expressed in this article are solely those of the authors and do not necessarily represent those of their affiliated organizations, or those of the publisher, the editors and the reviewers. Any product that may be evaluated in this article, or claim that may be made by its manufacturer, is not guaranteed or endorsed by the publisher.
References
1. Dong S, Karniadakis GE, Ekmekci A, Rockwell D. A combined direct numerical simulation–particle image velocimetry study of the turbulent near wake. J Fluid Mech (2006) 569:185–207. doi:10.1017/s0022112006002606
2. Williamson C. Vortex dynamics in the cylinder wake. Annu Rev Fluid Mech (1996) 28:477–539. doi:10.1146/annurev.fl.28.010196.002401
3. Williamson C, Roshko A. Vortex formation in the wake of an oscillating cylinder. J Fluids Structures (1988) 2(4):355–81. doi:10.1016/s0889-9746(88)90058-8
4. Williamson C, Govardhan R. Vortex-induced vibrations. Annu Rev Fluid Mech (2004) 36:413–55. doi:10.1146/annurev.fluid.36.050802.122128
5. Mittal R, Balachandar S. On the inclusion of three-dimensional effects in sim-ulations of two-dimensional bluff-body wake flows. In: ASME fluid engineering division summer meeting. Vancouver, BC: Canada (1997).
6. Mittal R, Balachandar S. Effect of three-dimensionality on the lift and drag of nominally two-dimensional cylinders. Phys Fluids (1995) 7(8):1841–65. doi:10.1063/1.868500
7. Akhtar I. Reduced-order modeling, and feedback control of vortex shedding using fluidic actuators. Blacksburg, VA: Virginia Tech (2008).
8. Kim B-H, Williams DR. Nonlinear coupling of fluctuating drag and lift on cylinders undergoing forced oscillations. J Fluid Mech (2006) 559:335–53. doi:10.1017/s0022112006000358
9. TanidaOkajima YA, Watanabe Y. Stability of a circular cylinder oscillating in uniform flow or in a wake. J Fluid Mech (1973) 61(4):769–84. doi:10.1017/s0022112073000935
10. Marzouk OA, Nayfeh AH. Reduction of the loads on a cylinder undergoing harmonic in-line motion. Phys Fluids (2009) 21:083103. doi:10.1063/1.3210774
11. Okajima A, Nakamura A, Kosugi T, Kosugi T, Uchida H, Tamaki R. Flow-induced in-line oscillation of a circular cylinder. Eur J Mech - B/Fluids (2004) 23(1):115–25. doi:10.1016/j.euromechflu.2003.09.009
12. Vandiver J, Jong JY. The relationship between in-line and cross-flow vortex-induced vibration of cylinders. J Fluids Structures (1987) 1(4):381–99. doi:10.1016/s0889-9746(87)90279-9
13. Lu L, Qin J-M, Teng B, Li YC. Numerical investigations of lift suppression by feedback rotary oscillation of circular cylinder at low Reynolds number. Phys Fluids (2011) 23:033601. doi:10.1063/1.3560379
14. Chen W, Ji C, Xu D, Zhang Z. Vortex-induced vibrations of two inline circular cylinders in proximity to a stationary wall. J Fluids Structures (2020) 94:102958. doi:10.1016/j.jfluidstructs.2020.102958
15. Canpolat C, Sahin B. Influence of single rectangular groove on the flow past a circular cylinder. Int J Heat Fluid Flow (2017) 64:79–88. doi:10.1016/j.ijheatfluidflow.2017.02.001
16. Parnaudeau P, Carlier J, Heitz D, Lamballais E. Experimental and numerical studies of the flow over a circular cylinder at Reynolds number 3900. Phys Fluids (2008) 20:085101. doi:10.1063/1.2957018
17. Canpolat C, Hamzah H, Sahin B. Flow control around a cylinder with a perforated cylinder. J Fluids Eng (2023) 145(7):071302. doi:10.1115/1.4062088
18. Canpolat C. Characteristics of flow past a circular cylinder with a rectangular groove. Flow Meas Instrumentation (2015) 45:233–46. doi:10.1016/j.flowmeasinst.2015.06.028
19. Zang Y, Street RL, Koseff JR. A non-staggered grid, fractional step method for time-dependent incompressible Navier-Stokes equations in curvilinear coordinates. J Comput Phys (1994) 114(1):18–33. doi:10.1006/jcph.1994.1146
20. Leonard B. A stable and accurate convective modelling procedure based on quadratic upstream interpolation. Comp Methods Appl Mech Eng (1979) 19(1):59–98. doi:10.1016/0045-7825(79)90034-3
21. Blackburn HM, Henderson RD. A study of two-dimensional flow past an oscillating cylinder. J Fluid Mech (1999) 385:255–86. doi:10.1017/s0022112099004309
22. He J, Verstak A, Sosonkina M, Watson L, Sosonkina M. Performance modeling and analysis of a massively parallel direct—Part 1. Int J High Perform Comput Appl (2009) 23(1):14–28. doi:10.1177/1094342008098462
23. He J, Verstak A, Sosonkina M, Watson L. Performance modeling and analysis of a massively parallel direct—Part 2. Int J High Perform Comput Appl (2009) 23(1):29–41. doi:10.1177/1094342008098463
24. Akhtar I, Nayfeh AH, Ribbens CJ. On the stability and extension of reduced-order Galerkin models in incompressible flows. Theor Comput Fluid Dyn (2009) 23:213–37. doi:10.1007/s00162-009-0112-y
25. Mehmood A, Abdessattar A, Hajj MR, Akhtar I, Nayfeh AH, Nuhait A. Linear and nonlinear active feedback controls for vortex-induced vibrations of circular cylinders. J Vibration Control (2012) 20(8):1137–47. doi:10.1177/1077546312469425
26. Mehmood A, Abdelkefi A, Hajj MR, Nayfeh AH, Akhtar I, Nuhait A. Piezoelectric energy harvesting from vortex-induced vibrations of circular cylinder. J Sound Vibration (2013) 332(19):4656–67. doi:10.1016/j.jsv.2013.03.033
27. Mittal R, Iaccarino G. Immersed boundary methods. Annu Rev Fluid Mech (2005) 37:239–61. doi:10.1146/annurev.fluid.37.061903.175743
28. Norberg C. An experimental investigation of the flow around a circular cylinder: Influence of aspect ratio. J Fluid Mech (1994) 258:287–316. doi:10.1017/s0022112094003332
29. Evangelinos C, Karniadakis GE. Dynamics and flow structures in the turbulent wake of rigid and flexible cylinders subject to vortex-induced vibrations. J Fluid Mech (1999) 400:91–124. doi:10.1017/s0022112099006606
Keywords: CFD, lift suppression, VTdirect optimization, 2D and 3D simulations, inline oscillations
Citation: Mehmood A, Salah B, Ullah SS, Khan S and Khan R (2023) Exploring synchronization and lift suppression in fluid flow around vibrating cylinder: a parallel CFD and global optimization investigation. Front. Phys. 11:1213274. doi: 10.3389/fphy.2023.1213274
Received: 27 April 2023; Accepted: 27 June 2023;
Published: 13 July 2023.
Edited by:
Felix Sharipov, Federal University of Paraná, BrazilReviewed by:
Cetin Canpolat, Çukurova University, TürkiyeFlorent Ravelet, Arts et Metiers Institute of Technology, France
Copyright © 2023 Mehmood, Salah, Ullah, Khan and Khan. This is an open-access article distributed under the terms of the Creative Commons Attribution License (CC BY). The use, distribution or reproduction in other forums is permitted, provided the original author(s) and the copyright owner(s) are credited and that the original publication in this journal is cited, in accordance with accepted academic practice. No use, distribution or reproduction is permitted which does not comply with these terms.
*Correspondence: Arshad Mehmood, YXJzaGFkbWVobW9vZEB1ZXRwZXNoYXdhci5lZHUucGs=; Syed Sajid Ullah, c3llZC5zLnVsbGFoQHVpYS5ubw==