Abstract
The dielectric constant is one of the most important physical properties of dielectrics. The pursuit of materials with high dielectric constants has long been a central focus in both fundamental research and practical applications. Traditional theoretical predictions or first-principles calculations of dielectric constants are often challenging and require significant time and computational resources. Machine learning techniques can establish models that link composition and properties, facilitating the study of dielectric properties in condensed matter and enhancing the efficiency of discovering new dielectrics. Strontium-containing dielectrics constitute a diverse class of materials, some of which exhibit exceptionally high dielectric constants, thereby showing great potential for practical applications. In this work, machine learning models were successfully developed to capture the relationship between composition and dielectric properties of strontium-containing dielectrics using different algorithms, with hyperparameter optimization performed via grid search. The optimal model achieved a correlation coefficient of 0.868 and demonstrated a certain degree of generalization ability on the test set. This model serves as a valuable reference and guide, improving the efficiency of dielectric material selection and the discovery of novel high-performance dielectrics.
1 Introduction
Dielectrics and their associated phenomena have long been a key focus in condensed matter physics research [1–4]. The application of dielectrics in various fields, such as electrical transport [5], electric energy storage [6], electrorheological materials [7–9], microfluidics [10, 11], and artificial muscles [12, 13], has also attracted significant interest in applied sciences. The electronic structure of dielectrics consists of both positive and negative charges. In some dielectrics, the centers of positive and negative charges coincide, classifying them as non-polar dielectrics, whereas in others, the charge centers do not overlap, making them polar dielectrics. At the microscopic level, polar dielectrics possess electric dipole moments, and macroscopically, they can be regarded as an ensemble of dipoles. However, their random orientations result in a net dipole moment of zero, rendering the material electrically neutral. When an external electric field is applied, the dipoles experience a torque that aligns them with the field direction. The alignment of a large number of dipoles leads to the appearance of polarization charges on the dielectric’s surfaces perpendicular to the external field (Figure 1A), a phenomenon known as orientational polarization. In contrast, non-polar dielectrics do not exhibit orientational polarization. However, under an applied electric field, the centers of positive and negative charges undergo relative displacement due to electrostatic forces, forming dipoles (Figure 1B). This results in polarization charges appearing on the dielectric’s surfaces, a process referred to as displacement polarization or ionic polarization. Orientational polarization typically occurs in polar molecules such as H2O and CO(NH2)2, whereas displacement polarization is most commonly observed in ionic crystals. Additionally, at the atomic scale, the negatively charged electron cloud and the positively charged atomic nucleus can also undergo polarization, a phenomenon known as electronic polarization. This effect is particularly pronounced in noble gases such as helium and neon.
FIGURE 1
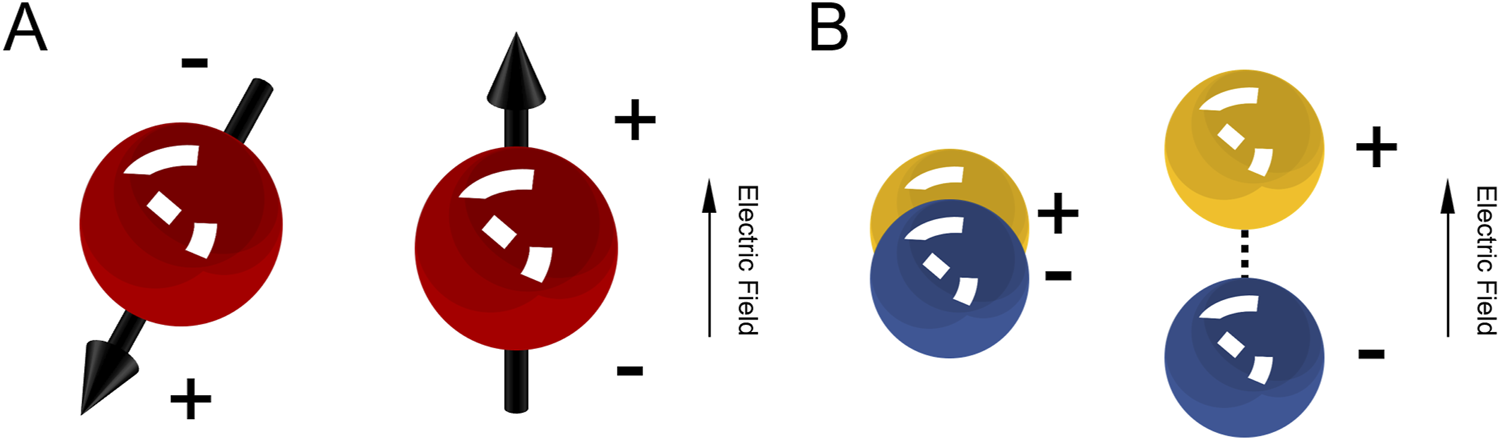
Schematic illustration of dielectric polarization mechanisms: (A) Orientation polarization; (B) Displacement polarization.
Strontium titanate (SrTiO3) is a condensed matter with excellent dielectric properties [14, 15]. Other strontium-containing dielectric materials have also attracted research interest due to their distinctive behavior under electric fields [16–18]. In the study of these materials, theoretical investigations and first-principles calculations based on density functional theory (DFT) have yielded valuable insights [17, 18]. However, these methods are often time-consuming and computationally expensive. With advancements in artificial intelligence and materials databases, data-driven materials discovery has emerged as a promising approach for identifying and selecting dielectrics. This study utilizes data on strontium-containing dielectrics to develop, train, and optimize machine learning models that establish the relationship between the dielectric constant and atomic composition using different machine learning algorithms. The trained models exhibit good predictive reliability and satisfactory generalization performance on the test set.
2 Methods
When a dielectric is placed in an electromagnetic field, its behavior can be described by Maxwell’s equations:where D is the electric displacement, ρf is the free charge density, B is the magnetic flux density, E is the electric field intensity, t is time, H is the magnetic field intensity, and Jf is the free current density. The electric displacement D can be expressed in terms of the polarization P as:where ε0 is the permittivity of free space. When a dielectric is subjected to an electric field, it undergoes polarization. The polarization P quantifies the degree of polarization in the dielectric and is given by:where p is the molecular electric dipole moment, and ΔV is the volume element. The polarization P can also be expressed in terms of the electric susceptibility χe and the permittivity of free space ε0 as:where χe can be related to the relative permittivity (dielectric constant) εr by:
The dielectric constant (also known as the relative permittivity) is a fundamental physical property of dielectric materials (Equations 1–5). Its value is determined by factors such as atomic composition and crystal structure. Due to its strong correlation with atomic composition, a machine learning model can be established to capture this relationship. In this study, the atomic numbers of the constituent elements in the dielectric material, along with their respective counts in the chemical formula, were selected as features. The atomic numbers were arranged in descending order and assigned to five fields: AN1, AN2, AN3, AN4, AN5. Correspondingly, the atomic counts were placed in AC1, AC2, AC3, AC4, AC5. This resulted in a total of 10 features. If a material contained fewer than five distinct elements, the remaining fields were set to zero. The dielectric constant was chosen as the sole target variable, forming the dataset for model training.
Dielectric material data was obtained from the Materials Project database [19]. Three machine learning algorithms—Random Forest (RF), Gradient Boosting Regression (GBR), and Support Vector Regression (SVR)—were used to construct predictive models [20]. To improve model training effectiveness, K-fold cross-validation was employed. Additionally, grid search was used to optimize the hyperparameters of each model. The performance of the trained machine learning models was evaluated and compared using the coefficient of determination (R2) and the Pearson correlation coefficient (P). The R2 value is calculated using the following formula:where represents the actual values, represents the predicted values, and is the mean of the actual values. The closer R2 is to 1, the better the model’s performance. P is computed using the following formula:where represents the values of the first variable, is the mean of , represents the values of the second variable, and is the mean of . P measures the strength and direction of the linear relationship between two variables. A P value close to 1 indicates a strong positive correlation, while a P value close to 0 suggests little to no correlation.
3 Results and discussion
The dielectric property data of strontium-containing condensed matter materials is preprocessed and subjected to feature engineering. The chemical formula information is encoded into atomic numbers and atomic stoichiometry, forming a dataset with 10 features (AN1, AN2, AN3, AN4, AN5, AC1, AC2, AC3, AC4, AC5) and one target variable (dielectric constant). Missing values are filled with 0 to maintain consistency in the dataset.
The Pearson correlation coefficient is used to analyze the relationships between features (Figure 2). Most feature pairs exhibit low correlation, indicating independence. However, a relatively high correlation is observed between AN5 and AC5, which can be attributed to the fact that only a small number of materials in the dataset contained a fifth atomic species. This leads to a large number of zeros in both fields, artificially increasing their correlation. A similar pattern is observed for AN4 and AC4. From both the correlation analysis and theoretical considerations, the 10 selected features are mutually independent, making them a suitable choice for constructing the machine learning models.
FIGURE 2
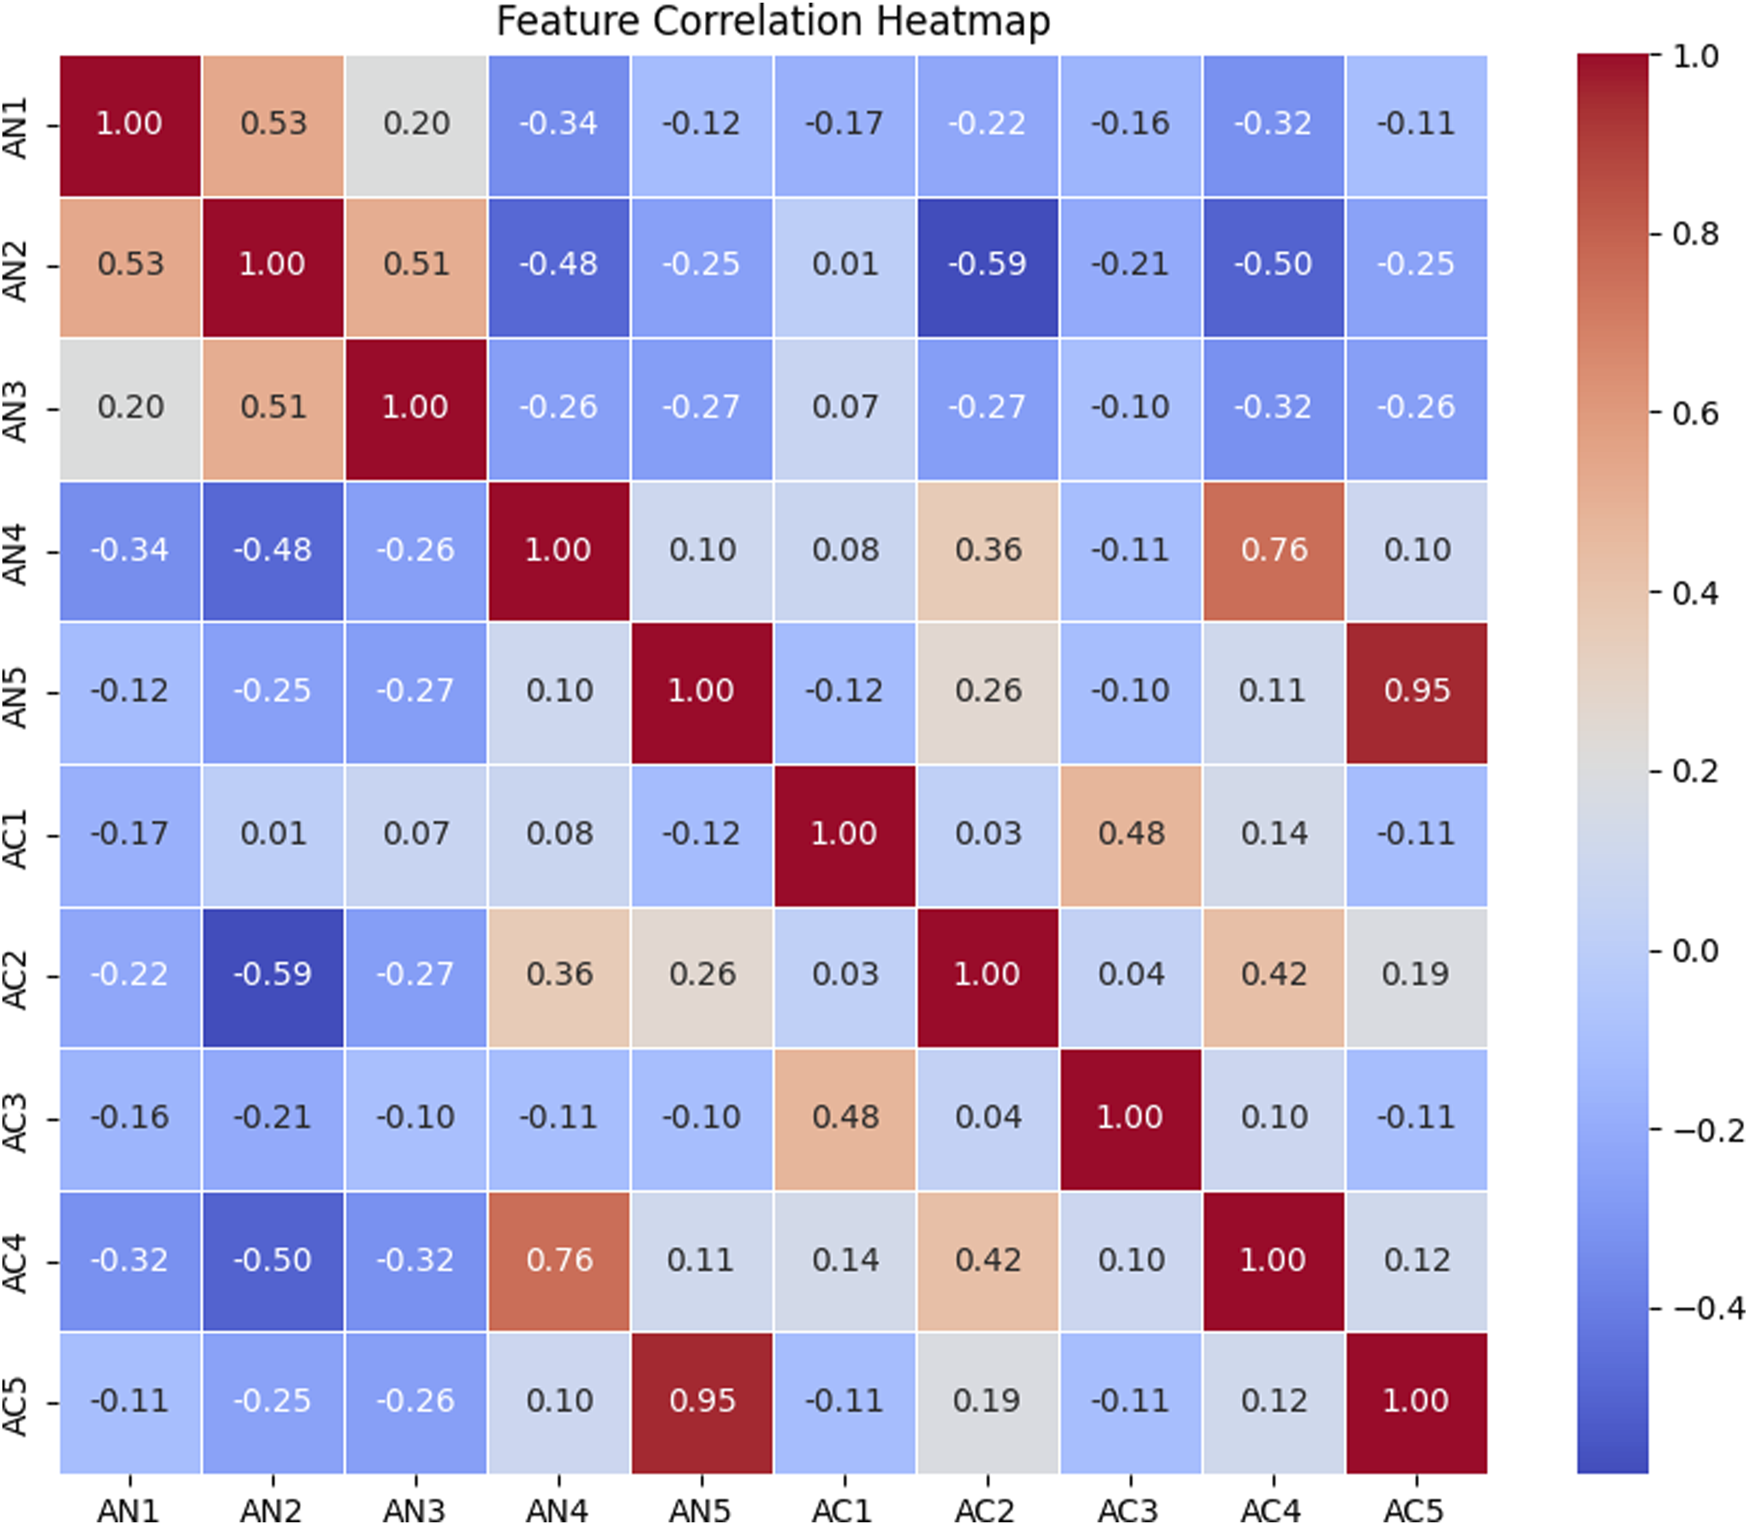
Feature correlation analysis.
The dataset, consisting of 110 samples, is split into a training set and a test set in a 93:7 ratio. This results in 102 samples in the training set and 8 samples in the test set. The advantage of selecting 102 training samples is that 102 is divisible by both 2 and 3, making it convenient for 2-fold or 3-fold cross-validation during model training. For the test set, 8 samples are selected from a relatively concentrated range of dielectric constant values, specifically between 20 and 40 where there are more data, ensuring a balanced evaluation of model performance within this range.
Three machine learning models are trained using Random Forest (RF), Gradient Boosting Regression (GBR), and Support Vector Regression (SVR), named Model R, Model G, and Model S, respectively. Grid search is employed to optimize the hyperparameters for each model.
For the RF model, the hyperparameter search ranges are:
Number of trees: [100, 150, 200, 250, 300]; Maximum depth of each tree: [None, 3, 5, 10, 15, 20]; Minimum number of samples required to split an internal node: [2, 3, 5, 10].
For the GBR model, the hyperparameter search ranges are:
Number of trees: [100, 150, 200, 250, 300]; Learning rate: [0.01, 0.1, 0.15, 0.2]; Maximum depth of each tree: [3, 5, 10, 20].
For the SVR model, the hyperparameter search ranges are:
Regularization parameter C: [0.1, 1, 10, 100]; Kernel coefficient gamma: [“scale”, “auto”, 0.01, 0.1, 1].
Based on the performance during training, 3-fold cross-validation is applied to RF and SVR models, while 2-fold cross-validation is used for the GBR model, further enhancing model robustness and generalization.
Through grid search, the optimal hyperparameters for the three models are determined, and their performance is evaluated and compared using R2 (Equation 6) and P (Equation 7) on the training set (Figures 3A,B). Model R exhibits the lowest R2 and P values among the three algorithms, indicating unsatisfactory performance. In contrast, Model G and Model S achieves comparable R2 values, both exceeding 0.6. However, when comparing P values, Model G demonstrates a stronger correlation with a value of 0.868, whereas Model S has a lower P value of only 0.798. While both Model G and Model S exhibits promising training performance, Model G proved to be superior. The optimal hyperparameters for this model are as follows: the number of trees is set to 100, the learning rate is 0.01, and the maximum depth is 5. The superior performance of Model G over Model S can be attributed to the fact that GBR model is a tree-based model that effectively captures nonlinear relationships in high-dimensional data. Although RF model is also a tree-based model, its performance on high-dimensional sparse data is inferior to that of GBR, as the latter demonstrates a stronger ability to capture complex relationships within the dataset. This advantage stems from GBR’s iterative optimization process, where each tree attempts to minimize the residuals of the previous tree. This stepwise refinement enables the model to better capture intricate patterns in the data, giving GBR a distinct advantage over RF and SVR.
FIGURE 3
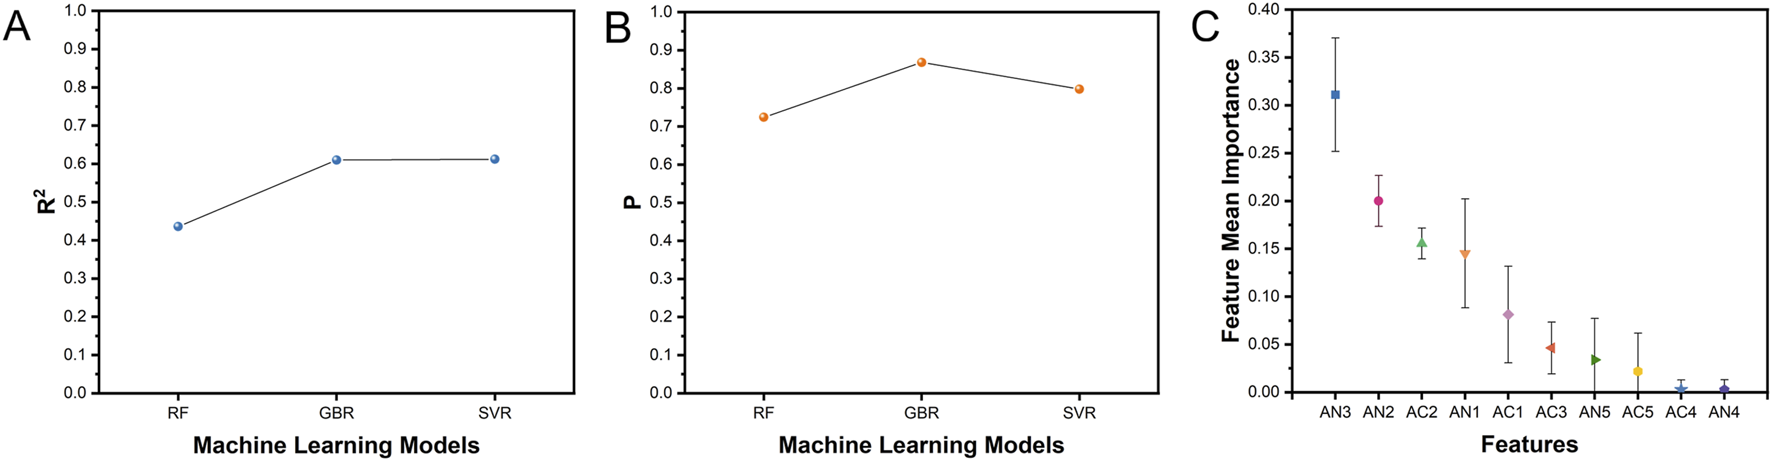
(A) Coefficients of determination for the three machine learning models; (B) Pearson correlation coefficients for the three machine learning models; (C) Feature importance analysis of Model G (GBR model).
Feature importance analysis is conducted on the optimal model, Model G. As shown in Figure 3C, AN3 and AN2 exhibits the highest feature importance, indicating that atoms with intermediate atomic numbers have a more significant impact on the dielectric constant. From a microscopic perspective, atoms with intermediate atomic numbers tend to have atomic radii comparable to that of strontium (atomic number 38). When an atom with a similar atomic radius replaces a strontium atom at a lattice site, the structural changes in the crystal lattice may be minimal, whereas the electronic structure of the crystal could undergo substantial alterations. Conversely, AN5, AC5, AC4, and AN4 demonstrates relatively low feature importance, likely due to the fact that many materials in the dataset do not contain a fourth or fifth type of atom, resulting in a limited amount of nonzero valid data for these features.
The three optimal models, Model R, Model G, and Model S, are evaluated using the test set. A scatter plot is generated with the actual values from the test set on the x-axis and the predicted values on the y-axis, and the results were compared against the y = x reference line (Figure 4). The actual dielectric constants in the test set ranges from 20 to 40, whereas some entries in the training set have significantly higher dielectric constants (>100). Due to this characteristic of the dataset, the models tend to slightly overestimate the dielectric constant. Among the three models, Model G demonstrates the highest reliability, with its predictions closely aligning with the actual values. The correlation coefficients between the predicted and actual values are calculated for each model, with Model G achieving the highest correlation coefficient of 0.78. The detailed comparison between the predicted values and the actual values for Model G is presented in Table 1. The test results indicate that Model G exhibits a certain level of generalization capability, making it a valuable tool for guiding the discovery and selection of strontium-containing dielectric materials.
FIGURE 4
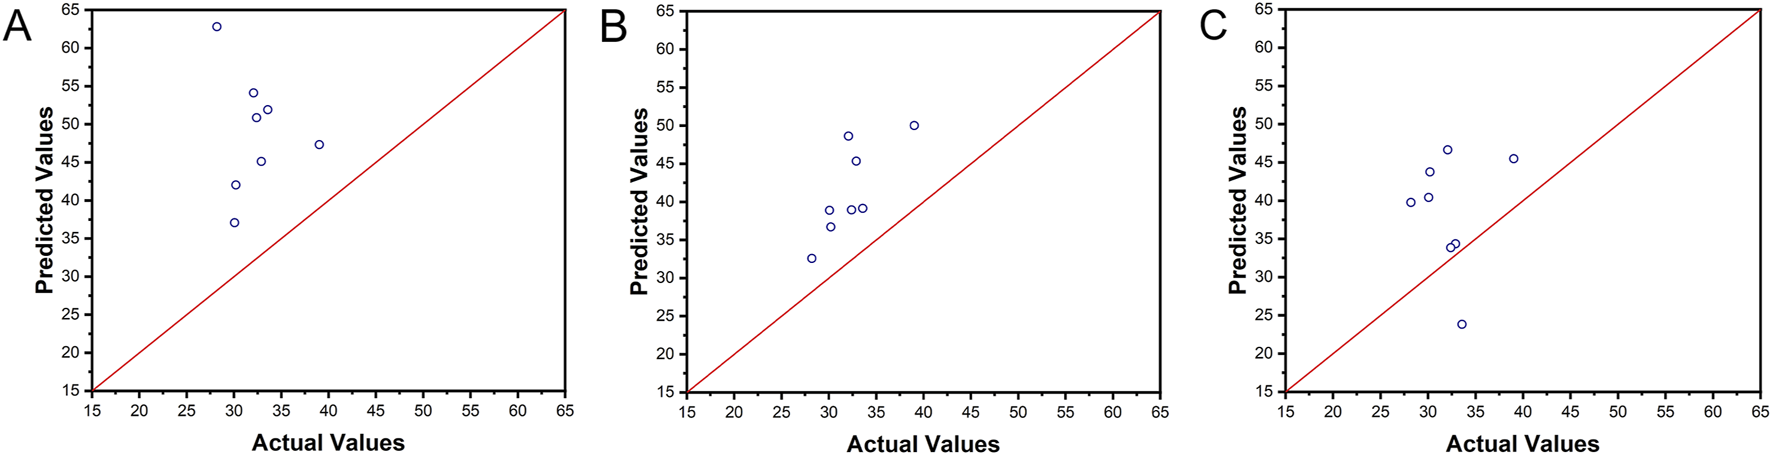
Comparison of predicted and actual values for the models: (A) Model R; (B) Model G; (C) Model S.
TABLE 1
| Materials | Dielectric constant | Predicted values |
|---|---|---|
| SrGaSnH | 39.01 | 50.00 |
| SrBiO3 | 33.58 | 39.14 |
| SrZrN2 | 32.89 | 45.32 |
| SrCaGe | 32.39 | 38.94 |
| SrCaSi | 32.06 | 48.62 |
| SrTiN2 | 30.2 | 36.72 |
| SrLaCrO4 | 30.06 | 38.87 |
| Sr3LiNbO6 | 28.2 | 32.57 |
Comparison between the predicted and actual values of Model G.
4 Conclusion
This study successfully established a machine learning model to explore the relationship between the atomic composition and dielectric constant of Sr-containing dielectric materials. Through K-fold cross-validation and hyperparameter tuning via grid search, the optimal machine learning model, Model G, based on gradient boosting regression, was obtained. Evaluation results on both the training and test sets indicate that Model G demonstrates high reliability and good generalization performance. This model can serve as a useful reference for discovering new strontium-containing dielectrics and the screening of existing materials. The study provides a promising new approach for investigating strontium-containing dielectric condensed matter. Future work could focus on expanding the size and quality of relevant databases and developing more sophisticated and accurate machine learning models to further advance this field.
Statements
Data availability statement
The raw data supporting the conclusions of this article will be made available by the authors, without undue reservation.
Author contributions
DH: Conceptualization, Methodology, Formal Analysis, Project administration, Investigation, Data curation, Writing – original draft, Writing – review and editing. JF: Investigation, Data curation, Writing – original draft, Writing – review and editing. CY: Investigation, Data curation, Writing – original draft, Writing – review and editing.
Funding
The author(s) declare that no financial support was received for the research and/or publication of this article.
Conflict of interest
Author JF was employed by Advanced Micro-Fabrication Equipment Inc.
The remaining authors declare that the research was conducted in the absence of any commercial or financial relationships that could be construed as a potential conflict of interest.
Generative AI statement
The author(s) declare that no Generative AI was used in the creation of this manuscript.
Publisher’s note
All claims expressed in this article are solely those of the authors and do not necessarily represent those of their affiliated organizations, or those of the publisher, the editors and the reviewers. Any product that may be evaluated in this article, or claim that may be made by its manufacturer, is not guaranteed or endorsed by the publisher.
References
1.
FlaviánDVolkovPAHayashidaSPovarovKGvasaliyaSChandraPet alDielectric relaxation by quantum critical magnons. Phys Rev Lett (2023) 130(21):216501. 10.1103/physrevlett.130.216501
2.
ZhanZLiYPantaleónPA. Designing band structures by patterned dielectric superlattices. Phys Rev B (2025) 111(4):045148. 10.1103/physrevb.111.045148
3.
SobolevYIAdamkiewiczWSiekMGrzybowskiBA. Charge mosaics on contact-electrified dielectrics result from polarity-inverting discharges. Nat Phys (2022) 18(11):1347–55. 10.1038/s41567-022-01714-9
4.
LuoW-ZShenZHShenYChenLQNanCW. Electrically variable interfaces in polymer nanocomposite dielectrics. Phys Rev B (2024) 109(18):184205. 10.1103/physrevb.109.184205
5.
WangXWangQQinTZhangGZhangHSangDet alImproved dielectric properties and grain boundary effect of phenanthrene under high pressure. Front Phys (2021) 9. 10.3389/fphy.2021.746915
6.
DaiKLiYYanYLiuZCuiAJiangKet alPhase diagram and structure evolution mechanism in ultrahigh energy storage NaNbO3-based superparaelectric relaxor ferroelectric ceramics. Phys Rev B (2024) 109(19):195204. 10.1103/physrevb.109.195204
7.
ZhouXWangLHuangDLiangYShiQYayingHet alSmart table tennis racket with tunable stiffness for diverse play styles and unconventional technique training. Adv Mater Tech (2021) 6(10):2100535. 10.1002/admt.202100535
8.
PhilippeAMSillCWestermannSAllgaierJStaropoliMMonkenbuschMet alQuantifying structure and dynamics of bound and bulk polymer in tailor-made rubber-silica nanocomposites. Front Phys (2022) 10. 10.3389/fphy.2022.1023234
9.
LiangYHuangDZhouXWangZShiQHongYet alEfficient electrorheological Technology for materials, energy, and mechanical engineering: from mechanisms to applications. Engineering (2023) 24(5):151–71. 10.1016/j.eng.2022.01.014
10.
BazantMZSquiresTM. Induced-charge electrokinetic phenomena: theory and microfluidic applications. Phys Rev Lett (2004) 92(6):066101. 10.1103/physrevlett.92.066101
11.
HuoXYossifonG. Tunable electrorheological fluid microfluidic rectifier: irreversibility of viscous flow due to spatial asymmetry induced memory effects. Phys Rev Lett (2019) 123(19):194502. 10.1103/physrevlett.123.194502
12.
ShiYAskounisEPlamthottamRLibbyTPengZYoussefKet alA processable, high-performance dielectric elastomer and multilayering process. Science (2022) 377:228–32. 10.1126/science.abn0099
13.
HuangDMaJHanYXueCZhangMWenWet alArtificial intelligence artificial muscle of dielectric elastomers. Mater and Des (2025) 251: 113691. 10.1016/j.matdes.2025.113691
14.
PaiY-YTylan-TylerAIrvinPLevyJ. Physics of SrTiO3-based heterostructures and nanostructures: a review. Rep Prog Phys (2018) 81(3):036503. 10.1088/1361-6633/aa892d
15.
LiXQiuTZhangJBaldiniELuJRappeAMet alTerahertz field-induced ferroelectricity in quantum paraelectric SrTiO3. Science (2019) 364(6445):1079–82. 10.1126/science.aaw4913
16.
TanF-HZhangQMWeiFZhaoHBZhangXDuJ. Dielectric and energy storage properties of PbO–SrO–Nb2O5–Na2O–Si thin films by annealing. Rare Met (2018) 43(1):351–5. 10.1007/s12598-018-1134-7
17.
HuZZhangCLiYAoB. First-principles study of structural, electronic, optical and bonding properties of celestine, SrSO4. Solid State Commun (2013) 158:5–8. 10.1016/j.ssc.2012.05.030
18.
ChenJZhangZGuoYRobertsonJ. Schottky barrier heights of defect-free metal/ZnO, CdO, MgO, and SrO interfaces. J Appl Phys (2021) 129(17). 10.1063/5.0047447
19.
JainAOngSPHautierGChenWRichardsWDDacekSet alCommentary: the Materials Project: a materials genome approach to accelerating materials innovation. APL Mater (2013) 1(1):011002. 10.1063/1.4812323
20.
PedregosaFVaroquauxGGramfortAMichelVThirionBGriselOet alScikit-learn: machine learning in Python. J Machine Learn Res (2011) 12:2825–30.
Summary
Keywords
dielectrics, strontium, dielectric constant, machine learning, electronic structure
Citation
Huang D, Fu J and Yu C (2025) Machine learning discovery of the dielectric properties of strontium-containing condensed matter. Front. Phys. 13:1599182. doi: 10.3389/fphy.2025.1599182
Received
24 March 2025
Accepted
16 June 2025
Published
25 June 2025
Volume
13 - 2025
Edited by
Jerzy Sadowski, Brookhaven National Laboratory (DOE), United States
Reviewed by
Hu Xuchong, Hong Kong University of Science and Technology, Hong Kong SAR, China
Övgü Ceyda Yelgel, Recep Tayyip Erdoğan University, Türkiye
Updates
Copyright
© 2025 Huang, Fu and Yu.
This is an open-access article distributed under the terms of the Creative Commons Attribution License (CC BY). The use, distribution or reproduction in other forums is permitted, provided the original author(s) and the copyright owner(s) are credited and that the original publication in this journal is cited, in accordance with accepted academic practice. No use, distribution or reproduction is permitted which does not comply with these terms.
*Correspondence: Dongyang Huang, huang_dongyang@shu.edu.cn
Disclaimer
All claims expressed in this article are solely those of the authors and do not necessarily represent those of their affiliated organizations, or those of the publisher, the editors and the reviewers. Any product that may be evaluated in this article or claim that may be made by its manufacturer is not guaranteed or endorsed by the publisher.