- 1Université Paris-Saclay, CNRS, CentraleSupélec, Laboratoire EM2C, Gif-sur-Yvette, France
- 2Synchrotron Soleil, l’Orme des Merisiers, Saint-Aubin, France
This paper is devoted to improving the accuracy of the calibration method employed for femtosecond Two-photon Absorption Laser-Induced Fluorescence (fs-TALIF) diagnostics operating in a high laser intensity regime, i.e., TW.cm-2. Due to the extreme instantaneous intensity and mode-locked laser features, the fluorescence signal depends not only on the populations of the ground and excited states of the probed atomic radical, but also on phenomena such as Stark detuning and coherent excitation. Rate equations are no longer valid and therefore, the calibration is performed here using a source of the same atomic species of interest with a known absolute density. For atomic nitrogen, the reference source is based on a homogenous, steady-state DC plasma. Its absolute density is measured in specific operating conditions by Vacuum UltraViolet (VUV) absorption spectroscopy using a high-resolution Fourier Transform Spectrometer (FTS). The uncertainty of nitrogen density measured via VUV absorption was found to be less than 20% when selecting non-saturated absorption lines and plasmas with negligible molecular absorption background. The detection limit and accuracy for nitrogen density using fs-TALIF in a high laser intensity regime were determined to be 1012 cm-3 and 25%, respectively, which represents a significant improvement over the quadratic regime method using conventional noble gas calibration. The fluorescence calibration was proven for plasma conditions with pressure and nitrogen density varying by about one order of magnitude and was found to be quench-free. The laser spectral profile was Fourier-limited and the two-photon absorption profile was dominated by the laser broadening mechanism. Comparison of two femtosecond systems sharing the same laser pump, detection, beam waist and laser power showed an important difference in fluorescence yields. This was attributed to spectral dispersion affecting the temporal laser intensity profiles, which consequently altered the two-photon absorption probability.
1 Introduction
Two-photons Absorption Laser Induced Fluorescence is an established diagnostic for the detection and quantification of atomic species such as, N, O, H, C, F in a large variety of plasmas [1–12]. This technique can also be employed to measure gas temperatures. For example, the gas temperature in hydrogen microplasmas based on the analysis of the fluorescence decay time is evaluated in [13]. Among the key advantages of TALIF we can cite the high spatial and temporal resolutions, which are limited by the laser pulse duration (down to
The quantification of atomic species can be obtained by different calibration methods. In most experiments, the laser intensity is relatively low (commonly below 1 GW cm-2) and the spontaneous emission and the quenching are the dominant relaxation processes of the resonantly excited state. Complete calibration of the detection chain coupled to calculated or measured atomic cross-sections was gradually replaced by titration methods and by calibrations with noble gases [1, 2]. Recent reviews on TALIF that describe methods and their limitations can be found in the literature [3, 14]. The accuracy of the diagnostic is limited by the uncertainty of the spectroscopic data, in particular the two-photon absorption cross-section ratios, known in literature with
Classically, employing nanosecond pulsed lasers, the TALIF is performed in the non-depletion regime (i.e., negligible depopulation of the ground state by the two-photon absorption) for a three-level system, based on:
with
Behind its apparent simplicity, this relation hides complex notions and applies only in limited cases. The first limitation inherent to this relation comes from the quadratic dependence between the number of fluorescent atoms and the photon flux. This is true if two criteria are valid: i) the laser excitation time is much shorter than the inverse of the rate of two-photon absorption, so no significant depopulation of the ground state occurs and ii) the quenching and spontaneous emission are dominant over all other laser-induced loss processes of the excited state [14]. An obvious consequence of these statements is the need to determine the quenching rates affecting the population of the excited state, that depends on the plasma collider densities and temperatures, which can change temporally and spatially. The quenching rates can be measured by analysing the fluorescence decay time in the non-depletion regime. However, it may be highly time-consuming and as pressure becomes close to atmospheric pressure or higher, fluorescence decay times can be hundreds of ps or even shorter. The measurement of fluorescence evolution in this case is challenging even for streak camera systems. Another requirement is the need to ensure that both saturation and photolytic processes are avoided, considering their antagonist effects (see §3.3 of 14). Secondly, it should be noted that the two-photon absorption cross-section of Equation 1 is a limit value in the stationary regime reached after the laser perturbation [15, 16]. The process of fluorescence following two-photon absorption is governed by the modification of both the population of ground and excited states and of the coherences between these energy levels, as described by Bloch equations for pulsed lasers [17]. It is a time-dependent response and the validity of the concept of cross-section relies on both the laser intensity and on the strength of decoherent processes (e.g., Doppler effect, quenching, laser random phase fluctuations). When using ps and especially fs lasers, the validity of (1) can be questioned. Eagles et al. [18, 19] determined that coherences are damped when the sum of the line widths of the laser and of the absorption line spectral profile (including collisions, Stark and Doppler broadening) are larger than the Rabi frequency and the inverse of the laser pulse duration (
Nowadays, based on commercially available ultrashort lasers, ps- and fs-TALIF were applied to measure atomic radicals in reactive environments such as combustion and plasmas. Photolytic-free was proven to be a key advantage of fs-TALIF. The fluorescence signal can become independent of the photolysis of molecules present in plasmas since the proportion of atoms produced additionally decreases linearly with the laser pulse duration (e.g., see criterion given in Stancu, 2020). The photolytic-free feature was experimentally demonstrated by Kulatilaka et al. [24]. Also, as photoionization and stimulated emission become the dominant depopulation processes compared to spontaneous and quenching phenomena (i.e., criterion ii) is not valid), the fluorescence signal becomes quench-free, i.e., independent of the local plasma properties other than the density of the probed species at the moment of laser perturbation. However, as already mentioned, coherent processes leading to Rabi oscillations and also Stark shifts are important. The strong EM laser field detunes the energy of the two-photon transitions and consequently changes the two-photon absorption probabilities.
To overcome the challenges of the high-intensity fs-TALIF regime and avoid the description of the time dependent Stark detuning and Rabi oscillations, it was suggested in Dumitrache et al [25] to perform the fluorescence calibration using a source of known density of the same reactive atom as the probed one, here atomic nitrogen. A DC discharge characterised by VUV absorption spectroscopy is used to serve as a calibration cell. Since the fluorescence becomes dependent only on the laser characteristics, the probed atom spectroscopic properties and its ground state density, the calibration reduces to a factor that only depends on the ratio of fluorescence signals in the cell,
with
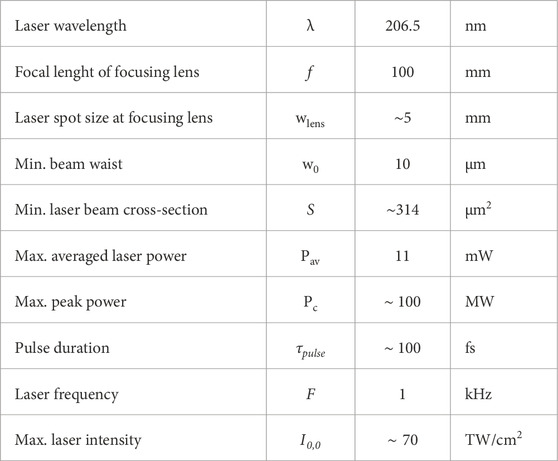
In this article by focusing a 100-fs laser we applied TALIF to detect atomic nitrogen at laser intensities up to tens of TW.cm-2. Three key aspects of fs-TALIF were addressed. We provide a validation of fs-TALIF calibration by VUV-absorption over a range of pressure and N densities of about an order of magnitude for the high laser intensity regime (e.g., TW.cm-2), improve the accuracy of the VUV-calibrated method by analysing unsaturated absorption lines of N at high spectral resolution (e.g., 0.27 cm-1) and evidence the photon statistics importance on the fs-TALIF signals. In Section 2, the DC calibration cell as well as the methods and setups for fs-TALIF operated in the high intensity regime are described. In Section 3, the plasma characterization by VUV absorption is performed and the accuracy of fs-TALIF calibration procedure is determined. This is followed by discussions on the fluorescence yield comparison using two fs laser systems and the conclusions in Section 4.
2 Setups and methods
2.1 DC discharge cell
A calibration DC discharge cell is designed to produce a stable and homogeneous plasma for accurate VUV absorption spectroscopy and fs-TALIF, see picture and schematic in Figure 1. It consists of a quartz cross-shaped cell with asymmetric branches. One branch is a 15 cm long cylinder in which a plasma length of about 10 cm is created by two electrodes inserted perpendicular to the branch. UV laser light at ∼206 nm passes through two MgF2 windows attached to this branch to perform TALIF measurements. The laser induced fluorescence is collected in the perpendicular direction, through the second branch which is a 9 cm long cylinder. The plasma remains confined in the first branch and does not expand into the second cylinder. The same cell is also used to perform VUV absorption measurements at ∼120 nm. The VUV light generated by the SOLEIL synchrotron has a rectangular cross-section of 5 × 2 mm2. Both branches are equipped with 1 mm thick MgF2 windows to maximize the transmission of the VUV and UV beams.

Figure 1. (a) DC discharge cell pictures without and with plasma, (b) DC-cell scheme with crossing laser beams for VUV-absorption beam at 120 nm and TALIF at 206.5 nm, and fluorescence detection at 742-746 nm and cold traps positions in the setup of the Soleil chamber only.
Performing VUV absorption in the branch that is orthogonal to the plasma column has two advantages, namely, the short plasma absorption length (i.e.,1.5 cm) reduces the saturation conditions for the atomic nitrogen absorption lines and improves the spatial overlapping of the TALIF and VUV absorption measurements. In Dumitrache et al [25], a similar DC calibration cell was employed, however with the VUV absorption performed along the 15 cm branch that enhanced line saturations. Their analysis of the spatial dependence of the fluorescence demonstrated a good homogeneity of the atomic nitrogen density along the axial and radial directions in the DC discharge. In the present conditions, the VUV absorption measurement gives the line-of-sight averaged N density (i.e., along the discharge diameter), while the fs-TALIF measurement gives the density at the center radial position. Based on the uniform fluorescence radial profile measured by Dumitrache et al., we estimated an error of
High purity nitrogen and argon gases are mixed ahead of the cell at flow rates in the range 50
The discharge was operated in Ar:N2 mixtures with dilution factors from 100 to 4,000. The pressure ranged from 1 to 8.9 mbar, the current varied from 1 to 5 mA, and the corresponding voltages changed from 400 to 500 V. In the vacuum chamber of the DESIRS beamline at SOLEIL, the cell was actively cooled by water circulating in a copper pipe placed on the outside surface of the DC cell and close to electrodes. Impurities that deposit on the cell windows over time (carbon contamination) and lower the transmitted VUV beam intensity were significantly reduced by using cold liquid nitrogen traps next to the MgF2 windows.
2.2 Fs-TALIF setup and laser characterization
The fs-laser chain consists of several modules which are represented in Figure 2. The first system (SOLSTICE ACE, Spectra Physics) amplifies a mode-locked Ti:Sapphire laser, generating pulses of about 100-fs at 780–820 nm, at 1 kHz pulse repetition frequency, with a 5.2 W average power and a linear polarization beam output. It includes a mode-locked oscillator, a pulse stretcher, a regenerative amplifier coupled to a Q-switched pump laser and a pulse compressor. The fourth harmonic at 206.5 nm (N), with up to 20 µJ per pulse, is generated for most of the experiments by an OPA (TOPAS-Prime, Light Conversion) coupled to a HE-NIR UVIS-DUV module providing a semi-automated change of wavelength in the range 190–2,600 nm. For fluorescence yield comparisons, 3rd and 4th harmonic modules from Spectra Physics were directedly coupled to SOLSTICE ACE system.
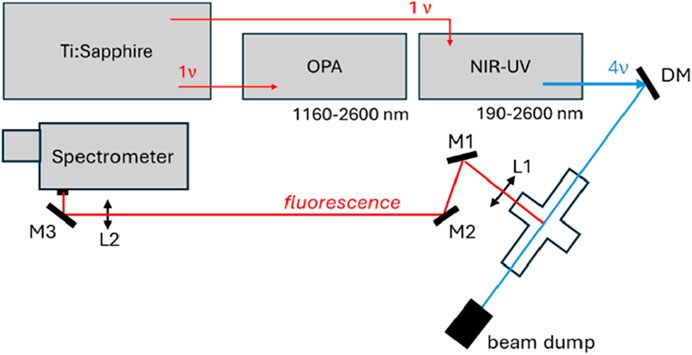
Figure 2. Fs-TALIF setup including laser modules, DC discharge cell and spectrometer detector (OPA = Optical Parametric Amplifier, DM = Dichroic Mirror for 206 nm, L = lens, M = Mirror).
Accurate knowledge of the beam waist profile is necessary to determine the laser intensity (W.cm2), which governs the rates of laser induced processes. In this work, the laser is focused with a 10 cm focal length and reaches a minimum beam waist radius (1/e2) of 10 μm at λlaser = 206.5 nm, measured using the knife-edge method. In this method, the laser beam is transversely cut with a micrometre slit and the transmitted power
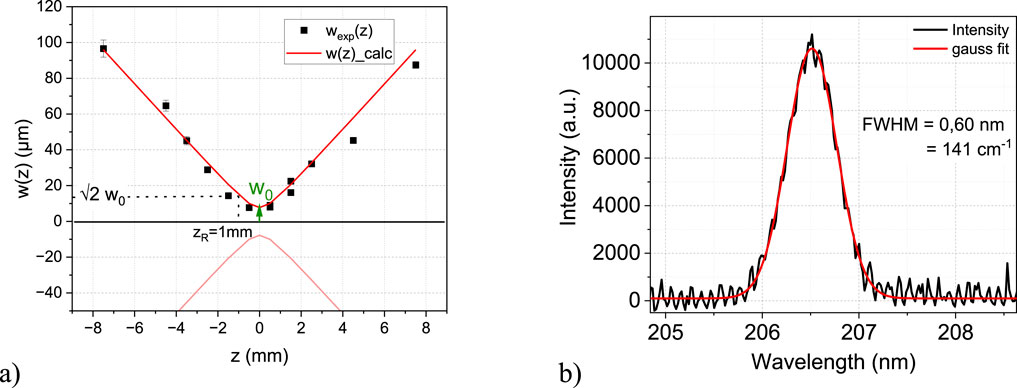
Figure 3. (a) Laser beam waist function of axial position showing a minimum radius w0 = 10 µm (1/e2) and M2 = 1.5. (b) The laser spectral profile fited with a gaussian function presenting a FWHM 0.6 nm (i.e. 141 cm-1).
Figure 3b illustrates the laser spectral profile centered at 206.5 nm. This was measured using an optical fibre coupled to a Isoplane-SCT320 spectrometer. After instrumental function deconvolution, the spectral full width at half maximum at 206.5 nm is found about 0.6 nm (i.e., 141 cm-1), which is a few orders of magnitude larger than for usual nanoseconds lasers (e.g.,
The broad spectral feature of fs lasers offers the possibility to excite several energy levels or species. Figure 4 shows as an example the energy level diagram of atomic nitrogen for fs-TALIF used in this work. It should be noted that levels 3p 2Do3/2 and 3p 2Do5/2 comply also with the selection rules for two-photon absorption and they are only 36.84 cm-1 and 113.21 cm-1 away from level 3p 4So3/2, and therefore excited as well by a fs-laser centred at about 206.5 nm. Though, the importance of levels 3p 2Do3/2 and 3p 2Do5/2 on the TALIF signal is expected to be negligible, since Einstein coefficients from 3p 2Do3/2 to states 3s 4P3/2 at 742.194 nm and 3s 4P 5/2 at 744.781 nm are two to three orders of magnitude lower than for fluorescence from the 3p 4So3/2 state, fluorescence channels from 3p 2Do5/2 do not overlap spectrally with those from 3p 4So3/2 as detailed in Table 2 and the corresponding two-photon absorption cross-sections are expected to be smaller.
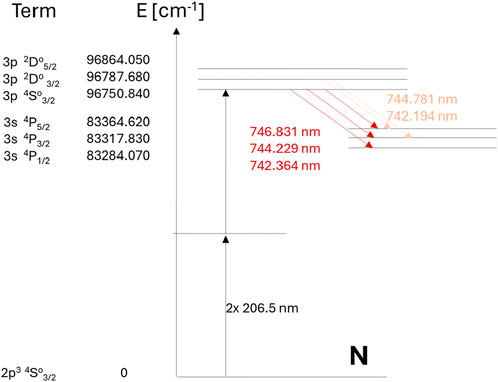
Figure 4. Simplified energy diagram of atomic nitrogen for fs-TALIF at 206.5 nm, showing additional fluorescence close channels at 742.194 and 744.781 nm.
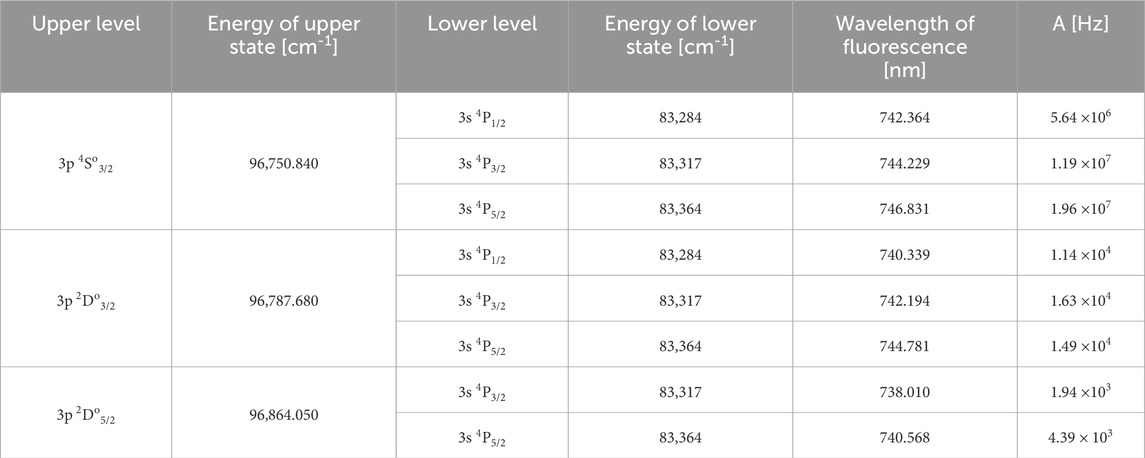
Table 2. Atomic nitrogen excited states accessible by femtosecond two-photon absorption at 206.5 nm and corresponding fluorescence channels in the range 738
Figure 5 represents the laser two-photon absorption spectral profile
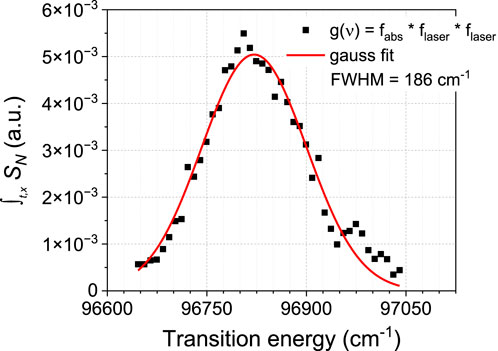
Figure 5. Nitrogen two-photon absorption spectral profile as function of the transition energy with a gaussian fit at laser intensity 20 TW cm-2, showing a FWHM of 186 cm-1.
The fluorescence detection system consists of a SpectraPro 500i spectrometer coupled to an ICCD camera (PIMAX I - Gen II). Fluorescence light is collimated by a 10 cm focal lens and focused into the spectrometer by a 20 cm focal lens, ensuring a magnification of a factor 2. The spectrometer slit is set to 500 µm to optimise the signal to noise ratio, leading to a spatial resolution of 250 µm in the axial direction of to the laser beam. With a grating of 1,200 grooves/mm, the spectral resolution for fluorescence signal is limited at 0.51 nm. The camera gate is set to 100 ns to cover the full duration of the fluorescence signal and the laser jitter (>10 ns). Signal synchronisation is ensured by a BNC 577 delay generator. The fs-TALIF calibration is performed at laser intensities above 1012 W cm-2, with the fluorescence collection volume perpendicular to the laser propagation and located at the minimum beam waist.
2.3 SOLEIL VUV absorption spectroscopy setup
The DESIRS beamline of the SOLEIL synchrotron facility provides VUV light beams in the spectral domain 5–40 eV (31–248 nm) [26, 27]. To measure the density of ground state atomic nitrogen, Fourier Transform spectra in the range 111–136 nm (73,507–89,834 cm-1), with typical spectral resolution 0.27 cm-1, were recorded. An averaged spectral window is acquired in about 20 min. A typical example of VUV transmission spectrum for atomic nitrogen is presented in Figure 6a (raw) and b) (cropped and baseline corrected). The interferograms are extended 4 times with zeros (zero-padding), in order to have a 4-fold decrease in the energy scale interval and a better description of the instrumental function shape.

Figure 6. Typical VUV absorption spectra: (a) full spectral range showing N lines (red frame), and residuals (Kr from a filter and H Lyman-α lines), (b) normalised N transmission lines, (c) recorded FTS instrumental function corresponding to 0.27 cm-1 resolution.
The atomic nitrogen density (
The instrumental function of the FTS applied in (3) is recorded simultaneously using a HeNe laser that shares the path of the VUV beam (Figure 6c) [28]. From the Beer-Lambert law,
with
From the above relations, the fitting parameters for the transmission spectrum are the density of atomic nitrogen

Table 3. Spectroscopic characteristics of three VUV transitions for atomic nitrogen detection employed here.
The accuracy of the measurement is dependent on the absorption percentage and the evaluation of the spectrum baseline. If the absorption line is not saturated, the area of the transmission spectrum can be used to determine the atomic density. The peak absorption can be used to improve the accuracy of the fitting. In the case of saturated absorption lines, the fitting relies only on the line wings. Figure 7 shows that in our experimental conditions, three experimental data points describe the nitrogen absorption line at a spectral resolution of 0.27 cm-1. The interpolated data points were computed based on the measured instrumental function. Note that the spectral window corresponding to the line width is less than 0.5 cm-1. Attempts to increase the spectral resolution by reducing the instrumental function from 0.27 to 0.1 cm-1 were unsuccessful. In practice, the increase of spectral resolution had not improved the quality of the data as the signal to noise ratio was degraded. We should note that the absorption broadening is comparable here with the instrumental broadening. Thus, for saturated lines, because of the limited spectral resolution, the density evaluated from the wings has a significantly lower accuracy compared to the unsaturated conditions.
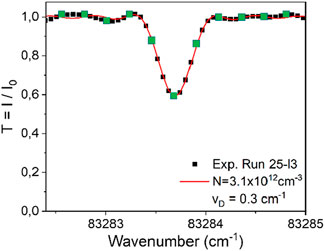
Figure 7. Sample of N transmitted FTS illustrating experimental data points (green large squares) and interpolation points (black small squares) obtained after interferogram treatment. N density coresponds to 3.1 × 1012 cm-3 and the fit (red curve) to 0.3 cm-1 for Doppler contribution.
In this work, a range of experimental conditions of the DC plasma cell with at least one unsaturated line of atomic nitrogen out of the three was obtained. Within some of these experiments the high intensity fs-TALIF signals were sufficiently intense to perform absolute measurements. In addition, using enhanced dilution of nitrogen in argon (up to ratio of 4,000), it was ensured a negligible level of broadband absorption due to molecular nitrogen, that could affect the signal baseline.
3 Results
3.1 Nitrogen density accuracy for unsaturated VUV absorption
The complete set of VUV absorption measurements performed here is detailed in Table 4. Ar:N2 ratio, pressure and discharge current were varied in the range of 100–4,000, 1–8.9 mbar, 2–5 mA, respectively. The instrumental resolution was kept to 0.27 cm-1 except for one data set for which it was degraded to 0.54 cm-1. Nitrogen densities in the range of 3 × 10¹² to 1.7 × 1013 cm-3 were obtained for these conditions.
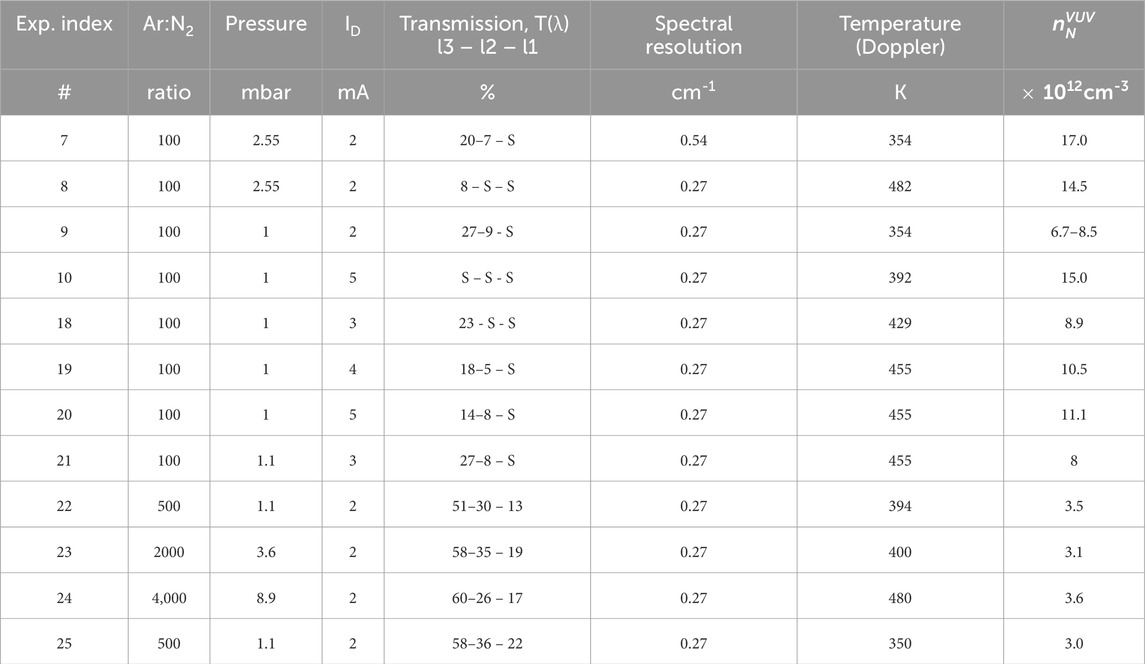
Table 4. Complete set of nitrogen VUV absorption measurements. Only absorption lines with T(λ) > 8% (far from saturation) are considered for density evaluation (S: saturation, lines: L3-L2-L1).
Figure 8 gives an example of the experimental and fitted transmission spectra for the three lines of N in the DC plasma cell operated at 1.1 mbar, 2 mA with gas mixing ratio 500:1 (Ar:N2). According to the fits, the atomic nitrogen density is found 3.0 (±0.1) × 1012 cm-3 and the Doppler broadening FWHM is obtained as 0.3 (±0.01) cm-1 which corresponds to 350 K. It should be noted that the Doppler and collisional widths are fitting parameters in transmission spectrum simulations. As mentioned, for unsaturated lines the density accuracy is determined by the evaluation precision of the transmission spectral area. Because the fitting results from a multiple convolution process with comparable contributions, temperature values are expected to be less accurate than densities.

Figure 8. Experimental and fitted transmission spectra at 1.1 mbar and 2 mA, gas mixture Ar:N2 = 500:1. Corresponding N densities are between 2.9 to 3.1
The present experiment was designed to improve the accuracy of VUV calibration compared to our previous work [25]. The data accuracy depends on various factors: the plasma repeatability, the flowmeter and effective absorption length precisions, iv) the noise level and spectral resolution of the FTS signal (estimated from analysing the results obtained by independently fitting the three lines for cases far from saturation) and the accuracy of the VUV cross-sections (oscillator strengths). The uncertainty on the plasma repeatability is obtained statistically, by repeating identical measurement conditions (cases 7/8, 18/21 and 22/25). This is estimated to about 15% and it includes uncertainty on the gas temperature, pressure, gas flows and discharge current. The uncertainty on the FTS signal comes from the limited spectral resolution and the noise of the 20 interferograms that are averaged before being processed into a single transmission spectrum. It is estimated by deriving the standard deviation

Table 5. Nitrogen density uncertainties for VUV absorption due to FTS procedure. Independent fitting of N absorption lines from Table 3 were used as labelled. Only cases for which at least two absorption lines have a transmission above 20% were selected.
The fit sensitivity on the gas temperature (i.e., gaussian contribution from 300 to 600 K) for an absorption line close to saturation (T(λ)
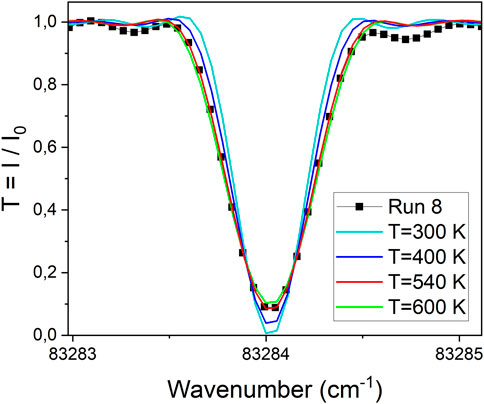
Figure 9. Transmission spectrum fitted with different Doppler contributions. Best fits correspond to 540 K and 600 K.
The present nitrogen density uncertainty (
3.2 Fs-TALIF calibration by VUV absorption at high laser intensities
As mentioned, fs-TALIF calibration is performed here in the high laser intensity range, where quenching and radiative emission rates are negligible compared to photoionization and stimulated emission rates. According to [25], for laser intensities in the range 6 × 10¹¹ to 6 × 10¹² W cm-2, the intensity of the integrated fluorescence signal, is proportional to Ilaser0.95, thus far from the quadratic regime. In the present work, as illustrated in Figure 10a), we perform the TALIF measurements at even higher intensities, in the range 8 × 10¹² to 3 × 10¹³ W cm-2, which includes the reference calibration intensity Ical = 20 TW cm-2. The fluorescence signal is found to be proportional to Ilaser0.76. Note that a lower exponent is expected because the probability of absorption and ionisation, and the Stark detuning increase even more at higher intensities.
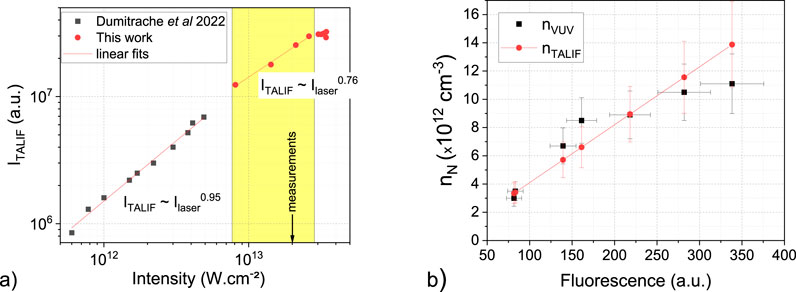
Figure 10. (a) Nitrogen space and time integrated fluorescence signal as a function of laser intensity in the range
To assess the accuracy of fs-TALIF calibrated by VUV absorption, the experiments were performed for a range of plasma working conditions covering nearly an order of magnitude of pressure and atomic nitrogen densities. The operating conditions that enable both unsaturated VUV absorption spectroscopy and fs-TALIF are detailed in Table 6. To vary the density of N, three parameters were changed, namely, the gas mixture (Ar:N2 ratio), the pressure
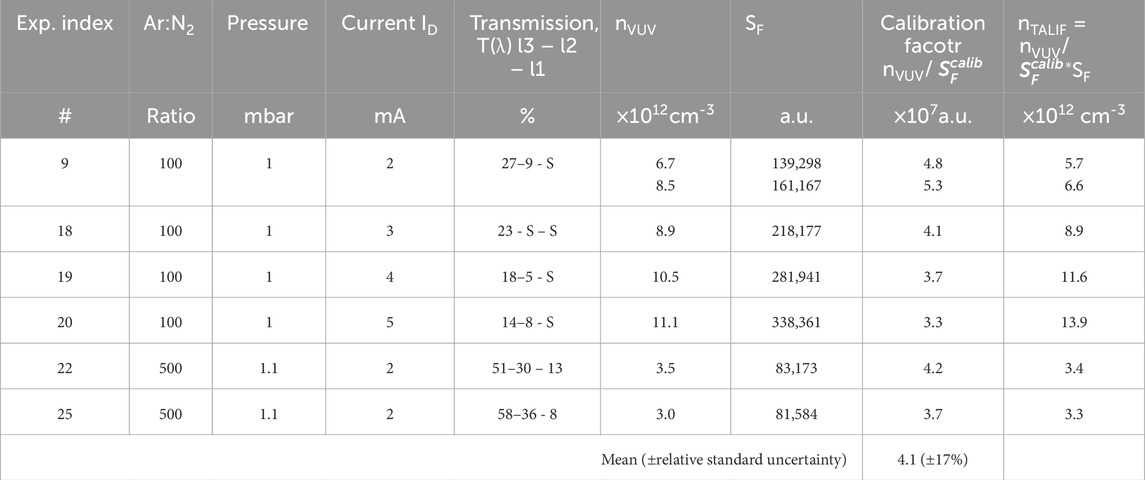
Table 6. Summary of VUV absorption and fluorescence data corresponding to Figure 10b (S: saturation, SF: fluorescence signal).
Figure 10b compares the density obtained directly by VUV absorption for all cases of Table 6 (black square) and the density obtained by calibrated fs-TALIF (red circles). It appears that the calibration method is valid and independent on quenching within uncertainties. It should be noted that the quenching rate is expected to vary significantly in the range of our experimental conditions, e.g., a factor 9 due to the pressure changes. Assuming molecular nitrogen as main collider (see Dumitrache et al. Table 2), the quenching rate is estimated as 0.9 × 10⁷ Hz for 8.9 mbar, which is comparable to the radiative rate (i.e. 3.3 × 10⁷ Hz). However, both values are very small compared for example, to the ionisation rate (
The total uncertainty for nitrogen density measured by fs-TALIF with VUV calibration is estimated here to be at most 25% (accounting for 17% statistical uncertainty on the calibration factor and for less than 20% uncertainty on the density by VUV absorption as mentioned before). This value is significantly better than that of conventional nanosecond TALIF calibration using krypton gas, where the cross-section ratio is known within 50% [1, 2] and the quenching can highly increase the total uncertainty, especially at high pressure.
Furthermore, the sensitivity of high-intensity fs-TALIF appears more than an order of magnitude higher than for the quadratic regime. Here, nitrogen densities down to 1012 cm-3 could be measured, whereas with the present set-up in the quadratic regime no fluorescence signal could be recorded even at a nitrogen density of 1013 cm-3. Therefore, it was impossible to compare the VUV absorption calibration with the classical calibration using krypton gas. A direct comparison could be interesting for the evaluation of the cross-section ratio by femtosecond laser excitation. As shown recently in [31], this ratio can be very different from that obtained with nanosecond excitation, a topic that deserves further investigation. It should be noted that the characterisation of N radicals in plasma etalons can be performed using other VUV sources and adequate spectrometers, or other diagnostic techniques, such as titration. Here, the increased accuracy comes from the high resolution of the VUV spectrometer and the high VUV fluence specific to synchrotron radiation.
3.3 Comparison of fluorescence yield using two fs laser systems
The fluorescence signal following nitrogen two-photon absorption was acquired with two femtosecond laser configurations as shown in Figure 11. As mentioned in Section 2.2, both systems share the same Ti:Sapphire laser. The first configuration named here 4th hamonic laser uses a tripler and a quadrupler modules from Spectra Physics and allows tuning the laser wavelength in the range 204
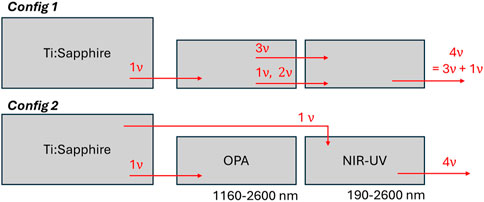
Figure 11. Two fs-laser configuration setups. Configuration 1 uses a tripler and a quadrupler modules from Spectra Physics. Configuration 2 consists of an OPA and a NIR-UV modules from Light Conversion.
In Figure 12 nitrogen fluorescence signals recorded at 742–746 nm for both configurations and three experimental conditions are presented. For each of the DC plasma runs, the laser wavelength, beam waist and power, as well as the detection optics and the acquisition settings were kept the same. As in experiments shown in Figure 5, when using the 4th harmonic configuration, the laser wavelength was also adjusted to reach maximum fluorescence. The beam profile was measured by the knife-edge method and the laser current was adjusted. The same laser intensity and fluorescence collection volume were chosen for both configurations. We can note that the fluorescence intensity acquired with the 4th harmonic laser configuration is systematically higher. A fluorescence yield of a factor 3.5 larger compared to OPA laser configuration is assessed.

Figure 12. Nitrogen fluorescence intensity comparison for the two laser configurations illustrated in Figure 11 under three plasma conditions.
This observation most probably reveals the effect of laser dispersion through the multiple optics chain and consequently the photon statistics role on the probability of the two-photon absorption. Multi-photon processes such as TALIF are highly dependent on the temporal profile of the laser pulse intensity
It should be noted that the two-photon absorption rate is also proportional to the laser two-photon absorption spectral profile (
4 Conclusion
In this article, we proposed an improved fs-TALIF calibration for atomic nitrogen detection using a 100-fs laser at 20-TWcm-2. A DC plasma-based atomic nitrogen reference source was accurately characterized by VUV absorption spectroscopy. Key advantage of this calibration includes its simplicity and increased accuracy. Here, a single calibration constant is evaluated, whereas conventional calibration using Kr gas would require a complex density-matrix description at the high-intensity laser regime. The high intensity fs regime used here was found to be quench-free and with more than an order of magnitude increase in sensitivity compared to the quadratic regime.
The calibration nitrogen source employed was a steady state, homogenous DC discharge, in a Ar:N2 mixtures, characterized by VUV absorption at
The laser spatial and spectral intensity distributions as well as two-photon absorption profile and the fluorescence regime were characterized. It was found that the laser spectral profile corresponds to the Fourier limit. The two-photon absorption profile is dominated by the laser broadening and the fluorescence dependence on the intensity around 10 TW cm-2 showed saturation. The uncertainty on atomic nitrogen density by fs-TALIF was found
Finally, the effect of laser dispersion and photon statistics on two-photon absorption and fluorescence yields was evidenced using two fs laser configurations, this aspect being important for fluorescence calibration procedures.
Data availability statement
The raw data supporting the conclusions of this article will be made available by the authors, without undue reservation.
Author contributions
AB: Investigation, Writing – original draft, Formal Analysis, Visualization, Data curation, Resources, Conceptualization, Software, Supervision, Project administration, Methodology, Writing – review and editing, Validation. CP-F: Data curation, Investigation, Writing – review and editing, Visualization, Formal Analysis. NM: Investigation, Data curation, Writing – review and editing, Software, Methodology, Formal Analysis. ND: Formal Analysis, Conceptualization, Data curation, Writing – review and editing, Methodology, Investigation, Software. GDS: Investigation, Validation, Supervision, Conceptualization, Writing – review and editing, Methodology, Funding acquisition, Resources, Project administration, Writing – original draft, Formal Analysis, Data curation.
Funding
The author(s) declare that financial support was received for the research and/or publication of this article. This research was funded by the French National Research Agency ULTRAMAP project (ANR-22-CE51-0027), Soleil project 20231659 and IdF SESAME, project DIAGPLAS.
Acknowledgments
The researchers would like to thank the beamline DESIRS team for their assistance for the smooth operation of the facility under Soleil project 20231659 and the Erika Jean-Bart and Jerôme Beaunier for their technical support.
Conflict of interest
The authors declare that the research was conducted in the absence of any commercial or financial relationships that could be construed as a potential conflict of interest.
The author(s) declared that they were an editorial board member of Frontiers, at the time of submission. This had no impact on the peer review process and the final decision.
Generative AI statement
The authors declare that no Generative AI was used in the creation of this manuscript.
Publisher’s note
All claims expressed in this article are solely those of the authors and do not necessarily represent those of their affiliated organizations, or those of the publisher, the editors and the reviewers. Any product that may be evaluated in this article, or claim that may be made by its manufacturer, is not guaranteed or endorsed by the publisher.
References
1. Niemi K, Schulz-Von Der Gathen V, Döbele HF. Absolute atomic oxygen density measurements by two-photon absorption laser-induced fluorescence spectroscopy in an RF-excited atmospheric pressure plasma jet. Plasma Sourc Sci Technol (2005) 14:375–86. doi:10.1088/0963-0252/14/2/021
2. Niemi K, Schulz-von Der Gathen V, Döbele HF. Absolute calibration of atomic density measurements by laser-inducedfluorescence spectroscopy with two-photon excitation. J Phys D Appl Phys (2001) 34:2330.
3. Gazeli K, Lombardi G, Aubert X, Duluard CY, Prasanna S, Hassouni K. Progresses on the use of two-photon absorption laser induced fluorescence (TALIF) diagnostics for measuring absolute atomic densities in plasmas and flames. Plasma (2021) 4:145–71. doi:10.3390/plasma4010009
4. Schmidt JB, Sands B, Scofield J, Gord JR, Roy S. Comparison of femtosecond- and nanosecond-two-photon-absorption laser-induced fluorescence (TALIF) of atomic oxygen in atmospheric-pressure plasmas. Plasma Sourc Sci Technol (2017) 26:055004. doi:10.1088/1361-6595/aa61be
5. Schmidt JB, Roy S, Kulatilaka WD, Shkurenkov I, Adamovich IV, Lempert WR, et al. Femtosecond, two-photon-absorption, laser-induced-fluorescence (fs-TALIF) imaging of atomic hydrogen and oxygen in non-equilibrium plasmas. J Phys D Appl Phys (2016) 50:015204. doi:10.1088/1361-6463/50/1/015204
6. Bischel WK, Perry BE, Crosley DR. Two-photon laser-induced fluorescence in oxygen and nitrogen atoms. Chem Phys Lett (1981) 82:85–8. doi:10.1016/0009-2614(81)85112-3
7. Boogaarts MGH, Mazouffre S, Brinkman GJ, van der Heijden HWP, Vankan P, van der Mullen JAM, et al. Quantitative two-photon laser-induced fluorescence measurements of atomic hydrogen densities, temperatures, and velocities in an expanding thermal plasma. Rev Scientific Instr (2002) 73:73–86. doi:10.1063/1.1425777
8. Kulatilaka WD, Patterson BD, Frank JH, Settersten TB. Comparison of nanosecond and picosecond excitation for interference-free two-photon laser-induced fluorescence detection of atomic hydrogen in flames. Appl Opt (2008) 47(26):4672–83. doi:10.1364/ao.47.004672
9. Shu Z, Popov NA, Starikovskaia SM. Absolute calibration of the ratio of Xe/O two-photon absorption cross-sections for O-TALIF applications. Plasma Sourc Sci Technol (2024) 33:025019. doi:10.1088/1361-6595/ad270f
10. Klochko AV, Lemainque J, Booth JP, Starikovskaia SM. TALIF measurements of oxygen atom density in the afterglow of a capillary nanosecond discharge. Plasma Sourc Sci Technol (2015) 24:025010. doi:10.1088/0963-0252/24/2/025010
11. Drag C, Marmuse F, Blondel C. Measurement of the two-photon excitation cross-section of the 6p′[3/2]2 and 6p′[1/2]0 levels of Xe I at the wavelengths 224.3 and 222.6 nm. Plasma Sourc Sci Technol (2021) 30:075026. doi:10.1088/1361-6595/abfbeb
12. Stancu GD, Kaddouri F, Lacoste DA, Laux CO. Atmospheric pressure plasma diagnostics by OES, CRDS and TALIF. J Phys D Appl Phys (2010) 43:124002. doi:10.1088/0022-3727/43/12/124002
13. Siby A, Stefas D, Agha Y, Invernizzi L, Gazeli K, Lombardi G, et al. Gas temperature measurements from ps-TALIF in highly collisional plasmas. Phys Plasmas (2024) 31. doi:10.1063/5.0189326
14. Stancu GD. Two-photon absorption laser induced fluorescence: rate and density-matrix regimes for plasma diagnostics. Plasma Sourc Sci Technol (2020) 29:054001. doi:10.1088/1361-6595/ab85d0
15. Bamford DJ, Saxon RP, Jusinski LE, Buck JD, Bischel WK. Two-photon excitation of atomic oxygen at 200.6, 192.5, and 194.2 nm: absolute cross sections and collisional ionization rate constants. Phys Rev A (Coll Park) (1988) 37:3259–69. doi:10.1103/physreva.37.3259
16. Bamford DJ, Bischel WK, Hickman AP, Dyer MJ. Comparative photon statistics of several ultraviolet laser systems determined by transient two-photon absorption. JOSA B (1988) 5(7):1369–78. doi:10.1364/josab.5.001369
17. Cohen-Tannoudji C, Dupont-Roc J, Grynberg G. Atom—photon interactions. In: Atom—photon interactions (1998). doi:10.1002/9783527617197
18. Allen L, Eagles KA, Jr CRS. The time development of adiabatic two-photon absorption. I. Low intensity regime. J Phys B: At Mol Phys (1982) 15:1643–50. doi:10.1088/0022-3700/15/11/010
19. Eagles KA, Stroud CR, Allen L. The time development of adiabatic two-photon absorption. II. Rate equation regime. J Phys B: At Mol Phys (1982) 15:2021–6. doi:10.1088/0022-3700/15/13/018
20. Niemi K, Gathen VSder, Döbele HF. Absolute calibration of atomic density measurements by laser-induced fluorescence spectroscopy with two-photon excitation. J Phys D Appl Phys (2001) 34:2330.
21. Fell CP, Steinfeld JJ, Miller SM. Detection of N(4S) by resonantly enhanced multiphoton ionizanon spectroscopy. Spectrochim Acta A (1990) 46:431–4. doi:10.1016/0584-8539(90)80118-i
22. Amorim J, Baravian G, Touzeau M, Jolly J. Two-photon laser induced fluorescence and amplified spontaneous emission atom concentration measurements in O2 and H2 discharges. J Appl Phys (1994) 76:1487–93. doi:10.1063/1.357723
23. Döbele HF, Mosbach T, Niemi K, Schulz-Von Der Gathen V. Laser-induced fluorescence measurements of absolute atomic densities: concepts and limitations. Plasma Sourc Sci Technol (2005) 14:S31–41. doi:10.1088/0963-0252/14/2/s05
24. Kulatilaka WD, Gord JR, Katta VR, Roy S. Photolytic-interference-free, femtosecond two-photon fluorescence imaging of atomic hydrogen. Opt Lett (2012) 37(15):3051–3. doi:10.1364/ol.37.003051
25. Dumitrache C, Gallant A, De Oliveira N, Laux CO, Stancu GD. Quantitative fs-TALIF in high-pressure NRP discharges: calibration using VUV absorption spectroscopy. Plasma Sourc Sci Technol (2022) 31:015004. doi:10.1088/1361-6595/ac3e41
26. Nahon L, de Oliveira N, Garcia GA, Gil JF, Pilette B, Marcouillé O, et al. DESIRS: a state-of-the-art VUV beamline featuring high resolution and variable polarization for spectroscopy and dichroism at SOLEIL. J Synchrotron Rad (2012) 19:508–20. doi:10.1107/s0909049512010588
27. De Oliveira N, Roudjane M, Joyeux D, Phalippou D, Rodier JC, Nahon L. High-resolution broad-bandwidth Fourier-transform absorption spectroscopy in the VUV range down to 40 nm. Nat Photon (2011) 5(3):149–53. doi:10.1038/nphoton.2010.314
28. De Oliveira N, Joyeux D, Phalippou D, Rodier JC, Polack F, Vervloet M, et al. A Fourier transform spectrometer without a beam splitter for the vacuum ultraviolet range: from the optical design to the first UV spectrum. Rev Scientific Instr (2009) 80:043101. doi:10.1063/1.3111452
30. Bell KL, Berrington KA, Ramsbottom CA Photoionization of excited states of atomic nitrogen. J Phys B: At Mol Opt Phys (1992) 25. 1209.
Keywords: fs-TALIF, nitrogen VUV absorption spectroscopy, fluorescence calibration with high intensity lasers, atomic nitrogen absolute density, femtosecond plasma diagnostics
Citation: Brisset A, Pascual-Fort C, Minesi NQ, De Oliveira N and Stancu GD (2025) Improved accuracy of atomic nitrogen detection in plasma by high-intensity fs-TALIF calibrated using VUV absorption spectroscopy. Front. Phys. 13:1606147. doi: 10.3389/fphy.2025.1606147
Received: 04 April 2025; Accepted: 26 May 2025;
Published: 17 July 2025.
Edited by:
Paolo Francesco Ambrico, Istituto per la Scienza e Tecnologia dei Plasmi - CNR, ItalyReviewed by:
Qing Xiong, Chongqing University, ChinaMarcelo Baquero Ruiz, Swiss Federal Institute of Technology Lausanne, Switzerland
Keegan Orr, Lawrence Livermore National Laboratory (DOE), United States
Xin Yang, Chinese Academy of Sciences (CAS), China
Copyright © 2025 Brisset, Pascual-Fort, Minesi, De Oliveira and Stancu. This is an open-access article distributed under the terms of the Creative Commons Attribution License (CC BY). The use, distribution or reproduction in other forums is permitted, provided the original author(s) and the copyright owner(s) are credited and that the original publication in this journal is cited, in accordance with accepted academic practice. No use, distribution or reproduction is permitted which does not comply with these terms.
*Correspondence: A. Brisset, YWxleGFuZHJhLmJyaXNzZXRAY2VudHJhbGVzdXBlbGVjLmZy; G. D. Stancu, Z2FiaS1kYW5pZWwuc3RhbmN1QGNlbnRyYWxlc3VwZWxlYy5mcg==
 A. Brisset
 C. Pascual-Fort1
 N. Q. Minesi
 N. De Oliveira
 G. D. Stancu