- 1Business School, Xiangtan University, Xiangtan, China
- 2National Engineering Laboratory for Big Data Analysis and Application, School of Mathematical Sciences, Peking University, Beijing, China
- 3School of Finance, Yunnan University of Finance and Economics, Kunming, China
- 4Chinese Academy of Finance and Development, Central University of Finance and Economics, Beijing, China
Global geopolitical risk (GPR) has increasingly become a pivotal driver of financial market volatility, understanding the impact of GPR on market tail risk is crucial, particularly as traditional models often overlook the complex, nonlinear dynamics exacerbated by geopolitical shocks. This study offers an in-depth examination of the quantile-dependent spillover connectedness between GPR and the tail risk of 18 industries in the Chinese stock market. By using a quantile-on-quantile (QQ) connectedness approach, we investigate how shocks at varying quantiles propagate through the system, thereby uncovering nonlinear dynamics often obscured by traditional mean-variance models. Our findings reveal a distinct “U-shaped” quantile dependence, where extreme quantiles (5% and 95%) exhibit significantly heightened sensitivity to GPR compared to mid-range quantiles. Additionally, a net directional analysis demonstrates that industries with global integration or resource intensity (such as Manufacturing, Mining, and IT) typically serve as net risk receivers during geopolitical turbulence, while certain sectors (notably Finance) may act as net risk senders under specific conditions. A dynamic connectedness analysis further indicates that pivotal geopolitical events, including the 2018 China-U.S. trade war, the COVID-19 pandemic and the 2022 Russia-Ukraine conflict, act as junctures that intensify tail risk transmission. Collectively, these insights emphasize the necessity of quantile-specific risk monitoring and underscore the value of tailored policy interventions to mitigate severe downside risks amid escalating global uncertainties.
1 Introduction
Global geopolitical risk (GPR) has emerged as a pivotal force driving financial market volatility, encompassing events such as wars, significant political tensions, economic sanctions, and trade barriers [1, 2]. Such disruptions profoundly influence investor sentiment and capital flows, triggering cross-market spillovers and amplifying uncertainty [3]. Amid escalating military conflicts, prolonged trade disputes, and pandemic-induced shocks, policy uncertainty has surged to unprecedented levels, heightening systemic vulnerabilities across both developed and emerging equity markets [4]. Consequently, the World Economic Forum has identified GPR as a foremost global threat, advocating for strengthened market oversight to curb downside risks [1].
Concurrently, tail risk—defined as the likelihood of extreme losses stemming from rare, high-impact events—has gained increasing prominence in risk management and academic research [5, 6]. Traditional financial models, based on mean-variance frameworks, often fail to capture the heavy-tailed, nonlinear patterns that intensify during disruptive geopolitical events [7, 8]. When “black swan” or “gray rhino” events—such as wars or sweeping sanctions—unfold, stock returns exhibit heightened asymmetry, fostering widespread spillovers that exacerbate systemic risk [1]. This dynamic is particularly salient in emerging markets like China, where retail investors’ herding behavior tends to amplify extreme selloffs amid informational uncertainty [9].
Despite growing scholarly attention to GPR [2, 10], most studies focus on average returns or aggregate volatility, overlooking the quantile-specific mechanisms through which GPR amplifies tail risk. While some researchers note that cross-industry and cross-regional linkages surge during severe market downturns, evidence on the underlying non-linear pathways remains limited [11, 12]. This gap prompts a critical question: how can we effectively quantify the impact of global geopolitical shocks on the lower tails of the return distribution? Addressing this is vital for policymakers seeking to safeguard systemic stability amid rising global tensions.
To bridge this gap, we employ a quantile-on-quantile (QQ) connectedness approach to explore spillovers between GPR and the tail risks of 18 Chinese stock market industries. The QQ connectedness approach systematically traces how shocks at specific GPR quantiles transmit to corresponding industrial tail risk quantiles [13–15], thereby revealing nonlinear dynamics and asymmetries in risk transmission. By accounting for both lower- and upper-tail conditions, it reveals nuanced patterns and U-shaped dependencies often overlooked by simpler linear or single-quantile methodology [16]. Notably, our approach highlights key scenarios—such as the 2018 China–U.S. trade war, COVID-19 pandemic, and the 2022 Russia–Ukraine conflict—where geopolitical shocks disproportionately affect the left tails of China’s stock market [14, 17].
Using monthly data from 2010 to 2023, we derive three principal findings. First, a pronounced “U-shaped” dependence emerges between GPR and Chinese industrial tail risk, with extreme quantiles (5% and 95%) exhibiting markedly stronger connectedness than mid-quantiles. Second, net directional analysis reveals that globally integrated, resource-intensive sectors—such as Manufacturing, Mining, and IT—consistently act as net risk receivers under geopolitical stress, while Finance occasionally emerges as a net risk sender, amplifying shocks under certain conditions. Third, dynamic connectedness peaks during major geopolitical events, confirming that incidents like the 2018 trade war, the COVID-19 pandemic, and the 2022 Russia–Ukraine conflict serve as pivotal moments that heighten tail risk transmission. These findings highlight the critical need for quantile-specific risk monitoring and advocate for targeted policy measures to address heightened geopolitical risk periods, aligning with calls for macroprudential strategies to manage financial turbulence [18].
Our study offers three major contributions. First, it broadens the scope of research on GPR by exploring its dynamic interplay with tail risks across 18 diverse industries in the Chinese stock market, uncovering how the connectedness evolves across different quantiles and over time. This enriches the understanding of how geopolitical uncertainties shape extreme risk profiles in a major emerging market. Second, while prior studies [18–23] often limit their analysis to spillovers within uniform quantiles, overlooking cross-quantile dynamics, this paper employs the cutting-edge QQ connectedness approach to provide a detailed and precise depiction of risk transmission between GPR and industrial tail risks under varying market conditions. Third, unlike earlier research that typically examines broad market indices or isolated sectors, we develop an innovative framework that categorizes 18 industries into dominant, basic support, and modern service groups, enabling a granular analysis of how geopolitical shocks differentially propagate across distinct economic segments.
The paper is structured as follows: Section 2 reviews the theoretical background and literature. Section 3 details the methodology and data. Section 4 presents empirical findings on tail risk connectedness under geopolitical shocks. Section 5 concludes with policy implications and future research directions.
2 Theoretical background and literature review
2.1 Theoretical background
The global financial landscape has grown increasingly volatile due to escalating geopolitical tensions, including wars, terrorist attacks, and diplomatic crises [10, 24]. GPR, characterized as the volatility and uncertainty stemming from such events, profoundly influences policy frameworks and economic stability, thereby reshaping the risk profiles of financial markets worldwide. Within this context, tail risk—defined as the probability of extreme negative returns at the distribution’s far end—emerges as a critical concern, particularly susceptible to GPR’s disruptive effects.
Theoretically, GPR impacts tail risk through three primary channels: uncertainty, risk aversion, and spillover or contagion. First, the uncertainty channel suggests that GPR amplifies ambiguity in policy and macroeconomic environments, elevating risk premia. Pástor and Veronesi [24] argue that heightened policy uncertainty increases expected returns, while Baker et al. [10] find that the Economic Policy Uncertainty (EPU) Index is positively associated with stock market volatility and reduced investment. Geopolitical events, by intensifying uncertainty, may prompt investors to demand higher risk premia or adopt a cautious ‘wait-and-see’ stance, heightening the potential for tail events [25].
Second, the risk aversion channel posits that rising GPR diminishes investors’ willingness to bear risk. During periods of geopolitical upheaval, investors often shift from equities to safe-haven assets like gold [26], triggering a flight-to-safety effect. This shift results in equity sell-offs, reduced liquidity, and amplified price declines, thereby increasing the likelihood of extreme tail losses. Intriguingly, in markets like China, GPR can attract capital inflows, reducing firms’ financing costs and spurring investment [27, 28]. These results challenge conventional ‘risk-off’ assumptions and underscore GPR’s multifaceted influence.
Third, the spillover and contagion channel highlights GPR’s capacity to propagate systemic risk, particularly during large-scale events such as wars. Lai et al. [29] emphasize that financial market interconnectedness exacerbates risk contagion, with geopolitical shocks intensifying tail-risk spillovers across global markets [30, 31]. Collectively, these mechanisms suggest that GPR skews the risk distribution of financial markets, rendering extreme adverse outcomes more probable, especially in emerging economies like China, where market dynamics and investor behavior amplify such effects.
2.2 Literature review
Extensive research has explored the relationship between GPR and financial market dynamics, focusing on uncertainty, market responses, and firm-level impacts. This body of work can be categorized into macro-level analyses of market risk and micro-level studies of firm behavior, offering a foundation for understanding GPR’s role in tail risk escalation.
2.2.1 Uncertainty and market outcomes
Early research has established that policy uncertainty significantly shapes financial markets by influencing asset pricing, economic behavior, and investor strategies. Pástor and Veronesi [24] demonstrate that policy uncertainty elevates required risk premia, driving up expected returns. Building on this, Baker et al. [10] deepen the analysis by linking uncertainty to greater stock market volatility and economic downturns, highlighting how it amplifies risk across financial systems. At the firm level, Gulen and Ion [32] found that companies respond by scaling back investment, a reaction that deepens economic slowdowns and further pressures asset prices. Meanwhile, in derivative markets, Kelly et al. [33] observed that investors, facing political upheavals, turn to options for tail risk insurance, reflecting efforts to shield themselves from uncertainty’s extreme outcomes. Though these studies primarily address policy uncertainty rather than GPR specifically, they underscore uncertainty’s pivotal role in shaping financial market behavior during crises.
2.2.2 Global geopolitical risk research
The influence of GPR on financial markets has gained significant attention in recent research, as global tensions increasingly shape economic stability and investor behavior. A key development in this field is the GPR Index, introduced by Caldara and Iacoviello [2], which offers a precise tool to quantify geopolitical tensions and supports deeper empirical analysis. Research shows that GPR has a profound impact, often exceeding that of traditional economic risks. For instance, Triki and Ben Maatoug [26] highlight how elevated GPR triggers a flight-to-safety effect, driving investors away from equities toward safe-haven assets like gold, which depresses stock prices and heightens market instability. This effect is compounded by findings from Balcilar et al. [34], who demonstrate that GPR not only increases stock market volatility but also extends its duration, adding a persistent layer of uncertainty that conventional risk models struggle to capture. Demirer et al. [35] also emphasize GPR’s broader role in shaping global stock market dynamics and influencing asset pricing, pointing to its systemic importance across markets. Together, these insights reveal that GPR is not just a temporary disruption but a fundamental force that reshapes financial ecosystems, with lasting effects on asset classes and market behavior worldwide.
2.2.3 Evidence from China
In emerging markets like China, GPR interacts with local dynamics to shape financial outcomes in complex ways. Research shows that GPR significantly increases the downside tail risk of Chinese equities, raising the likelihood of extreme losses during periods of heightened tension [36]. This elevated risk environment may explain the ‘low-exposure premium’ identified by Zhang et al. [3], where firms with limited GPR exposure achieve higher returns amid geopolitical stress. Additionally, Pan et al. [4] find that GPR amplifies inter-sectoral volatility spillovers, highlighting the nonlinear and interconnected nature of market responses. Together, these studies underscore GPR’s multifaceted influence on Chinese markets, offering critical insights for risk management.
2.2.4 Tail-risk measurement
Traditional systemic risk metrics, such as CoVaR [5] and the spillover index [37, 38], typically focus on mean-variance relationships, overlooking tail dependencies. Recent studies leverage quantile-based methods to address this gap. Zhao et al. [31] show that inter-market contagion varies significantly between normal and extreme conditions, validating the use of quantile approaches for extreme risk analysis. Compared to standard vector autoregression, the QVAR-based framework excels at capturing asymmetric and dynamic tail transmissions, particularly during large-scale disruptions [18, 19]. These developments enhance our understanding of GPR’s impact on extreme financial outcomes [13].
In summary, the literature confirms that GPR exacerbates tail risk by amplifying uncertainty, curbing risk tolerance, and intensifying contagion effects. Yet, a comprehensive quantile-based exploration of China’s equity market remains scarce, particularly regarding variations in extreme risk transmission. While CoVaR and mean-variance frameworks provide value, they fall short in elucidating the specific mechanisms of tail events triggered by geopolitical shocks. Addressing this gap, our study employs a QQ connectedness approach to precisely delineate how GPR influences the tail-risk distribution of Chinese stocks, enriching theoretical insights and offering practical guidance for mitigating downside risks.
3 Methodology and data
3.1 Methodology
Building upon the quantile connectedness framework by Chatziantoniou et al. [39] and extending the quantile-on-quantile advancement introduced by Gabauer and Stenfors [13], this study employs a QQ connectedness approach to investigate the dynamic interplay between GPR and the tail risks of 18 industries in China’s stock market. Such a model is particularly well-suited for capturing quantile-specific interdependencies and nonlinear spillovers among GPR and industrial tail risks across different market conditions.
We consider a
where
where
Next, to quantify how shocks emanating from one variable affect the forecast error variance of another, the present study applies the generalized forecast error variance decomposition (GFEVD). Specifically, for a forecast horizon of
where
Based on the above variance decomposition, we proceed to construct the pairwise and system-wide connectedness measures. We first normalize the GFEVD contributions to obtain a relative influence of each shock. The normalized (or “scaled”) variance share of shocks from
which represents the proportion of
The “TO” directional connectedness of variable
which sums the normalized contributions of
Conversely, the “FROM” directional connectedness of variable
which is the aggregated portion of the forecast error variance explained by shocks from all other
Finally, we derive the Total Connectedness Index (TCI) to gauge the overall interconnectedness of the system at quantile level
This adjusted TCI measures the proportion of the total forecast error variance in the system that is due to cross-variable shocks (i.e., spillovers), as opposed to idiosyncratic (own) effects. A higher
For the empirical implementation, we calculate the above connectedness measures within a rolling-window framework to uncover their evolution over time. In practice, we re-estimate the QVAR model on a moving sample window of fixed length, and compute the GFEVD for a forecast horizon of
3.2 Data
3.2.1 Global geopolitical risk
The data comprises the GPR index and eighteen industry-specific tail systemic risk indicators as the principal variables. The GPR index, developed by Caldara and Iacoviello [2], measures geopolitical tensions by surveying the frequency of newspaper articles reporting disruptive geopolitical events, such as wars, terrorist threats, and heightened military conflict, and weighting them against the total number of news reports. Higher GPR values imply higher degrees of geopolitical tension. The sample spans 2010–2023, a period marked by multiple significant geopolitical disruptions.
3.2.2 Tail risk
To capture extreme downside linkages between each industry and the market, the study constructs eighteen industry-level tail risk indicators. Specifically, for each of the 18 major industries in China’s A-share market, the lower-tail dependence (
3.2.3 Summary statistics
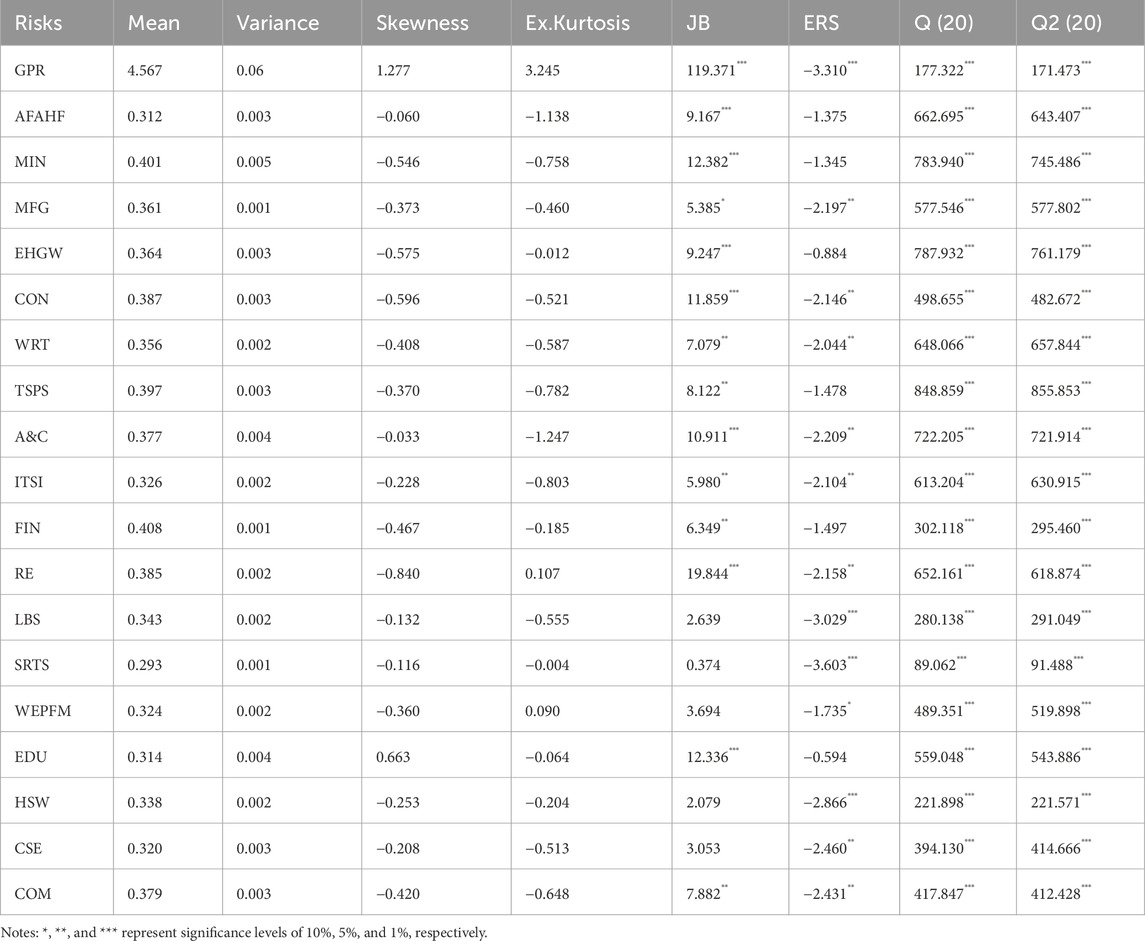
Table 1 presents key descriptive statistics for the GPR index and the 18 industrial tail risk measures from 2010 to 2023, including means, variances, skewness, kurtosis, the Jarque–Bera (JB) normality test, and the Elliott–Rothenberg–Stock (ERS) test for unit roots. On average, the GPR index stands at 4.567 with a variance of 0.060, reflecting substantial volatility relative to the tail risk variables, whose variances range from 0.001 to 0.005. Mean tail risk coefficients typically lie between 0.293 and 0.408, suggesting that roughly 30%–40% of an industry’s downside losses coincide with market downturns.
Statistical tests confirm that the GPR distribution is highly non-normal, with a right skew of 1.277 and kurtosis of 3.245. By contrast, the tail risk indicators generally exhibit mild negative skewness and somewhat lower kurtosis, often indicating flatter distributions compared to the normal benchmark. Moreover, Jarque–Bera tests overwhelmingly reject normality for both GPR and most tail risk series. ERS unit root tests suggest that GPR and a majority of the industrial tail risk measures are stationary, allowing the study to proceed without marked concerns over non-stationarity.
3.2.4 Temporal patterns in GPR and industrial tail risk
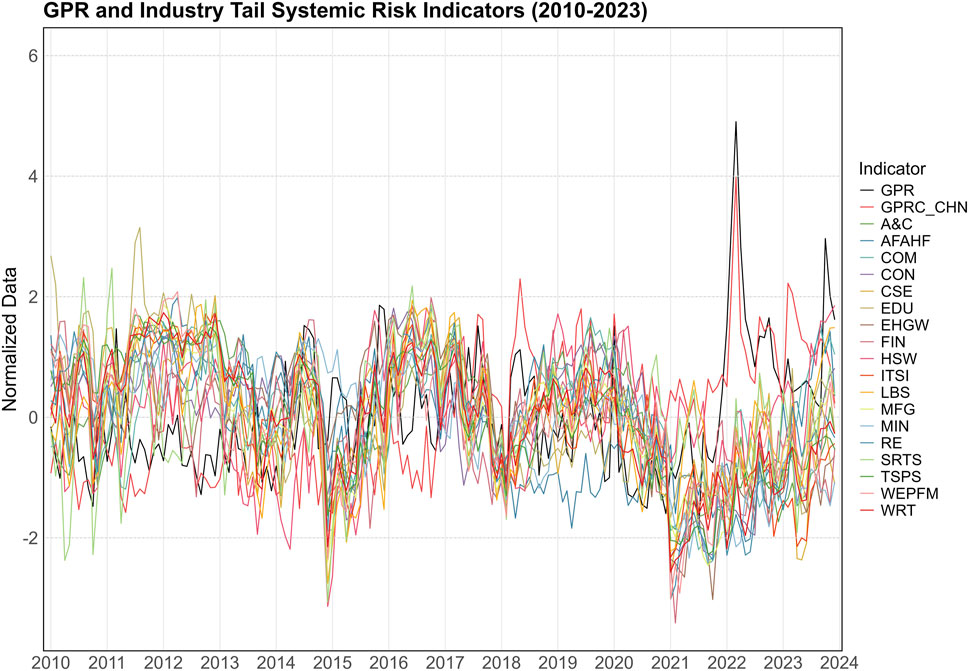
Figure 1 plots the normalized time series of GPR alongside the eighteen industrial tail risks. Notably, in mid-2015, a significant domestic equity market crash in China drove sharp spikes in industry-wide tail risk, but GPR remained relatively subdued, implying a primarily domestic rather than geopolitical event. In early 2020, the COVID-19 pandemic triggered a generalized increase in tail risk and a moderate uptick in GPR. The Russia–Ukraine conflict in early 2022 propelled GPR to its highest level, again elevating industrial tail risk. These episodes demonstrate that geopolitical shocks typically coincide with concurrent increases in GPR and tail risk. In contrast, episodes driven by internal market factors exert a stronger effect on tail risks without substantially altering geopolitical risk.
3.2.5 Pearson correlation
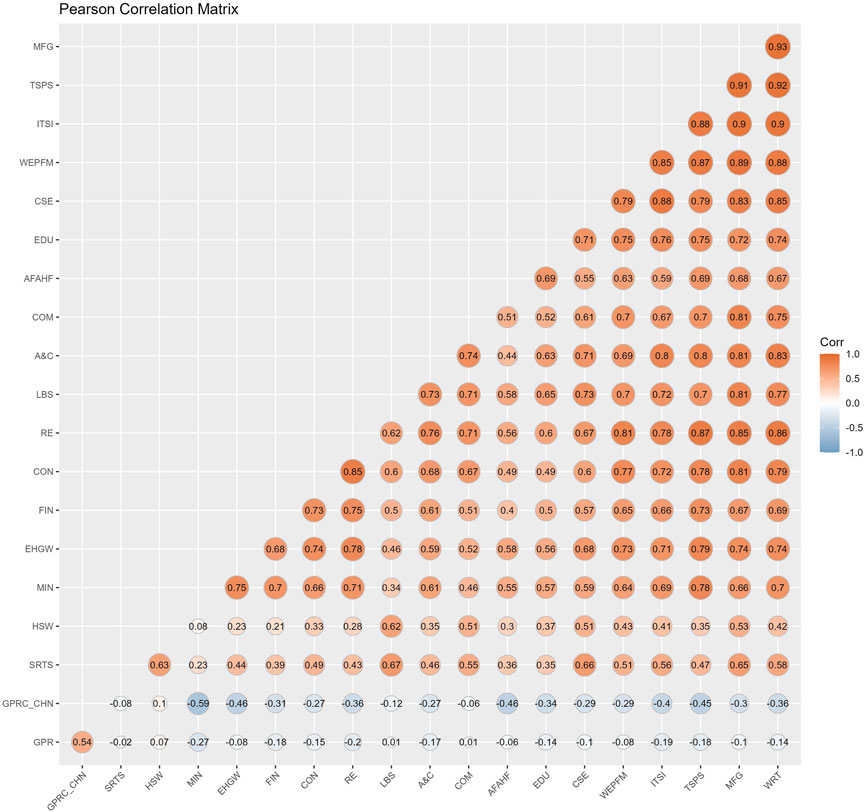
Figure 2 presents a Pearson correlation heatmap for GPR and the tail risks. Correlations among the tail risks are predominantly high and positive, approaching 1, suggesting a common driver of systemic risk across sectors. By contrast, correlations between the GPR index and each tail risk remain low, mostly near zero or mildly positive, signifying a minimal linear relationship. This low correlation underscores the necessity of employing the QQ connectedness approach to detect non-linear and asymmetric linkages, especially under severe market or geopolitical conditions.
4 Empirical analysis
This section presents the empirical findings on the interconnectedness between GPR and the tail risk of 18 industries within the Chinese stock market across various quantiles. First, we examine the Quantile-on-Quantile Total Connectedness (TCI) to evaluate the connectedness of GPR and tail risk across all industries under different quantiles. Second, we employ the Net Quantile-on-Quantile Total Directional Connectedness (NET) to identify whether each industry acts as a net risk sender or receiver. Third, we focus on the Dynamic Correlation Total Connectedness (DYNAMIC) to highlight how these interdependencies evolve in response to major geopolitical events. Robustness checks are discussed at the end.
In this study, the 18 industries are categorized into three distinct groups to reveal the paths of risk transmission and potential tail interlinkages under geopolitical shocks. This classification is based on each industry’s functional positioning, upstream and downstream linkages, and overall contribution to the economy, aligning with official standards such as the Guidelines for Industry Classification of Listed Companies (2012 Revision) issued by the China Securities Regulatory Commission and the three-sector classification framework in GB/T 4754-2017 by the National Bureau of Statistics. Specifically, the dominant industries encompass Manufacturing (MFG), Mining (MIN), Comprehensive (COM), Information Transmission, Software, and Information Technology Services (ITSI), and Scientific Research and Technical Services (SRTS). The basic support industries include Agriculture, Forestry, Animal Husbandry, and Fishery (AFAHF), Culture, Sports, and Entertainment (CSE), Finance (FIN), Transportation, Storage, and Postal Services (TSPS), Leasing and Business Services (LBS), and Real Estate (RE). Modern service industries comprise Electricity, Heat, Gas, and Water Production and Supply (EHGW), Construction (CON), Wholesale and Retail Trade (WRT), Accommodation and Catering (A&C), Water Conservancy, Environment, and Public Facilities Management (WEPFM), Education (EDU), and Health and Social Work (HSW). This structured classification not only clarifies how different industries interact within the economy but also strengthens the analysis of how geopolitical shocks propagate through these interconnected sectors.
We use a QQ connectedness model with a 24-month rolling window, a lag length of one based on the Bayesian Information Criterion, and 20-step-ahead forecasts. In each heat map, the left and right vertical axes represent quantile distribution levels, while the color bar shows total or net spillover intensity. Warmer shades signal stronger connectedness among variables. By examining diverse quantiles, we detect asymmetric spillover effects. Concurrently, time-series plots position time on the horizontal axis, unveiling the temporal evolution of spillovers and distinguishing behaviors in both positive and negative tail risks.
4.1 Quantile-on-quantile total connectedness analysis (TCI)
The TCI measures the connectedness between GPR and the tail risk of 18 industries in the Chinese stock market under varying quantile conditions. By examining TCI at multiple quantile levels, we gain deeper insights into how geopolitical risk shapes extreme market outcomes under both mild and acute stress scenarios. Specifically, we focus on the extreme quantiles (τ = 5% and τ = 95%) to capture the upper and lower bounds where geopolitical shocks may induce pronounced tail interdependencies.
Within the dominant industries group (MFG, MIN, COM, ITSI, and SRTS), as depicted in Figure 3, we observe notably elevated TCI values at extreme quantiles. MFG exhibits TCI values of 87.9 and 78.9 at τ = 5% and τ = 95%, respectively, surpassing other industries due to its profound integration with global supply chains. Once geopolitical factors exert negative impacts on international trade via tariffs or export embargoes, manufacturing typically experiences amplified tail volatility. MIN follows a comparable pattern, with TCI values of 83 and 77.9 under extreme conditions, aligning with the notion that mineral and energy resources are strategically sensitive to global political turmoil. Meanwhile, COM sometimes surpasses MFG at specific extreme quantiles, such as 90.2 and 83.3, reflecting the diversified business structure that allows risks to accumulate across multiple segments. ITSI and SRTS exhibit TCI values ranging from 82.8 to 85.3, reflecting their vulnerability to intensified global IT competition, external blockades, or policy frictions in critical research areas, thereby heightening their tail risk exposure. These findings suggest that highly globalized or resource-dependent industries may benefit from tailored stress-testing mechanisms to counter trade barriers and sanctions [18]. Moreover, preempting conflicts by enhancing supply chain diversification or reducing leverage risk emerges as a prudent strategy [20].
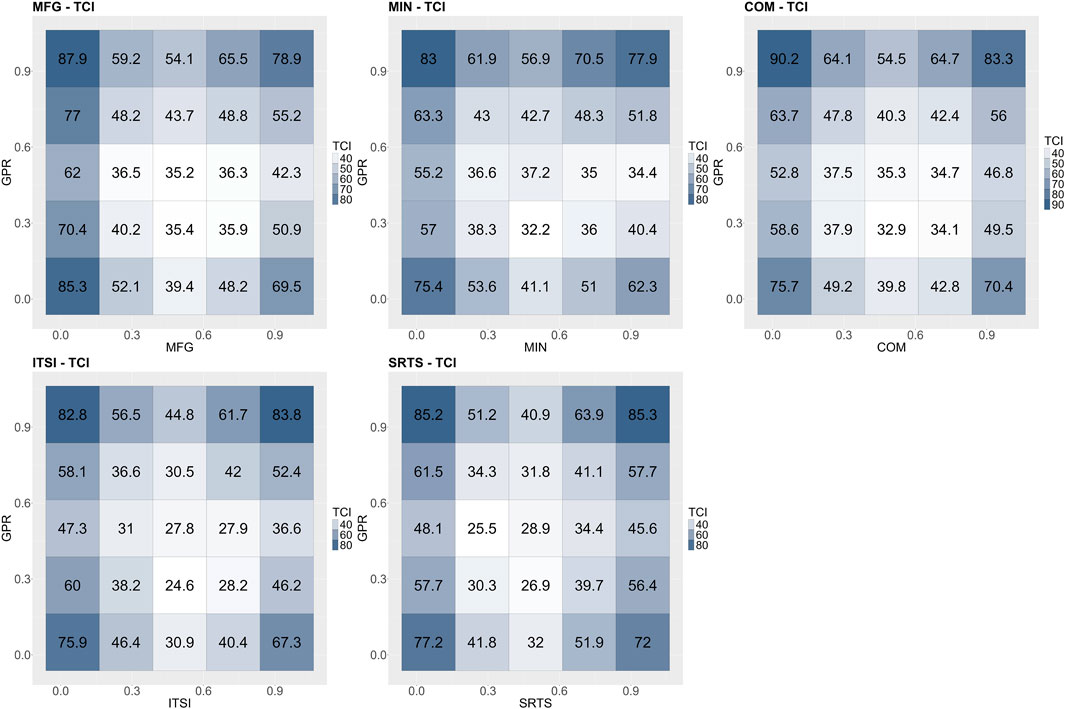
Figure 3. Average quantile-on-quantile connectedness between GPR and the tail risk of the dominant industries.
For the basic support industries group (AFAHF, CSE, FIN, TSPS, LBS, and RE), as shown in Figure 4, TCI values remain moderately elevated, typically spanning 75–85 at extreme quantiles. Notably, AFAHF can reach 85–85.4 at τ = 5% and τ = 95%, underscoring pronounced tail linkages when agricultural products and trade policies serve as geopolitical bargaining chips. Similarly, CSE reaches 86.9 and 81.7 in tail scenarios, indicating that policy frictions or ideological clashes can abruptly impair cultural exports, intellectual property transactions, and cross-border activities. FIN sustains TCI values of 80.6 and 77.5, a relatively tempered range, yet demonstrates capacity for rapid risk repricing via global capital flows. TSPS occasionally ascends to 86.6 and 77.4, mirroring vulnerabilities in international shipping routes and sentiment-driven freight rate volatility. LBS and RE exhibit analogous fluctuations, hovering between 83 and 88, stemming from their dependence on foreign investment, cross-border mergers, and financing channels, which can shift dramatically amid escalating geopolitical tensions. These observations imply that finance, logistics, and real estate sectors may propagate geopolitical turbulence into broader market volatility. Regulators might thus prioritize monitoring cross-border capital flows and high foreign-investment projects, implementing dynamic margin or liquidity measures during rapid GPR escalations to curb shock amplification [19].
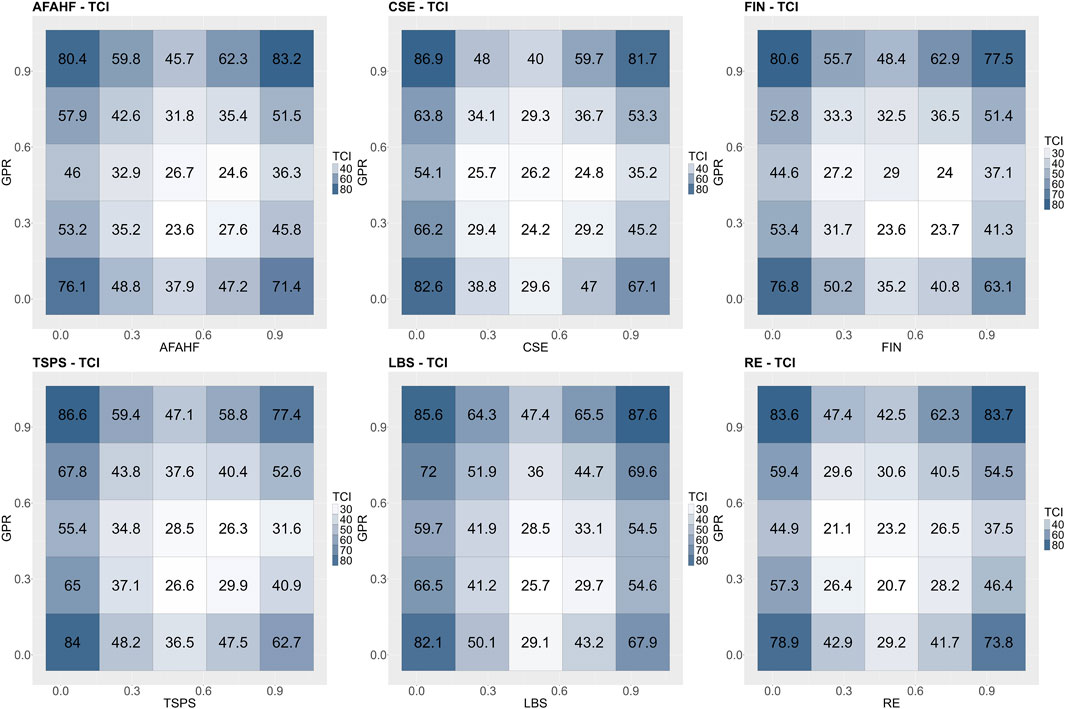
Figure 4. Average quantile-on-quantile connectedness between GPR and the tail risk of the basic support industries.
Lastly, the modern service industries group (EHGW, CON, WRT, A&C, WEPFM, EDU, and HSW) generally manifests lower TCI levels relative to other groups. As illustrated in Figure 5, EHGW attains 86.7 and 79.7 at τ = 5% and τ = 95%, evidencing downstream ripple effects from international energy constraints. CON records TCI values of 84.3 and 76.1 under extreme conditions, partly influenced by domestic policy cycles and geopolitical uncertainties in overseas infrastructure ventures. WRT achieves 85.1 and 79.3 at extreme quantiles, propelled by abrupt supply chain disruptions and consumer sentiment shifts during exceptional events. Conversely, A&C, WEPFM, EDU, and HSW typically register TCI values below 75 at median quantiles, suggesting reduced sensitivity to cross-border shocks. Although less reactive to external perturbations, these industries can still amplify market volatility under extreme conditions via demand and cost channels. To mitigate potential tail risk transmission, regulators could bolster resilience through tax incentives, liquidity support, or digital transformation initiatives, while ensuring coordination with traditional sectors to prevent localized constraints from escalating into systemic spillovers [23].
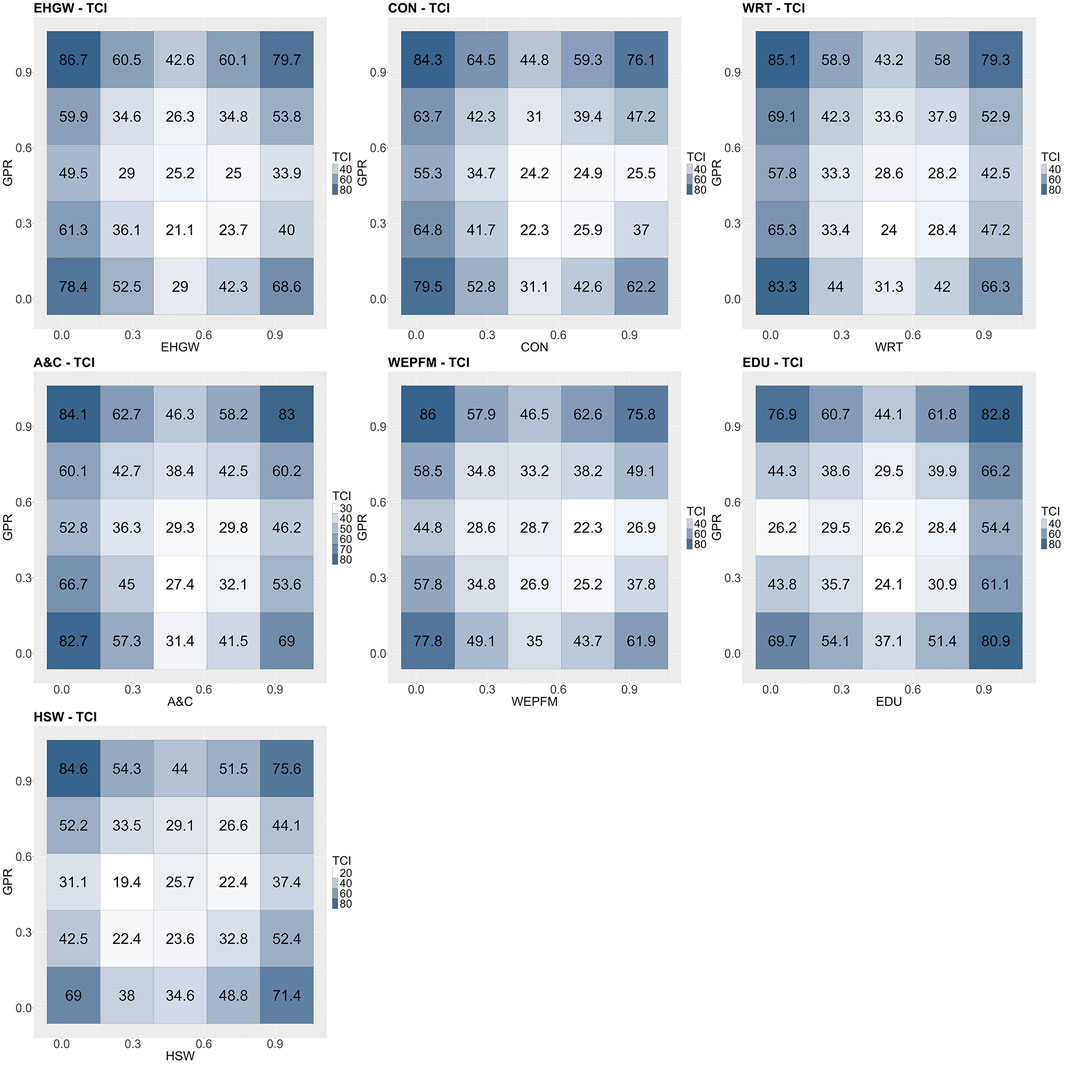
Figure 5. Average quantile-on-quantile connectedness between GPR and the tail risk of the modern service industries.
In summary, we identify a distinctive “U-shaped” quantile dependence, with the left (τ = 5%) and right (τ = 95%) tails exhibiting peak sensitivity to GPR, while median quantiles remain comparatively stable. Additionally, a slight asymmetry arises when some industries exhibit a more pronounced jump in the left tail than in the right tail. Consequently, relying solely on average or median metrics risks underestimating extreme risk vulnerability [21]. Geopolitical risk exerts a significant amplifying effect under extreme market conditions, with the degree of impact contingent on each industry’s level of internationalization, resource dependency, and supply chain geopolitical exposure.
4.2 Net quantile-on-quantile total directional connectedness analysis (NET)
To elucidate the direction of risk flow between GPR and the tail risks of 18 industries, we employ net quantile-on-quantile total directional connectedness (NET), where NET>0 denotes a net “risk sender” and NET<0 denotes a net “risk receiver.” Empirically, the largest NET values often appear when one variable is at an extreme quantile (5% or 95%) and the other is at a median quantile (around 50%), or vice versa.
In the dominant industries group, as illustrated in Figure 6, MFG can achieve a net value as low as −35.7, whereas MIN can drop to −36.2. When global political tensions escalate, MFG and MIN face immediate exposure to sanctions, raw material supply disruptions, and energy disputes, rendering them predominantly net risk receivers due to challenges in reallocating or transferring such shocks. Most industries in this group exhibit markedly negative NET values, indicating a strong tendency to absorb risks. For instance, COM consistently displays values around −26, reflecting the inherent challenges of mitigating geopolitical shocks across its multifaceted operations. ITSI and SRTS record NET values around −27.7 and −29.1, respectively, illustrating asymmetric global competition in intellectual property, technology exports, and advanced equipment, which constrains their ability to offload these shocks. Industries with persistent negative NET values are vulnerable to geopolitical and supply chain shocks, warranting proactive regulatory measures—such as intensified foreign investment scrutiny or strategic resource reserves in resource-reliant sectors [22]. In IT and R&D industries, governmental support for research and innovation could reduce external dependency and enhance resilience.
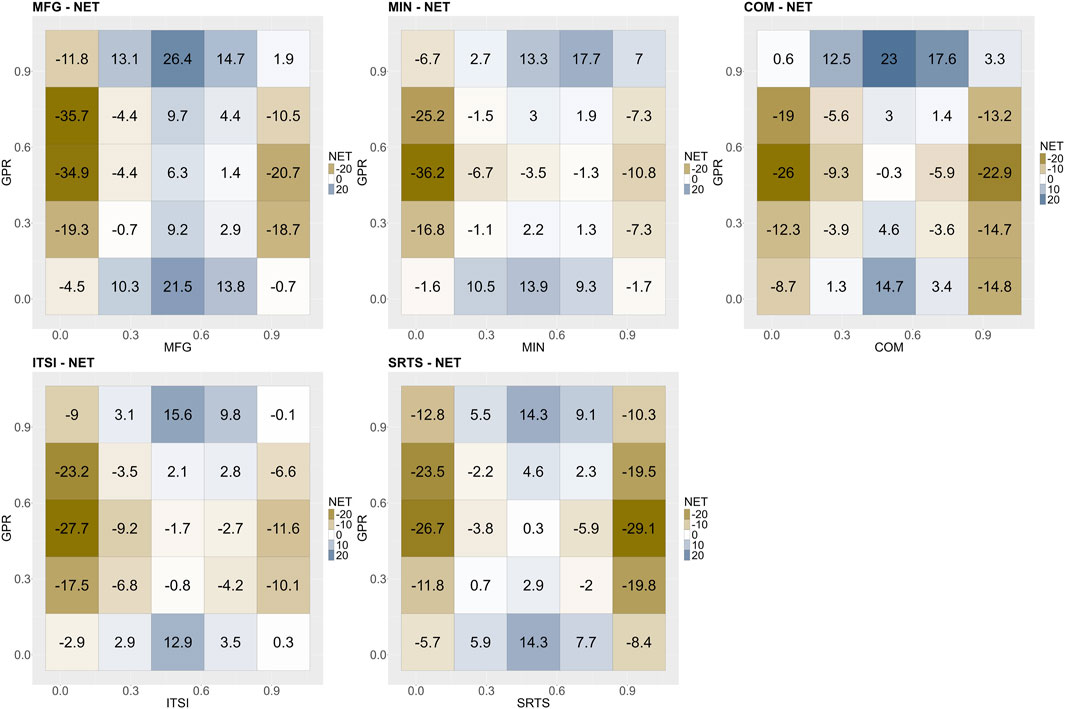
Figure 6. Net quantile-on-quantile connectedness between GPR and the tail risk of the dominant industries.
In the basic support industries group, as shown in Figure 7, NET values generally range between −15 and −25, although positive values do appear in certain quantiles. AFAHF, for example, reaches −22.2 at midrange quantiles, showing its vulnerability when agricultural products become bargaining chips in trade disputes. CSE exhibits a pronounced negative value of −25.9, driven in part by stalled cross-border cultural exchanges and entertainment exports during periods of geopolitical tension. Conversely, FIN occasionally yields positive NET values, such as +22.6, reflecting the leverage and risk transfer mechanisms embedded within financial markets—e.g., heightened speculation or credit contraction can rapidly channel external risks to the broader market. TSPS, LBS, and RE mostly range from −15 to −24, as they passively absorb logistic bottlenecks or capital flow constraints; however, policy support and partial buffers can mitigate some of the tail effects in RE. These findings imply that sectors like finance may not only receive but also send risks under certain stress conditions, emphasizing the need for vigilant cross-industry regulation of leverage cycles [42]. At the same time, strengthening transparency in financial reporting helps prevent systemic spillovers from escalating [43].

Figure 7. Net quantile-on-quantile connectedness between GPR and the tail risk of the basic support industries.
Within the modern service industries group, as indicated in Figure 8, NET values are generally smaller in absolute magnitude, around −15 or above, indicating comparatively weaker ties to immediate geopolitical shocks and suggesting that these sectors primarily encounter risk through second-round demand or policy effects. EHGW can reach −26.2 in certain extreme scenarios, but typically remains between −10 and −20, reflecting its passive absorption of higher input costs when global energy prices surge. CON and WRT similarly fluctuate between −15 and −25. Interestingly, A&C sporadically exhibits positive NET values, e.g., 15.5, indicating that sudden contractions in consumer demand can propagate upward along supply chains, effectively making A&C a net sender under specific conditions. Meanwhile, WEPFM, EDU, and HSW remain within ±15, underscoring the domestically oriented, public-service nature of these sectors. This implies that certain modern service industries not only absorb risks but may also transmit shocks upstream. Regulators should focus on these sectors’ financing structures and exposures, using flexible contingency plans to mitigate demand-side shocks [21, 23].
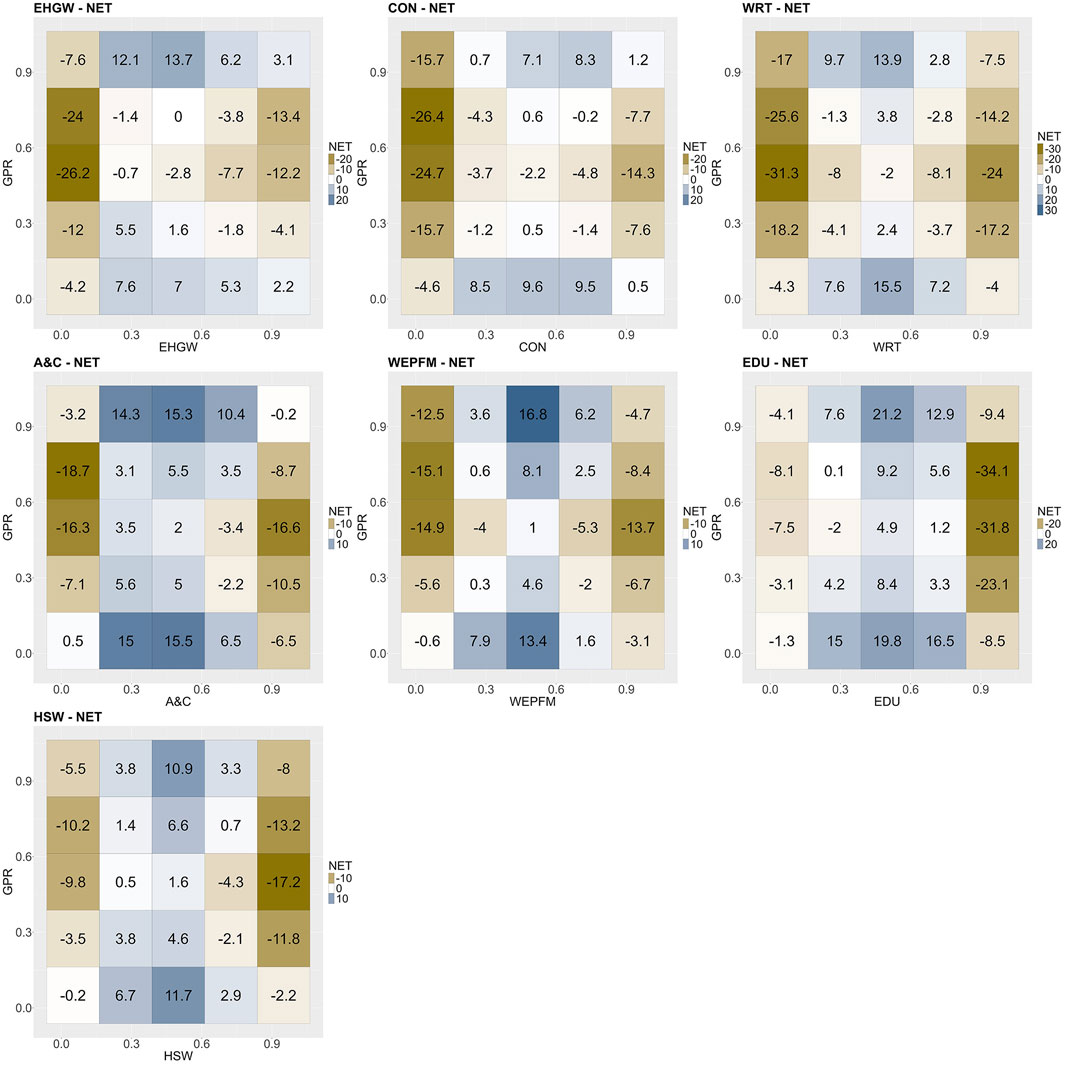
Figure 8. Net quantile-on-quantile connectedness between GPR and the tail risk of the modern service industries.
NET analysis reveals that most industries—especially those with extensive global exposure, technological barriers, or resource demands—tend to act as net receivers under geopolitical stress. However, sectors like FIN and select consumer industries may become net senders in specific contexts, amplifying market volatility. This pattern intensifies when GPR hits extreme highs or lows while industry risks remain moderate, introducing abrupt external shocks that demand heightened firm- and investor-level attention. Policymakers might thus consider real-time stress tests for globally exposed sectors and targeted capital constraints in financial intermediaries to curb net risk transmission and fortify stability [21, 23].
4.3 Dynamic correlation total connectedness analysis (DYNAMIC)
Dynamic Correlation Total Connectedness (DYNAMIC) analysis traces the temporal interplay between GPR and industrial tail risks, spotlighting how major geopolitical events reshape risk network structures and offering deeper insights into connectedness drivers. We present three dynamic connectedness metrics—reverse TCI, direct TCI, and their adjusted difference—alongside their time-varying trajectories.
The dominant industry group exhibits the most striking dynamic connectedness fluctuations, peaking during pivotal geopolitical events. As shown in Figure 9, since the 2018 China–U.S. trade war’s onset, MFG has sustained elevated connectedness, surging further during the 2020 COVID-19 outbreak and the 2022 Russia–Ukraine conflict. This aligns with pronounced peaks from 2018 to 2020, followed by a sharp rise circa 2022, fueled by intensified global supply chain strains and commodity price volatility. MIN experiences similarly pronounced fluctuations from 2020 to 2022, coinciding with the Russia–Ukraine-triggered global energy crisis and oil price shocks. COM reacts strongly to key events, particularly during the 2020 pandemic and 2022 conflict escalation, reflecting large diversified firms’ exposure to systemic disruptions. Following the 2018 trade disputes and technical embargoes, ITSI has maintained persistently elevated levels of volatility, peaking again in 2020 and 2022, as technology increasingly takes center stage in geopolitical contention. Similarly, SRTS mirrors ITSI’s trend, with 2022s global tension spike amplifying tail risk connectedness, driven by uncertainties in cross-border R&D and technology export controls. These patterns mirror broader global transitions, where manufacturing and technology have become focal points in geopolitical competitions [18]. Consequently, Chinese policymakers might benefit from reinforcing cooperative frameworks or setting up cross-border risk-sharing arrangements to mitigate the impact of supply chain disruptions.
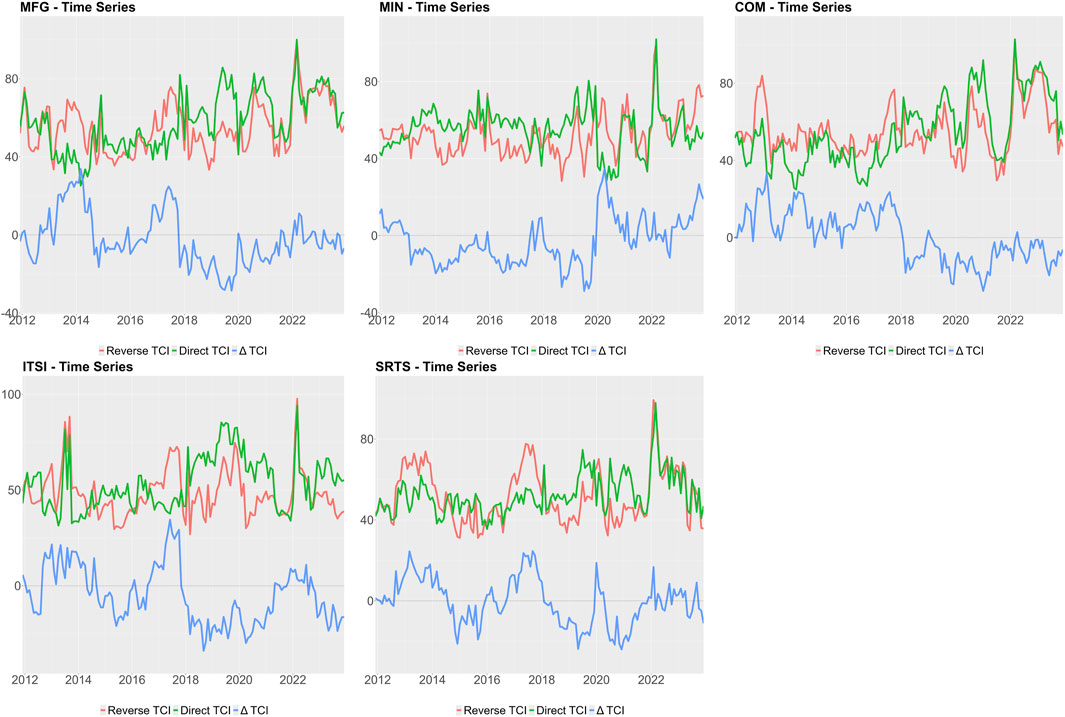
Figure 9. Dynamic quantile-on-quantile connectedness between GPR and the tail risk of the dominant industries.
Basic support industries exhibit moderate dynamic connectedness, yet display significant peaks around major geopolitical or macroeconomic disruptions. As shown in Figure 10, AFAHF escalates sharply since 2018, peaking during the 2018–2019 China–U.S. agricultural disputes and 2022s Russia–Ukraine-induced grain price surges. CSE spikes in 2018–2019 and 2022, often tied to cross-border copyright tensions or cultural export restrictions. FIN tracks global financial volatility, cresting during the 2015 Chinese stock market turmoil, 2018 trade clashes, 2020 pandemic, and 2022 Russia–Ukraine conflict. TSPS shows heightened connectedness in 2020 lockdowns and 2022 shipping disruptions, while LBS and RE surge from 2020 to 2022, partly due to external financial conditions and domestic policy shifts (e.g., real estate regulations). These peaks suggest that basic support industries’ volatility could amplify systemic contagion under external shocks, especially when global supply-demand and financing channels tighten. Regulators might reinforce resilience via liquidity support in agriculture, logistics, and utilities, alongside tighter oversight of overseas-financed sectors to limit spillovers [19].
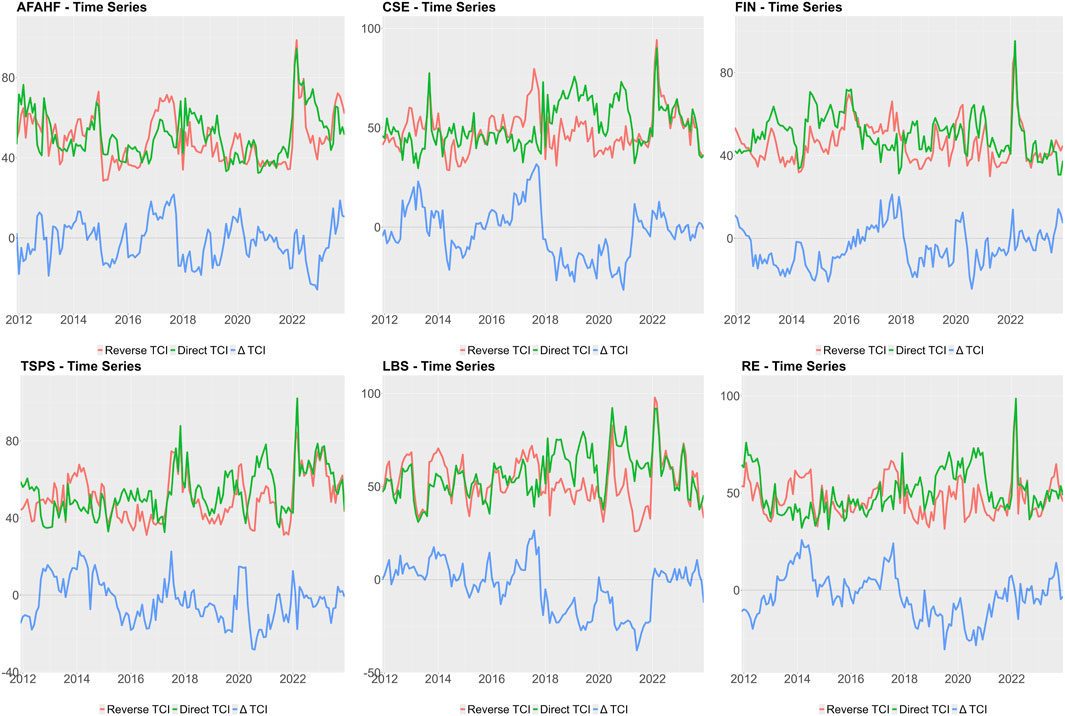
Figure 10. Dynamic quantile-on-quantile connectedness between GPR and the tail risk of the basic support industries.
Though the modern service industries remain relatively stable compared to other groups, they exhibit sharp, transient peaks. As depicted in Figure 11, EHGW rises notably from 2021 to 2022, lagging upstream mining but reflecting cost shocks from international energy prices. CON, sensitive to domestic real estate cycles, peaks locally in 2022 amid geopolitical shifts and the strict pandemic measures. WRT, A&C, WEPFM, EDU, and HSW spike intensely yet briefly in early 2020 due to COVID-19, reverting to lower volatility by 2021, highlighting reliance on domestic demand and policy support over international factors. Despite milder fluctuations, these sectors face disruptive shocks during global or domestic crises, as seen in early 2020s acute peaks. Temporary support measures—such as credit lines, tax breaks, and strategic digital investments—can help offset short-term cost pressures and stabilize demand [23]. Coordination with other sectors is critical to prevent localized disruptions from broadening into systemic risks.
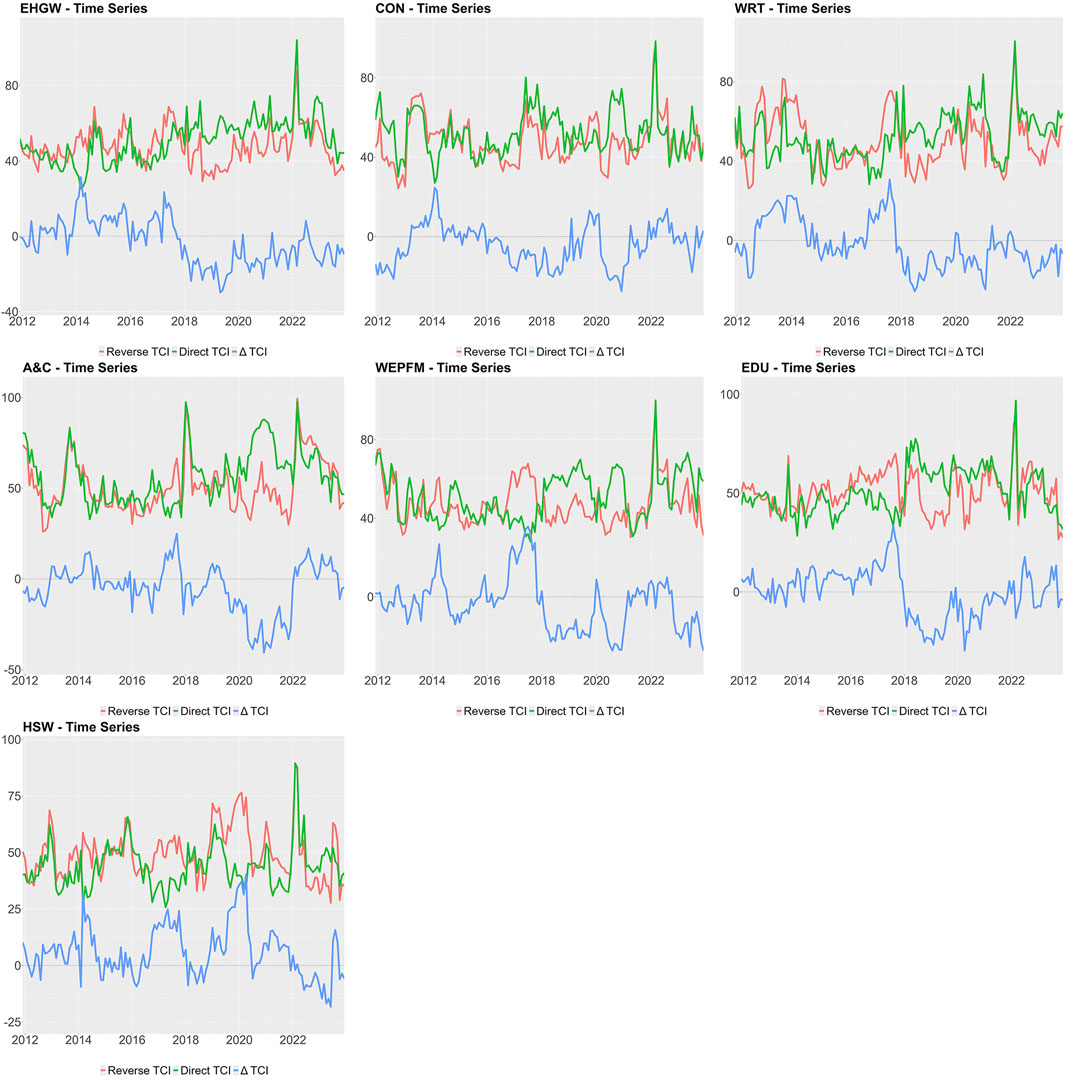
Figure 11. Dynamic quantile-on-quantile connectedness between GPR and the tail risk of the modern service industries.
In summary, we have three key findings: First, a “U-shaped” quantile dependence prevails between GPR and Chinese stock market tail risks, with TCI surging at τ = 5% and τ = 95% while mid-quantiles stabilize, underscoring linear correlation’s inadequacy for tail dynamics. Second, geopolitical shocks manifest asymmetrically, concentrating impacts during high-risk or stressed periods: globally integrated, resource-intensive sectors (MFG, MIN, ITSI) predominantly receive risks, while FIN occasionally sends risks, heightening market turbulence. Third, dynamic connectedness peaks during seminal events—the 2018 China–U.S. trade war, 2020 COVID-19 crisis, and 2022 Russia–Ukraine conflict—marking turning points in the GPR–industry risk network, with rising, frequent spikes since 2018 signaling growing vulnerability to geopolitical uncertainty.
4.4 Robustness tests
In this study, we performed multiple robustness tests to validate our findings. First, we applied the spillover measurement approach within the traditional generalized vector autoregression (VAR) framework of Diebold and Yilmaz [38], affirming robust connectivity between GPR and industrial tail risks (Supplementary Table A1). Replacing the SJC-copula function with the Clayton copula function [44] preserved stable connectedness (Supplementary Figures A1–A9). When we substituted the US-centric geopolitical risk index with the Chinese geopolitical risk index (GPRC_CHN), the results also remained consistent (Supplementary Figures A10–A18). These methodological variations reinforce the reliability and consistency of our conclusions across diverse paradigms.
Second, we adjusted forecasting horizons (n_fore) and rolling window sizes (window.size), as detailed in the appendix (Supplementary Figures A19–A63). Horizons shifted from 20 months to 10 and 30 months, and window lengths varied from 24 months to 12, 18, and 36 months, consistently upholding the quantile-dependent connectedness of GPR and tail risk across different time horizons. Meanwhile, quantile partitions were also altered from (0.05, 0.25, 0.50, 0.75, 0.95) to (0.10, 0.30, 0.50, 0.70, 0.90), with heightened connectivity at extreme quantiles remaining evident (Supplementary Figures A64–A72). This sustained non-linear tail dependence further validates our primary findings under alternative quantile configurations.
Finally, we analyzed the post-March 2020 period to gauge the pandemic’s influence on QQ connectedness (Supplementary Figures A73–A81). Early pandemic phases revealed intensified extreme risk fluctuations, reflecting market actors’ heightened sensitivity to geopolitical uncertainty amid global instability. As recovery progressed, tail sensitivity persisted, particularly at higher risk quantiles, confirming rapid risk escalation under uncertainty. Collectively, these tests—spanning alternative methodologies (e.g., copula functions, GVAR), GPR proxies (e.g., GPRC_CHN), and varying horizons, windows, and quantiles—affirm the robustness of our core conclusions.
5 Conclusions, policy implications, limitations and future directions
5.1 Conclusion
The study employs the QQ connectedness approach to investigate the intricate relationship between GPR and tail risk across 18 industries of the Chinese stock market, yielding three key findings. First, the mutual linkage between GPR and tail risk in China demonstrates a pronounced U-shaped quantile dependence, with connectedness intensifying sharply at the lower and upper extremes (τ = 5% and τ = 95%) yet remaining relatively moderate around the median. This underscores a strong nonlinear pattern that traditional linear correlation models fail to capture. Second, the net connectedness analysis reveals significant asymmetry in risk transmission, particularly under extreme conditions marked by heightened geopolitical tensions or market stress. In such scenarios, industries like MFG, MIN, ITSI, and SRTS typically act as “risk receivers,” while FIN may, under specific circumstances, emerge as a “risk sender.” Finally, dynamic analysis identifies major geopolitical events—such as the 2018 China-U.S. trade war, the 2020 COVID-19 pandemic, and the 2022 Russia-Ukraine conflict—as pivotal turning points in the risk network.
5.2 Policy implications
Based on these empirical findings, the study proposes several targeted policy implications. First, regulatory bodies should establish a quantile-specific risk monitoring framework, paying particular attention to market reactions at the 5% and 95% extremes of geopolitical risk. Specifically, for dominant sectors—MFG, MIN, ITSI, and SRTS—authorities should implement preventive safeguards, for example, timely liquidity injections, before trade tensions escalate. For basic support industries such as FIN, TSPS, and RE, it is vital to monitor and mitigate potential spillover effects in order to avoid amplifying risks during geopolitical conflicts. Meanwhile, modern service industries warrant comparatively moderate regulation to encourage their stabilizing role under conditions of rising domestic demand. Second, investors should leverage the NET analysis, which suggests steering clear of sectors with heightened net risk reception, such as MFG and MIN, during periods of intensifying geopolitical risk, while remaining vigilant about possible risk spillovers from FIN under specific scenarios. Portfolio construction should fully account for the time-varying dynamics highlighted by the DYNAMIC analysis, especially the generally strengthening connectedness between GPR and various industries. Finally, government agencies should strengthen international coordination and communication channels to reduce information asymmetry and mitigate the detrimental impact of geopolitical conflicts on market sentiment. Concurrently, deepening multilateral initiatives—such as the Belt and Road—can broaden access to global markets, thereby bolstering overall economic resilience and enhancing the capacity to navigate geopolitical risks effectively.
5.3 Limitations and future research directions
Despite the robust findings, this study has several limitations. First, our analysis relies on monthly data, which may not fully capture short-term market reactions to sudden geopolitical events. Second, the SJC-copula approach, while effective for tail dependence, may not account for all forms of nonlinear interactions. Third, our focus on China limits the generalizability to other emerging markets with different institutional structures. Future research could address these limitations by: (1) incorporating high-frequency data to capture immediate market responses; (2) exploring alternative nonlinear methodologies such as wavelet analysis or machine learning approaches to enhance model flexibility; (3) extending the framework to compare multiple emerging economies for cross-country validation; (4) integrating investor sentiment indicators to disentangle behavioral factors from fundamental reactions; and (5) developing forward-looking risk measures that combine GPR with alternative data sources such as social media sentiment or satellite imagery to improve predictive capabilities in tail risk management.
Data availability statement
The data analyzed in this study is subject to the following licenses/restrictions: Data available only on authorization. Requests to access these datasets should be directed to An Li,bGlhbmFjZEAxMjYuY29t.
Author contributions
JL: Visualization, Software, Data curation, Conceptualization, Writing – original draft, Methodology, Formal Analysis, Validation, Writing – review and editing. YL: Data curation, Writing – review and editing, Resources, Conceptualization, Methodology, Validation, Formal Analysis, Supervision. FL: Project administration, Funding acquisition, Resources, Validation, Methodology, Supervision, Conceptualization, Software, Writing – review and editing. AL: Data curation, Visualization, Software, Supervision, Project administration, Formal Analysis, Conceptualization, Writing – review and editing, Methodology.
Funding
The author(s) declare that financial support was received for the research and/or publication of this article. This study is supported by the National Natural Science Foundation of China (Grant no. 72463032).
Conflict of interest
The authors declare that the research was conducted in the absence of any commercial or financial relationships that could be construed as a potential conflict of interest.
Generative AI statement
The author(s) declare that no Generative AI was used in the creation of this manuscript.
Publisher’s note
All claims expressed in this article are solely those of the authors and do not necessarily represent those of their affiliated organizations, or those of the publisher, the editors and the reviewers. Any product that may be evaluated in this article, or claim that may be made by its manufacturer, is not guaranteed or endorsed by the publisher.
Supplementary material
The Supplementary Material for this article can be found online at: https://www.frontiersin.org/articles/10.3389/fphy.2025.1612695/full#supplementary-material
References
1. Boubaker S, Goodell JW, Pandey DK, Kumari V. Heterogeneous impacts of wars on global equity markets: evidence from the invasion of Ukraine. Finance Res Lett (2022) 48:102934. doi:10.1016/j.frl.2022.102934
2. Caldara D, Iacoviello M. Measuring geopolitical risk. Am Econ Rev (2022) 112:1194–225. doi:10.1257/aer.20191823
3. Zhang Y, Zhang Y, Ren X, Jin M. Geopolitical risk exposure and stock returns: evidence from China. Finance Res Lett (2024) 64:105479. doi:10.1016/j.frl.2024.105479
4. Pan C, Zhang W, Wang W. Global geopolitical risk and volatility connectedness among China’s sectoral stock markets. Finance Res Lett (2023) 58:104487. doi:10.1016/j.frl.2023.104487
6. Giglio S, Kelly B, Pruitt S. Systemic risk and the macroeconomy: an empirical evaluation. J Financial Econ (2016) 119:457–71. doi:10.1016/j.jfineco.2016.01.010
7. Bai J, Perron P. Computation and analysis of multiple structural change models. J Appl Econom (2003) 18:1–22. doi:10.1002/jae.659
8. Baur DG, Lucey BM. Is gold a hedge or a safe haven? An analysis of stocks, bonds and gold. Financial Rev (2010) 45:217–29. doi:10.1111/j.1540-6288.2010.00244.x
9. Guo P, Shi J. Geopolitical risks, investor sentiment and industry stock market volatility in China: evidence from a quantile regression approach. North Am J Econ Finance (2024) 72:102139. doi:10.1016/j.najef.2024.102139
10. Baker SR, Bloom N, Davis SJ. Measuring economic policy uncertainty. Q J Econ (2016) 131:1593–636. doi:10.1093/qje/qjw024
11. Ahlgren N, Antell J. Stock market linkages and financial contagion: a cobreaking analysis. Q Rev Econ Finance (2010) 50:157–66. doi:10.1016/j.qref.2009.12.004
12. Mollah S, Quoreshi AMMS, Zafirov G. Equity market contagion during global financial and eurozone crises: evidence from a dynamic correlation analysis. J Int Financial Markets Institutions Money (2016) 41:151–67. doi:10.1016/j.intfin.2015.12.010
13. Gabauer D, Stenfors A. Quantile-on-quantile connectedness measures: evidence from the US treasury yield curve. Finance Res Lett (2024) 60:104852. doi:10.1016/j.frl.2023.104852
14. Naifar N. Monetary policy expectations and financial markets: a quantile-on-quantile connectedness approach. North Am J Econ Finance (2025) 77:102389. doi:10.1016/j.najef.2025.102389
15. Niu H, Zhang S. Asymmetric effects of commodity and stock market on Chinese green market: evidence from wavelet-based quantile-on-quantile approach. Renew Energ (2024) 230:120794. doi:10.1016/j.renene.2024.120794
16. Naeem MA, Pham L, Senthilkumar A, Karim S. Oil shocks and BRIC markets: evidence from extreme quantile approach. Energ Econ (2022) 108:105932. doi:10.1016/j.eneco.2022.105932
17. NguyenHuu T, Örsal DK. Geopolitical risks and financial stress in emerging economies. World Economy (2024) 47:217–37. doi:10.1111/twec.13529
18. Umar Z, Hadad E, Phiri A, Teplova T. Dynamics of asymmetric connectedness among magnificent seven technology giants: insights from QVAR analysis. Q Rev Econ Finance (2025) 101:101977. doi:10.1016/j.qref.2025.101977
19. Bulut E, Marangoz C. Exploring the impact of economic recession indicators on global financial markets: a QVAR analysis. Int Rev Financial Anal (2025) 99:103966. doi:10.1016/j.irfa.2025.103966
20. Hoque ME, Billah M, Kapar B, Naeem MA. Quantifying the volatility spillover dynamics between financial stress and US financial sectors: evidence from QVAR connectedness. Int Rev Financial Anal (2024) 95:103434. doi:10.1016/j.irfa.2024.103434
21. Patra S, Malik K. Return and volatility connectedness among US and Latin American markets: a QVAR approach with implications for hedging and portfolio diversification. Glob Finance J (2025) 65:101094. doi:10.1016/j.gfj.2025.101094
22. Ren X, Wang S, Mao W, Gozgor G. Greening the energy industry: an efficiency analysis of China’s listed new energy companies and its market spillovers. Energ Econ (2025) 145:108414. doi:10.1016/j.eneco.2025.108414
23. Shu M, Liu B, Ouyang W, Sun R, Lin Y. Multi-scale dynamic correlation and information spillover effects between climate risks and digital cryptocurrencies: based on wavelet analysis and time-frequency domain QVAR. Physica A: Stat Mech Appl (2025) 663:130443. doi:10.1016/j.physa.2025.130443
24. Pástor Ľ, Veronesi P. Political uncertainty and risk premia. J Financial Econ (2013) 110:520–45. doi:10.1016/j.jfineco.2013.08.007
25. Hoque ME, Zaidi MAS. Global and country-specific geopolitical risk uncertainty and stock return of fragile emerging economies. Borsa Istanbul Rev (2020) 20:197–213. doi:10.1016/j.bir.2020.05.001
26. Triki MB, Ben Maatoug A. The GOLD market as a safe haven against the stock market uncertainty: evidence from geopolitical risk. Resour Policy (2021) 70:101872. doi:10.1016/j.resourpol.2020.101872
27. Huang Z, Ye C, Lai F, Li Y, Li X. Dancing between threats and conflicts: how Chinese energy companies invest amidst global geopolitical risks. Energ Econ (2024) 139:107907. doi:10.1016/j.eneco.2024.107907
28. Lai F, Xiong D, Zhu S, Li Y, Tan Y. Will geopolitical risks only inhibit corporate investment? Evidence from China. Pacific-Basin Finance J (2023) 82:102134. doi:10.1016/j.pacfin.2023.102134
29. Lai F, Li S, Lv L, Zhu S. Do global geopolitical risks affect connectedness of global stock market contagion network? Evidence from quantile-on-quantile regression. Front Phys (2023) 11:1124092. doi:10.3389/fphy.2023.1124092
30. Gong X-L, Feng Y-K, Liu J-M, Xiong X. Study on international energy market and geopolitical risk contagion based on complex network. Resour Policy (2023) 82:103495. doi:10.1016/j.resourpol.2023.103495
31. Zhao Y, Chen L, Zhang Y. Spillover effects of geopolitical risks on global energy markets: evidence from CoVaR and CAViaR-EGARCH model. Energy Exploration Exploitation (2024) 42:772–88. doi:10.1177/01445987231196617
32. Gulen H, Ion M. Policy uncertainty and corporate investment. Rev Financ Stud (2015) 2015:hhv050. doi:10.1093/rfs/hhv050
33. Kelly B, Pástor Ľ, Veronesi P. The price of political uncertainty: theory and evidence from the option market. J Finance (2016) 71:2417–80. doi:10.1111/jofi.12406
34. Balcilar M, Bonato M, Demirer R, Gupta R. Geopolitical risks and stock market dynamics of the BRICS. Econ Syst (2018) 42:295–306. doi:10.1016/j.ecosys.2017.05.008
35. Demirer R, Gupta R, Suleman T, Wohar ME. Time-varying rare disaster risks, oil returns and volatility. Energ Econ (2018) 75:239–48. doi:10.1016/j.eneco.2018.08.021
36. Li S, Tu D, Zeng Y, Gong C, Yuan D. Does geopolitical risk matter in crude oil and stock markets? Evidence from disaggregated data. Energ Econ (2022) 113:106191. doi:10.1016/j.eneco.2022.106191
37. Diebold FX, Yilmaz K. On the network topology of variance decompositions: measuring the connectedness of financial firms. J Econom (2014) 182:119–34. doi:10.1016/j.jeconom.2014.04.012
38. Diebold FX, Yilmaz K. Better to give than to receive: predictive directional measurement of volatility spillovers. Int J Forecast (2012) 28:57–66. doi:10.1016/j.ijforecast.2011.02.006
39. Chatziantoniou I, Gabauer D, Stenfors A. Interest rate swaps and the transmission mechanism of monetary policy: a quantile connectedness approach. Econ Lett (2021) 204:109891. doi:10.1016/j.econlet.2021.109891
40. Pesaran HH, Shin Y. Generalized impulse response analysis in linear multivariate models. Econ Lett (1998) 58:17–29. doi:10.1016/S0165-1765(97)00214-0
41. Patton AJ. Modelling asymmetric exchange rate dependence. Int Econ Rev (2006) 47:527–56. doi:10.1111/j.1468-2354.2006.00387.x
42. Wang H, Sua LS, Huang J, Ortiz J, Alidaee B. Will southeast asia be the next global manufacturing hub? A multiway cointegration, causality, and dynamic connectedness analyses. Emerging Markets Rev (2024) 63:101217. doi:10.1016/j.ememar.2024.101217
43. Shi G, Chen Z, Luo W, Wei Z. Cross-border spillover of imported sovereign risk to China: key factors identification based on XGBoost-SHAP explainable machine learning algorithm. Finance Res Lett (2024) 70:106307. doi:10.1016/j.frl.2024.106307
Keywords: global geopolitical risk, tail risk, quantile-on-quantile connectedness, Chinese stock market, extreme market conditions
Citation: Li J, Li Y, Lai F and Li A (2025) Global geopolitical risk and industrial tail risk in the Chinese stock market: a quantile-on-quantile connectedness approach. Front. Phys. 13:1612695. doi: 10.3389/fphy.2025.1612695
Received: 16 April 2025; Accepted: 20 May 2025;
Published: 03 June 2025.
Edited by:
Ze Wang, Capital Normal University, ChinaReviewed by:
Qinnan Jiang, Changsha University of Science and Technology, ChinaMingyu Shu, Anhui University, China
Copyright © 2025 Li, Li, Lai and Li. This is an open-access article distributed under the terms of the Creative Commons Attribution License (CC BY). The use, distribution or reproduction in other forums is permitted, provided the original author(s) and the copyright owner(s) are credited and that the original publication in this journal is cited, in accordance with accepted academic practice. No use, distribution or reproduction is permitted which does not comply with these terms.
*Correspondence: An Li, bGlhbmFjZEAxMjYuY29t
 Jing Li
 Yunzhong Li
 Fujun Lai
 An Li
An Li