Abstract
Introduction:
This paper investigates risk contagion between rare earth and new energy-related metal markets, with a focus on higher-order moment risk spillovers from a co-production and co-consumption perspective. Understanding these dynamics is crucial due to the growing interdependence of these markets and their susceptibility to policy shifts and extreme events.
Methods:
Using higher-order moment risk measures, time-domain spillover indexes, and frequency-domain spillover indexes, we analyze return, volatility, skewness, and kurtosis risk spillovers across metal markets from 2014 to 2024. The study employs maximum pairwise spillover portfolio analysis to identify key risk transmission channels.
Results:
The findings reveal that return and volatility risk spillovers increase over time, while skewness risk exhibits short-term high spillovers and kurtosis risk shows long-term persistence, reflecting market sensitivity to asymmetric information and extreme events. Policy changes and major events (e.g., trade disputes, geopolitical tensions) amplify uncertainty and risk contagion. Markets with stable co-production and co-consumption relationships are identified as major risk sources. Frequency-domain analysis highlights the rare earth market’s dominant role in long- and short-term spillovers, with significant external spillover effects.
Discussion:
The results underscore the rare earth market's critical influence on new energy metal markets, suggesting that investors should closely monitor its dynamics to optimize risk management. The study provides policymakers and market participants with insights into risk transmission mechanisms and the systemic role of rare earths in the global economy.
1 Introduction
With the rapid development of the clean energy industry, the demand for rare earths and new energy-related metals is growing at a high rate [1]. The impact of the rare earths market on the new energy-related metals market is becoming increasingly prominent, particularly due to the unique applications of rare earths and their increasing price volatility [2,3]. Rare earth price volatility impacts the entire industrial chain and supply chain. It directly affects company costs and profits. Moreover, it can have far-reaching consequences for overall industry development. Currently, China has become the largest producer and consumer of rare earths in the world [4]. The United States, the European Union, Japan, Australia and other countries have included rare earths in their key mineral lists, and competition for the development and use of rare earths and the development of the industry chain is intensifying1. Therefore, in-depth research on the price risk spillover effect of rare earths and its impact on the new energy industry, as well as exploring the corresponding risk management strategies, is of great theoretical and practical significance [5]. This study aims to critically analyse the impact mechanism of rare earth price fluctuations on the new energy industry chain, explore risk management strategies, and provide valuable suggestions for the sustainable development of the clean energy sector.
The production-consumption relationship of rare earth elements (REEs) and metals associated with new energy sources has become increasingly complex in the clean energy sector, with the phenomena of co-production and co-consumption in particular requiring attention. Co-production refers to the simultaneous occurrence of these two elements in the production process [6], while co-consumption refers to their use together in new energy products [7]. Co-production and co-consumption make the links in the clean energy industry chain interconnected, and an impact on one link is transmitted to other links, leading to increased uncertainty in market volatility [8–11]. That is, the development of the new energy industry relies on the supply of specific raw materials, and the prices of these raw materials may be affected by fluctuations in the international market; at the same time, the consumption demand for rare earths and new energy-related metals is affected by a variety of factors such as policies, regulations and technological development. Therefore, if price fluctuations or risk spillovers occur in a certain link, they will quickly spread to the whole industrial chain, exacerbating the risk spillover effect of price fluctuations. This complex linkage and transmission effect makes the entire clean energy industry chain more vulnerable to external risks and has far-reaching implications for market volatility.
The risk contagion situation between rare earth and new energy-related metals markets is facing further changes due to policies and events. Policies have a direct impact on the development of the rare earth and new energy-related metals industry, and adjustments in import and export policies, resource extraction management, etc. May lead to adjustments in market supply and demand patterns and price volatility [12]. At the same time, some key events, such as international trade frictions and geopolitical tensions, may also affect the market and exacerbate uncertainty [13–15]. In this context, the risk contagion effect between rare earths and new energy-related metals markets is intensifying, and market participants are facing more complex market environments and risk challenges. Therefore, in-depth research on the mechanisms and factors influencing risk contagion between these two markets should take into account the impact of relevant policies and events.
In summary, this paper aims to answer the following questions: what are the characteristics of the different moments of risk spillovers between rare earth elements and the new energy sector, and what are the relevant influencing policies and events? How does the complexity of production-consumption relationships affect the evolution of pairwise risk spillovers between markets? How do risk spillovers differ in the analysis of market linkages in different frequency domains?
The empirical results show that the risk spillover between return and volatility is persistently high between 2016 and 2024. Whereas skewness risk exhibits a short-term high spillover, kurtosis risk is a long-term high spillover, reflecting the complexity of the market in dealing with asymmetric information and extreme events. When the four types of risk rose significantly, they mostly stemmed from government policy support, resource control or international competition. These policies raise market expectations of future returns while triggering an increase in short-term uncertainty, leading to frequent extreme market volatility.
In the pairwise risk premium evolution, after 2017, with the advancement of technology, changes in market demand and the gradual maturity of the relevant industrial chain, specific metals with common consumption and joint production relationships gradually evolved into a major source of risk. In the skewness and kurtosis risk premium analyses, the maximum risk premium value is significantly higher than return and volatility, suggesting the existence of strong asymmetric price volatility risk-transfer effects in the market as well as abnormal volatility connectivity in the face of external shocks.
In the comparative analysis of risky long- and short-term market correlations for each order of moments, it is found that the rare earth market exhibits a more pronounced pattern of long- and short-term correlations. This suggests that rare earths are not only affected by short-term speculative funds and market news, but also driven by long-term supply and demand, industrial policy and other factors. The existence of long- and short-term correlation patterns is of great significance for risk management and investment decisions in the rare earth market.
The contribution of this paper is: 1. To consider risk contagion between markets from the perspective of the production-consumption relationship of co-production and co-consumption. By analysing the price volatility relationship from the raw material side, this approach can capture the market dynamics at the same level in the supply chain in a more scientific way than directly linking the price of rare earth elements to the midstream and downstream industries in the new energy industry. 2. The maximum pairwise spillover index analysis carried out in this paper is able to reveal the interactions between different metals in the evolution of market prices. By examining the maximum pairwise spillover index, we can more clearly identify which materials have significant bilateral relationships with each other and which production-consumption relationships are most susceptible to potential impacts. Through an in-depth study of the maximum pairwise spillover index, we can discover more information about the operating laws of the market and thus provide a more reliable reference for future risk management and decision making. 3. By analysing the evolution of the time-frequency spillover network for different moments of the order of magnitude, it is possible to help investors and policymakers understand the changes in the market structure, and to accurately identify and quantify how rare earth elements influence the price fluctuations of new energy-related metals, thus revealing the price fluctuations, which in turn reveals the transmission mechanism and the time-continuity effects of market risks.
In the remaining chapters of the article, the paper will further demonstrate the significance of this paper by providing a literature review in Chapter 2. The methodology used in this paper is presented in Chapter 3, where readers can deepen their understanding of econometric modelling theory. Chapter 4 contains data selection and descriptive statistical analyses. Detailed empirical analyses will be developed in Chapter 5. Chapter 6 provides a summary of the findings of this paper.
2 Literature review
In recent years, the research literature on rare earths has focused on analysing their importance in financial markets. For example, Baldi et al. [16] show in their paper that there is a negative correlation between rare earths price changes and the stock market performance of some clean energy indices during periods of price increases. Reboredo and Ugolini [17] empirically show that the price linkages between rare earths and other stock markets vary under different volatility mechanisms. Under low volatility rare earth stocks are linked to base metal markets, receiving and transmitting considerable price spillovers. In the high volatility scenario, rare earth prices are more strongly linked to price fluctuations in clean energy, oil and general stock markets.
With the deepening of research, the importance of higher-order moments, time-frequency spillover analysis and its related methods for the analysis of rare-earth market linkages has gradually attracted the attention of scholars. Gao and Liu [18] show empirically that the rare-earth metal (REM) market is a receiver of net spillovers from the base metal, clean energy and ESG markets. Gao et al. [5] reveal a significant higher-order moments correlation between the clean energy and rare-earth markets. In particular, wind and solar exhibit significant net spillovers of skewness and kurtosis to rare earths. These higher-order moment spillovers are time-varying and are exacerbated during major geopolitical crises such as the COVID-19 pandemic and the Russo-Ukrainian war. Ding et al. [19] use a frequency-domain spillover index methodology to find that rare-earth metals are the most susceptible to spillovers from both the clean-energy and the base-metal markets, especially in the long run. Kamal and Bouri [20] used the maximum overlap discrete wavelet transform method to decompose the original return series into different time scales and then analysed the pairwise dependence using vine-copula. The results show that the rare earth market mitigates the dependence between world equities and clean energy markets at different time scales, especially during the COVID-19 epidemic. Zheng et al. [21] examine the volatility spillover effects of the rare earth market with the crude oil, renewable energy, and high-technology markets using a wavelet analysis framework, confirming the importance of rare earths in improving the overall risk transfer of the system. These findings provide new perspectives for understanding the role of rare earths in the global economic system and provide valuable information for relevant policymakers and investors.
It is known from the findings of many scholars that there are differences in the roles of various types of rare earth elements [22–25]. The different production-consumption relationships between rare earths and metal raw materials should be considered in market linkage analyses. Metals used for the same product can be considered as co-consumption metals, and market shocks for this product will affect the price markets of both metals simultaneously. Exploring the linkages within the metals market from a co-consumption perspective can help to get a comprehensive picture of the price volatility patterns in the clean energy metals market, and also help to deepen the understanding of the relationship between the clean energy and metals markets [7]. Regarding co-production, rare earth elements are usually symbiotic, and different rare earth deposits have different rare earth element compositions, which can only be separated through smelting to form different rare earth metals or rare earth oxides [26]. Also rare earths will coexist with minerals such as iron and nickel. This concept emphasises the integrated use of mineral resources, which helps to reduce production costs and increase resource efficiency. Co-production not only makes the production chain more economical, but also promotes environmental protection as it reduces mining pressure on the environment [6]. As a result, the complexity of the two types of production and consumption patterns may make the market volatility and price changes more spillover effects, and the overall impacts of the huge market uncertainty on the industrial chain need to be thoroughly studied and effectively managed [8–11]. It can be seen that many studies mainly examine the metal market as a whole, ignoring the heterogeneity between different clean energy metal markets.
In conclusion, there has been a wealth of research on rare earth markets in recent years, but a number of areas remain worthy of attention. Currently, most of the literature focuses on analysing the overall linkages between the rare-earth market as a whole and other financial markets, and there is a lack of research on the volatility and impacts of individual rare-earth element markets, a perspective that tends to ignore the heterogeneity of the different rare-earth elements and their complexity in co-consumption and co-production with other metals. By analysing the relationship between price fluctuations in terms of raw materials, this approach captures market dynamics at the same level in the supply chain in a more scientific way than by linking rare earth prices directly to midstream and downstream industries in the new energy sector.
Further, there are still areas worth exploring under the “co-production-co-consumption” perspective. Firstly, relevant studies have mainly focused on the traditional metal market, and the dynamic correlation mechanism between rare earth elements and key metals of new energy sources has not been sufficiently explored. Furthermore, most of the existing literature is limited to the analysis of basic risk indicators such as return and volatility, and fails to examine the cross-market contagion law of extreme risk characteristics such as skewness and kurtosis. Finally, research generally lacks systematic analyses of how policy adjustments and market shocks transmit risk through the co-production-consumption channel, and in particular pays insufficient attention to the dynamic evolution of risk contagion. These limitations make it difficult for existing studies to provide comprehensive and effective theoretical support and practical guidance for risk management in the new energy industry chain under the perspective of “co-production and co-consumption”.
In view of the above, this paper analyses the time-frequency risk spillover index under the high-order moment characteristics. In this way, it reveals more comprehensively the risk transmission characteristics between rare earth elements and new energy metals in various events under the perspective of “co-production and co-consumption”. At the same time, we consider the central position of the Chinese market in the global supply chain. It is also important to study the linkages between its rare earth market and other raw materials for the new energy industry. By analysing the dynamics and trends of the Chinese market, we can reveal the role of rare earth elements in supporting the new energy industry. And, it will provide a reference for other countries and enterprises to promote the optimal allocation of global resources and the innovative development of new energy technologies.
3 Methodology
3.1 Higher-order moment risk measures
In this paper, the GJRSK model proposed by Nakagawa and Uchiyama [27] will be used to estimate the conditional volatility, conditional skewness, and conditional kurtosis characteristics of the raw materials and rare earth elements markets in the new energy sector. The model allows for asymmetric responses to positive and negative shocks and is constructed as follows (i.e. Equations 1–6):
Where denotes the return of each market, calculated as . is the price of each market at time , , and denote conditional volatility, conditional skewness and conditional kurtosis, respectively. denotes the information set at . is the probability density function with mean 0, variance 1, skewness and kurtosis . GJRSK GJRSK model can be estimated by maximising the log-likelihood function.
Empirically, the GJRSK model not only measures the magnitude of price rises and falls (e.g., how much a stock has risen or fallen), but also captures extreme changes in market sentiment (e.g., “panic selling” or “excessive speculation”). This helps investors recognise when the market is likely to be volatile or unusual, so they can adjust their strategies in advance.
3.2 Time-domain spillover indexes
The risk spillover analysis in this paper and will be based on the time-varying spillover index, which is an important dynamic connectivity measure proposed by Antonakakis et al. [28] in recent years, which no longer needs to set up a rolling window compared to the previous spillover index, and directly constructs a variance decomposition from the TVP-VAR model to effectively portray the risk spillover effect between different financial markets. Here the TVP-VAR(p) model will be written as (i.e. Equations 7, 8):
The TVP-VAR can be transformed into its vector moving average (VMA) representation (i.e. Equations 9, 10):. is an matrix, is an matrix, and is an matrix. As approaches , Equation 9 can be written as Equations 11, 12: is an matrix. represent the responses of all variables following a shock in variable . The differences between an -step-ahead forecast can be calculated by Equations 13–15: is an column vector with the -th positional element being 1 and the remaining positional elements being 0 and vice versa.
Calculate
, which represents the pairwise directional connectedness from
to
and accounts for the effect of the variable
on the variable
in terms of its forecast error variance share. These variance shares are normalised so that each row adds up to equal 1, which means that all variables together explain 100% of the prediction error variance of the variable. The calculations can be based on
Equations 16–
19:
(1) Total connectedness index
(2) Directional spillover index
Variable from all other variables :
Variable
to all other variables
:
(3) Net spillover index:
3.3 Frequency-domain spillover index
Based on Diebold and Yilmaz [29], and following Ding et al. [30], we construct a stationary VAR model as in Equation 20:where, is the n-vector of returns of China’s commodity and sectoral stock markets at time t. and presents the coefficient matrix and white-noise. Then, we give an infinite moving average form as in Equation 21:where, is the infinite lag polynomial matrix when lag is . Then, we calculate the GFEVD according to Equation 22:where, represents the contribution of the -th variable to the variance of the prediction error of the -th variable at horizon . is the variance matrix of errors matrix. represents the -th diagonal of . Similar to the quantile-based spillover effect, we normalized the spillover effect of each market as Equation 23:
According to Diebold and Yilmaz [29], the total spillover index can be calculated as Equation 24:
According to Baruník and Křehlík [31], we decompose the time domain impulse response to frequency domains by using Fourier transform as Equation 25:
Then we calculate frequency domains of GFEVD as Equation 26:
Then, we can obtain the pairwise spillover as Equation 27:
The pairwise connectedness at the frequency band () is calculated according to Equation 28:
We get the within net pairwise spillover between market and market as Equation 29:
The within total spillover on the band () is calculated according to Equation 30:
The within from spillover, within to spillover and net spillover can be calculated according to Equations 31–33:
A spillover index essentially measures how volatility in one market “contagiously” spreads to other markets. For example, if the price of rare earths suddenly rises as a result of policy tightening, the spillover index is able to quantify the extent and duration of the impact of this event on the price of other metals. This is like a “risk map” for investors, identifying in advance which industries are likely to fluctuate in tandem; and for policymakers, it helps to assess the potential knock-on effects of policy interventions.
4 Data selection and descriptive statistical analysis
In this paper, we build on existing studies [23, 32–41], mapping key raw materials for each industry (Figure 1). Among the raw materials in the new energy industry, we focus on lithium, cobalt, nickel, copper, silicon and silver, which are mineral raw materials with strong co-production relationships, for example, cobalt seldom occurs in the form of independent minerals, and is mainly accompanied by iron, nickel, copper and other minerals; nickel is usually accompanied by minerals such as copper, iron, and platinum group metals, and the ores for the production of nickel are mainly copper-nickel sulphide ores at present; and one of the most important sources of silver is the production of copper and associated ores of lead-zinc ores, and silver is produced as a by-product of copper or lead-zinc production. Rare earth elements are symbiotic, and here we choose cerium, dysprosium, lanthanum, neodymium, terbium and praseodymium, which have wider application fields and larger consumption, as the core. The rapid development of the new energy industry has led to a sharp increase in the consumption of these metal raw materials, and the different raw materials show a clear co-consumption relationship, in which copper is widely used in wires, connectors and other components for conducting and transmitting electricity; lithium, cobalt and nickel are mainly used in battery-based energy storage devices; silver and silicon are the main materials for solar cells, which are used in the manufacture of photovoltaic cells in the main body structure; cerium, dysprosium, Cerium, dysprosium, lanthanum, neodymium, terbium, praseodymium and other rare earth elements are indispensable metal raw materials for permanent magnetic materials, hydrogen storage materials, luminescent materials and alloy materials.
FIGURE 1
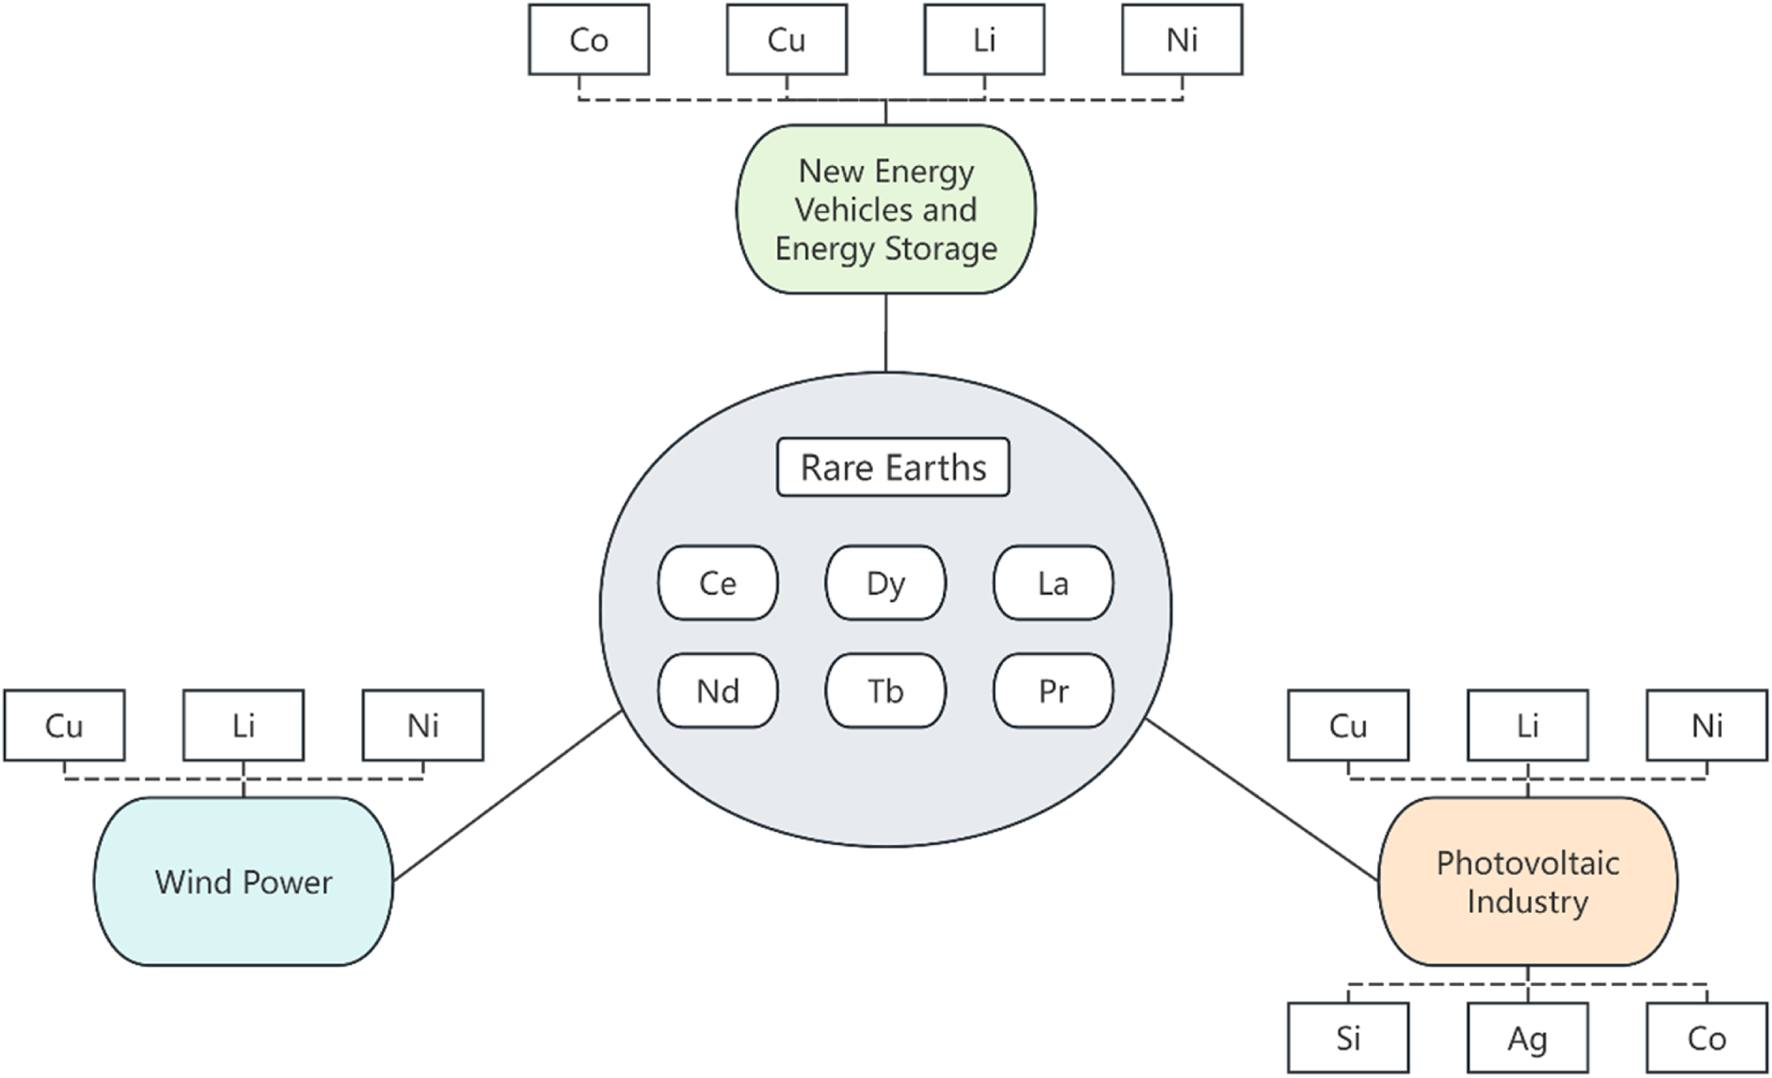
Critical raw materials by industry.
As four resources, lithium, cobalt, nickel and silver, are dependent on large imports in China for their production, meaning that their international market prices have a significant impact on domestic prices, we have mainly used the global price indices provided by the International Monetary Fund when analysing these four markets. For the remaining eight raw materials and rare earth elements, Chinese domestic market prices are used (data from WIND database). This approach not only better reflects the impact of international price fluctuations of import-dependent resources on the domestic market, but also helps to understand the risk-transfer relationship between the domestic market and the international market, thus providing insights of more practical value for policymaking and market analysis. Based on data availability, the selected sample starts and ends from May 2014 to September 2024 and contains a total of 125 sample observations. The return series for each market are obtained through logarithmic differencing. The return series is the core series studied in this paper, and descriptive statistics are provided here, while the corresponding time series are plotted, i.e., shown in Figure 2. Table 1 shows the descriptive statistics, where skewness is used to measure the asymmetry of the data distribution. Positive skewness implies that the long tail is on the right; negative skewness is the opposite. Ce (cerium) shows a significant negative skewness of −3.24, indicating that the distribution is significantly skewed to the left. Kurtosis measures how sharp or flat the data distribution is. A high kurtosis means that it is sharper (has more extreme deviations) than the normal distribution. Si (silicon) and Nd (neodymium) show very high kurtosis of 30.50 and 29.73 respectively, implying that their data distributions have high peaks. In terms of kurtosis, the values are mostly greater than 3, indicating that the data distribution has sharp peaks and heavier tails, implying that there are more extremes (outliers) in the data, indicating a higher risk. The ADF values are the results of the unit root test, and the values show that all the series are smooth. The specific descriptive statistics values are shown by Table 1.
FIGURE 2
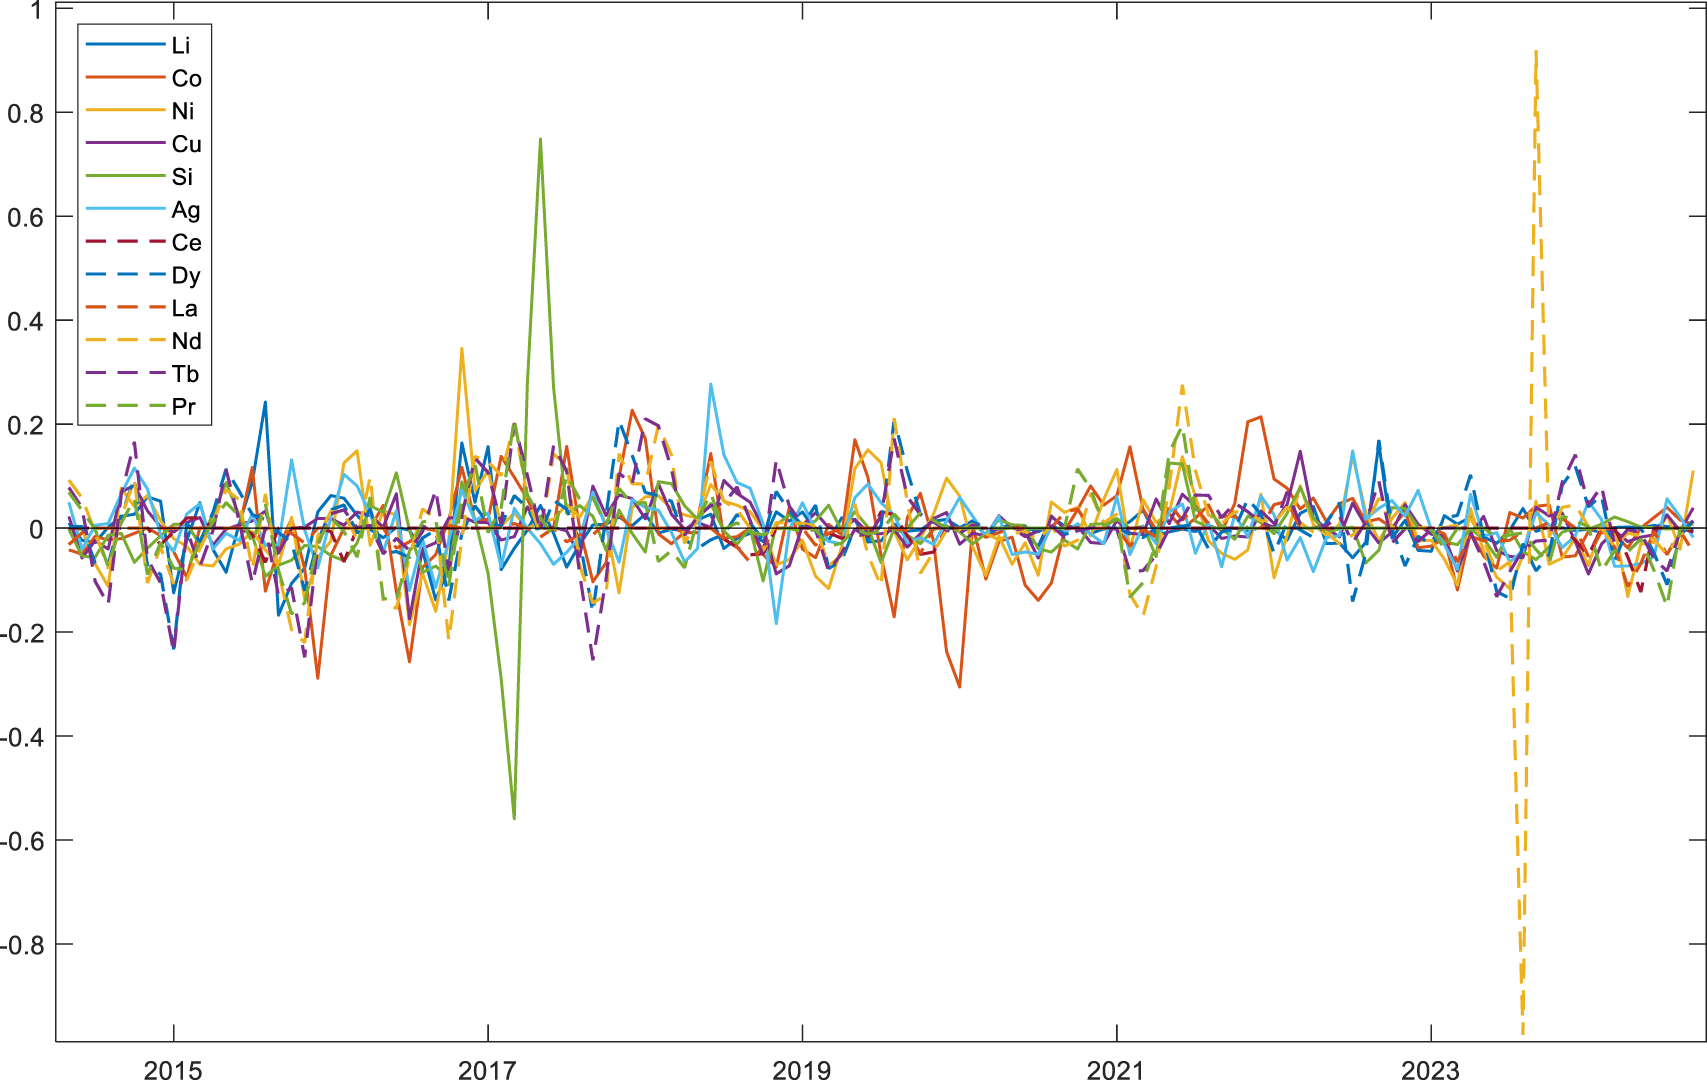
Time series of returns across markets.
TABLE 1
| Metals markets | N | Max | Min | Mean | Std_Dev | Skewness | Kurtosis | ADF_Value |
|---|---|---|---|---|---|---|---|---|
| Li | 125.00 | −0.26 | 0.37 | 0.00 | 0.08 | 1.04 | 6.03 | −7.20 |
| Co | 125.00 | −0.31 | 0.23 | 0.00 | 0.09 | −0.48 | 2.54 | −3.60 |
| Ni | 125.00 | −0.19 | 0.35 | 0.00 | 0.07 | 0.73 | 2.88 | −4.89 |
| Cu | 125.00 | −0.17 | 0.15 | 0.00 | 0.04 | −0.34 | 3.37 | −4.32 |
| Si | 125.00 | −0.56 | 0.75 | 0.00 | 0.10 | 1.96 | 28.68 | −5.14 |
| Ag | 125.00 | −0.18 | 0.28 | 0.00 | 0.06 | 0.72 | 3.23 | −5.47 |
| Ce | 125.00 | −0.12 | 0.03 | −0.01 | 0.02 | −3.28 | 14.58 | −4.71 |
| Dy | 125.00 | −0.23 | 0.21 | 0.00 | 0.06 | 0.04 | 2.54 | −6.49 |
| La | 125.00 | −0.11 | 0.05 | −0.01 | 0.02 | −1.25 | 5.08 | −3.58 |
| Nd | 125.00 | −0.97 | 0.92 | 0.00 | 0.15 | −0.40 | 27.88 | −5.55 |
| Tb | 125.00 | −0.25 | 0.21 | 0.00 | 0.08 | −0.24 | 1.66 | −5.29 |
| Pr | 125.00 | −0.17 | 0.21 | 0.00 | 0.06 | 0.21 | 2.50 | −4.39 |
Descriptive statistics.
5 Empirical analysis
5.1 Total spillover
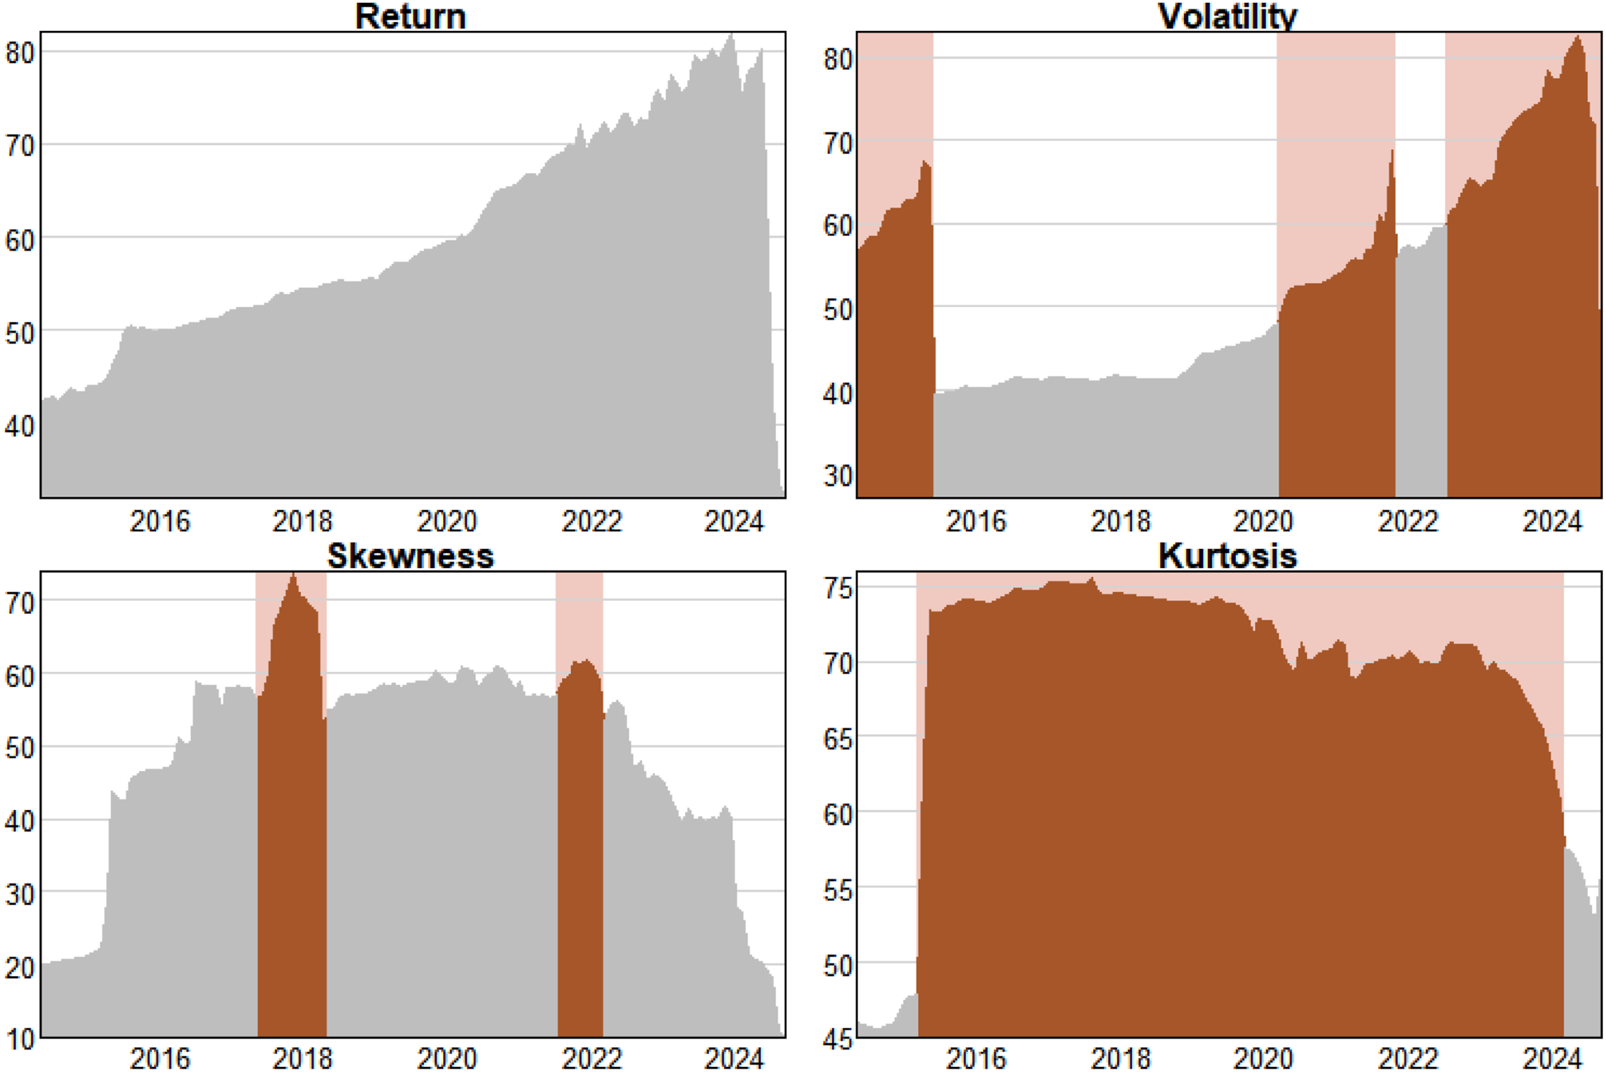
Figure 3 illustrates the overall spillover index between new energy-related metals and rare earth elements based on different order moment risk analyses, with higher values indicating a higher overall correlation between rare earths and raw material markets in the new energy sector. The shaded areas mark time periods with high risk spillovers due to policy impacts. The overall trend of the risk spillover between returns and volatility shows a more consistent upward trend, especially between 2016 and 2024. However, there are three key time periods in the total spillover index on volatility risk that are worth keeping an eye on - May 2014 to June 2015, March 2020 to November 2021, and July 2022 to September 2024. There are several policies in the three timeframes that have significantly impacted the market. For example, in May 2014, China released a draft Rare Earth Industry Development Plan (2016–2020), which aims to consolidate rare earth resources, improve the efficiency of resource utilisation, and stimulate domestic and foreign investment. Although this is a medium- to long-term plan, its expected effects caused market volatility in rare earth prices during the pre-implementation discussion phase, leading to investor sentiment swings and exacerbating risk spillovers.
FIGURE 3
Total spillover index.
In contrast, the number of time periods with high spillover of skewness risk is small and relatively short-lived, reflecting short-term irrational behaviour in the market, where investors may make quick decisions in the face of sudden good or bad news, leading to sharp price fluctuations in the market. However, such volatility is usually temporary and the market may quickly return to rationality as sentiment settles. Important periods of high spillover of such risks include May 2017 to May 2018 and June 2021 to March 2022. Among the typical policies are, in late December 2016, China’s Ministry of Industry and Information Technology (MIIT) and eight other departments jointly issued a circular to carry out a special operation to crack down on rare earth violations nationwide from December 2016 to April 2017 in order to further regulate the order of the rare earth market. In July 2017, the Chinese government announced that it would continue to implement the rare earth export quota system and adjust the rare earth export quota for the second half of 2017 and the first half of 2018. In addition, the state conducted a total of three rare earth storage in 2017, and the storage price was gradually increased. These policies have intensified market concerns over rare earth supply, driving up prices in the international market and increasing the risk of bias in rare earth-related materials (e.g., lithium hydroxide, lanthanum, neodymium, etc.).
Cycles of high spillovers of kurtosis risk are longer in duration, reflecting the market’s continued concern and patience with extreme situations or extreme returns. That is, when peak degree risk occurs in one market, investors may increase their alertness to potential crises, and this alertness can influence trading decisions in other markets, leading to the frequency of extreme volatility being correlated across markets. Specifically, between March 2015 and February 2024, spillover levels remain above 60% overall, suggesting that on average, more than 60% of the kurtosis risk shocks to each variable come from other variables.
Combining the timing of high spillovers for different risk types, we are particularly concerned about the period from June 2021 to November 2021, when all four types of risks show a significant uptick. Several factors drove this scenario. First, government policies supported the rapid development of the new energy industry. Second, controls on rare earth resources tightened. Third, geopolitical competition for resources intensified. For example, in 2021 China implemented regulatory measures on rare earth production. These aimed to reduce overcapacity and improve environmental protection.
According to the theory of industrial organisation, policy adjustments will directly affect the cost structure and competitive landscape of enterprises. The rare earth production restriction policy has compressed supply and pushed up raw material prices in the short term, but due to the lack of clear market expectations about the future direction of the policy, it is difficult for enterprises to form stable long-term investment decisions. This divergence in expectations has led to sharp fluctuations in investor sentiment, with prices deviating from fundamentals and triggering an overreaction in the market. In addition, as the rare earth industry has a high degree of concentration and barriers to entry, policy changes will affect downstream new energy companies through the supply chain step by step. With asymmetric information, downstream companies may stockpile inventory or adjust their purchasing strategies due to concerns about supply shortages, further exacerbating price volatility and market instability. This process fully reflects the complexity of market dynamics under changing policy environments, and confirms the logic of industrial organisation theory about the interaction of policy shocks, market structure and irrational behaviour.
5.2 Net spillover
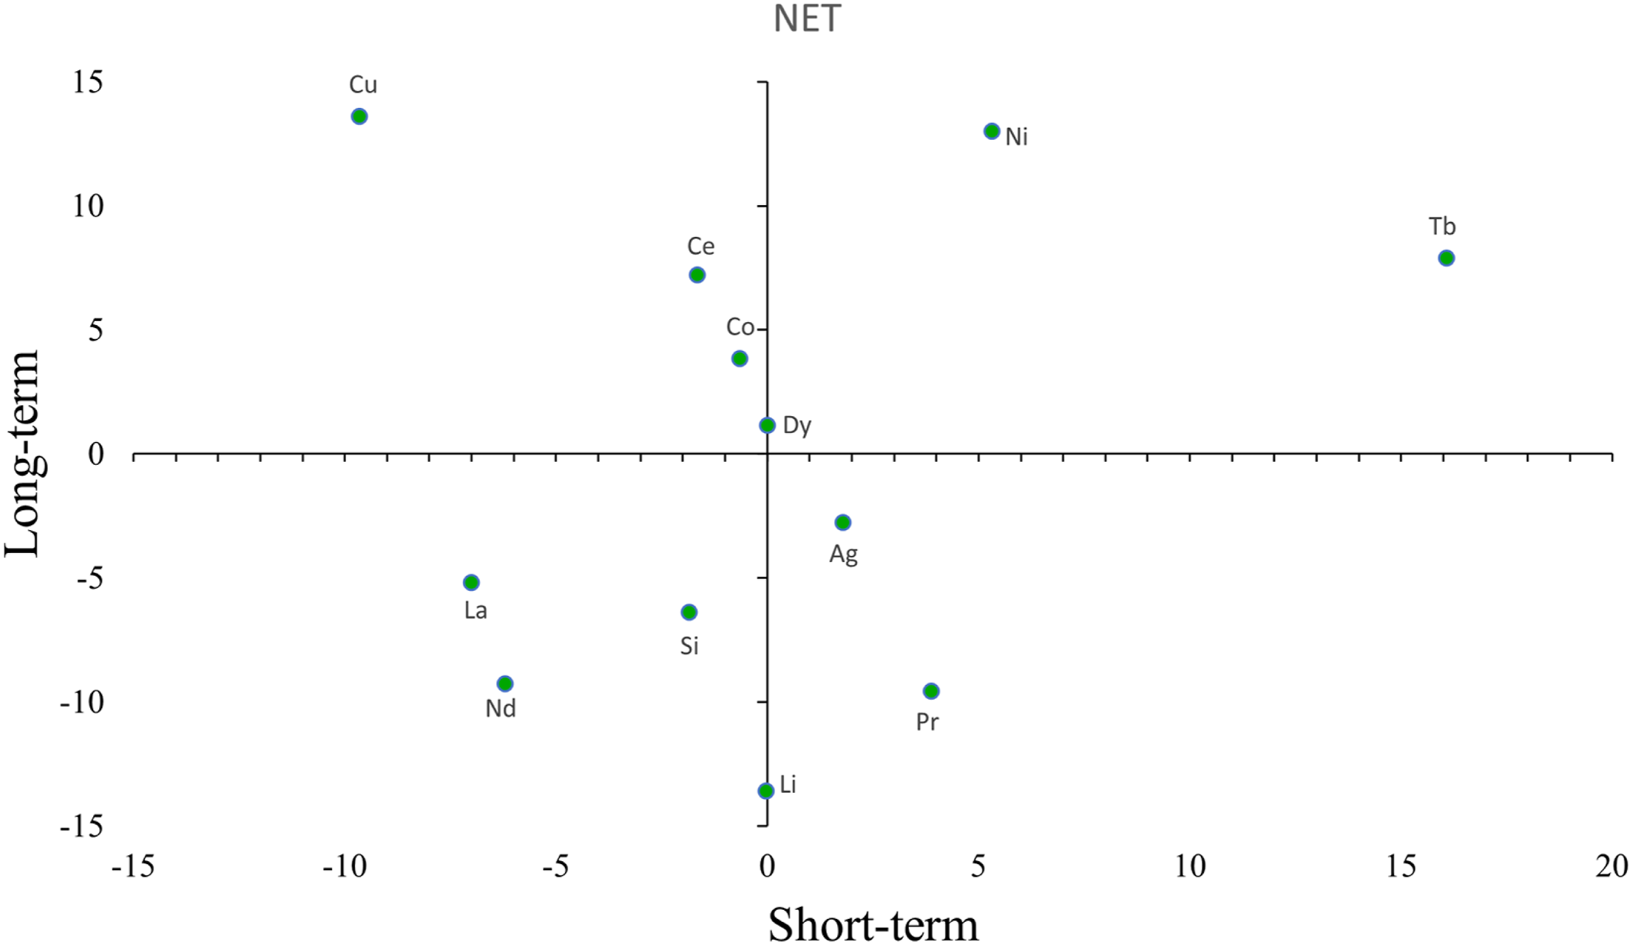
The NET Spillover Index shows information about the direction of volatility, with a negative (positive) value meaning that a market receives (transmits) more risk spillover than it transmits (receives). Markets that show significant positive values are the main risk emitters within that system. The main risk premium emitters in the four types of risk premium systems mostly contain rare earth element markets, as described below:
Figure 4 shows a graph of net return risk spillovers. Terbium has long been the main risk emitter within the system in this type of risk. Silicon and lanthanum, on the other hand, have positive net spillover indexes until 2022, but have shifted to negative as the main risk takers in recent years. This shift may be due to multiple factors such as industry dynamics, market demand fluctuations, supply chain issues and changes in the policy environment, which have led both to show greater vulnerability to external shocks and increased sensitivity to market volatility. In contrast to silicon and lanthanum, dysprosium has a predominantly negative net spillover index until 2023, but has become an external emitter of risk in recent years. In contrast, only cobalt and cerium have had negative net spillover indexes for a long period of time, and both are highly vulnerable to fluctuations in return risk in other markets.
FIGURE 4
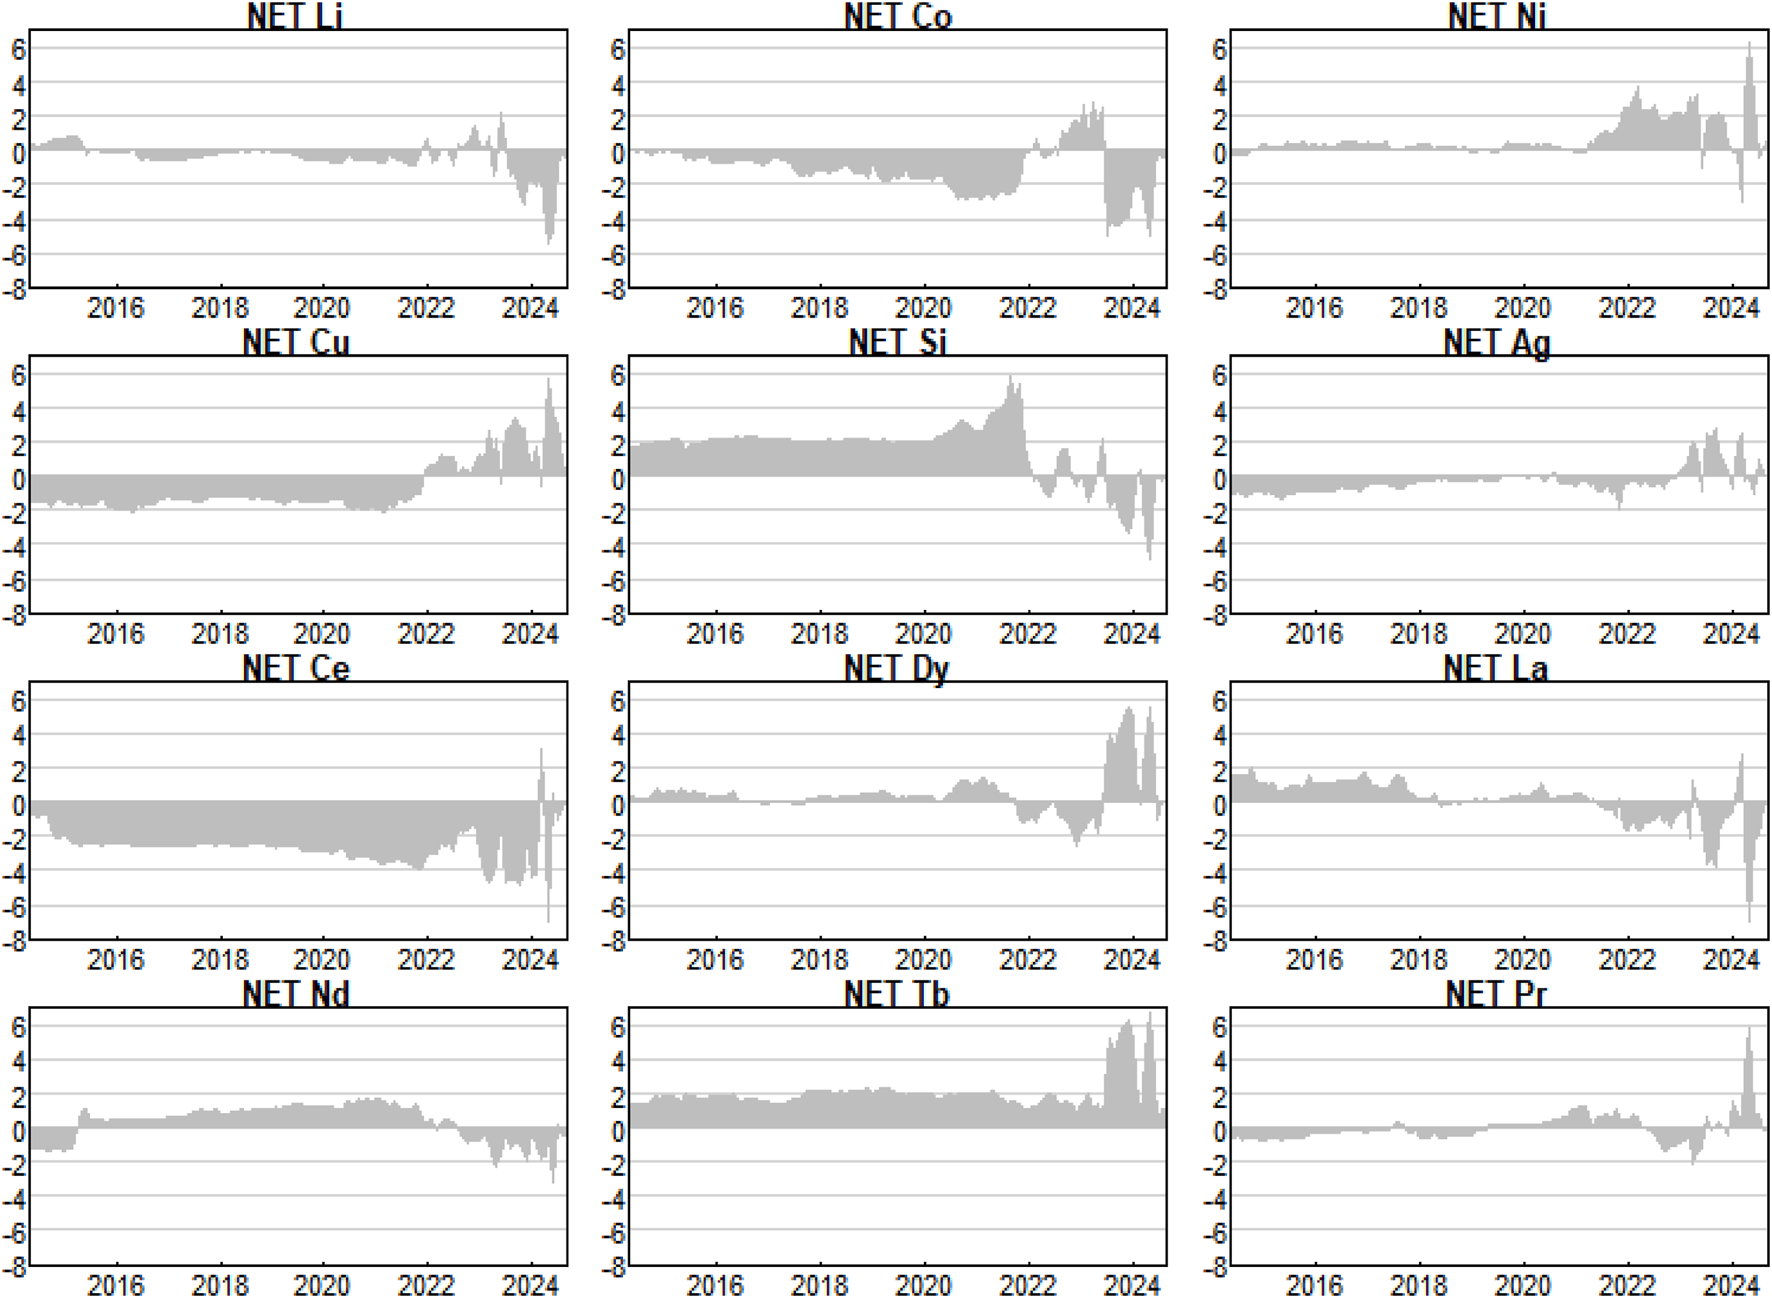
Net spillover of return.
The net volatility spillover (Figure 5) shows cobalt, dysprosium and neodymium as the main risk emitters from May 2014 to June 2015, with neodymium in particular showing extremely significant risk spillover during this period. In early to mid-2015, China implemented a series of regulatory policies targeting rare earth resources. By restricting rare earth mining and export quotas, China increased its management of this important resource. These policies triggered significant changes in supply and demand, with neodymium in particular attracting significant attention due to its key applications in new energy sectors such as NdFeB permanent magnets used in electric vehicles and wind turbines. As uncertainty about the market supply of neodymium intensified, companies and investors reacted strongly to price fluctuations in neodymium, leading to spillover of volatility risk to the new energy materials market and other rare earth element markets.
FIGURE 5
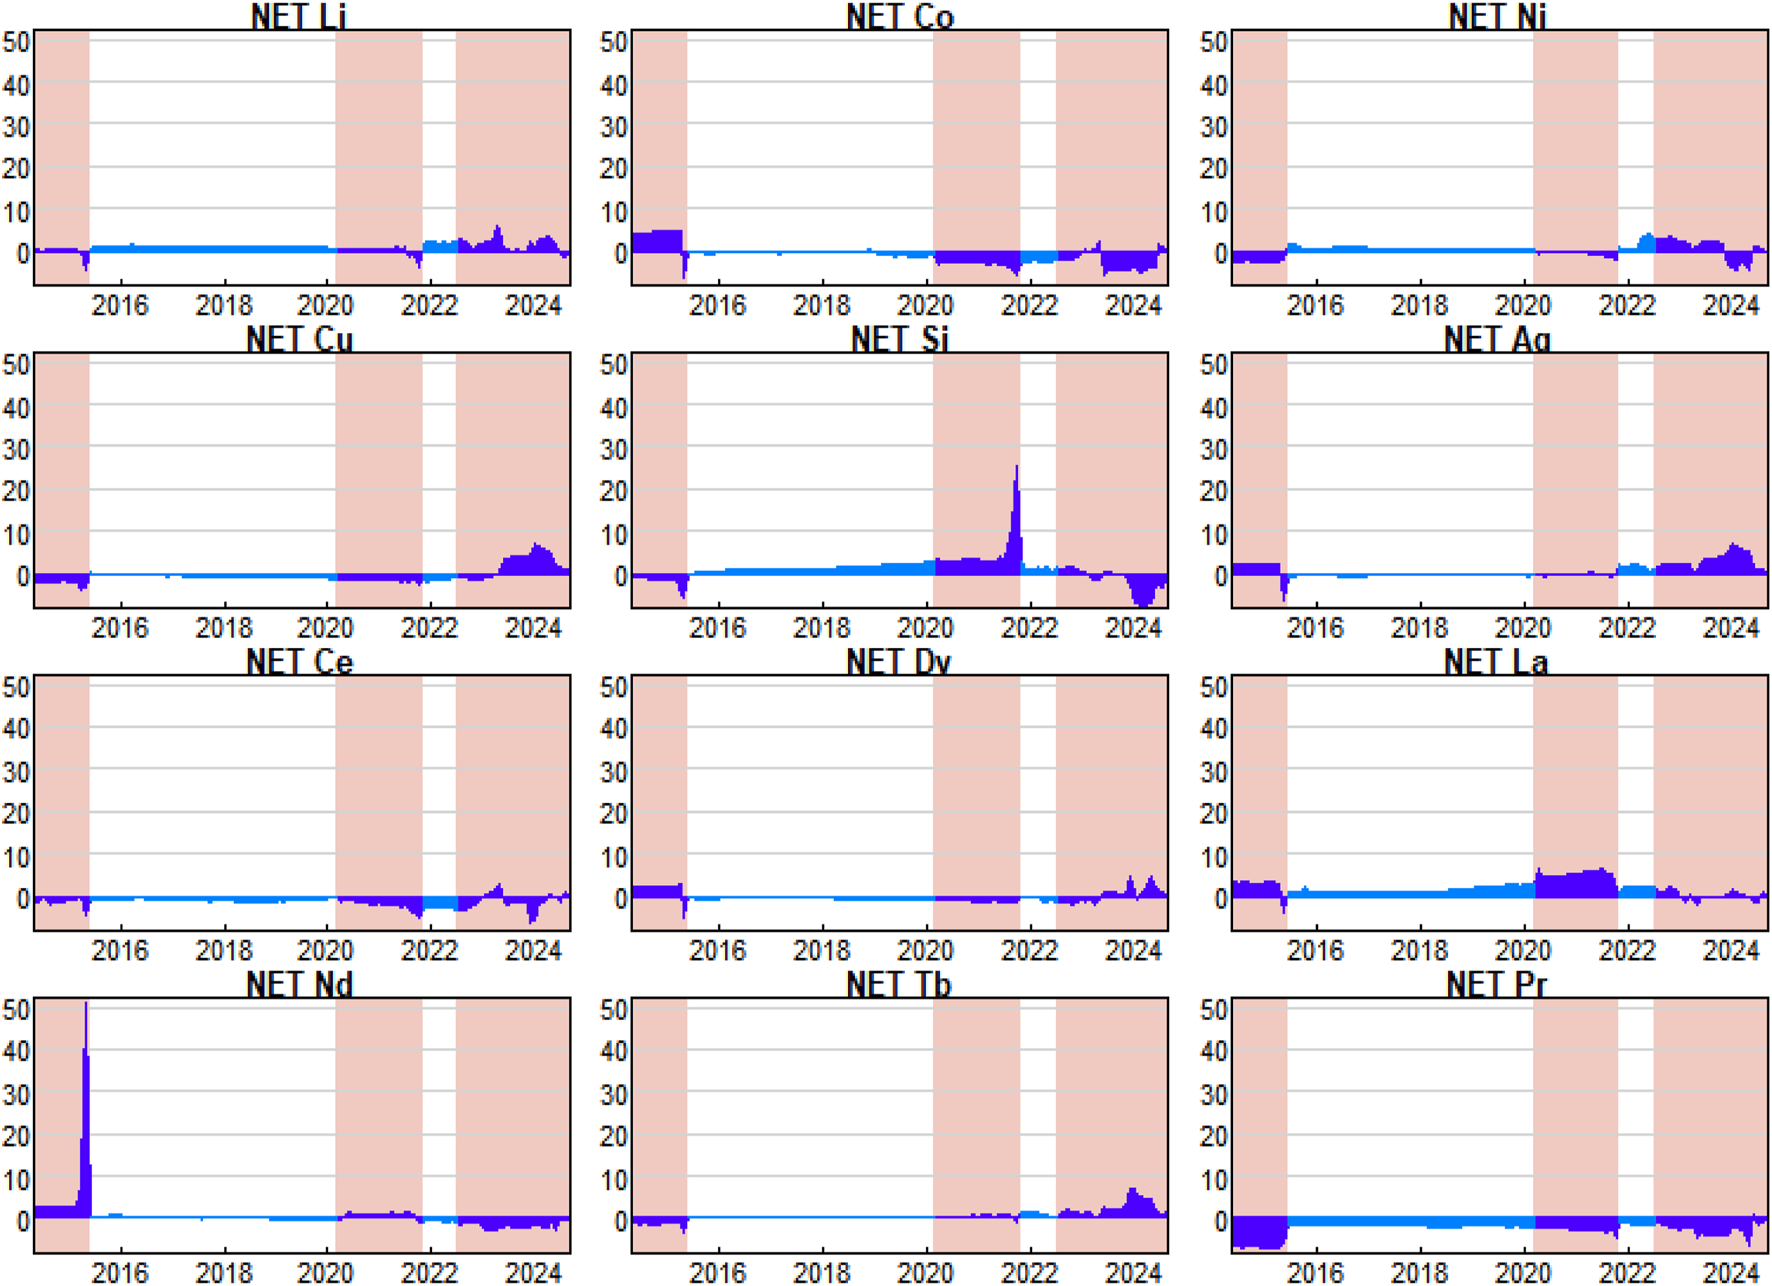
Net spillover of volatility.
During the period from March 2020 to November 2021, silicon and lanthanum become the main volatility risk emitters. With the development of new energy industries such as photovoltaics, silicon as the main material for photovoltaic cells, and lanthanum with its high light-absorption capacity and wide bandgap characteristics, which can significantly improve the photovoltaic conversion efficiency, stability, and lifespan of solar cells, the co-consumption of silicon and lanthanum is becoming more pronounced, and the complementary nature of the two improves the overall efficiency of the photovoltaic system. Other new energy materials and rare earth elements are dependent on the performance of silicon and lanthanum in the supply chain, which makes them risk takers, and when silicon and lanthanum price volatility intensifies, the overall supply chain and price stability are impacted, creating a new market risk transmission mechanism.
After July 2022, a new situation emerged in the market. Copper, silver and terbium have become major volatility risk emitters, a change largely driven by the global economic recovery, green technology transition and accelerating growth in the electric vehicle industry. As renewable energy sources and electric vehicles gain popularity, the importance of copper as a key conductor in batteries, charging infrastructures and other electronic devices has risen significantly, leading to a surge in its demand. Meanwhile, increasing use of silver in photovoltaic cells and highly conductive materials has also contributed to its market volatility. Moreover, rising consumer demand for terbium, a rare earth material widely used in high-efficiency motors and green technology devices, further pushed up prices and volatility. A series of macro policies, such as national support policies for green energy and electric mobility, have increased the demand for these materials, causing their supply and demand to change, with a corresponding increase in volatility and risk, creating new market headwinds.
Skewness and kurtosis, as quantifications of extreme risk spillovers, have similar spillover patterns (See Figures 6, 7). Neodymium is the main risk emitter of skewness and kurtosis risk. This is mainly due to the high consumption and volatility of supply and demand of neodymium2, which directly affects the production cost and market price of related materials (e.g., NdFeB permanent magnets contain 25%–32% of rare-earth elements, of which neodymium accounts for more than 90%) [42]. As an important rare earth element, the mining and supply of neodymium is often affected by multiple factors such as policy, environment and international trade. Meanwhile, due to the irreplaceable nature of neodymium in permanent magnet materials, its supply elasticity is low, resulting in price fluctuations that are more easily transmitted to downstream industries, further exacerbating its volatility in the market. When the market price of neodymium fluctuates dramatically, it not only triggers investors in the new energy materials market to react quickly and adjust their investment strategies, but also causes a spreading effect of kurtosis and skewness risk in other related markets due to concerns about rising costs and supply uncertainty, thus exacerbating volatility across the market.
FIGURE 6
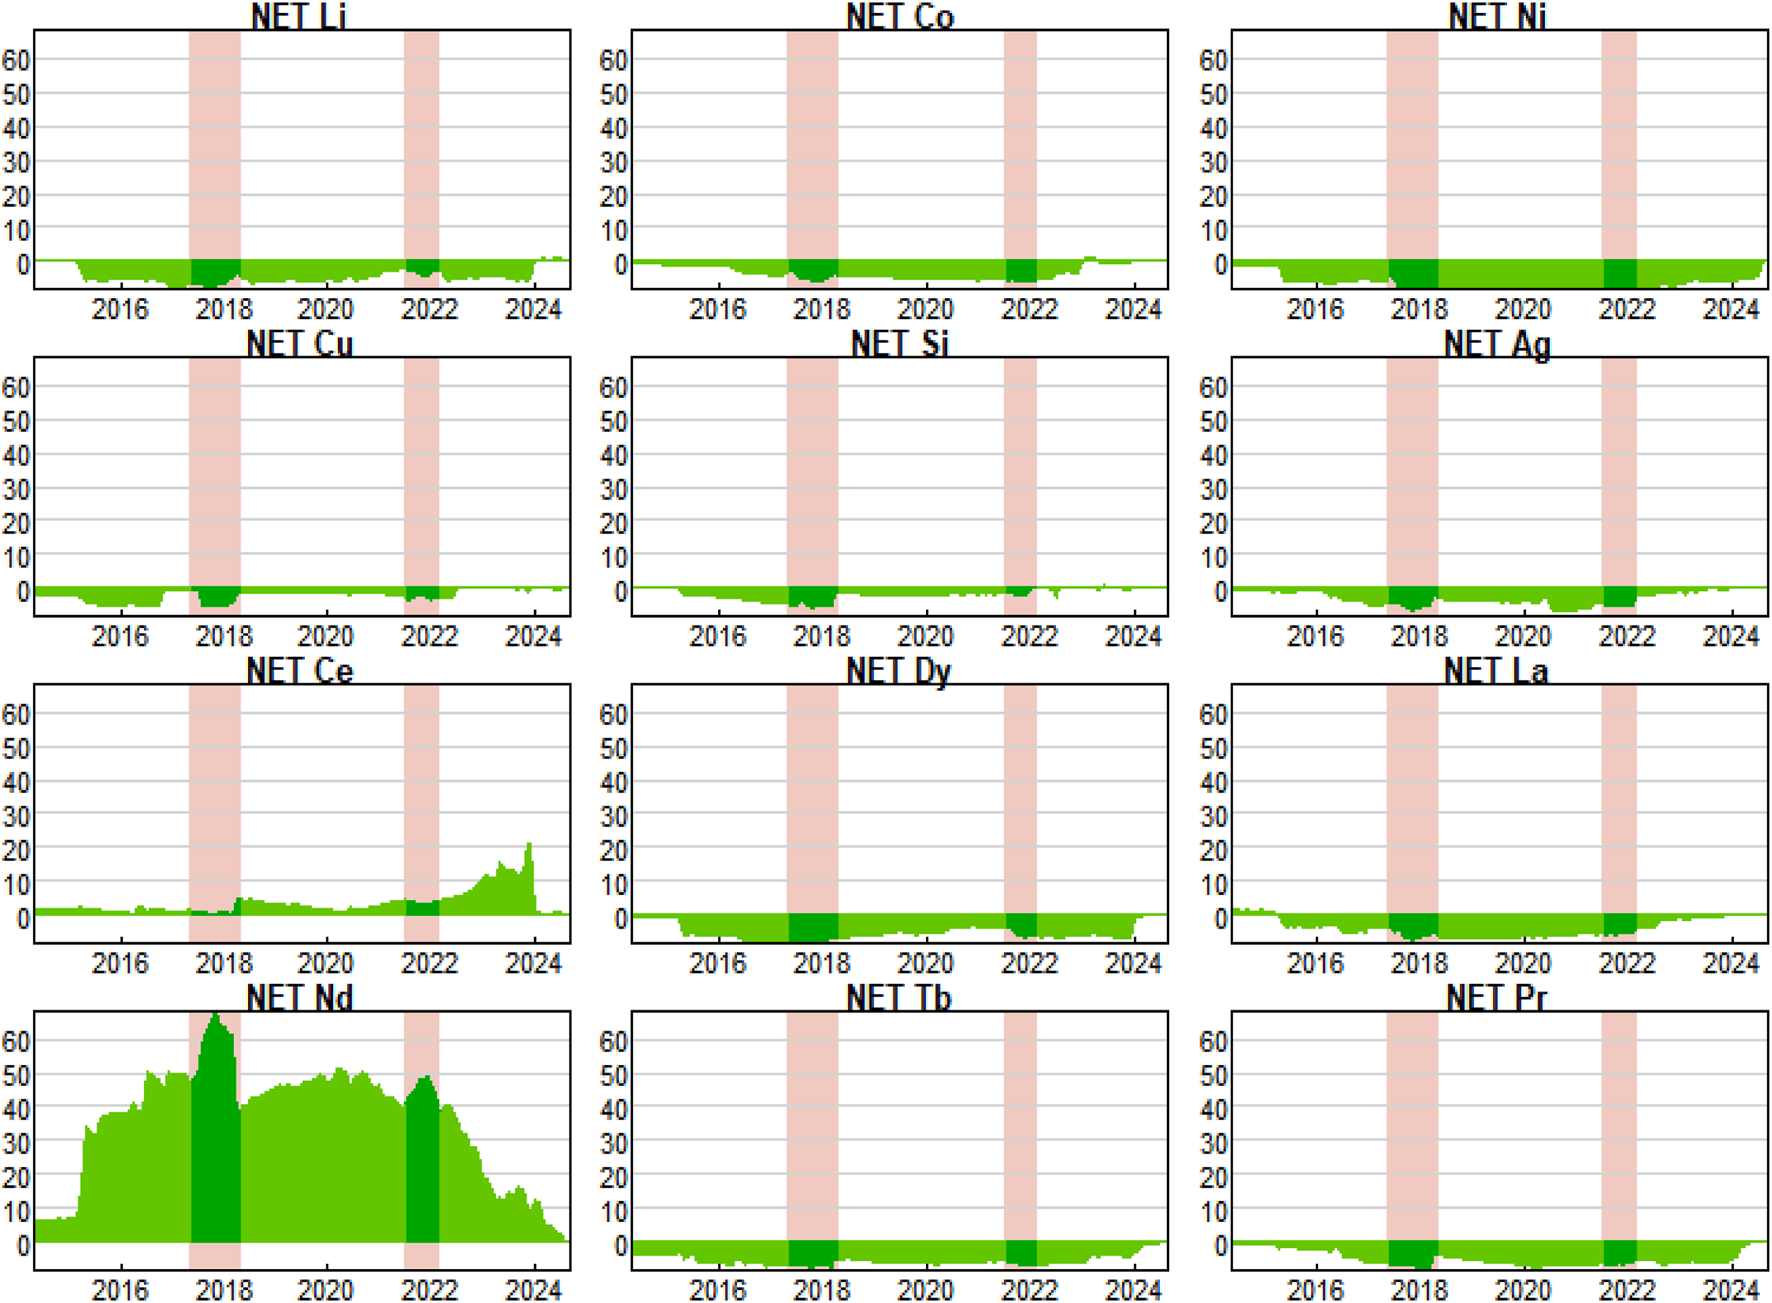
Net spillover of skewness.
FIGURE 7
Net spillover of kurtosis.
Although cerium, dysprosium, lanthanum, terbium and praseodymium are also used in new energy materials, their market demand is relatively stable and their price movements are small, lacking the dramatic volatility similar to neodymium. Cerium is mainly used in catalysts, dysprosium is used in high-temperature superconducting materials, while lanthanum, terbium and praseodymium are also mostly used in relatively niche applications, where the demand is not as concentrated and strong as neodymium’s, and thus its influence is limited and fails to create significant kurtosis risk. This difference makes neodymium more prominent as a risk emitter in the market for new energy materials.
5.3 Static spillover analysis
For static return spillover (see Table 2), the FROM column shows the sum of accepted return risk spillover. In this column, the maximum values for new energy-related metals and rare earth elements are 63.8% and 71%t for copper and terbium, respectively. They are the main recipients of return risk in their respective areas. Correspondingly, copper accepts risk mainly from nickel and silver, and terbium mainly from praseodymium and neodymium. The TO row is the sum of the market’s share of risk spillovers to other objects, and in this row we focus on nickel and dysprosium, which are the main senders of volatility and to which markets should pay extra attention for the impact of spillover yield risk. The NET row shows the difference between the sum of the columns and the sum of their own rows, which provides the share of net volatility shocks, with a maximum value of 18.6 percent for silicon and a minimum value of −31.5 percent for cerium.
TABLE 2
| Metals markets | Li | Co | Ni | Cu | Si | Ag | Ce | Dy | La | Nd | Tb | Pr | From |
|---|---|---|---|---|---|---|---|---|---|---|---|---|---|
| Li | 40 | 2.8 | 8.4 | 5.4 | 1.9 | 6.7 | 6.6 | 3.2 | 4.3 | 7.1 | 7.1 | 6.5 | 60 |
| Co | 5.3 | 42.4 | 4.1 | 1.8 | 4.4 | 4.4 | 1.7 | 5.9 | 8.5 | 8 | 6.6 | 6.8 | 57.6 |
| Ni | 6.9 | 5.2 | 38.1 | 13.4 | 1.8 | 10.7 | 3 | 3.1 | 4.2 | 2.7 | 7 | 4 | 61.9 |
| Cu | 3.6 | 6.2 | 12.1 | 36.2 | 3.9 | 11.9 | 2.2 | 4.1 | 6.8 | 2.6 | 7.6 | 2.8 | 63.8 |
| Si | 2.3 | 4.4 | 1.4 | 2.3 | 70.3 | 4.1 | 1.7 | 2.7 | 4.8 | 1.4 | 1.9 | 2.8 | 29.7 |
| Ag | 2.2 | 4.6 | 12.5 | 11 | 9 | 42.1 | 2 | 5 | 3.1 | 1.7 | 5.5 | 1.4 | 57.9 |
| Ce | 9.8 | 4.8 | 5.1 | 6.4 | 2.3 | 3.9 | 36.3 | 8.7 | 4.5 | 6.2 | 7 | 5 | 63.7 |
| Dy | 4.1 | 1.2 | 4.7 | 4.4 | 5.6 | 4.6 | 2.3 | 32.6 | 2.5 | 10.2 | 21 | 6.9 | 67.4 |
| La | 4.7 | 3.6 | 2.6 | 2.8 | 6.3 | 3.1 | 4.8 | 4.5 | 52.1 | 5.2 | 3.5 | 6.7 | 47.9 |
| Nd | 5.8 | 3.3 | 5.1 | 1.6 | 4.7 | 1.4 | 2.8 | 10.1 | 4.1 | 31.6 | 15.4 | 14.2 | 68.4 |
| Tb | 4.7 | 4.6 | 6.7 | 4.3 | 4.9 | 2.5 | 1.8 | 17.3 | 2.7 | 12.1 | 29 | 9.3 | 71 |
| Pr | 5.8 | 3.8 | 7.6 | 2.1 | 3.5 | 1.3 | 3.3 | 8.1 | 3.7 | 15 | 12.6 | 33.1 | 66.9 |
| TO | 55.3 | 44.6 | 70.2 | 55.5 | 48.3 | 54.5 | 32.2 | 72.9 | 49.2 | 72.2 | 95 | 66.3 | TCI |
| NET | −4.7 | −13 | 8.4 | −8.4 | 18.6 | −3.4 | −31.5 | 5.4 | 1.2 | 3.8 | 24 | −0.5 | 59.7 |
Static spillovers of return.
In terms of volatility (see Table 3), some of the values in the “FROM” column are slightly above returns, represented by silver and terbium, which receive the most volatility risks. Silver is particularly exposed to the volatility of copper and terbium, which we consider to be due to the co-consumption and co-production of silver, copper and terbium, mainly in electronics and high-tech applications. Silver and copper are widely used in electrical conductors, while terbium, a rare earth element, often plays an important role in electronic devices such as fluorescent displays and computer memory components. The smelting of copper ores is often accompanied by the extraction of silver in the production process. In addition, market dynamics of copper and terbium can influence the demand for silver, e.g., fluctuations in copper prices can lead to changes in the cost of electronics, which in turn affects silver consumption. Thus, the interrelationship between the three not only promotes the integrated utilisation of resources, but also creates a strong link at the technical and market levels. The volatility risk of terbium, on the other hand, arises mainly from lithium and dysprosium, which play an important role in the new energy and high-tech industries, with lithium being a key component of lithium-ion batteries and dysprosium being an important rare earth element used in the manufacture of high-performance permanent magnet materials.
TABLE 3
| Metals markets | Li | Co | Ni | Cu | Si | Ag | Ce | Dy | La | Nd | Tb | Pr | From |
|---|---|---|---|---|---|---|---|---|---|---|---|---|---|
| Li | 47.6 | 4.9 | 4.1 | 2.4 | 6.5 | 3.8 | 9.1 | 3.5 | 7.7 | 4.5 | 3.2 | 2.6 | 52.4 |
| Co | 6.5 | 42.2 | 4.9 | 3.1 | 4.4 | 6.4 | 6.9 | 3 | 12.1 | 5.4 | 4 | 1.1 | 57.8 |
| Ni | 3.2 | 4.3 | 53.6 | 3.5 | 4.4 | 2.3 | 6.2 | 3.7 | 6 | 3.3 | 3.6 | 5.9 | 46.4 |
| Cu | 2.1 | 2.1 | 1 | 51.8 | 1.5 | 15.5 | 1.7 | 3.1 | 2.5 | 1.4 | 16.3 | 1 | 48.2 |
| Si | 3.1 | 2.3 | 1.4 | 1.8 | 57.2 | 8.6 | 2.3 | 2.1 | 7.1 | 5.7 | 7.5 | 1 | 42.8 |
| Ag | 4.1 | 6.5 | 4.1 | 10.8 | 4.9 | 37.6 | 2.5 | 2.8 | 4.9 | 7.6 | 11.1 | 3.2 | 62.4 |
| Ce | 7.1 | 6.2 | 13.1 | 3.8 | 10.7 | 4.5 | 37 | 3.3 | 6.2 | 1.9 | 3.4 | 2.8 | 63 |
| Dy | 5.8 | 3.4 | 5 | 1.1 | 2.7 | 3.2 | 3.1 | 53 | 2.6 | 3.6 | 13.2 | 3.5 | 47 |
| La | 5 | 3.3 | 2.8 | 3.4 | 4.7 | 8.2 | 2.6 | 2 | 55.9 | 7.5 | 3.8 | 0.8 | 44.1 |
| Nd | 4.8 | 2.7 | 5.3 | 1.5 | 2.7 | 3.1 | 4 | 2.8 | 7.2 | 55 | 5.1 | 5.8 | 45 |
| Tb | 13.7 | 2.1 | 3.2 | 9.6 | 5.5 | 11.5 | 1.9 | 11.5 | 4.1 | 3.2 | 32.2 | 1.7 | 67.8 |
| Pr | 8.1 | 8.1 | 3.5 | 1.9 | 5.6 | 3.6 | 6.2 | 5.6 | 5.6 | 7 | 5.1 | 39.7 | 60.3 |
| TO | 63.8 | 45.8 | 48.4 | 42.8 | 53.6 | 70.7 | 46.5 | 43.3 | 66 | 50.9 | 76.1 | 29.5 | TCI |
| NET | 11.4 | −12 | 2 | −5.4 | 10.7 | 8.3 | −16.6 | −3.7 | 21.9 | 5.9 | 8.3 | −30.8 | 53.1 |
Static spillovers of volatility.
Compared to the first two types of static spillovers, the static spillovers of skewness and kurtosis are a more intuitive reflection of the dominant role of neodymium in extreme risk spillovers, with significantly higher values of external spillovers than in other markets (see Tables 4, 5). In skewness risk, neodymium mainly affects nickel and terbium. In the kurtosis risk scenario, neodymium mainly affects cobalt and praseodymium. The impact of neodymium on nickel and terbium in the skewness risk spillover scenario reflects the asymmetric response of the market to the technological applications of these metals. Nickel, as an important component of battery materials and alloys, is susceptible to fluctuations in neodymium supply, leading to skewed price movements, while terbium’s importance in photovoltaic applications makes it highly sensitive to changes in neodymium supply and demand, which in turn leads to skewness risk spillovers. In comparison, kurtosis risk spillover focuses on the fatness of the tails of the return distribution, indicating a higher probability of extreme events. The impact of neodymium is more pronounced for cobalt and praseodymium, with cobalt having a strong correlation with neodymium market dynamics in the context of high demand scenarios from the electric vehicle industry and new energy industry. Praseodymium and neodymium are both light rare earth elements with a close co-production relationship, and the rapid increase in neodymium consumption has created a surplus in the praseodymium market [26]. When the supply of neodymium fluctuates, especially in the event of production disruptions or policy adjustments, the supply and price of cobalt and praseodymium are also affected, leading to extreme price volatility in their markets, reflecting a clear kurtosis risk spillover effect.
TABLE 4
| Metals markets | Li | Co | Ni | Cu | Si | Ag | Ce | Dy | La | Nd | Tb | Pr | From |
|---|---|---|---|---|---|---|---|---|---|---|---|---|---|
| Li | 30 | 0.6 | 0.3 | 0.7 | 0.4 | 0.6 | 11 | 4.2 | 3.1 | 46.9 | 1.4 | 0.8 | 70 |
| Co | 0.8 | 57.4 | 0.7 | 1.8 | 0.7 | 0.5 | 1.5 | 0.5 | 1 | 34.1 | 0.6 | 0.3 | 42.6 |
| Ni | 3.3 | 0.3 | 19.9 | 1.3 | 0.4 | 1.2 | 1.2 | 0.5 | 1.5 | 66.8 | 3.1 | 0.5 | 80.1 |
| Cu | 1.5 | 0.9 | 1.1 | 66.3 | 8.1 | 0.6 | 0.9 | 0.8 | 0.4 | 18.8 | 0.5 | 0.2 | 33.7 |
| Si | 0.3 | 0.3 | 0.2 | 0.9 | 63.5 | 0.6 | 0.6 | 0.3 | 2.1 | 27.8 | 0.6 | 2.7 | 36.5 |
| Ag | 2.7 | 0.4 | 0.8 | 0.6 | 0.7 | 55.8 | 1.9 | 0.7 | 1.8 | 32.3 | 1.5 | 0.7 | 44.2 |
| Ce | 0.1 | 0 | 0.3 | 0 | 0 | 0.2 | 98.2 | 0.1 | 0 | 0.8 | 0.1 | 0.2 | 1.8 |
| Dy | 5.6 | 0.8 | 0.2 | 0.8 | 1.4 | 1.2 | 5.6 | 27.7 | 0.5 | 51 | 4 | 1.1 | 72.3 |
| La | 0.5 | 0.3 | 0.6 | 1 | 2.8 | 0.7 | 0.6 | 0.7 | 42.7 | 48.9 | 0.6 | 0.7 | 57.3 |
| Nd | 0.1 | 0 | 0 | 1.3 | 0 | 0 | 0 | 0 | 0 | 97 | 1.3 | 0.2 | 3 |
| Tb | 1.1 | 0.3 | 1 | 0.7 | 0.4 | 1.1 | 13.7 | 1.9 | 0.8 | 57 | 19.5 | 2.5 | 80.5 |
| Pr | 1.5 | 0.9 | 0.4 | 0.9 | 1.5 | 3 | 6.9 | 2.4 | 1.6 | 45.2 | 2.8 | 33 | 67 |
| TO | 17.7 | 4.9 | 5.7 | 9.9 | 16.4 | 9.8 | 43.9 | 12 | 12.9 | 429.7 | 16.3 | 9.8 | TCI |
| NET | −52.3 | −37.7 | −74.4 | −23.8 | −20.1 | −34.3 | 42.1 | −60.2 | −44.4 | 426.7 | −64.2 | −57.2 | 49.1 |
Static spillovers in skewness.
TABLE 5
| Metals markets | Li | Co | Ni | Cu | Si | Ag | Ce | Dy | La | Nd | Tb | Pr | From |
|---|---|---|---|---|---|---|---|---|---|---|---|---|---|
| Li | 14 | 11 | 1 | 2.6 | 6.4 | 1.1 | 2.7 | 2.4 | 6.3 | 47.3 | 0.4 | 4.7 | 86 |
| Co | 5.6 | 7 | 0.5 | 1.3 | 2.8 | 0.5 | 0.9 | 1.2 | 3 | 74.2 | 0.2 | 2.9 | 93 |
| Ni | 4.9 | 3.5 | 26.6 | 4.4 | 3 | 1.8 | 8.9 | 2 | 1.9 | 39.5 | 0.4 | 3 | 73.4 |
| Cu | 4.4 | 3.8 | 1.3 | 11.1 | 2.9 | 0.5 | 0.8 | 1 | 3.9 | 67.9 | 0.7 | 1.8 | 88.9 |
| Si | 18.9 | 15.9 | 1.7 | 2.9 | 43.5 | 0 | 3.7 | 1.9 | 6.4 | 2.1 | 0.1 | 2.9 | 56.5 |
| Ag | 0.8 | 0.7 | 0.1 | 0.2 | 0.3 | 93.7 | 0.2 | 0.2 | 0.2 | 3.5 | 0.1 | 0.2 | 6.3 |
| Ce | 9.4 | 7.4 | 12.9 | 1.2 | 3.8 | 0.1 | 48.1 | 1.9 | 2.1 | 8 | 0 | 5.2 | 51.9 |
| Dy | 4.8 | 4.3 | 1 | 1.4 | 2.8 | 4.9 | 1.5 | 9.5 | 2.6 | 62.7 | 1.3 | 3.3 | 90.5 |
| La | 5.8 | 5 | 0.6 | 1.5 | 2.5 | 0.5 | 1.1 | 1.1 | 7.7 | 70.7 | 0.5 | 3 | 92.3 |
| Nd | 1.8 | 1.6 | 0 | 0.3 | 0.9 | 0 | 0.1 | 0.2 | 0.5 | 94.4 | 0 | 0.3 | 5.6 |
| Tb | 6.5 | 5.6 | 0.6 | 1.3 | 8.8 | 3.7 | 1.7 | 2.4 | 2.4 | 51.8 | 13.5 | 1.7 | 86.5 |
| Pr | 6.1 | 5.2 | 0.7 | 1.2 | 2.9 | 0.5 | 1.2 | 1.8 | 3 | 71.3 | 0.3 | 5.7 | 94.3 |
| TO | 69 | 63.9 | 20.4 | 18.3 | 37.1 | 13.6 | 22.9 | 16.2 | 32 | 498.8 | 3.9 | 28.9 | TCI |
| NET | −17 | −29.1 | −53 | −70.6 | −19.3 | 7.3 | −29 | −74.4 | −60.2 | 493.2 | −82.6 | −65.4 | 68.8 |
Static spillovers in kurtosis.
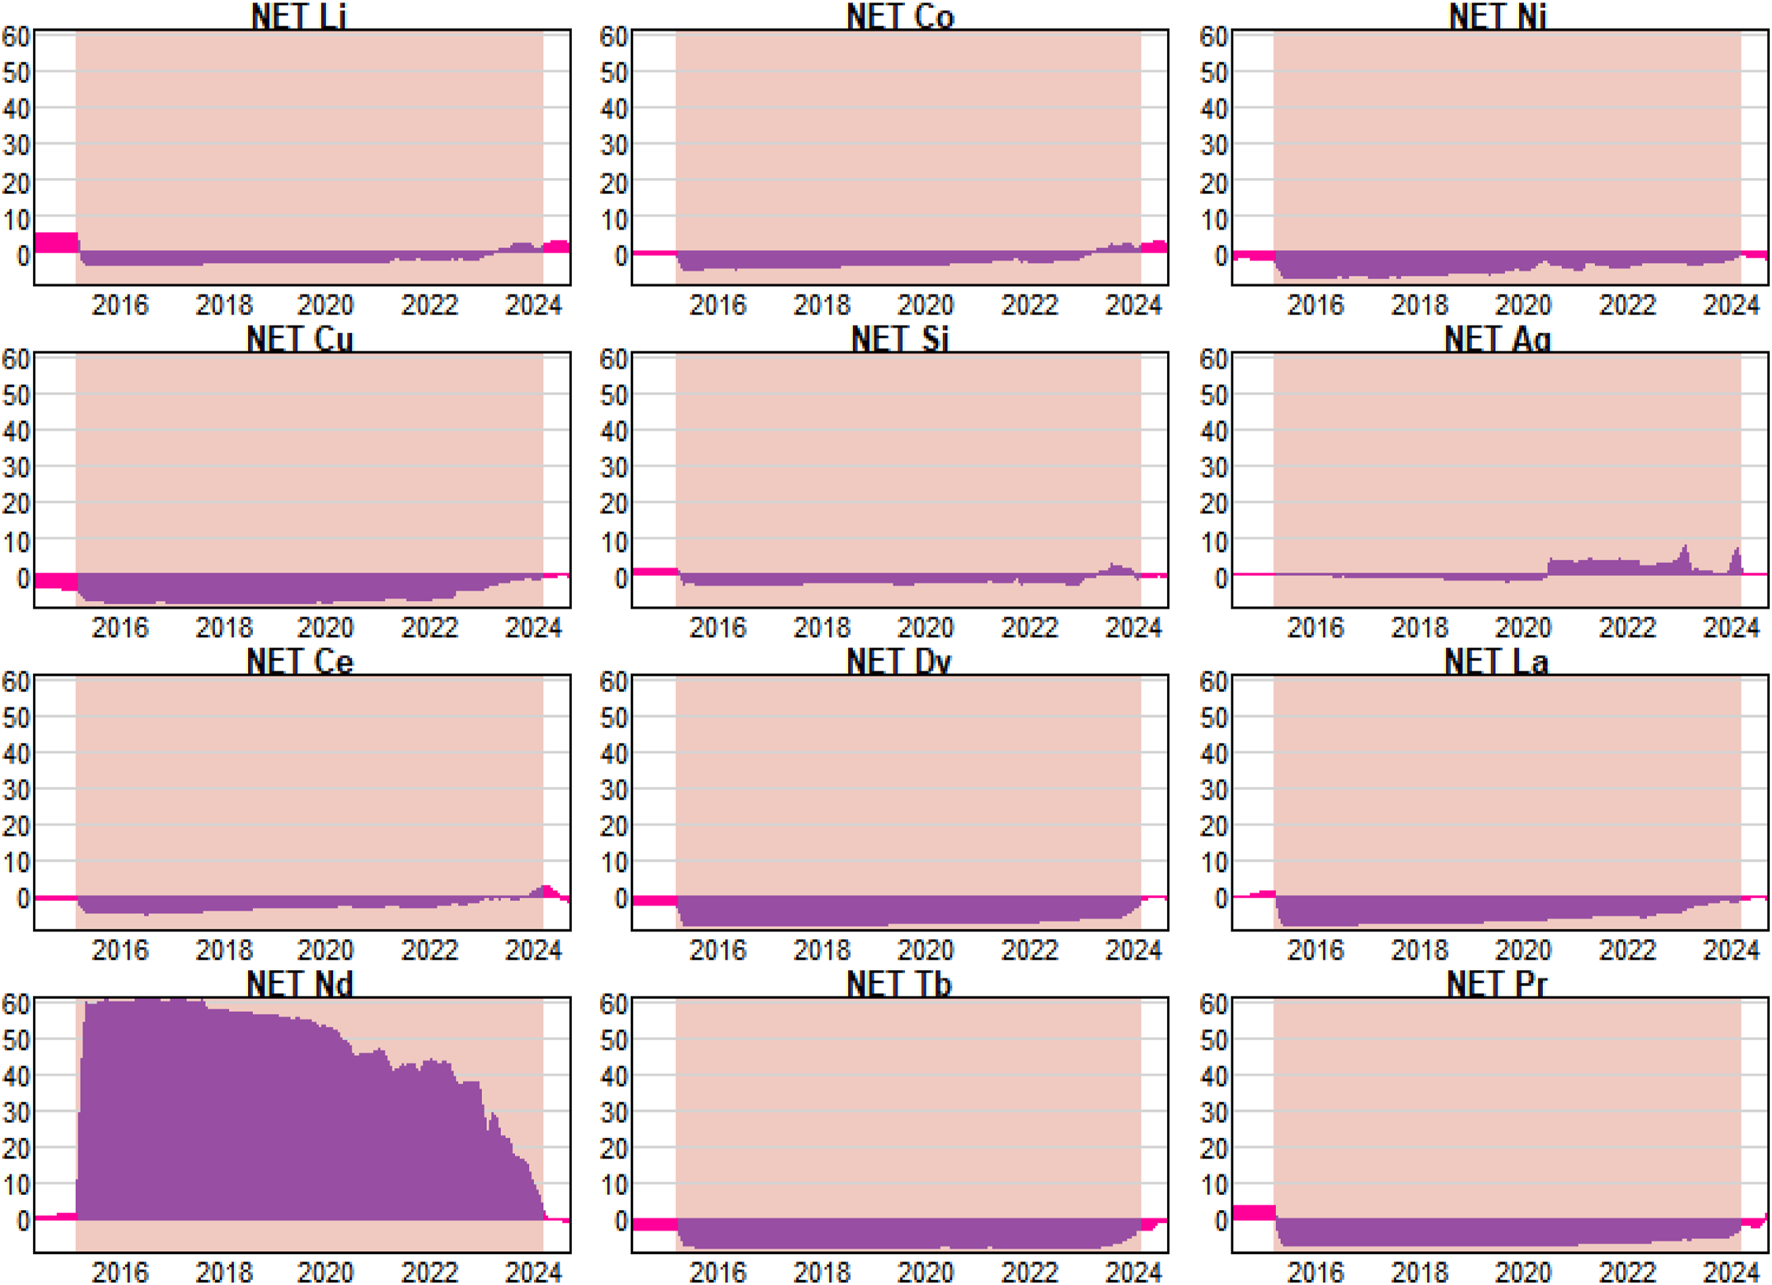
5.4 Evolution of the maximum pairwise spillover index
As mentioned earlier, co-consumption and co-production are common and important material dependencies in industrial production and economic theory. Co-production can affect synergistic price fluctuations through the cost transmission mechanism of the chain. Co-consumption, on the other hand, generates price synergies through end-product demand linkages, but is more resilient than co-production, as it is more subject to technological substitution and market regulation. The Maximum Pairwise Spillover Index can reveal the interplay of these materials in market supply and demand changes, and identify which bilateral relationships are most likely to be potentially correlated. The time-varying characteristics of strongly correlated markets in return, volatility, skewness and kurtosis risk spillovers can also be assessed visually through dynamic evolutionary analysis. In Figure 8, the right axis represents the different pairs of metals, and the left panel shows the corresponding maximum risk premium values.
FIGURE 8
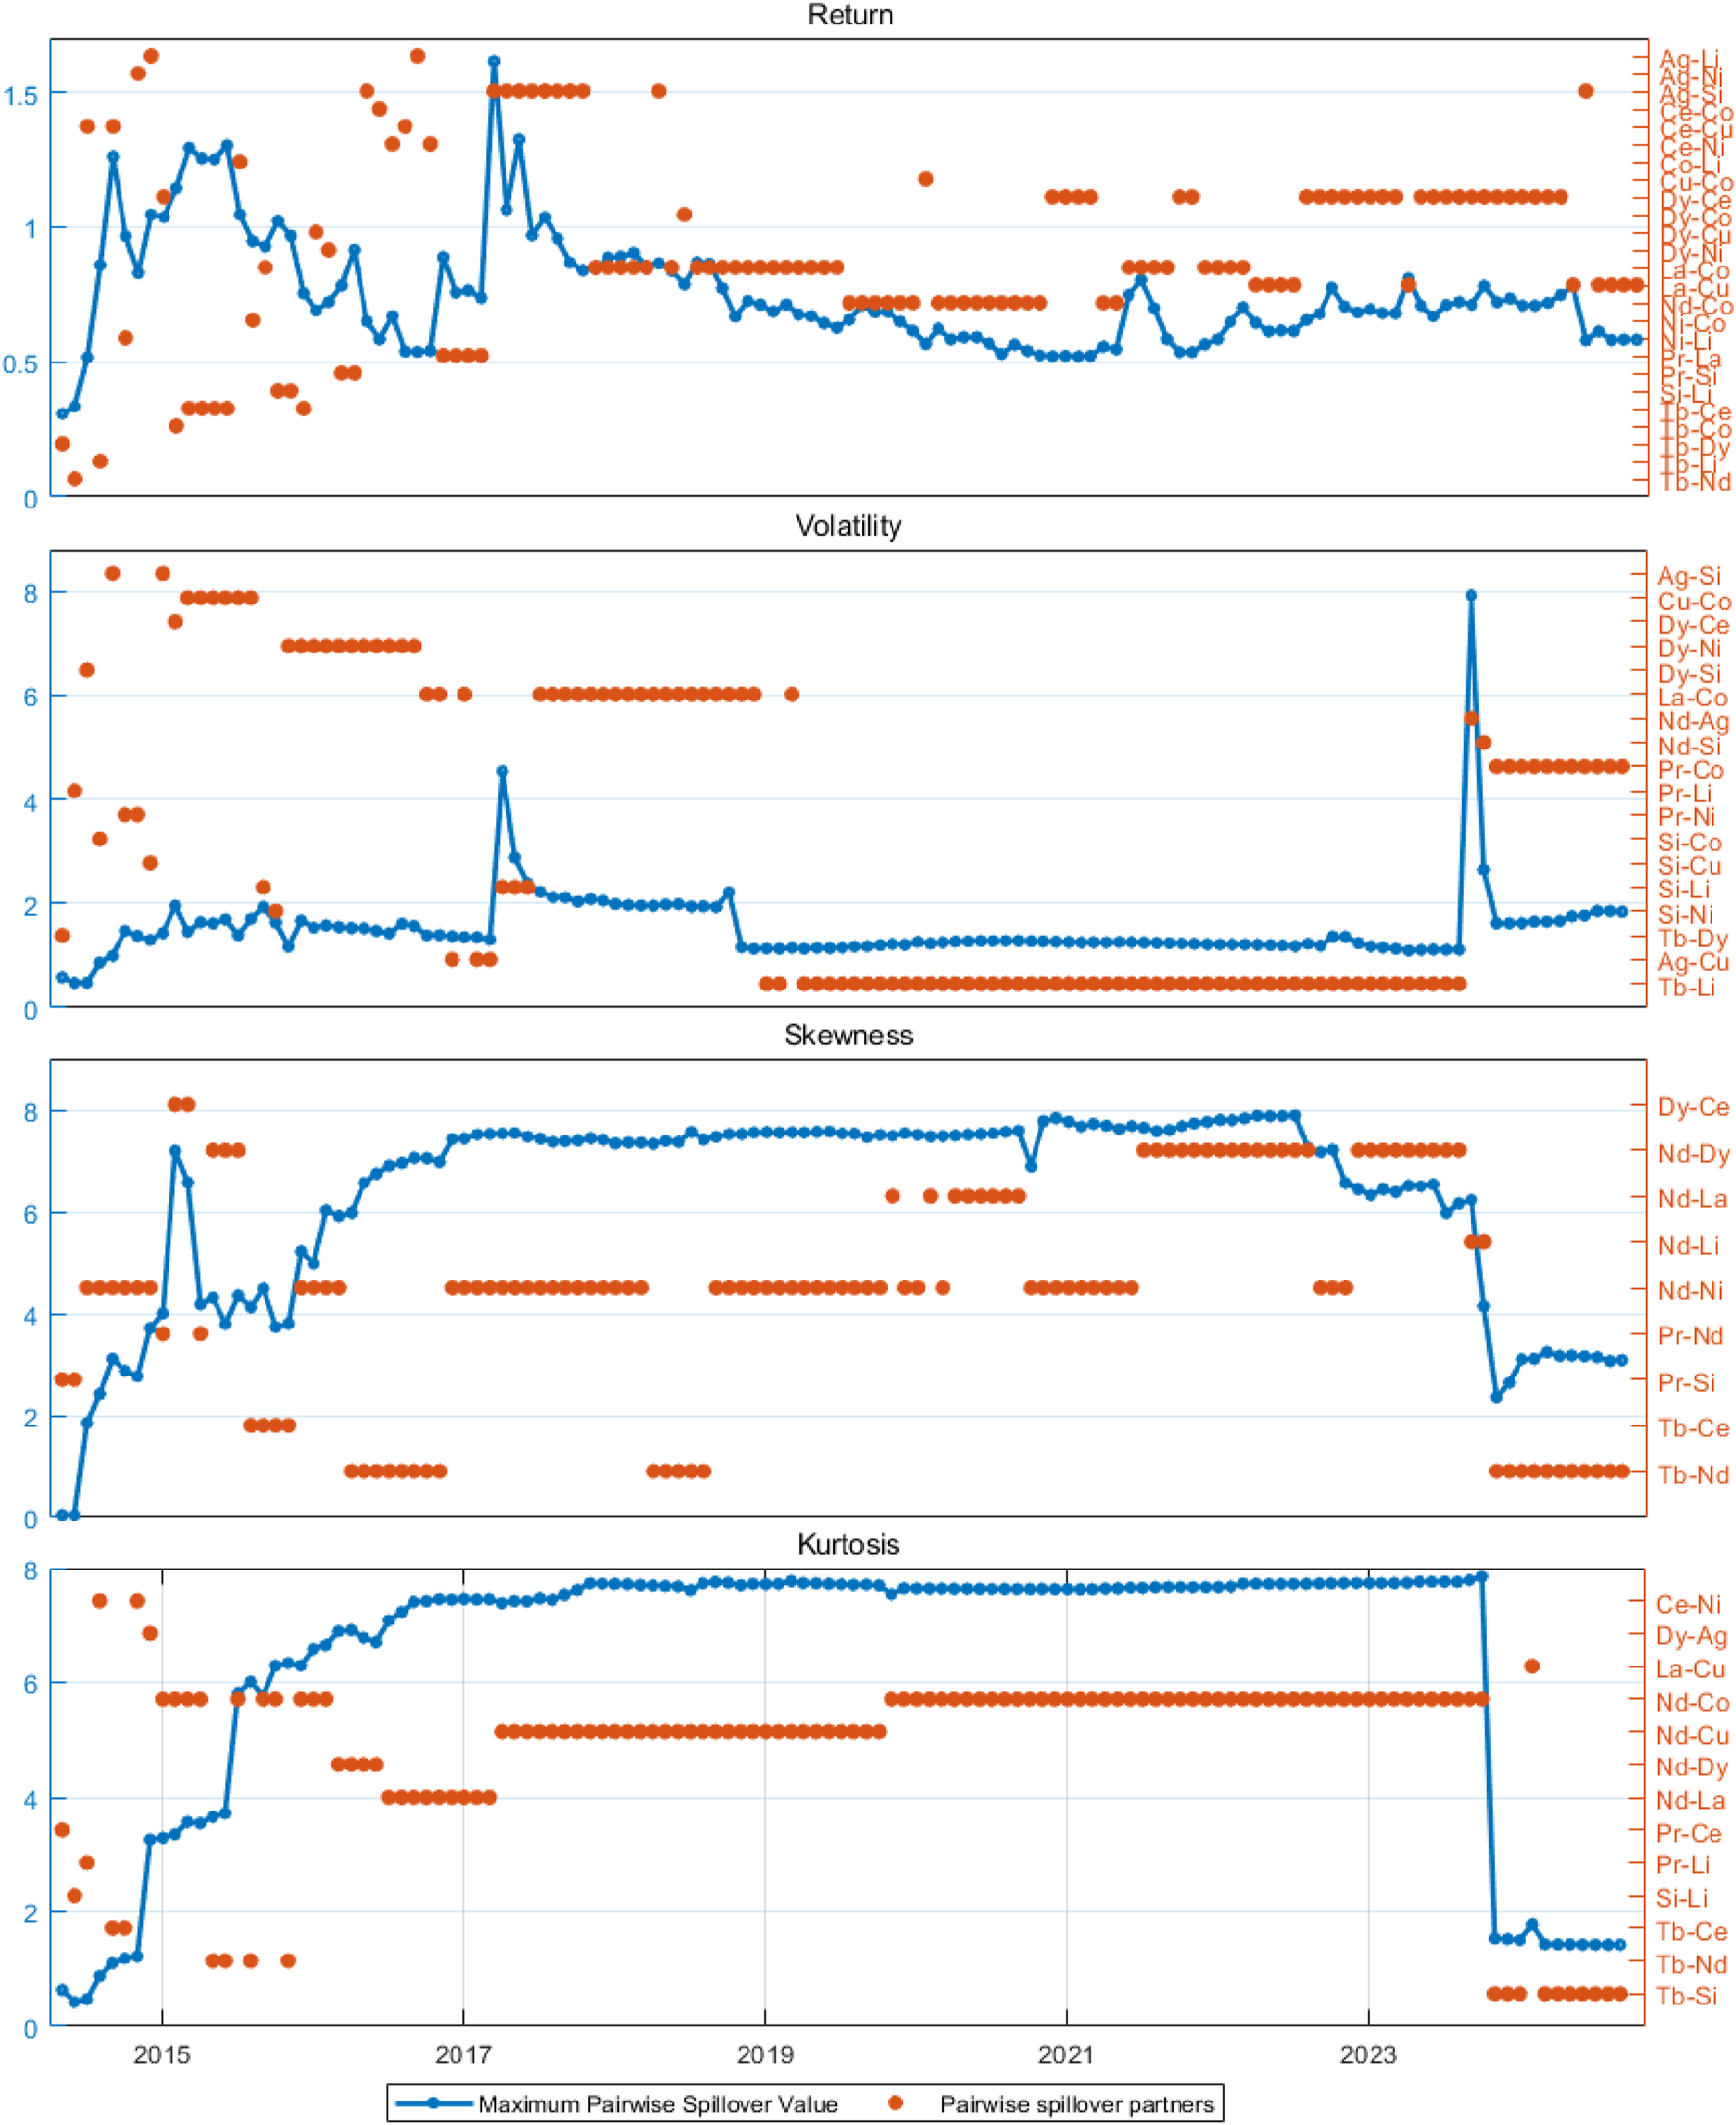
Maximum pairwise spillage evolution.
In return risk spillover, the largest source of risk before 2017 showed a strong randomness, mainly due to the degree of dependence between markets has not yet formed a stable structure, which makes the interactions and spillover effects between different metals more complex, silver-lithium, silver-nickel and other metal combinations have once become the largest paired spillover index. However, since 2017, with the advancement of technology, changes in market demand, rapid development of the new energy industry and the gradual maturation of the industrial chain, specific metal combinations such as lanthanum-cobalt, neodymium-cobalt and dysprosium-cerium have often become strong correlation combinations, demonstrating more stable interrelationships, which reflects the new energy market’s preference for these specific material combinations in recent years.
Specifically, all three pairs of metals have significant co-consumption or co-production relationships. In certain specific alloys and battery materials, lanthanum and cobalt are often used together to enhance material performance and functionality. Lanthanum improves the electrochemical properties of nickel-metal hydride (NiMH) batteries and other materials, while cobalt plays a key role in batteries, boosting energy density and cycle life. Market demand for both is therefore closely linked, highlighting their synergistic effects. Similarly, neodymium, a rare earth element, is often used in combination with cobalt to improve the magnetic properties and thermal stability of permanent magnet materials. This synergy makes neodymium and cobalt closely linked in the market, leading to a symbiotic economic relationship. Dysprosium and cerium, as rare earth elements, have a clear co-production relationship, and they tend to show a high degree of interconnectedness in sales and market demand, which leads to a relative concentration of risk spillovers in returns.
In volatility risk, the value of the maximum risk premium is relatively stable until the end of 2023, when higher values occur, arising between neodymium-silver. The two also have a co-consumption relationship. For environmental protection and energy saving considerations, most countries now have great support for new energy vehicles in terms of policy, which has shifted cars from internal combustion engine dominance to new energy sources. In the application of electric vehicles, neodymium as a rare earth element is used to manufacture high-performance motors to enhance the efficiency of the power system. Silver is mainly used in automobiles for various types of switches, circuit boards, circuit breakers and brazing alloys due to its superb conductivity, while electric vehicles tend to be more highly electronic, so the demand for silver has increased significantly. As a result, the price of neodymium, a key rare earth element, has increased in volatility due to soaring demand. At the same time, the importance of silver in batteries and electronic products has led to policy support and market interest. The combination of their applications in the electric vehicle industry sector has led to a sharp increase in risk spillover between neodymium and silver. The market connection between neodymium and silver becomes tighter as the policy effect is quickly apparent, but as the market adapts to the policy impact and strengthens its risk management, the spillover between the two will also experience a transient decline, reflecting the dynamic balance between market behaviour and policy impact. Thus, the risk spillover between neodymium and silver is characterised by both policy advances and transient fluctuations due to adaptive changes in supply and demand.
In the skewness risk premium, the value of the maximum risk premium is significantly higher than the return and volatility. This suggests that there are strong asymmetric price volatility risk-transfer effects in the market. In particular, in extreme cases, risk linkages between certain assets may increase significantly. This suggests that investors need to pay special attention to skewness risk when managing risk. And, as can be seen from the right axis, these maximum risk spillovers are more concentrated in a few risk sources, namely: neodymium-dysprosium and neodymium-terbium. Neodymium and dysprosium are commonly used together in electric vehicle motors, and they are interdependent on each other, affecting the performance and cost of the common application. These two rare earth metals have both a co-production relationship and a co-consumption relationship in specific industries, highlighting their correlation and joint influence on extreme risk volatility. The high spillover risk between neodymium and terbium, on the other hand, considers their co-production relationship. The existence of this relationship is significant in terms of economics and resource use, as neodymium can be extracted while terbium can be recycled more efficiently, maximizing resource use.
Among the kurtosis risk spillovers, the largest pairwise risk spillovers have a more concentrated source, mainly from neodymium-cobalt and neodymium-copper. The neodymium-cobalt relationship has been mentioned before, and it is important to note here that the result confirms the high degree of connectivity between the two markets in terms of the potential for abnormal volatility in the face of external shocks. As for neodymium-copper, there is a co-consumption relationship between the two, especially in technology areas such as electric motors and batteries. Neodymium, an important rare earth element, is used to make high-performance permanent magnet materials, while copper is widely used in electrical connections and conductive components. Together, these two materials play a key role in high-tech products such as electric vehicles, so when it comes to design and material selection, manufacturers need to consider both neodymium and copper in terms of performance and cost in order to optimise overall performance. In this context, it is particularly important to focus on the risk transfer of extreme price fluctuations between copper and neodymium.
As a result, from the perspective of industrial linkages, it can be seen that the intensity of risk transmission is more pronounced in metal combinations of co-consumption and co-production, owing to their key position in the industrial chain, technological lock-in effect and high industrial concentration. Such portfolios are subject to fixed ratios and lack elasticity of substitution, with fluctuations in supply and demand spreading rapidly through production formulas and procurement networks, creating a chain reaction, whereas portfolios with strong substitutability have a weaker risk transmission.
5.5 Spillover network evolution
Based on the paired spillover index, the spillover network is plotted here for the high spillover period to visualise the directionality and complexity of the risk spillovers. The period from June 2021 to November 2021 corresponds to the time of analysis (based on the previous analysis). Since the evolution of the spillover network for return, skewness, and kurtosis is not obvious, the static spillover network is plotted here for the analysis (See Figure 9). The grey network is return, the green network is skewness, and the pink network is kurtosis. During this time period, the markets with strong external risk spillovers continued to be dominated by rare earth elements.
FIGURE 9
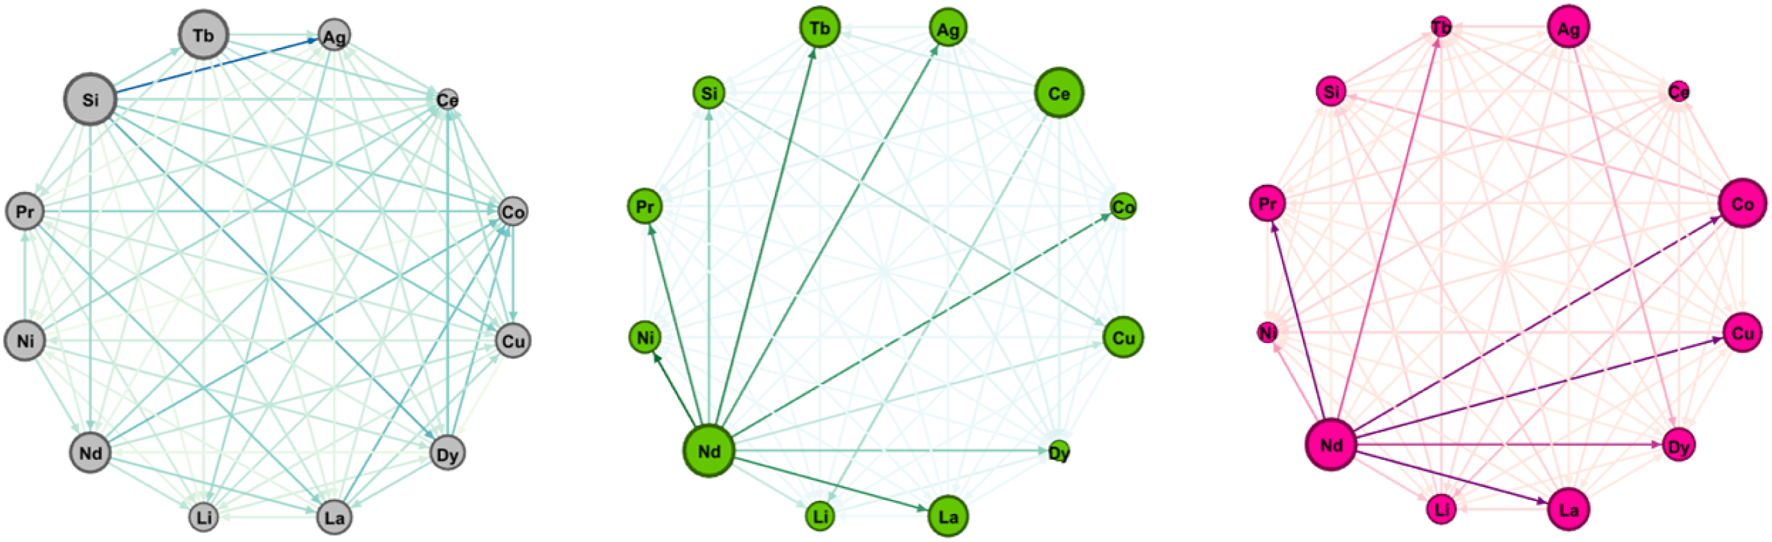
Evolution of the spillover network (return (left), skewness (centre), kurtosis (right)).
For the return spillover network, silicon and lanthanum are the main spillover emitters, and silver and cobalt are the corresponding risk takers. Cerium is the central return risk taker of all the elements, and most of the metals’ return risks are passed on to it. The most important spillover emitter in the skewness spillover network is neodymium, which can be seen to transmit a large amount of kurtosis risk to nickel, praseodymium, terbium, cobalt and lanthanum. The kurtosis network bears some similarity to the skewness network, with neodymium remaining dominant in the kurtosis risk network. The biggest difference is the shift in terbium’s position. It has some ability to emit risk in both the return network and the skewness network, but in the kurtosis network it has become a core risk taker and is highly susceptible to risk shocks from other markets. It follows that in the skewness risk spillover network, it is able to influence the risk dynamics of other markets by transmitting asymmetric risk. However, in the kurtosis risk spillover network, it is highly vulnerable to high-frequency extreme volatility due to its high sensitivity to extreme market fluctuations.
The blue network is a volatility spillover network with a clearer evolution (See Figure 10). As can be seen from the colour shades of the edges in the network, spillovers in the system increased overall during this period, mainly due to silicon and lanthanum. Both strengthened their external risk spillovers, targeting markets such as cerium, terbium, cobalt, praseodymium and lithium. In contrast, the metals markets associated with the new energy sector are more likely to evolve as risk receivers. The network bilateral relationship between most raw materials and rare earths markets is one in which the latter points to the former. This situation highlights the key position of rare earths in the new energy industry chain. Rare earth price fluctuations have a direct impact on the cost and competitiveness of new energy products, and all parties in the industry need to pay more attention to the volatility risks of the rare earth market in order to seek effective risk management and response strategies.
FIGURE 10
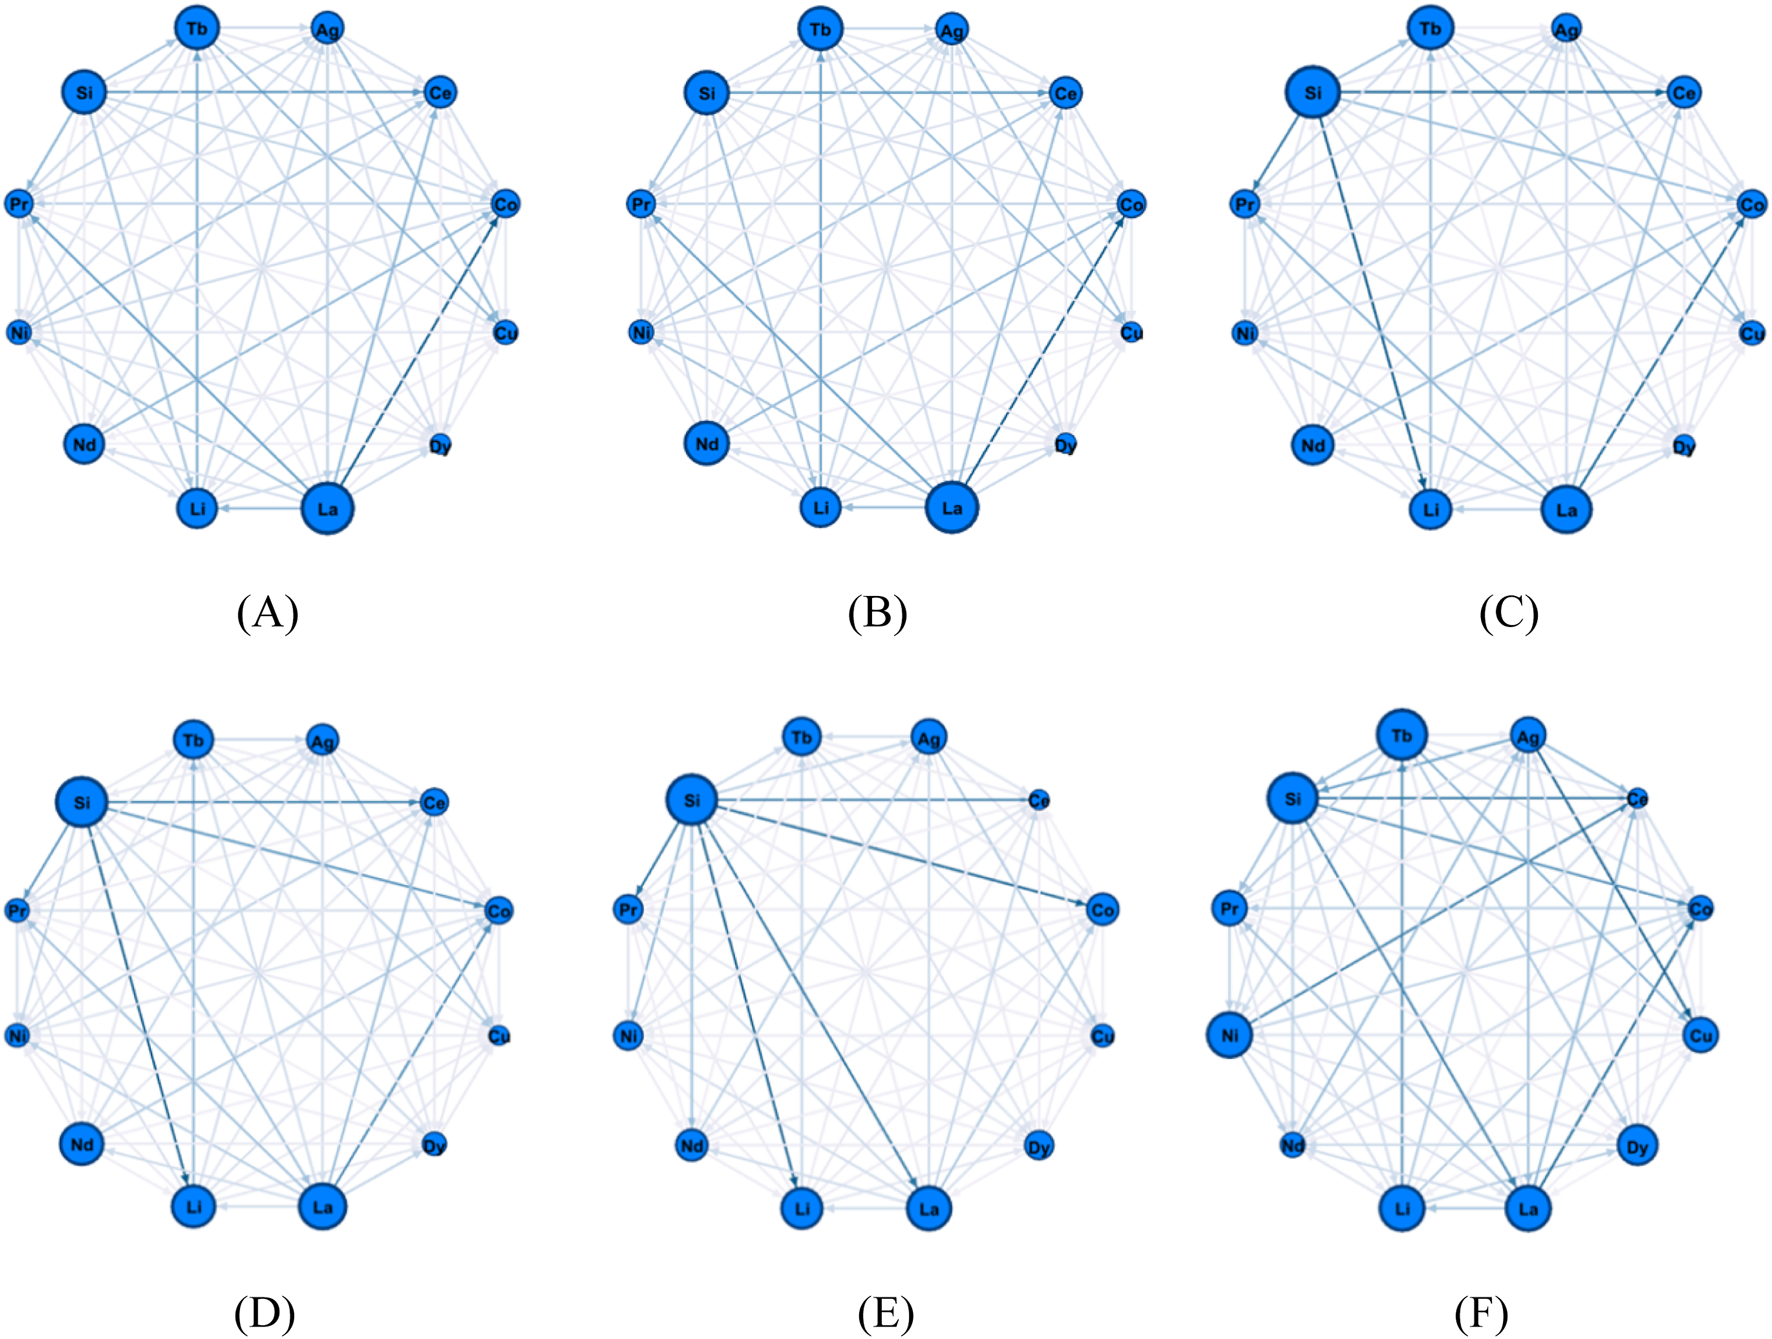
Evolution of the volatility spillover network ((A–F)represent June to November 2021)
5.6 Comparative analysis of long and short-term market risk spillover
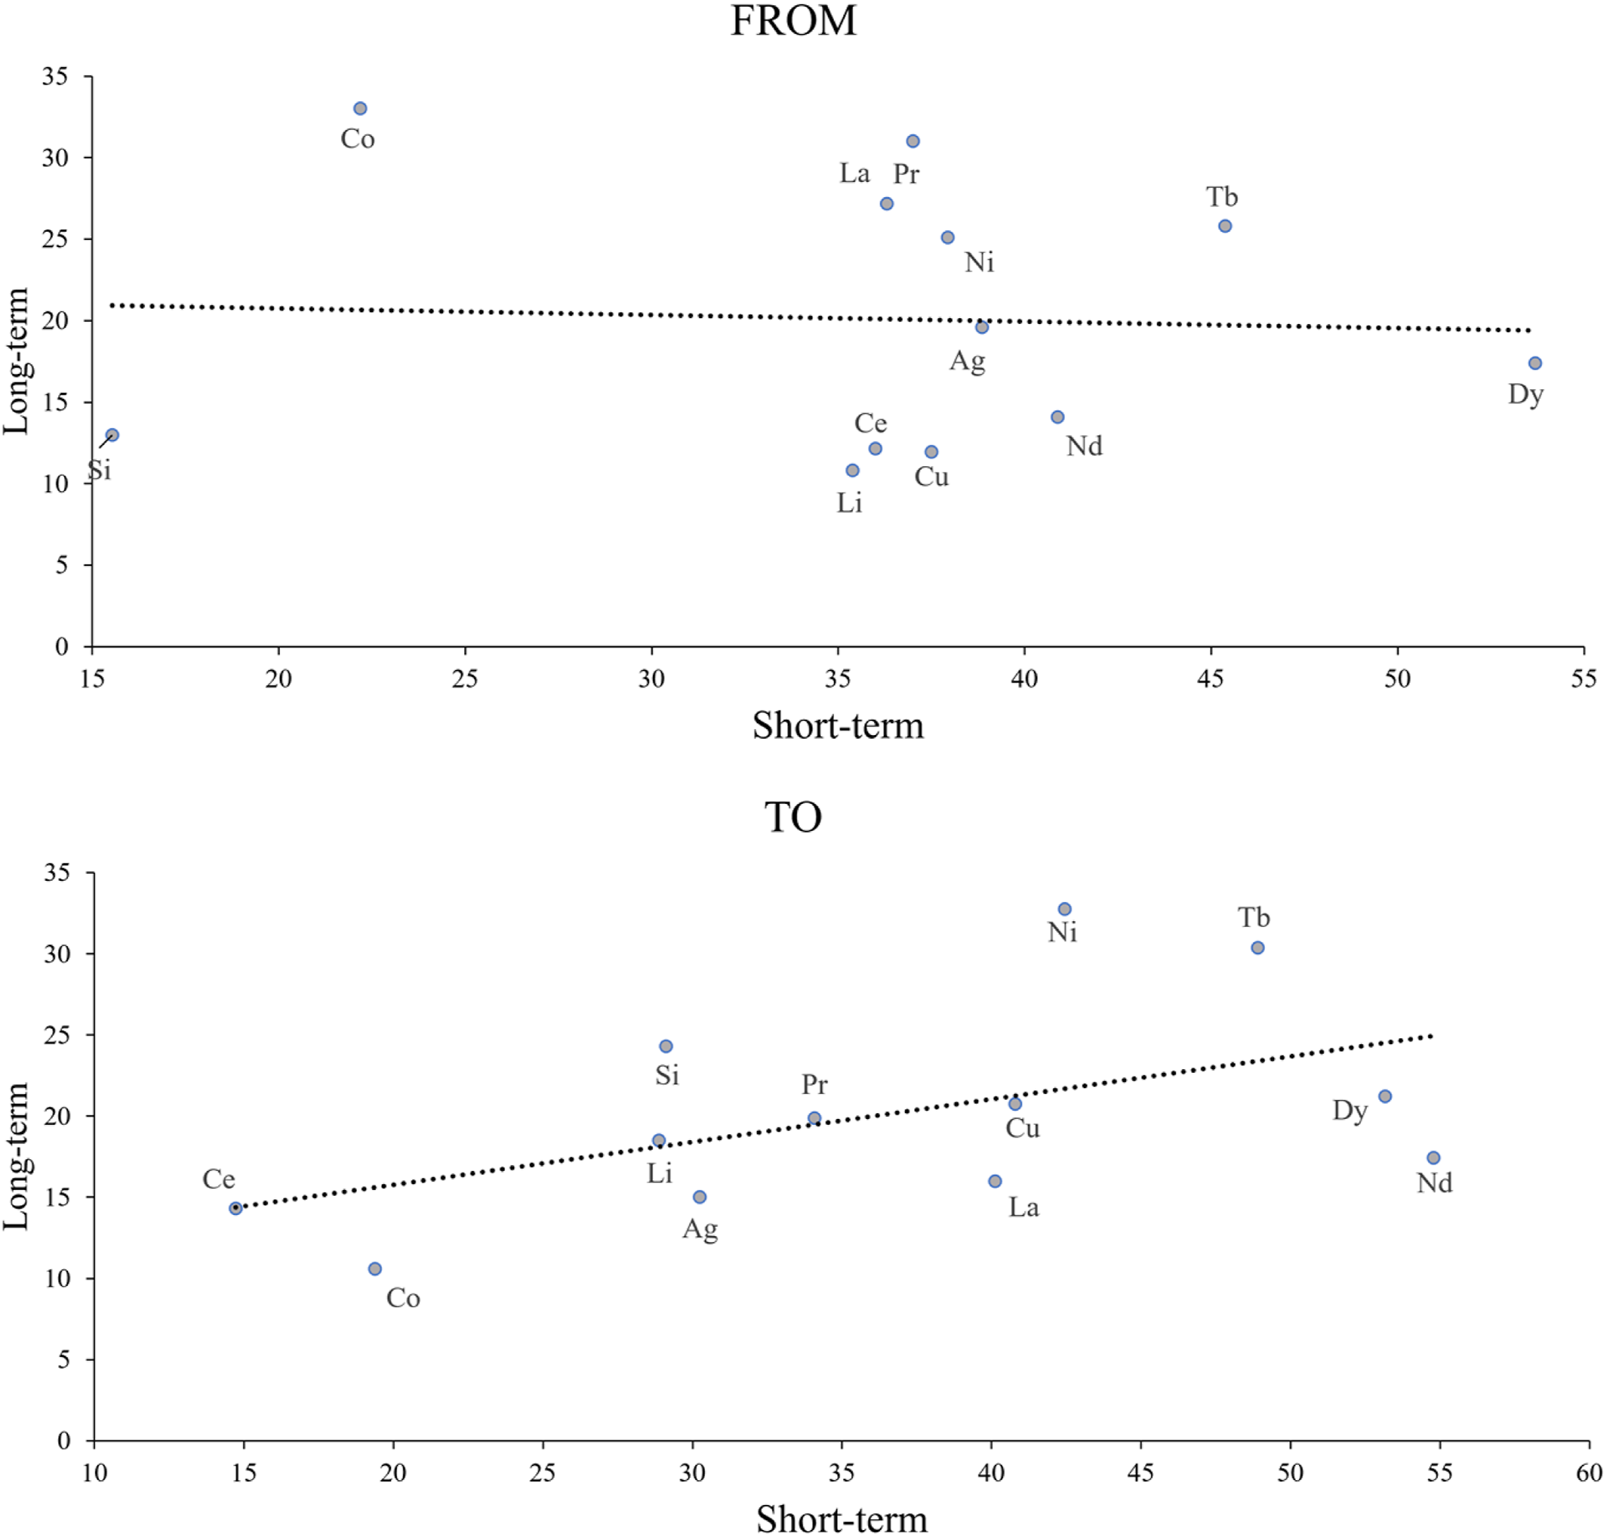
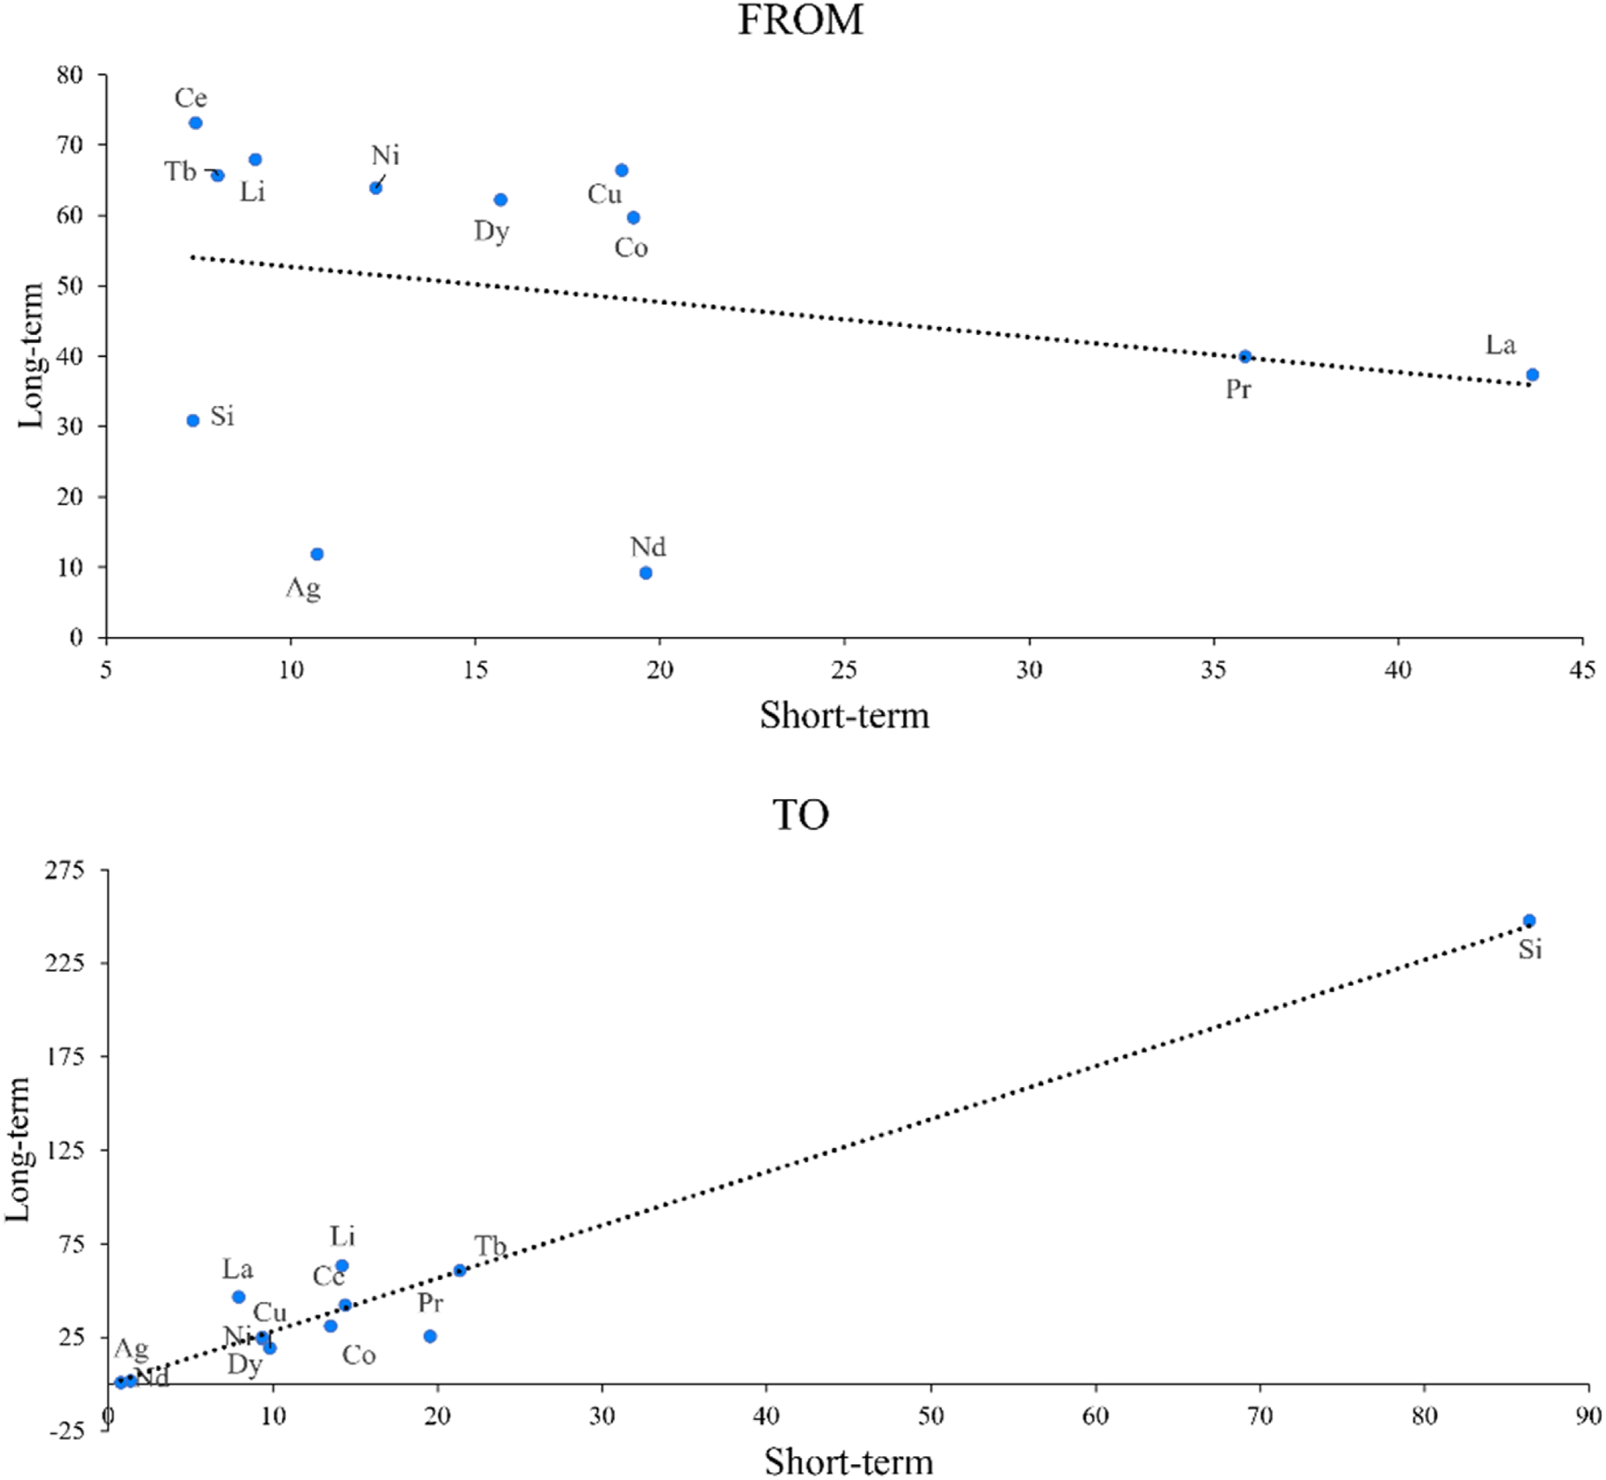
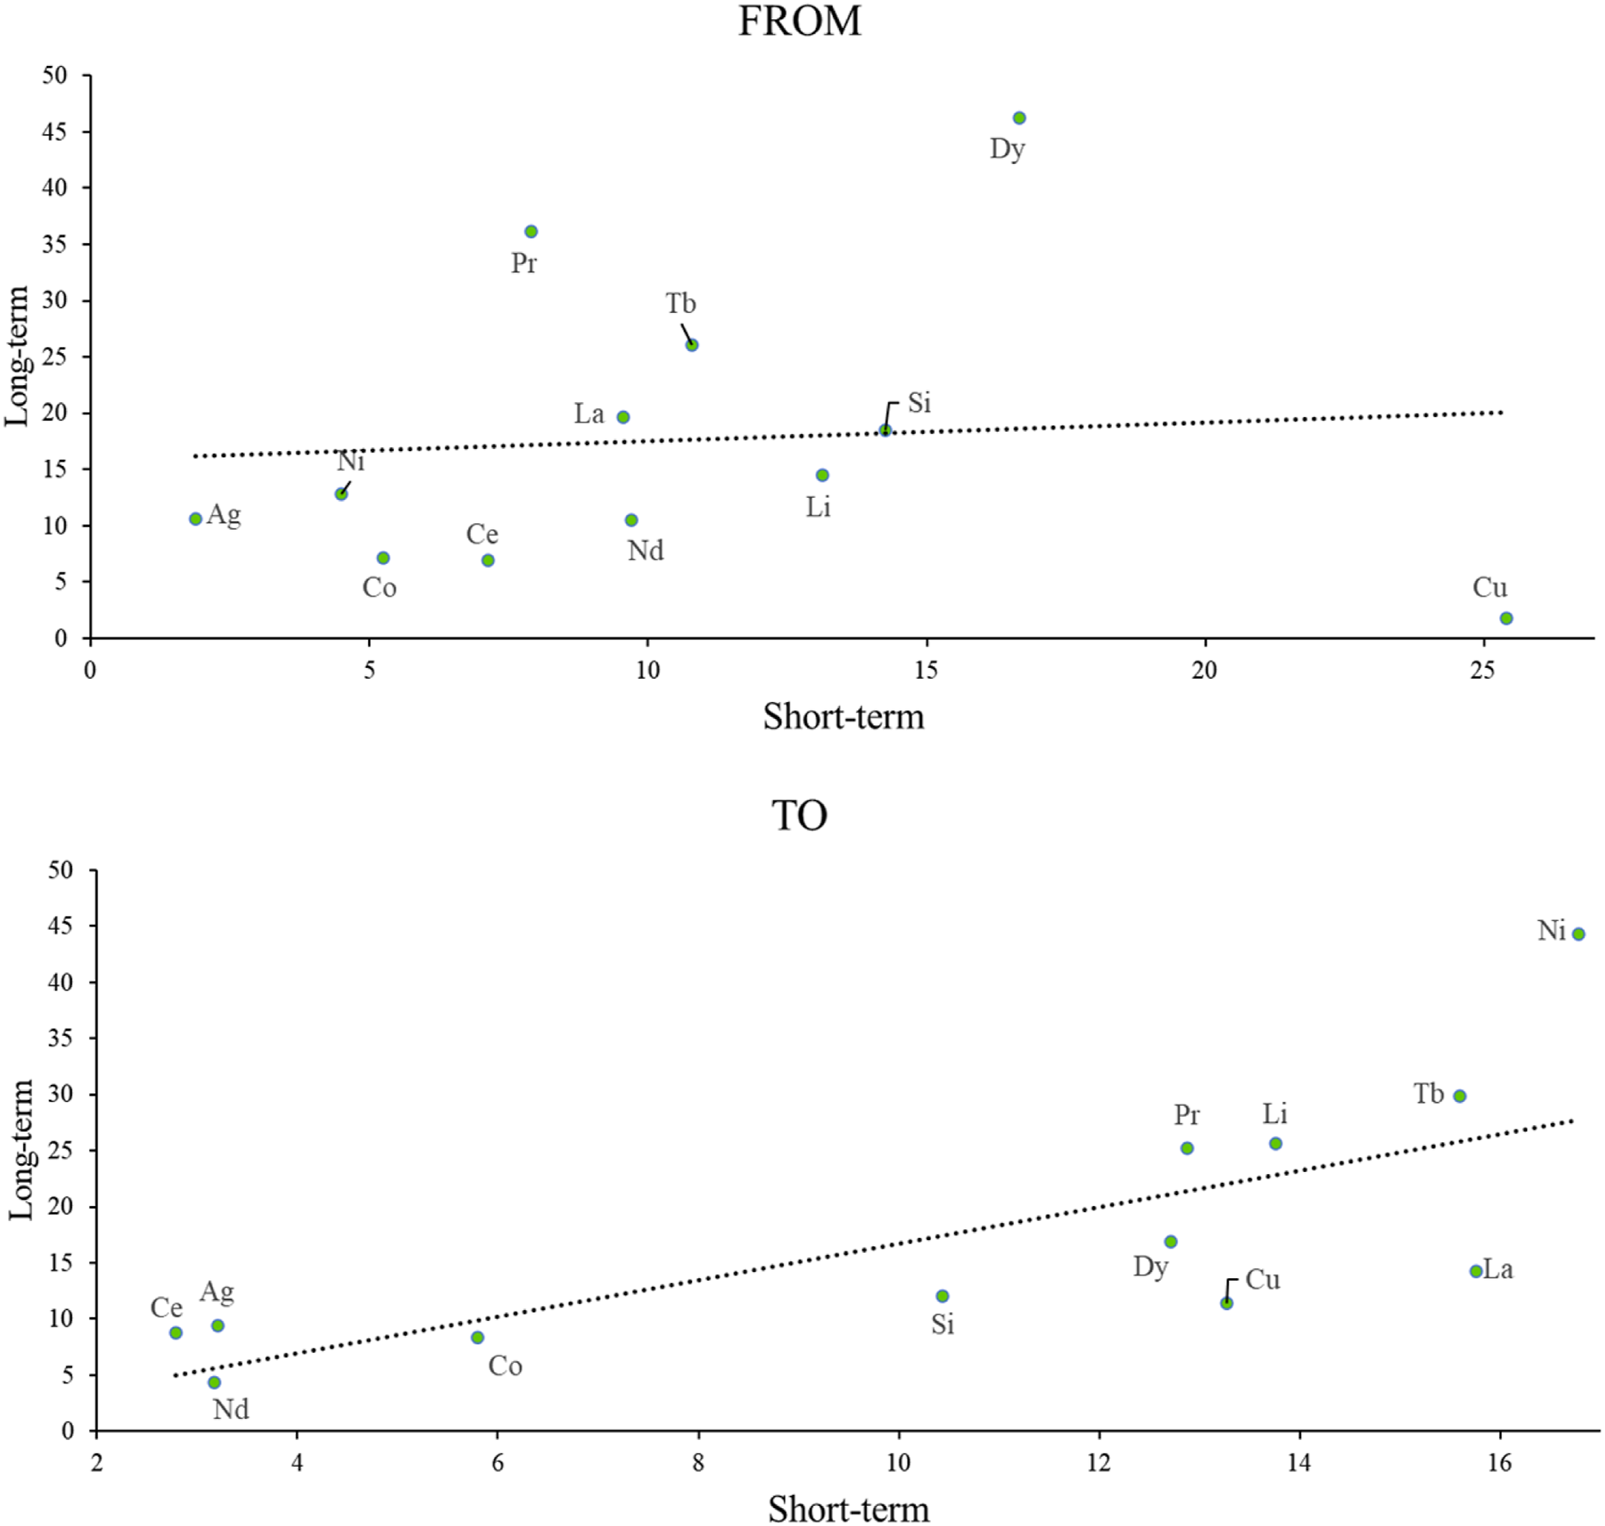
Here, we perform a comparative analysis of long- and short-term market spillovers for each order of momentary risk (See Figures 11–14 for visualisation). The Chinese rare earth market has a more pronounced pattern of long- and short-term correlation. The outward spillovers of different order moments generally show significant positive long- and short-term correlations. In the case of return risk spillovers, for example, when cerium and terbium have a significant impact on other markets in the short run, they also have a significant impact on other markets in the long run. This reflects the fact that uncertainty and shock volatility in rare earth markets in the short term can carry over and build up in the long term, triggering broader changes in market sentiment and asset price adjustments. Generally speaking, the impact of risk transmission in the long term is more far-reaching and may lead to adjustments in the overall market structure and asset allocation, as well as affecting macroeconomic policies and the direction of long-term market development. Therefore, the impact of risk volatility in rare earth markets on other markets in the short term will manifest itself in more significant and lasting effects in the long term.
FIGURE 11
Return Total directional spillover in the short and long terms.
FIGURE 12
Volatility Total directional spillover in the short and long terms.
FIGURE 13
Skewness Total directional spillover in the short and long terms.
FIGURE 14
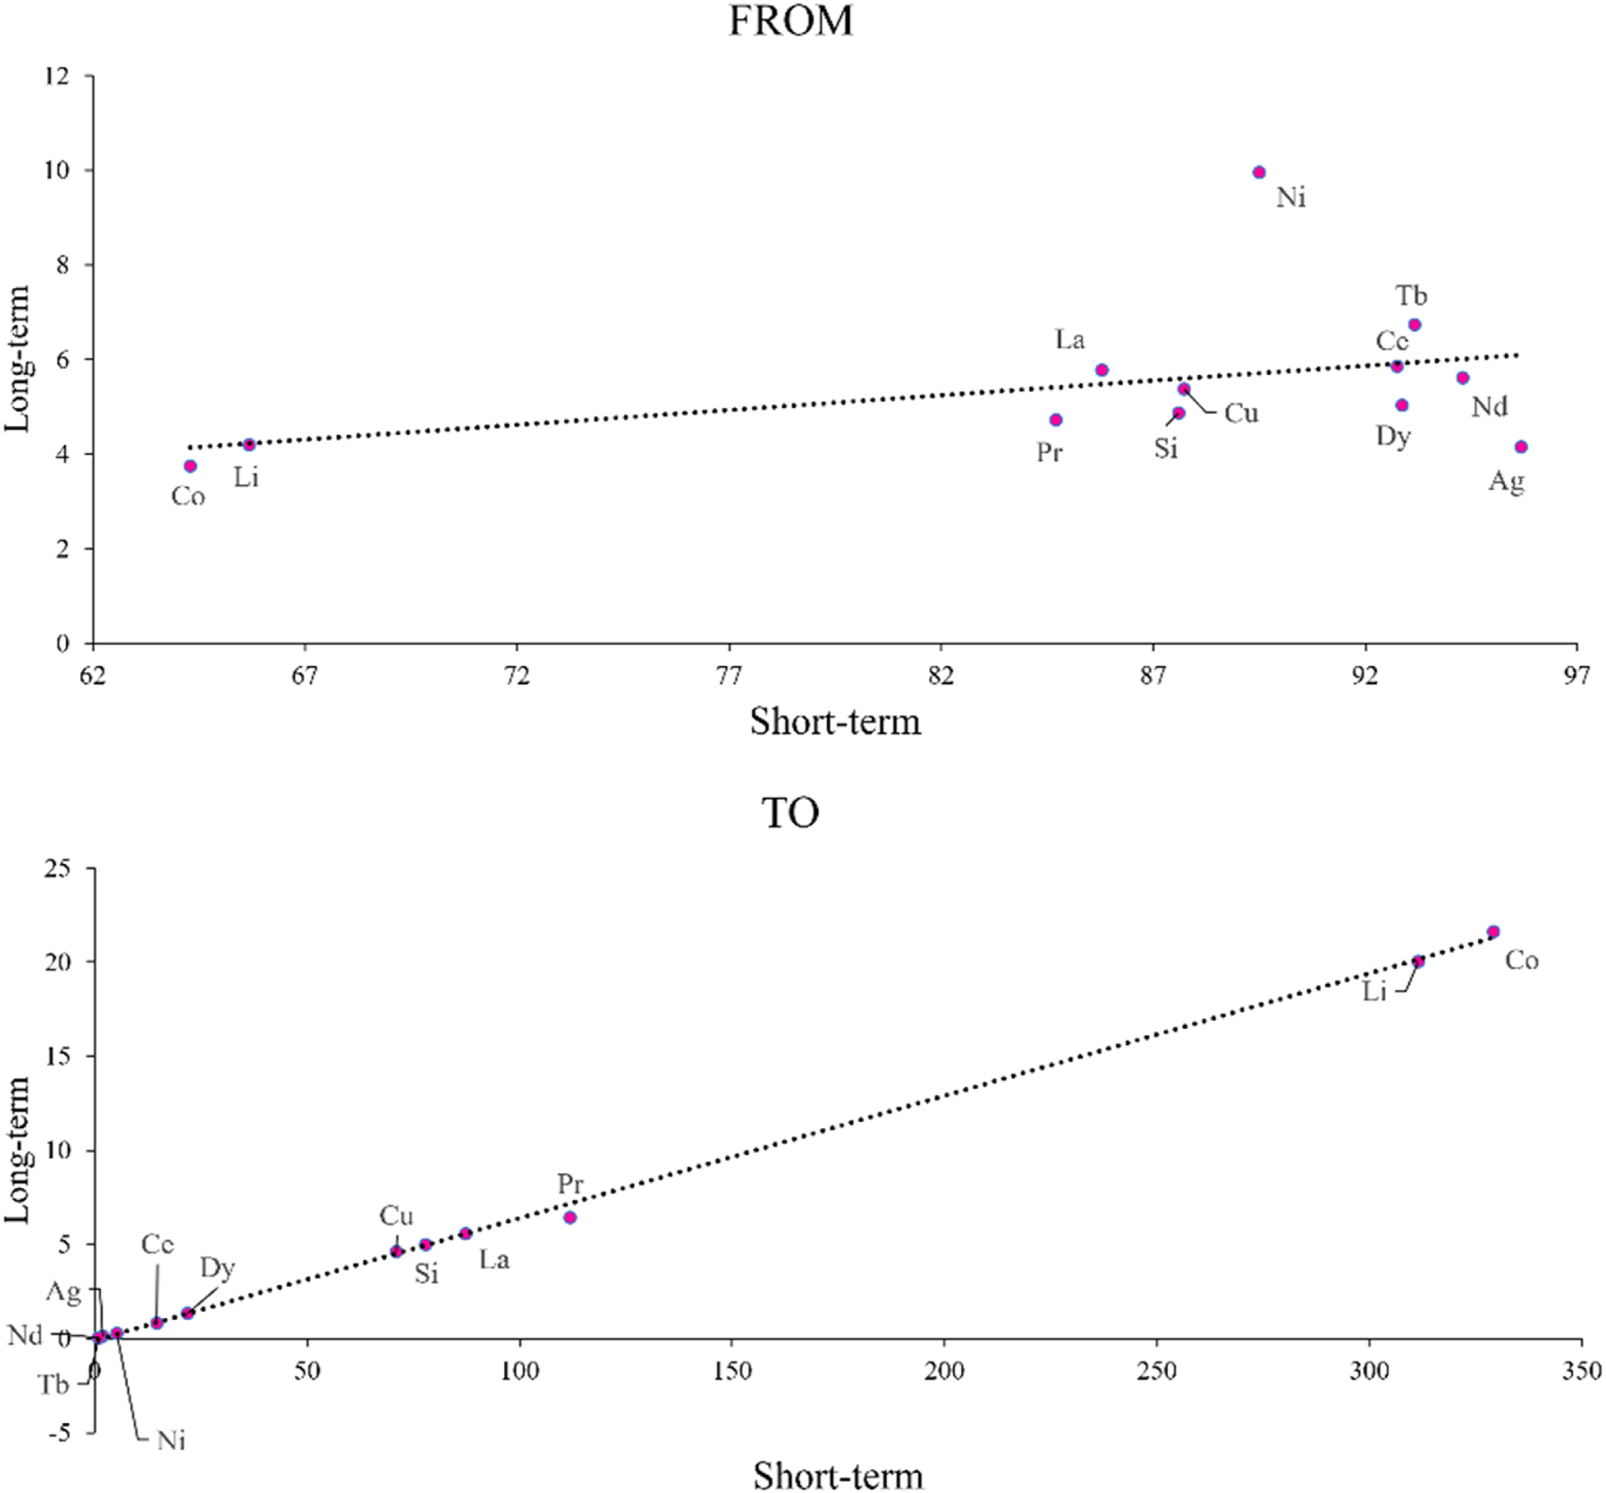
Kurtosis Total directional spillover in the short and long terms.
It is worth mentioning that when analysing the time-domain spillover index, we obtained an important finding. Neodymium exhibits a strong outward influence in terms of skewness and kurtosis spillovers. This may be attributed to the model’s ability to capture market dynamics and volatility characteristics in real time. As a result, neodymium is able to quickly show its impact on market sentiment and risk transmission. In contrast, when using the frequency-domain spillover index for analysis, since this index mainly analyses the spillover effect holistically from different frequency perspectives, this may result in a less sensitive response to the instantaneous fluctuations of neodymium than the time-domain spillover index. Specifically, skewness and kurtosis are statistical indicators used to measure the distribution pattern of data. Sharp short-term fluctuations often occur in the market. These fluctuations cause significant changes in skewness and kurtosis. If the frequency-domain spillover index focuses more on the long-term trend, it will “smooth out” these short-term and possibly exaggerated volatility effects, resulting in a final reflection that shows lower skewness and kurtosis spillover effects, i.e., short-term effects are masked by the long-term trend. That is, short-term effects are masked by long-term trends. This is the meaning of “suppressing short-term fluctuations”. This makes the neodymium spillover effect in the short and long term relatively low, especially in the case of extreme market behaviours, the information becomes smoother, so the neodymium spillover effect under frequency-domain spillover index shows a weaker characteristic.
This phenomenon suggests that when conducting higher-order momentary risk spillover analysis, using the time-domain spillover index to monitor market volatility and risk transmission at a certain point in time, together with the frequency-domain spillover index to analyse its long-term trend and stability, can provide investors with a more forward-looking basis for investment decisions and identify potential risks and opportunities. Moreover, we compare the two types of spillover effects. If a market weakly influences others and receives minimal risk spillover, it becomes a suitable safe-haven investment. In this case, the stability of the market is more reliably verified.
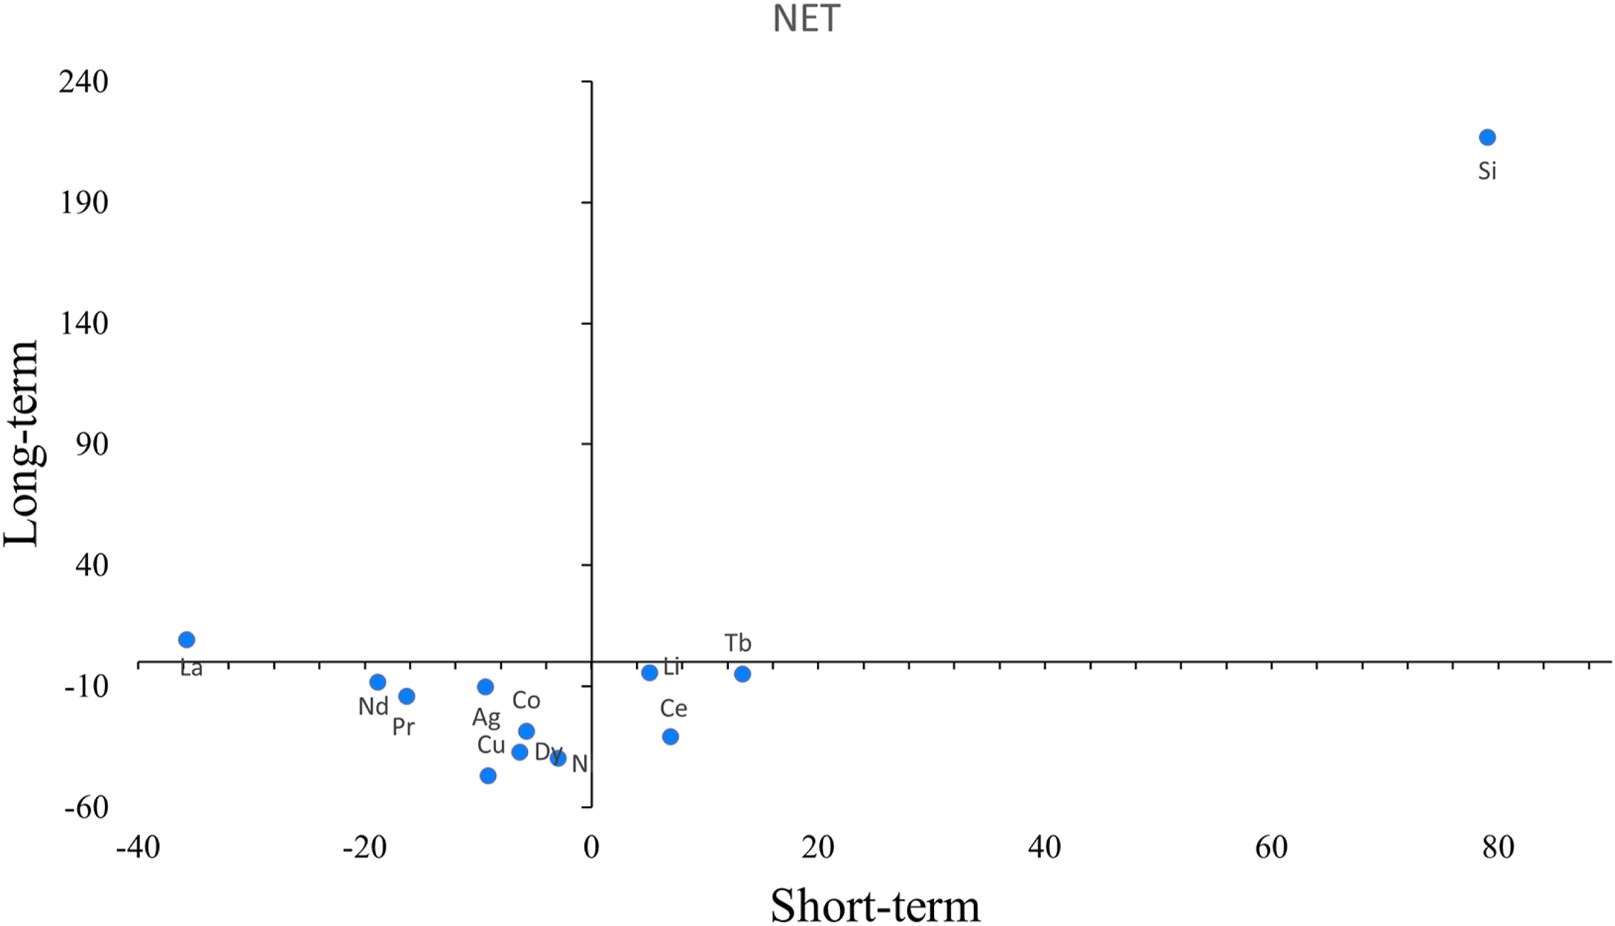
With regard to the net spillover characteristics between new energy materials and rare earth elements (See Figures 15–18), the two markets can be discussed in four scenarios. First, combining long-term and short-term perspectives, similar to silicon for return risk and volatility risk, terbium for skewness risk, and cobalt for kurtosis risk, all of which have more significant long and short-term positive spillovers. Investors and policymakers should take full account of the risk shocks emanating from these markets or their strong persistence in risk management. Monitoring and analysis of market dynamics should be strengthened, investment portfolios should be flexibly adjusted, and a flexible risk management mechanism should be established to ensure that timely responses can be made in the event of both long-term and short-term risk spillovers.
FIGURE 15
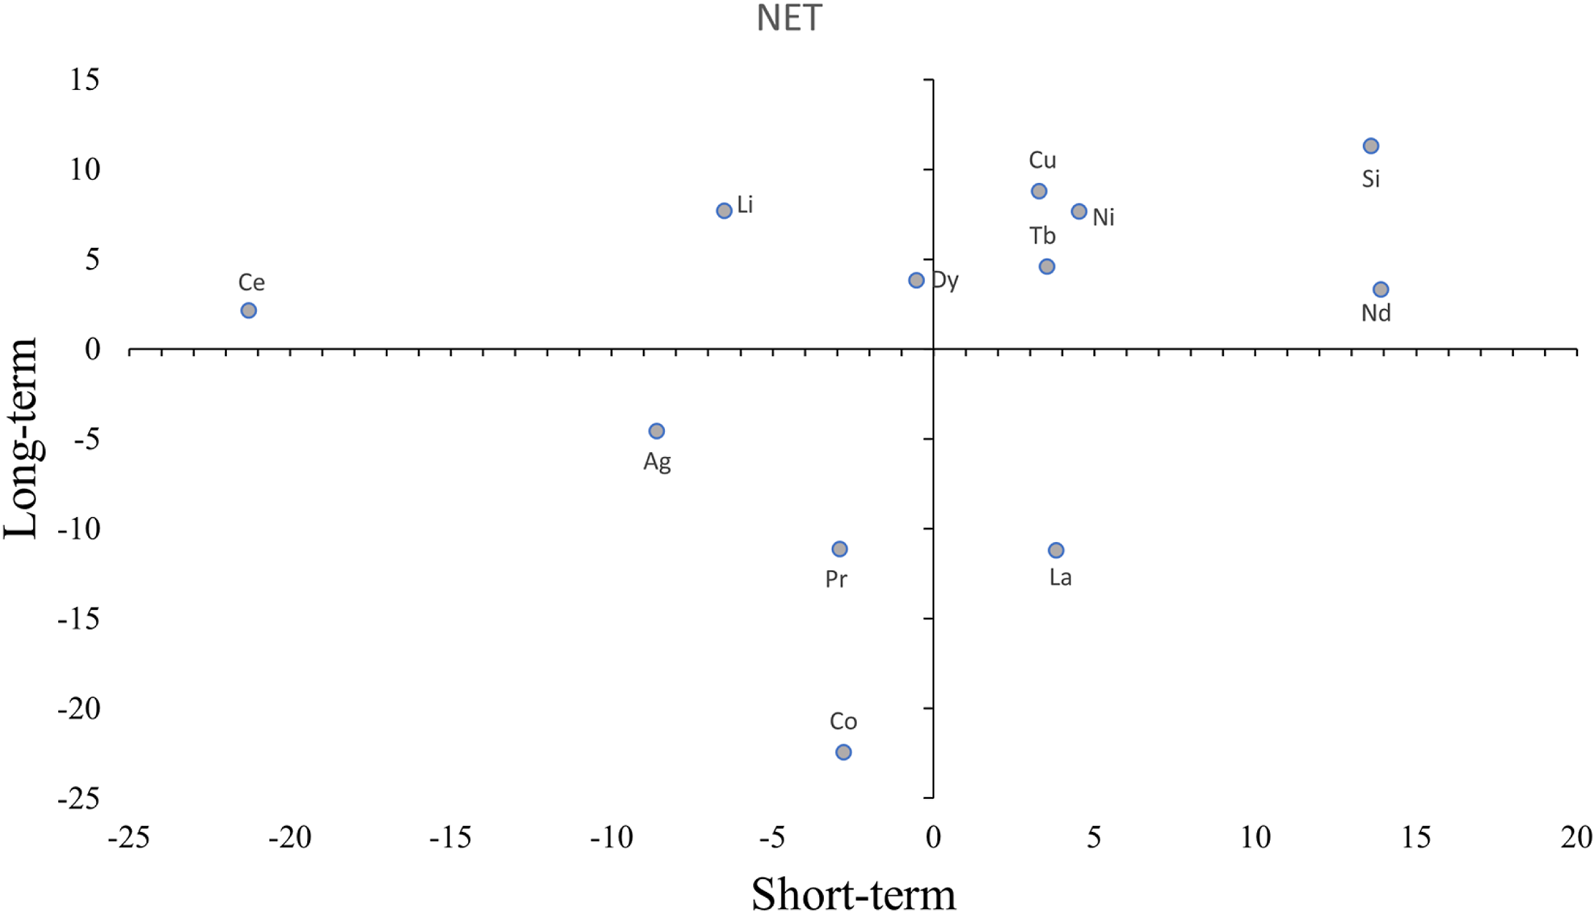
Return NET spillover in the short and long terms.
FIGURE 16
Volatility NET spillover in the short and long terms.
FIGURE 17
Skewness NET spillover in the short and long terms.
FIGURE 18
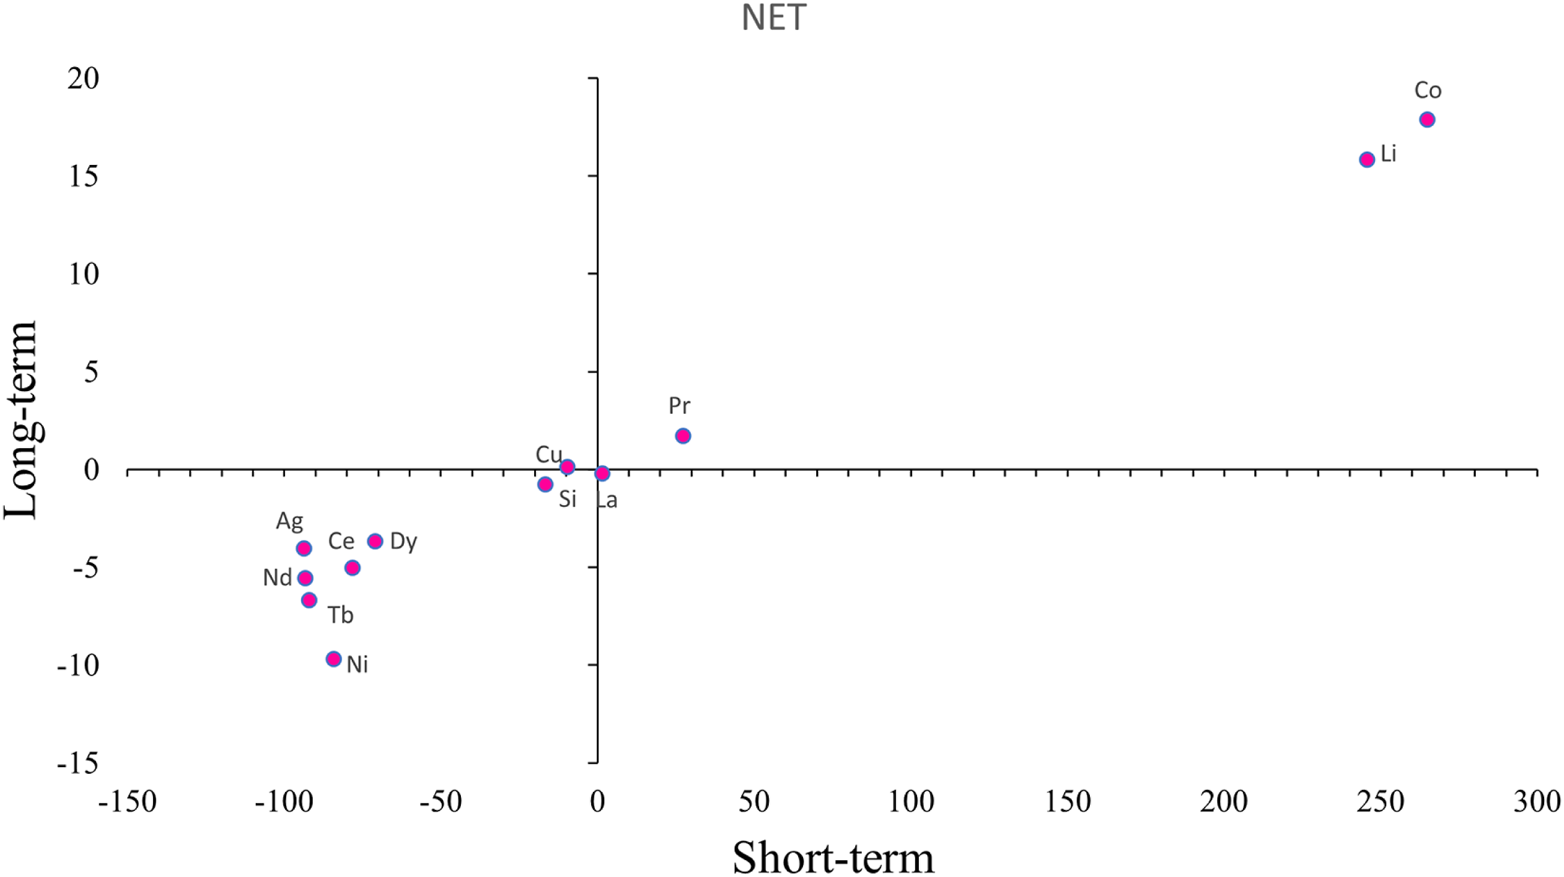
Kurtosis NET spillover in the short and long terms.
With regard to the second category, these markets are net receivers in the short term and in the long term are in a more balanced position in terms of risk sending and receiving, demonstrating a distinctive market nature. For example, cerium for return risk, lanthanum for volatility and skewness risk, and silver for kurtosis risk. Investors should have the flexibility to respond to short-term market movements in such markets while focusing on long-term industry trends and fundamental changes in order to achieve effective risk control and optimise their investment portfolios when managing risk. The nature of such markets provides investors with the opportunity to trade on short-term volatility, while long-term stability is an important safeguard to protect the value of their investments.
Similarly, there are some markets that have significant risk-receiving characteristics over the long term, but are able to achieve a relative balance of risk in the short term. Examples include cobalt for return risk, nickel for volatility risk, and lithium for skewness risk. The ability of these markets to achieve a relative balance of risk in the short term is largely due to their efficient market mechanisms and the flexible response strategies of participants. For example, market participants used hedging instruments and dynamic asset allocation to cope with short-term volatility, thereby reducing potential risks. In addition, the transparency of relevant policy and market information facilitates quick adjustment of investment strategies. However, in the long term, these markets have again become notable risk takers due to their long-term supply and demand relationships and industry characteristics. The irreplaceability of metals such as lithium, cobalt and nickel in the new energy sector has led to the market’s quest for long-term value to outweigh short-term volatility, and investors are willing to take on risk to capture potential long-term gains. Therefore, while short-term risks can be managed and regulated to maintain a balance, changes in market characteristics and demand structure in the long term make it a natural risk taker.
In addition to the markets mentioned above, we believe that if a market has significant negative net spillovers in both the short and long term, investors and regulators in such markets need to be particularly wary of risk transmission from price changes in other markets. Copper for volatility risk, neodymium for skewness risk, and nickel for kurtosis risk are typical. These metals markets are not only exposed to their own risk, but also receive a significant amount of risk impact from other markets, both in the short and long term. Specifically, volatility-risky copper may absorb volatility risk factors from other markets as a result of economic uncertainty; skewness-risky neodymium shows sensitivity to asymmetric risk during market volatility, leading to the absorption of external risk; and kurtosis-risky nickel reflects the market’s high sensitivity to the frequency of extreme events, which exacerbates the capture of risk from other markets.
6 Conclusion and discussion
By analysing the risk transfer between rare earth elements and new energy-related metal markets, this paper reveals the significant impact of co-production and co-consumption on market risk.
Based on the overall spillover indices of different order moments, the significant rise in the four types of risks mainly stems from the support of government industrial policies, resource control and increased global competition for resources. These policies raised market expectations of future returns while triggering increased short-term uncertainty, leading to frequent extreme market volatility and reflecting a complex risk environment.
Neodymium has been identified as a key major source of risk spillover in the extreme risk net spillover index and the maximum paired spillover index analyses. As the most consumed rare earth element, when neodymium price faces extreme risk, the risk factors may directly affect the neodymium market, which in turn affects the whole new energy industry chain. Therefore, it is recommended to prioritise the launch of neodymium metal futures contracts, giving full play to its advantages of high market maturity and stable industrial demand. In the specific implementation process, need to simultaneously establish supporting derivatives tools and standardised delivery system, through the cultivation of diversified market participants to enhance the liquidity, so as to build a perfect risk management mechanism. This initiative can effectively smooth out the impact of neodymium price fluctuations on the industrial chain, but also for the subsequent launch of other rare earth futures varieties to accumulate experience, and ultimately achieve the strategic goal of stabilising the rare earth market and ensuring the healthy development of the industry.
The Maximum Pairwise Spillover Index reveals the interactions and risk transfer in the market for new energy-related metals and rare earth elements. In the skewness and kurtosis risk premium analyses, the maximum risk spillover value is significantly higher than return and volatility, suggesting a strong asymmetric price volatility risk-transfer effect in the market as well as anomalous volatility connectivity in the face of external shocks. All of the above strongly correlated metal combinations have co-production and co-consumption relationships. This suggests that the two types of production-consumption relationships are highly susceptible to strong potential interactions in the corresponding metal markets and that policymakers should pay close attention to metals that have such relationships as a result of technological developments.
In the analysis of the evolution of spillover networks, the details of the evolution of volatility spillover networks are the most interesting to explore compared to other risk spillover networks that are fixed in form. In particular, rare earth markets tend to evolve as risk emitters, while new energy-related metal markets are more likely to evolve as risk receivers. This situation highlights the key position of rare earths in the new energy industry chain, coupled with the fact that the rare earth element market is more vulnerable to policy regulation and international market competition, its market instability and risk transmission has the potential risk of triggering a chain reaction, which requires the industry chain participants to pay close attention to market dynamics, strengthen risk management and cooperation, in order to ensure the stability and sustainable development of the new energy industry chain.
For downstream industries such as wind power and electric vehicles, this study suggests that enterprises focus on the price fluctuation risk of metal markets that are strongly correlated with rare earth elements. For example, the wind power industry relies on NdFeB permanent magnet materials, while the electric vehicle industry chain is highly sensitive to the demand for cobalt and copper, so companies can hedge the risk of raw material price fluctuations by signing long-term supply agreements or using futures tools.
In the comparative analysis of long- and short-term market linkages for each order of moment risk, the relationship between long- and short-term spillovers for volatility risk is more pronounced, with acceptance spillovers showing a negative correlation and external spillovers showing a significant positive correlation. For both skewness and kurtosis risk, there is a clear positive long- and short-term correlation for the external spillover, and when the market has a strong short-term external impact, the long-term impact is also strong. In terms of net spillover characteristics, for markets with significant positive spillovers in both the long and short term, investors and policymakers need to focus on risk shocks from these markets. For markets that are net receivers in the short run and where the net risk spillover is close to zero in the long run. Investors can adopt active investment strategies, such as capturing short-term upside and liquidity opportunities, while flexibly adjusting their positions in response to market volatility. The other type of market is one that can achieve a relatively balanced risk profile in the short term, but become a significant risk taker in the long term. Investors should implement effective risk management measures, including asset diversification, hedging strategies and dynamic portfolio adjustments, to reduce the risk of long-term volatility and ensure the sustainability and stability of their investments. Finally, for markets with significant negative net spillovers in both the short and long term, investors and regulators need to be particularly vigilant against risk transmission from price changes in other markets. These findings provide investors with an important basis for risk management, helping to optimize portfolios and protect investment value.
In order to obtain more in-depth conclusions, future research could consider constructing quantitative indicators of policy impacts and geopolitics. In this way, the shock transmission paths of both can be comprehensively analysed.
Statements
Data availability statement
The raw data supporting the conclusions of this article will be made available by the authors, without undue reservation. Requests to access these datasets should be directed to Hao Nong, 231601011@csu.edu.cn.
Author contributions
RZ: Visualization, Data curation, Methodology, Formal Analysis, Writing – review and editing, Software, Supervision, Writing – original draft, Resources, Conceptualization, Validation. HN: Conceptualization, Writing – review and editing, Formal Analysis, Writing – original draft, Data curation, Methodology. QC: Resources, Validation, Writing – review and editing, Conceptualization, Formal Analysis. LS: Conceptualization, Writing – original draft, Funding acquisition, Validation, Project administration, Formal Analysis. HZ: Software, Conceptualization, Resources, Formal Analysis, Writing – review and editing. YZ: Writing – review and editing, Software, Conceptualization, Validation, Formal Analysis.
Funding
The author(s) declare that financial support was received for the research and/or publication of this article. The authors wish to express their gratitude for the support provided by National Science and Technology Major Project (2024ZD1002002), the National Natural Science Foundation of China (No. 72204273).
Conflict of interest
The authors declare that the research was conducted in the absence of any commercial or financial relationships that could be construed as a potential conflict of interest.
Generative AI statement
The author(s) declare that no Generative AI was used in the creation of this manuscript.
Publisher’s note
All claims expressed in this article are solely those of the authors and do not necessarily represent those of their affiliated organizations, or those of the publisher, the editors and the reviewers. Any product that may be evaluated in this article, or claim that may be made by its manufacturer, is not guaranteed or endorsed by the publisher.
Supplementary material
The Supplementary Material for this article can be found online at: https://www.frontiersin.org/articles/10.3389/fphy.2025.1616099/full#supplementary-material
Footnotes
1.^Details can be found in the report below: Rarw Earths Statistics and Information. https://www.usgs.gov/centers/national-minerals-information-center/rare-earths-statistics-and-information. A Federal Strategy to Ensure Secure and Reliable Supplies of Critical Minerals. https://www.commerce.gov/data-and-reports/reports/2019/06/federal-strategy-ensure-secure-and-reliable-supplies-critical-minerals. Study on the EU’s list of Critical Raw Materials Final Report. https://op.europa.eu/en/publication-detail/-/publication/c0d5292a-ee54-11ea-991b-01aa75ed71a1/language-en. Critical Minerals Strategy 2022. https://cdn.prod.website-files.com/6164f987875e87a4dbb1404e/635f07987a08e28cf7d1eee9_2022%20Australian%20critical-minerals-strategy_0-compressed.pdf.
2.^Details can be found in the survey report Critical Minerals Datase. https://www.iea.org/data-and-statistics/data-product/critical-minerals-datase.
References
1.
VakulchukROverlandI. Central Asia is a missing link in analyses of critical materials for the global clean energy transition. One Earth (2021) 4:1678–92. 10.1016/j.oneear.2021.11.012
2.
ApergisEApergisN. The role of rare earth prices in renewable energy consumption: the actual driver for a renewable energy world. Energy Econ (2017) 62:33–42. 10.1016/j.eneco.2016.12.015
3.
MadalenoMTaskinDDoganETzeremesP. A dynamic connectedness analysis between rare earth prices and renewable energy. Resour Pol (2023) 85:103888. 10.1016/j.resourpol.2023.103888
4.
XuJLLiJHCharlesVZhaoX. Evolution of the rare earth trade network: a perspective of dependency and competition. Geosci Front (2024) 15:101653. 10.1016/j.gsf.2023.101653
5.
GaoWWeiJZhangHZhangH. The higher-order moments connectedness between rare earth and clean energy markets and the role of geopolitical risk: new insights from a TVP-VAR framework. Energy (2024) 305:132280. 10.1016/j.energy.2024.132280
6.
AfflerbachPFridgenGKellerºRRathgeberAWStrobelF. The by-product effect on metal markets – new insights to the price behavior of minor metals. Resour Pol (2014) 42:35–44. 10.1016/j.resourpol.2014.08.003
7.
ZhangHLiZSongHGaoW. Insight into clean energy market’s role in the connectedness between joint-consumption metals. Energy (2024) 302:131831. 10.1016/j.energy.2024.131831
8.
ShammugamSRathgeberASchleglT. Causality between metal prices: is joint consumption a more important determinant than joint production of main and by-product metals?Resour Pol (2019) 61:49–66. 10.1016/j.resourpol.2019.01.010
9.
SunX. Supply chain risks of critical metals: sources, propagation, and responses. Front Energy Res (2022) 10:957884. 10.3389/fenrg.2022.957884
10.
NongHHuangQ. Total, quantile, and frequency risk transmission among metal commodities. Int J Finance and Econ (2024). 10.1002/ijfe.3017
11.
SuHWuQZhouNZhengY. Dynamic spillover of upstream primary metals and by-product metals market and its impact from the downstream new energy vehicles market. Mineral Econ (2024) 38:77–95. 10.1007/s13563-024-00456-9
12.
PataUKErdoganSPataSK. Response of renewable energy minerals to energy policy and technological advancement: an assessment of the Russian energy crisis. J Environ Manage (2024) 370:122608. 10.1016/j.jenvman.2024.122608
13.
LiuFYSuCWQinMLobontOR. Winner or loser? The bidirectional impact between geopolitical risk and energy transition from the renewable energy perspective. Energy (2023) 283:129174. 10.1016/j.energy.2023.129174
14.
NwonyeNGOnuseloguOCOAnisiubaCAEzeakuHCEgboOP. Dynamics of green metal price volatility in times of geopolitical tensions: effects of oil price shocks and carbon emissions futures. J Clean Prod (2023) 412:137383. 10.1016/j.jclepro.2023.137383
15.
DouSQZhuYGLiuJYXuDY. The power of mineral: shock of the global supply chain from resource nationalism. World Dev (2024) 184:106758. 10.1016/j.worlddev.2024.106758
16.
BaldiLPeriMVandoneD. Clean energy industries and rare earth materials: economic and financial issues. Energy Policy (2014) 66:53–61. 10.1016/j.enpol.2013.10.067
17.
ReboredoJCUgoliniA. Price spillovers between rare earth stocks and financial markets. Resour Pol (2020) 66:101647. 10.1016/j.resourpol.2020.101647
18.
GaoYLiuX. Time and frequency spillovers and drivers between rare earth and energy, metals, green, and agricultural markets. North Am J Econ Finance (2024) 72:102128. 10.1016/j.najef.2024.102128
19.
DingQHuangJChenJ. Time-frequency spillovers and the determinants among fossil energy, clean energy and metal markets. Energy J (2023) 44:259–86. 10.5547/01956574.44.2.qdin
20.
KamalEBouriE. Dependence structure among rare earth and financial markets: a multiscale-vine copula approach. Resour Pol (2023) 83:103626. 10.1016/j.resourpol.2023.103626
21.
ZhengBZhangYWQuFGengYYuH. Do rare earths drive volatility spillover in crude oil, renewable energy, and high-technology markets? —a wavelet-based BEKK-GARCH-X approach. Energy (2022) 251:123951. 10.1016/j.energy.2022.123951
22.
WengZHaqueNMuddGMJowittSM. Assessing the energy requirements and global warming potential of the production of rare earth elements. J Clean Prod (2016) 139:1282–97. 10.1016/j.jclepro.2016.08.132
23.
BalaramV. Rare earth elements: a review of applications, occurrence, exploration, analysis, recycling, and environmental impact. Geosci Front (2019) 10:1285–303. 10.1016/j.gsf.2018.12.005
24.
DushyanthaNBatapolaNIlankoonIRohithaSPremasiriRAbeysingheBet alThe story of rare earth elements (REEs): occurrences, global distribution, genesis, geology, mineralogy and global production. Ore Geology Rev (2020) 122:103521. 10.1016/j.oregeorev.2020.103521
25.
Cuadros-MuñozJ-RJimber-Del-RíoJ-ASorhegui-OrtegaRZea-De La TorreMVergara-RomeroA. Contribution of rare earth elements is key to the economy of the future. Land (2024) 13:1220. 10.3390/land13081220
26.
BinnemansKJonesPTMüllerTYurramendiL. Rare earths and the balance problem: how to deal with changing markets?J Sustainable Metall (2018) 4:126–46. 10.1007/s40831-018-0162-8
27.
NakagawaKUchiyamaY. GO-GJRSK model with application to higher order risk-based portfolio. Mathematics (2020) 8:1990. 10.3390/math8111990
28.
AntonakakisNChatziantoniouIGabauerD. Refined measures of dynamic connectedness based on time-varying parameter vector autoregressions. J Risk Financial Manage (2020) 13:84. 10.3390/jrfm13040084
29.
DieboldFXYilmazK. Better to give than to receive: predictive directional measurement of volatility spillovers. Int J Forecast (2012) 28:57–66. 10.1016/j.ijforecast.2011.02.006
30.
DingQHuangJBChenJY. Dynamic and frequency-domain risk spillovers among oil, gold, and foreign exchange markets: evidence from implied volatility. Energy Econ (2021) 102:105514. 10.1016/j.eneco.2021.105514
31.
BaruníkJKřehlíkT. Measuring the frequency dynamics of financial connectedness and systemic risk. J Financial Econom (2018) 16:271–96. 10.1093/jjfinec/nby001
32.
BlancoMI. The economics of wind energy. Renew Sustain Energ Rev (2009) 13:1372–82. 10.1016/j.rser.2008.09.004
33.
BuchholzPBrandenburgT. Demand, supply, and price trends for mineral raw materials relevant to the renewable energy transition wind energy, solar photovoltaic energy, and energy storage. Chem Ingenieur Technik (2018) 90:141–53. 10.1002/cite.201700098
34.
MånbergerAStenqvistB. Global metal flows in the renewable energy transition: exploring the effects of substitutes, technological mix and development. Energy Policy (2018) 119:226–41. 10.1016/j.enpol.2018.04.0568
35.
Alves DiasPBobbaSCarraraSPlazzottaB. The role of rare earth elements in wind energy and electric mobility. Luxembourg: European Commission (2020).
36.
JonesBElliottRJNguyen-TienV. The EV revolution: the road ahead for critical raw materials demand. Appl Energy (2020) 280:115072. 10.1016/j.apenergy.2020.115072
37.
OrtegoACalvoGValeroAIglesias-EmbilMValeroAVillacampaM. Assessment of strategic raw materials in the automobile sector. Resour Conservation Recycling (2020) 161:104968. 10.1016/j.resconrec.2020.104968
38.
CalvoGValeroA. Strategic mineral resources: availability and future estimations for the renewable energy sector. Environ Dev (2022) 41:100640. 10.1016/j.envdev.2021.100640
39.
FarinaAAnctilA. Material consumption and environmental impact of wind turbines in the USA and globally. Resour Conservation Recycling (2022) 176:105938. 10.1016/j.resconrec.2021.105938
40.
GielenDLyonsM. Critical materials for the energy transition: rare earth elements. Int Renew Energy Agency (2022) 1–48.
41.
PeiróLTMartinNMéndezGVMadrid-LópezC. Integration of raw materials indicators of energy technologies into energy system models. Appl Energy (2022) 307:118150. 10.1016/j.apenergy.2021.118150
42.
MaaniTMathurNRongCBSutherlandJW. Estimating potentially recoverable Nd from end-of-life (EoL) products to meet future US demands. Resour Conservation Recycling (2023) 190:106864. 10.1016/j.resconrec.2023.106864
Summary
Keywords
co-production, co-consumption, rare earths, higher-order moment, risk contagion
Citation
Zheng R, Nong H, Chen Q, Shao L, Zhang H and Zhang Y (2025) Study on risk contagion between rare earth and new energy-related metals markets from the perspective of co-production and co-consumption. Front. Phys. 13:1616099. doi: 10.3389/fphy.2025.1616099
Received
22 April 2025
Accepted
16 May 2025
Published
05 June 2025
Volume
13 - 2025
Edited by
Ze Wang, Capital Normal University, China
Reviewed by
Hailing Li, Hunan Agricultural University, China
Xuesong Dong, Hunan Agricultural University, China
Yingli Li, Zhengzhou University, China
Updates
Copyright
© 2025 Zheng, Nong, Chen, Shao, Zhang and Zhang.
This is an open-access article distributed under the terms of the Creative Commons Attribution License (CC BY). The use, distribution or reproduction in other forums is permitted, provided the original author(s) and the copyright owner(s) are credited and that the original publication in this journal is cited, in accordance with accepted academic practice. No use, distribution or reproduction is permitted which does not comply with these terms.
*Correspondence: Hao Nong, 231601011@csu.edu.cn
Disclaimer
All claims expressed in this article are solely those of the authors and do not necessarily represent those of their affiliated organizations, or those of the publisher, the editors and the reviewers. Any product that may be evaluated in this article or claim that may be made by its manufacturer is not guaranteed or endorsed by the publisher.