Abstract
All animals, humans included, generate closed trajectories—or loops—by repeatedly leaving and returning to the same location. In this study we statistically analyse such closed paths by measuring their total length and the area that they enclose, and by quantifying the scaling law . Our data comprise GPS tracks for nine taxa archived in Movebank—common kestrel, demoiselle crane, tortoise, blue whale, reindeer, elephant, wildebeest, lion and nomadic humans—together with smartphone-based GPS logs of people moving in Urayasu, Japan. Daily loops extracted from these records reveal a two-regime geometry: for short displacements both humans and kestrels display nearly two-dimensional behaviour with , whereas for longer distances the exponent drops to , indicating a transition toward one-dimensional excursions. At the annual scale every species shows seasonal round-trip movement, yet the trajectory exponent diverges by taxon: nomadic humans, demoiselle cranes, tortoises and blue whales yield , wildebeest, elephants, and lions fall between 1 and 2, and reindeer approach . These results suggest that open environments such as sky, ocean or plain foster two-dimensional roaming, while strong social or environmental constraints—for example, herd mobility—compress movement toward a one-dimensional pattern. A Lévy-flight simulation that incorporates a return potential and bounds the turning angle reproduces the observed clusters, demonstrating that the strength of directional constraints is a key determinant of geometric dimensionality. Our findings establish the exponent as a simple, quantitative metric for comparing movement patterns across species and across spatial and temporal scales.
1 Introduction
The widespread adoption of GPS-enabled smartphones has facilitated the collection of detailed human movement trajectories. These data have enabled multidimensional analyses of human mobility, fostering progress in diverse research areas including urban planning, disaster response, and transportation system improvements (e.g., Zhao et al. [1]; Andrade et al; [2]; Ghahramani et al. [3]). Moreover, these benefits are not confined to studies of human populations: GPS technology now permits the collection of detailed movement data for animals, significantly advancing research in fields such as ecology and behavioral science (e.g., Niga et al. [4]; Mastrantonio [5]).
The main difference between human and animal trajectory datasets is their volume. Whereas human movement trajectories can be obtained at the scale of tens of thousands of individuals per day from vendors [6]; by contrast, animal data often range from only a few individuals to at most a few hundred. This disparity exists because humans routinely carry GPS-enabled smartphones, whereas animals must each be fitted with tracking devices. Furthermore, the term “animals” encompasses a wide array of species, including birds, mammals, amphibians, reptiles, and fish. Few studies directly compare such diverse taxa, as animal-movement research typically focuses on the idiosyncrasies of single species.
Since the late 20th century, the collection of animal movement data has progressed rapidly. However, in the early stages, data were often managed independently by different researchers and institutions, resulting in a large amount of unshared data and making it difficult to advance studies efficiently on the same regions or species. To address this issue, in 2007, the Max Planck Institute for Ornithology (now the Max Planck Institute of Animal Behavior) in Germany took the lead in developing the Movebank system [7], a centralized database that allows open-access data sharing and analysis. Currently, more than 1,000 research projects manage their data on Movebank, and thousands of species, including humans, mammals, birds, and reptiles, have accumulated movement data on this platform.
Here, we analyze mammal, bird, and reptile trajectories drawn from the Movebank database. Specifically, we examine whether the statistical properties we previously identified in human movement—concerning the relationship between the length of movement trajectories and the areas they enclose [8]—are also observable in the trajectories of these animals. Through this investigation, we discuss potential similarities or differences between humans and animals, as well as across different animal species.
This paper is organized as follows. In Section 2, we describe the two types of movement trajectory data examined in this study. The first type is the human movement trajectory data collected via GPS from devices such as mobile phones and smartphones that people carry. The second type is the movement trajectory data archived in Movebank for various animals, including humans. In Section 3, we first review our previous research [8], which investigates statistical properties observed between the length of a person’s daily movement trajectory and the area it encloses. We then show that the same statistical properties observed in human movement trajectories also appear in the daily trajectories of the kestrel, a bird species whose detailed movement records are available in Movebank. In Section 4, we discuss the annual periodicity in the movement trajectories of eight species of animals, including humans, stored in Movebank, and we explore the statistical properties observed between the total distance traveled in 1 year and the corresponding enclosed area. In Section 5, we demonstrate that these observed statistical properties between trajectory length and enclosed area can be reproduced using a Lévy flight model that incorporates a potential, thereby enforcing a return-to-origin condition. Finally, in Section 6, we summarize our findings, discuss their implications, and present future perspectives.
2 Data
In this section, we introduce the two types of trajectory data used in this paper. One dataset, employed in Section 3.1, was purchased from Agoop Inc. and consists of GPS data collected from smartphones carried by pedestrians that passed through Urayasu City in Chiba Prefecture during August 2022, covering about 20,000 people per day. These trajectories are recorded at 1-min intervals of latitude and longitude, lack transport-mode information and cannot be linked across days. We focus on those trajectories composed of at least five latitude–longitude points, with the distance between the start and end points being less than 10 km.
According to the user manual, human location data obtained from smartphones via Agoop has an approximate spatial accuracy of less than 20 m. It should be noted, however, that even when a person departs from and returns to their home, the recorded coordinates at the start and end of the trip often do not match exactly. One reason for this discrepancy is that vendors typically delete location logs within several hundred meters of a user’s residence to prevent the identification of private homes. Furthermore, although the location logs are generally recorded at 1-min intervals, the interval may exceed 5 min depending on the situation. Considering the potential movement that can occur during such gaps, the discrepancy between the starting and ending positions may reach up to approximately 10 km, even if the person returns to the same physical location. Therefore, if the distance between the starting and ending points is less than 10 km, we assume the trajectory forms a closed loop and treat it as such in our analysis. Similarly, most of the movement data registered in Movebank is GPS-based. When measurement accuracy is documented, it is typically comparable to that of the Agoop data. However, in the case of animal trajectories, we set a stricter threshold by assuming that the trajectory is closed if the distance between the starting and ending points is less than 1 km, taking into account the typical movement speeds of animals. In this study, we define a closed trajectory based on the criteria described above and limit our analysis to such trajectories.
For example, Figure 1a shows the trajectory of a person who traveled through Urayasu City on August 7, covering a distance of 127.9 km and enclosing an area of 11.5 . The starting point is shown as a green dot, and the ending point is shown as a red dot. Figure 1b illustrates another trajectory from August 1, spanning 3.21 km and enclosing an area of 0.69 .
FIGURE 1
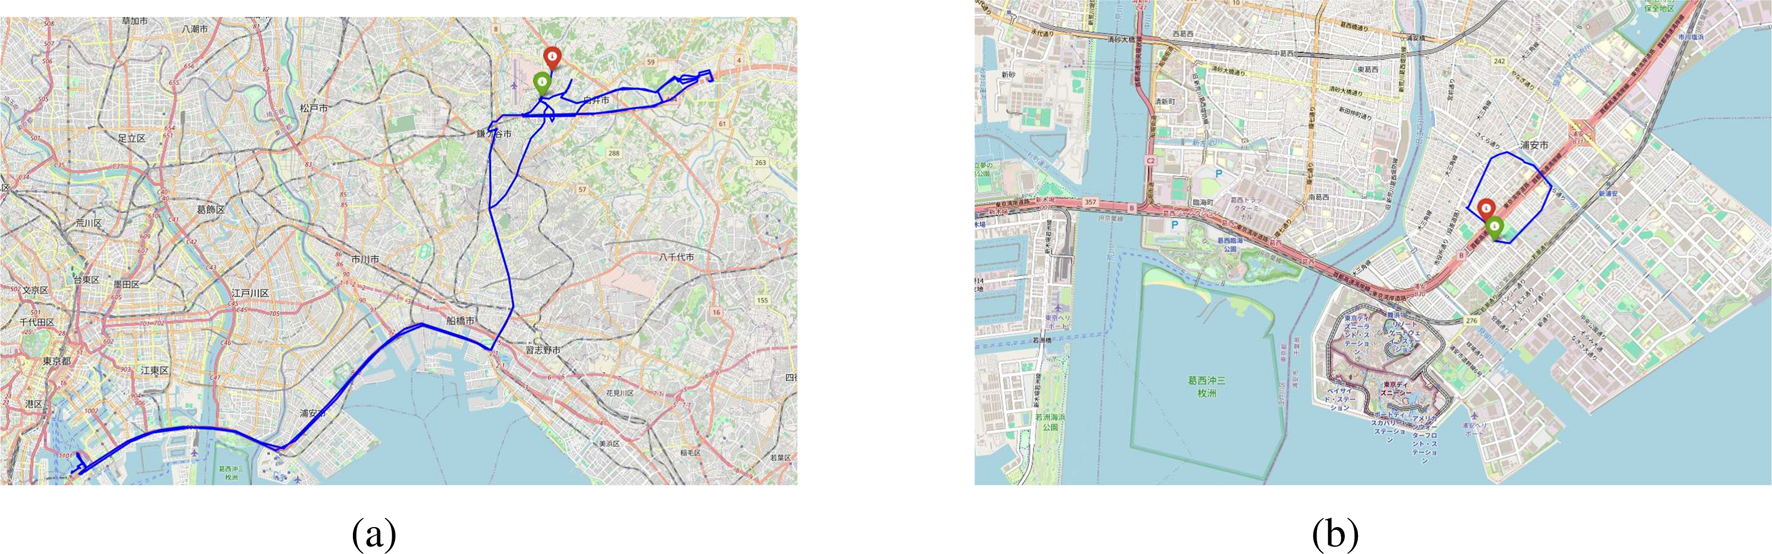
The trajectories of two people traveling within Urayasu City on August. (a) The trajectory of a person who traveled within Urayasu City on August 7, with a trajectory length of 127.9 km and an enclosed area of 11.5 . (b) The trajectory of a person traveling within Urayasu City on August 1, with the trajectory measuring 3.21 km in length and enclosing an area of 0.69 .
Another dataset consists of animal movement trajectories registered in Movebank. As of December 2024, there are approximately 850 projects in Movebank that provide downloadable animal tracking data. From these, we analyze the movement trajectories of the common kestrel and demoiselle crane (birds), the elephant, blue whale, reindeer, lion, wildebeest, and human (mammals), and the tortoise (reptiles).
1. The common kestrel is a bird classified under the order Falconiformes and the family Falconidae, widely distributed across the Eurasian and African continents. In winter, individuals either remain in their breeding grounds or migrate to warmer areas. In this paper, we focus on data [9] from a research project dealing with non-migratory individuals to analyze movement trajectories where the start and end points are close. Because this dataset records positions at an average interval of a few minutes, we use it for 1-day movement trajectory data in Section 3.2.
From Item 2 onward, many of the movement trajectory datasets contain only a few location data points per day, but they cover a long period ranging from several years to more than a decade, so we use them in
Section 4.
2. The demoiselle crane is a relatively small crane known for its long-distance migrations over the Himalayas at altitudes of around 8,000 m. During the breeding season, they form small groups made up of pairs or families, but during migration, they may form large flocks ranging from hundreds to thousands of individuals. Data on demoiselle cranes are provided by eight research projects [11–17].
3. Elephants are the largest land animals, typically moving in small groups of around 5–20 individuals (data from seven research projects [18–24]).
4. Blue whale is the largest animal on Earth, generally moving in pairs or small groups (2–3 individuals) (data from six research projects [25–30]).
5. Reindeer are deer-family animals that move in herds. In summer, they form small groups of a few dozen, and in winter, they form large herds of tens of thousands to hundreds of thousands of individuals. Some individuals travel more than 5,000 km per year, placing them among the longest annual migrators among mammals (data from two research projects [31, 32]).
6. Lions are large carnivores belonging to the cat family, moving in groups of 3–30 individuals (data from three research projects [33–35]).
7. Wildebeests are herbivorous animals of the Bovidae family, known for migrating in massive herds of millions of individuals each year. Lions are their largest natural predator (data from three research projects [36–38]).
8. Human data from nomadic peoples in the Far North region of Cameroon has also been registered (data from four research projects [21–23, 39]).
9. Tortoises are a type of turtle inhabiting arid regions, grasslands, and forests. They have a strong sense of territory, do not form groups, and generally do not interact with other individuals except during breeding (data from five research projects [40–44]).
The dataset comprises 17 recorded columns. For our analysis, we extracted four of these fields—timestamp (the date and time when the data were recorded), location-long (the longitude of the individual’s position), location-lat (the latitude of the individual’s position), and individual-local-identifier (the individual’s identifier).
For instance, Figure 2a shows approximately 1 year of movement data for the kestrel with the individual-local-identifier “5829,” Figure 2b illustrates about 4 years of movement data for the demoiselle crane with the identifier “H33-6233,” and Figure 2c depicts roughly 14 years of movement data for the tortoise “Alison” on Santa Cruz Island in the Galapagos archipelago.
FIGURE 2
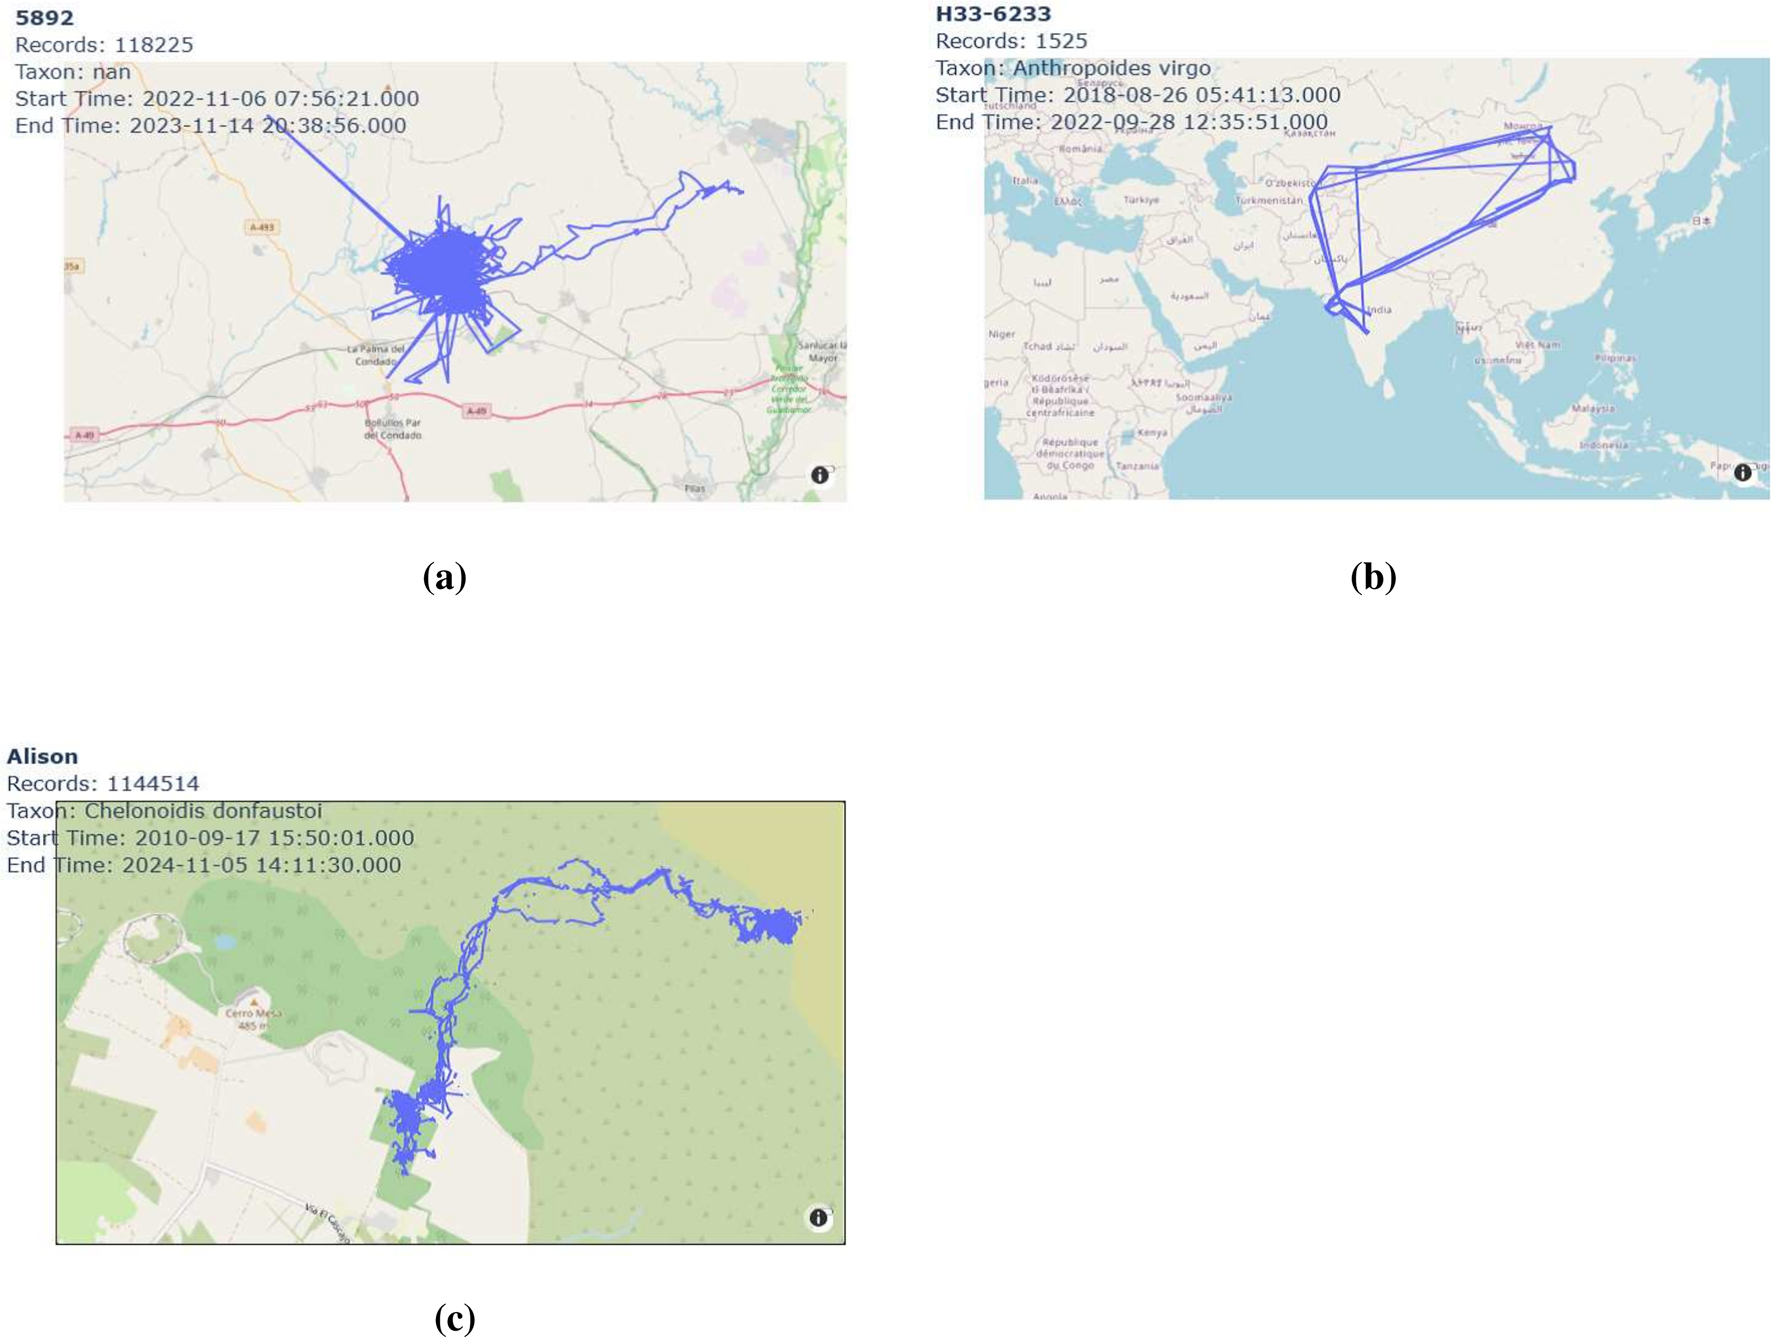
Movement trajectories of three individuals: (a) kestrel (ID “5829”), (b) demoiselle crane (ID “H33-6233”), (c) tortoise (ID “Alison”). (a) Movement trajectory of the kestrel (ID “5829”) from 6 November 2022 to 14 November 2023. (b) Movement trajectory of the demoiselle crane (ID “H33-6233”) from 26 August 2018 to 28 September 2022. (c) Movement trajectory of the tortoise (ID “Alison”) on Santa Cruz Island from 17 September 2010 to 5 November 2024.
3 Daily trajectories
3.1 Human movement
In this section, as prior research for this paper, we review the statistical relationship observed between the length of people’s daily movement trajectories and the area enclosed by them [8]. Figure 3a presents a scatter plot, on double logarithmic axes, of the length of movement trajectories ( km) and the enclosed area for people moving within Urayasu City on 7 August 2022, with a total of 14,492 data points. If the movement trajectory were a perfect circle, it would satisfy . Alternatively, if the movement trajectory were out-and-back with nearly perfect overlap on the outbound and return routes, then . In reality, closed movement trajectories lie between a perfect circle and a nearly one-dimensional out-and-back route. This tendency can be quantified by the parameter defined by the following equation:
FIGURE 3
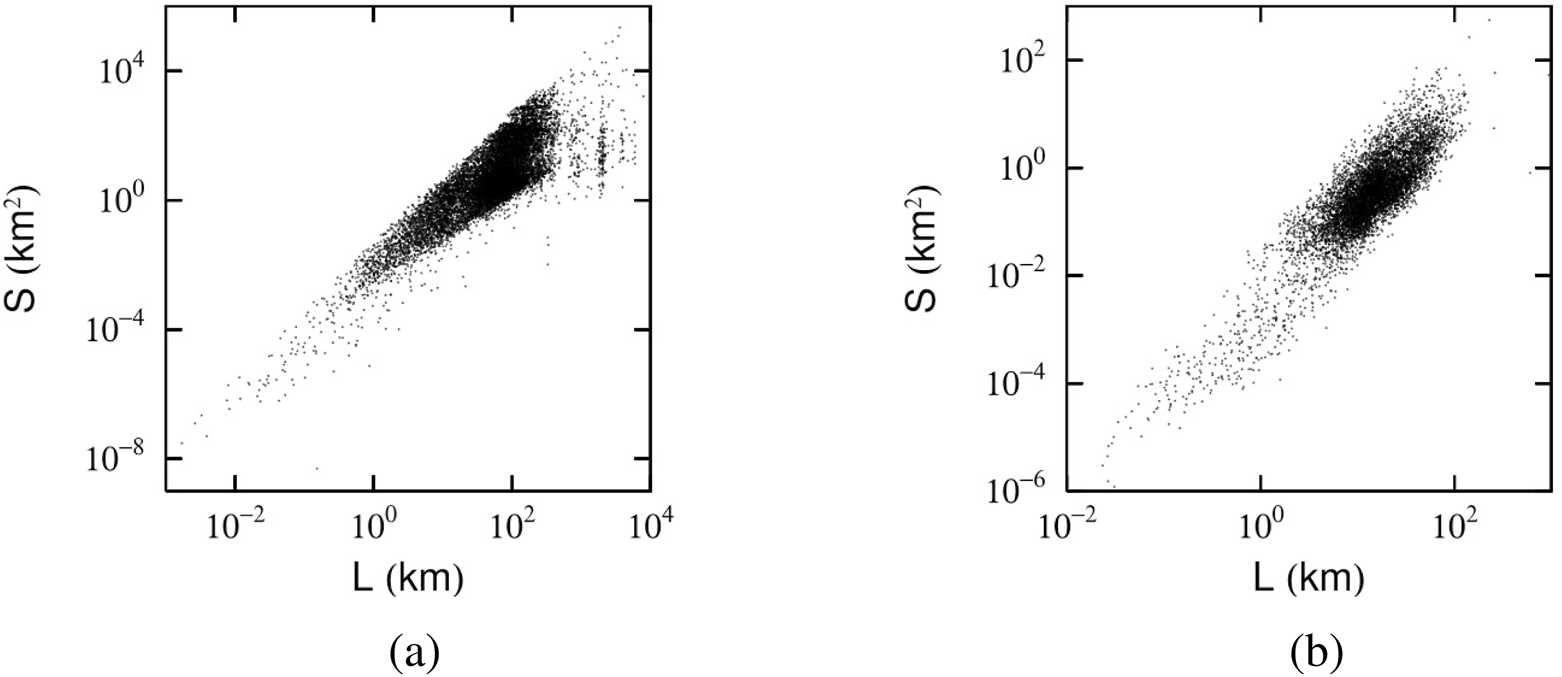
Scatter plot of the trajectory length km and enclosed area . (a) Scatter plot of the trajectory length km and enclosed area for people traveling in Urayasu City on 7 August 2022. (b) Scatter plot of the daily trajectories from 11,185 days of 53 kestrels recorded between 6 May 2020, and 15 June 2024.
As shown in Figure 3a, Equation 1 shows a strong correlation between and . Since we focus on movement trajectories consisting of five or more points, there are no trajectories with in our dataset. At the same time, the parameter differs for shorter and longer trajectories, with 5 km serving as a practical threshold corresponding to an adult’s typical walking distance over about 1 h. Applying least-squares fitting to the data in Figure 3a yields and . Here, applies to km and to km. Notably, indicates that when km, many trajectories form a two-dimensional loop enclosing a relatively large area (Figure 1b). By contrast, lying between 1 and 2 signifies that trajectories of km are more one-dimensional in nature, encompassing area only partially, as in Figure 1a. This result was observed throughout the entire month of August, not merely on August 7. Moreover, similar behavior emerged in data from Kyoto’s Shimogyo Ward and in Ishikawa Prefecture, implying that the phenomenon is not unique to Urayasu.
In Urayasu, is observed to be smaller on weekends and holidays than on weekdays, indicating that the one-dimensional tendency of long-distance movement becomes more pronounced on these days. In contrast, in Kyoto City’s Shimogyo Ward and in Ishikawa Prefecture, tends to be larger on weekends and holidays, suggesting that the two-dimensional tendency of long-distance movement is strengthened. These findings can be interpreted as follows: Urayasu is home to one of Japan’s largest theme parks, which attracts visitors from across the country, thus intensifying round-trip travel on weekends and holidays. Meanwhile, in Kyoto and Ishikawa—both regions renowned for numerous historical tourist spots—weekends and holidays encourage more extensive tours among multiple attractions.
3.2 Kestrel movement
The purpose of this study is to investigate the statistical relationship between the length of animal movement trajectories and the areas they enclose. To begin, we focus on the common kestrel (Falco tinnunculus) dataset registered in Movebank [9], which, like the human movement data analyzed in Section 3.1, provides detailed daily trajectories at minute-level intervals. Figure 3b plots the daily trajectories of 53 kestrels recorded from 6 May 2020, to 15 June 2024, encompassing a total of 11,185 days in which the distance between the start and end points is less than 1 km [9]. As the figure shows, non-migratory birds generally travel shorter distances in a single day compared to humans, likely because birds rely on their own flight power rather than mechanical means. Nevertheless, a strong correlation is also evident between and , mirroring the patterns observed in human movement.
Although this correlation may not be immediately apparent from the figure, applying a least-squares regression to the data in Figure 3b—and distinguishing short- and long-distance movements at the same 5 km threshold used for humans—yields and . These results suggest that, similar to humans, kestrels tend to exhibit two-dimensional, area-enclosing trajectories for relatively short distances, while longer distances are characterized by a more one-dimensional trajectory. The interpolation algorithm used in this study solely connects the start and end points of a trajectory. This connection is applied only when the start and end points are considered to match within the range of GPS error, privacy-preserving adjustments (e.g., for home locations), and potential movement inaccuracies. Therefore, the added segment by the interpolation algorithm can be approximately regarded as part of the actual movement trajectory. As such, the observed result of is not considered to be an artifact of the interpolation method. Indeed, in the case of the kestrel, for example, even when the connection is made at a threshold of less than 500 m instead of 1 km, the result remains consistent within the margin of error: .
Table 1 provides a comparison of the number of individuals, the total number of days, and the short- and long-distance movement indices for humans (Urayasu) and kestrels analyzed in Section 3. These observations underscore that both species share common features in their daily trajectories, with comparable distinctions between short- and long-distance movements.
TABLE 1
| Animal species | Number of individuals | Total number of days | ||
|---|---|---|---|---|
| Human (Urayasu) | 14,492 | 14,492 | ||
| Common kestrel | 53 | 11,185 |
Animal species, number of individuals, total number of days, and short- and long-distance trajectory indices: , for daily movement trajectories.
4 Annual trajectories
In this section, we analyze multi-day trajectories using Movebank data, which could not be examined with the Agoop dataset. First, as introduced in Section 2, we focus on data from research projects related to demoiselle cranes, elephants, blue whales, reindeer, lions, wildebeest, humans (pastoralists), and tortoises registered in Movebank, grouping them by species for our analysis. The number of individuals for each species and the total number of days for which latitude and longitude data were recorded are summarized in Table 2.
TABLE 2
| Animal species | Number of individuals | Total number of days | |
|---|---|---|---|
| Demoiselle crane | 84 | 10,984 | |
| Elephant | 40 | 23,104 | |
| Blue whale | 178 | 5,023 | |
| Reindeer | 110 | 7,105 | |
| Lion | 29 | 11,994 | |
| Wildebeest | 52 | 24,422 | |
| Human (Nomadic) | 1,062 | 6,759 | |
| Tortoise | 54 | 103,111 |
Animal species, number of individuals, total number of days, and trajectory index: for 1-year movement trajectories.
4.1 Annual cycle
To gain an overview of their movement, we first focused on the time course of the mean squared displacement from the start date of observation for each species. Figure 4 shows the transitions in the mean square displacement for (a) demoiselle cranes and (b) tortoises. A prominent feature in these figures is the clear 365-day periodicity. Although not shown here due to space constraints, similar annual cycles can also be observed in elephants, blue whales, lions, reindeer, wildebeests, and humans. It is noteworthy that even humans (nomadic peoples) exhibit seasonal movement.
FIGURE 4
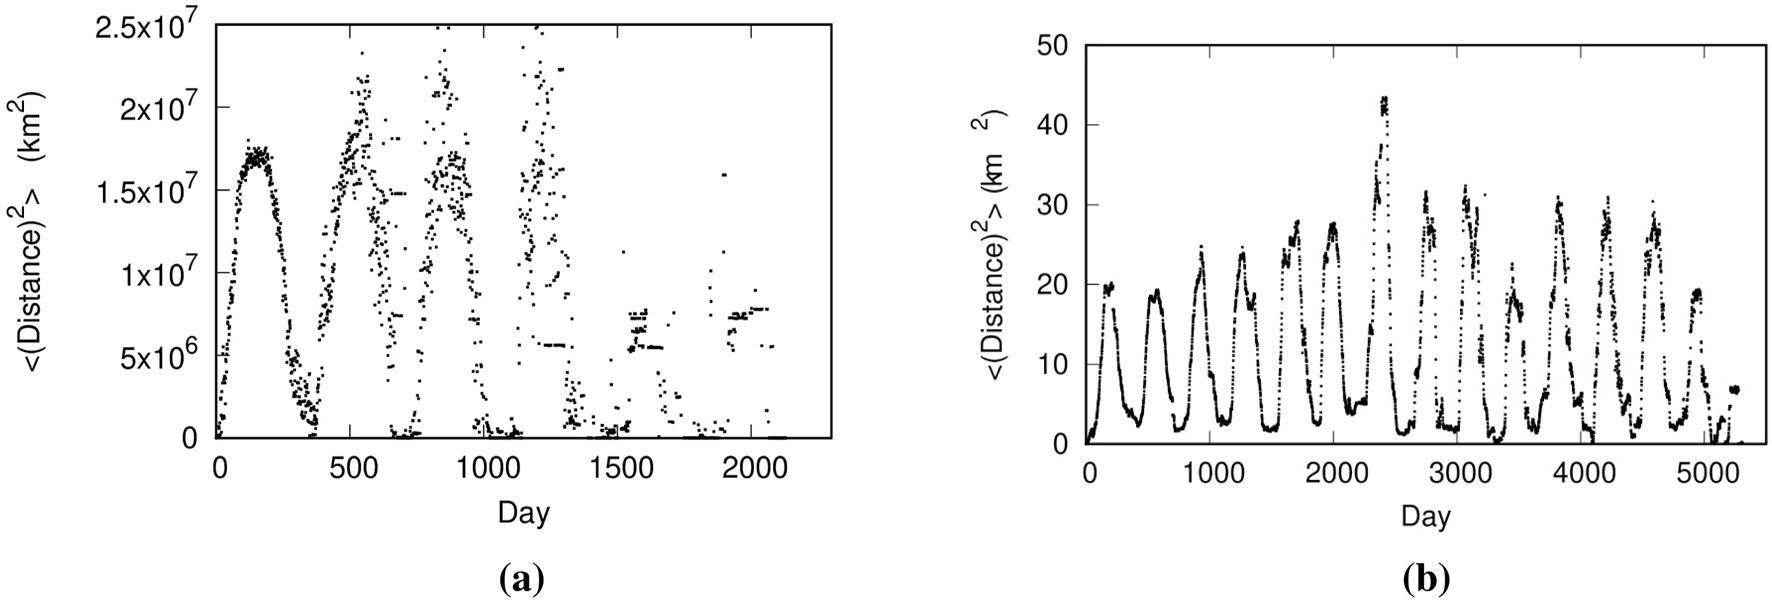
The relationship between the number of days elapsed since the start of the two species tracked and their mean squared travel distance: (a) Demoiselle cranes, (b) Tortoises.
4.2 Eight animal species
In this section, we take advantage of the fact that the eight animal species analyzed here exhibit an annual movement cycle. We investigate whether their movement patterns tend to enclose large areas in a two-dimensional fashion, or whether they follow a more one-dimensional path where outbound and return movements nearly overlap. This trend is evaluated by using the parameter .
For example, Figure 5a presents a scatter plot showing the annual trajectories of 84 demoiselle cranes, with the trajectory length km on the horizontal axis and the enclosed area on the vertical axis. In Figure 5a, a parabolic boundary can be observed between regions where data points exist and where they do not. This boundary reflects that, for a fixed movement distance , the enclosed area reaches its maximum when the trajectory is nearly circular (i.e., ).
FIGURE 5
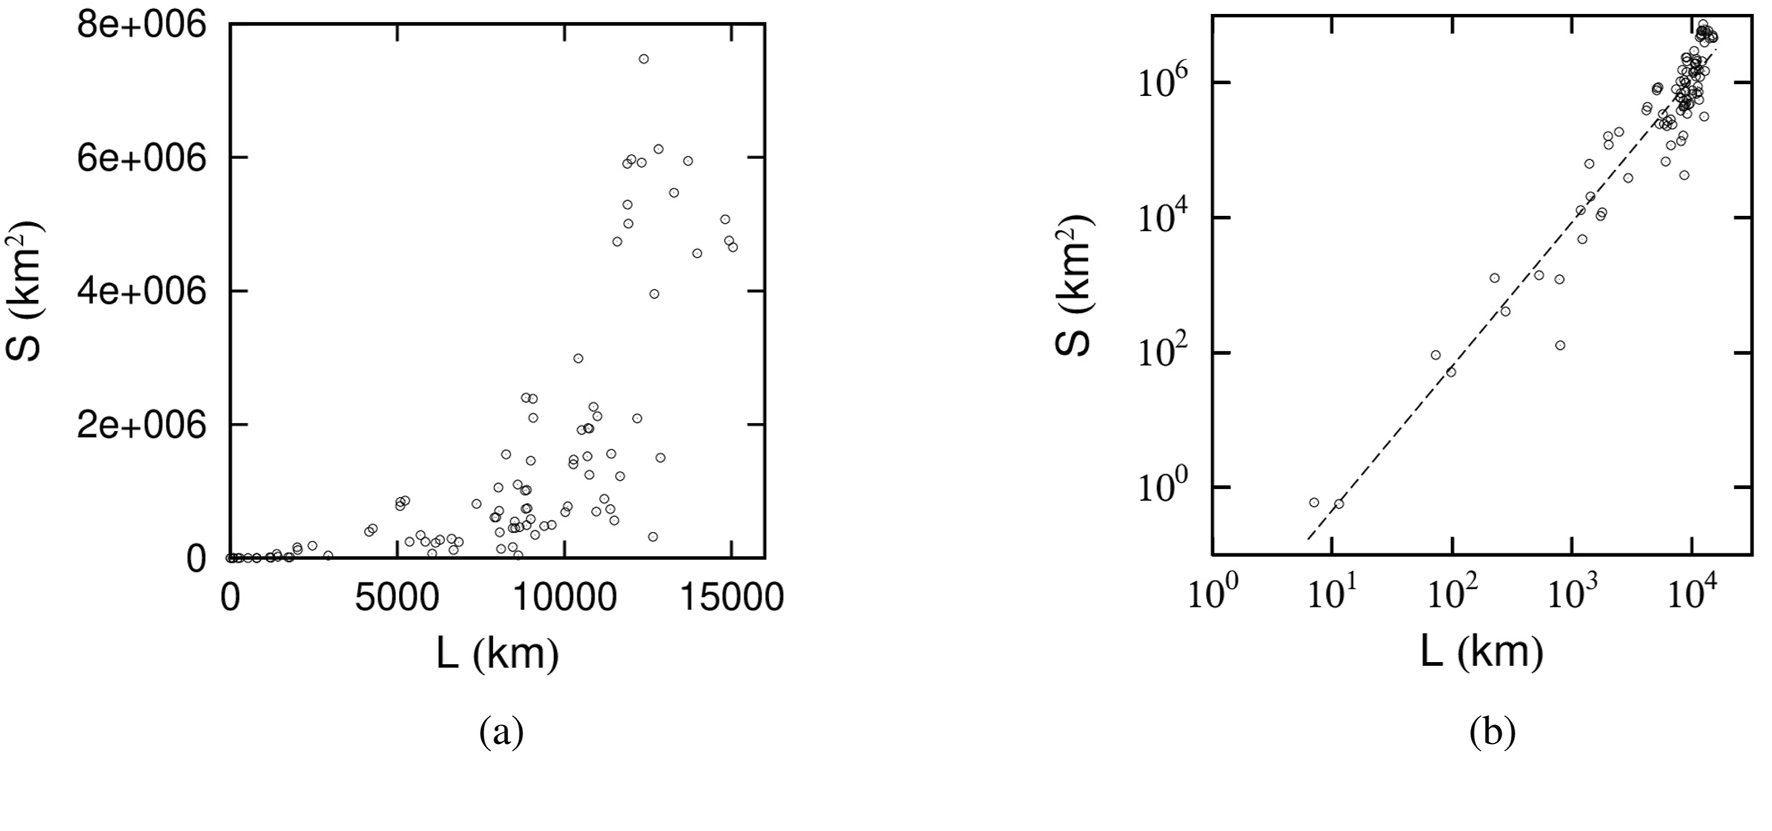
Scatter plot of the enclosed area versus the perimeter km for 1-year trajectories of 84 demoiselle cranes. (a) On linear plot. (b) On double-logarithmic plot. The best-fit line is shown as a dotted line.
At the same time, Figure 5a shows that both and span an extremely wide range. Consequently, plotting the data on logarithmic axes, as in Figure 5b, facilitates a clearer estimation of the parameter in Equation 1. From the best-fit line shown in Figure 5b, is evaluated to be . The fact that is close to 2 is consistent with the demoiselle crane’s trajectory covering large areas, as illustrated in Figure 4b.
A similar strong correlation between the enclosed area and the perimeter is observed for the annual trajectories of the other seven species as well. By estimating from each of these datasets, we obtain the results summarized in Table 2. A notable difference from the kestrel data in Section 3.2 is that, over the course of a year, there is no clear separation between short- and long-distance movements when assessing the correlation between trajectory length and enclosed area.
5 Simulation based on the Lévy flight model
In this study, we analyze movement trajectories of animals obtained from Movebank, focusing on those that return to their starting points. We report two main findings. First, the daily movement trajectories of the lesser kestrel exhibit a scaling exponent that approaches 2 for short distances and 1.5 for long distances. This behavior is consistent with our previous observation based on human daily mobility patterns derived from Agoop data. Second, the annual movement trajectories of eight animal species from Movebank exhibit periodicity, with the scaling exponent over 1 year varying by species. Specifically, the exponent is close to 2 for humans (nomadic people), the demoiselle crane, tortoises, and blue whales; close to 1 for reindeer; and approximately 1.5 for wildebeests, elephants, and lions. While the first empirical property has already been shown to be reproducible through our previously proposed simulation model, the present study proposes a new simulation model aimed at understanding the second property from the perspective of directional tendencies in movement.
Specifically, we consider two contrasting scenarios: one in which movement direction is highly constrained due to environmental factors, and another in which such constraints are minimal. To systematically investigate how the trajectory scaling exponent
changes depending on the strength of directional constraints, we designed a simplified setting in which the movement direction is restricted to remain close to the previous step’s direction. Based on this framework, we conducted two-dimensional random walk simulations using Lévy flights [
45–
48]. Here, the scenario with strong directional constraints models the movement of reindeer, while the unconstrained case represents movements of humans (e.g., nomadic tribes), demoiselle cranes, tortoises, and blue whales. Additionally, to ensure that the Lévy flight returns to its point of origin, we introduced a return potential term. This term generates a pulling force toward the starting point, which becomes stronger as the number of remaining steps decreases.
1. Step count: Each simulated trajectory contains between 30 and 100 steps, chosen at random. This simulation targets movement trajectories lasting up to 1 year (365 days); therefore, we set the maximum number of steps to 100, which is of the same order and provides a convenient round number. The minimum number of steps was set to 30, based on empirical observations that the shortest animal movement trajectories span approximately 1 month.
2. Lévy distribution: The length of each step follows a heavy-tailed Pareto distribution with Pareto exponent . The purpose of this simulation is to examine the relationship between the strength of movement constraints and the trajectory scaling exponent , as described above. Therefore, we adopted a typical value of , which is commonly observed in the power-law distribution of jump lengths in animal movement (see, e.g., Zaburdaev et al. [49]).
3. First step: The first step proceeds in a random direction (0–2).
4. Direction of movement: With respect to the direction of the previous step, each subsequent step is taken randomly within (i.e., ), where is a parameter.
5. Return potential: To ensure that the final position returns to the origin, an attractive potential inversely proportional to the distance from the origin—adjusted by the number of remaining steps—is added at each step. The position is updated according to the following Equation 2, where the third term on the right-hand side represents the return potential:Here, denotes the step index starting from 0, is the position vector at step , represents a standard Lévy step, is the position vector of the starting point, and is the total number of steps.
6. Final step processing: At the final step, the trajectory is forcibly brought back to the origin, forming a closed polygon.
7. Repeated simulation: This simulation is repeated 1,000 times, and for each closed trajectory, the length and the enclosed area are measured. Please refer to the attached Python code for the details of the measurement method. In the code, when a self-intersection occurs in the trajectory, the area is correctly computed using . Furthermore, each measurement was repeated 10,000 times, and the evaluation described in the next item (Sterp 8) was conducted in both cases. In the case of human or animal movement trajectories based on latitude and longitude coordinates, we used the geodesic algorithm of [50], which is implemented in the Geod class of pyproj (v3.6.1) with the WGS-84 ellipsoid, as it is suitable for geodetic calculations in such coordinate systems.
8. Correlation analysis: For each parameter , a linear regression analysis is performed on the logarithms of the length and enclosed area, , to evaluate the parameter in Equation 1.
Figure 6a shows an example for the case where governs the motion. Figure 6b presents the case for . In addition, Figure 7 illustrates the scatter plot of along with its best-fit line for . The slope of this line in Figure 7 is , and Figure 8 shows the values of evaluated at . This figure indicates that when the direction of motion is unconstrained , the enclosed area is proportional to the square of the path length, whereas imposing stronger constraints on the direction of motion causes the enclosed area to approach a relationship proportional to the path length to the first power. However, due to the effect of the return potential, the rate at which it converges to a first-power relationship becomes increasingly gradual. In Figure 8, we also present results from 10,000 simulation trials in which the Pareto exponent , set to 1.5 in Step 2, was instead set to 1.0 and 2.0. Within this range of values, we observe that a larger tends to result in a larger scaling exponent . However, the overall trend that gradually decreases with increasing turning-angle constraint parameter remains consistent across different values. The fact that does not appear to approach 1 may reflect a limitation of our simulation framework, which relies on the return potential to ensure closure of the trajectories.
FIGURE 6
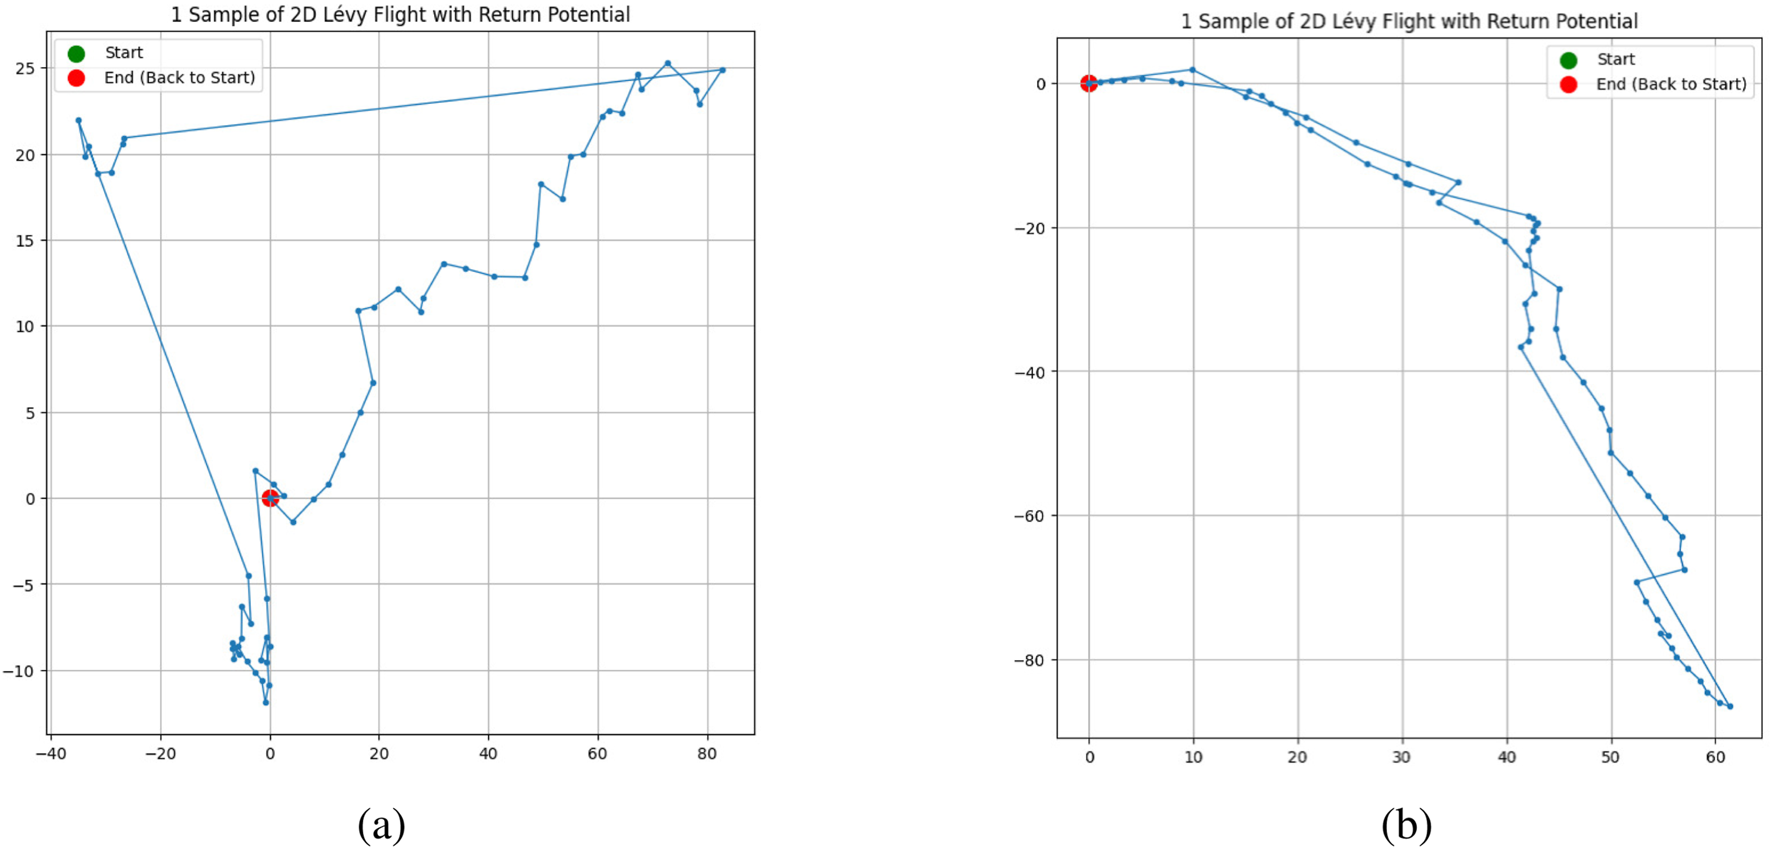
Simulation example of a trajectory when the movement direction is chosen randomly within relative to the previous step’s direction. (a) For , i.e., movement independent of the previous step’s direction. (b) For , i.e., limited to .
FIGURE 7
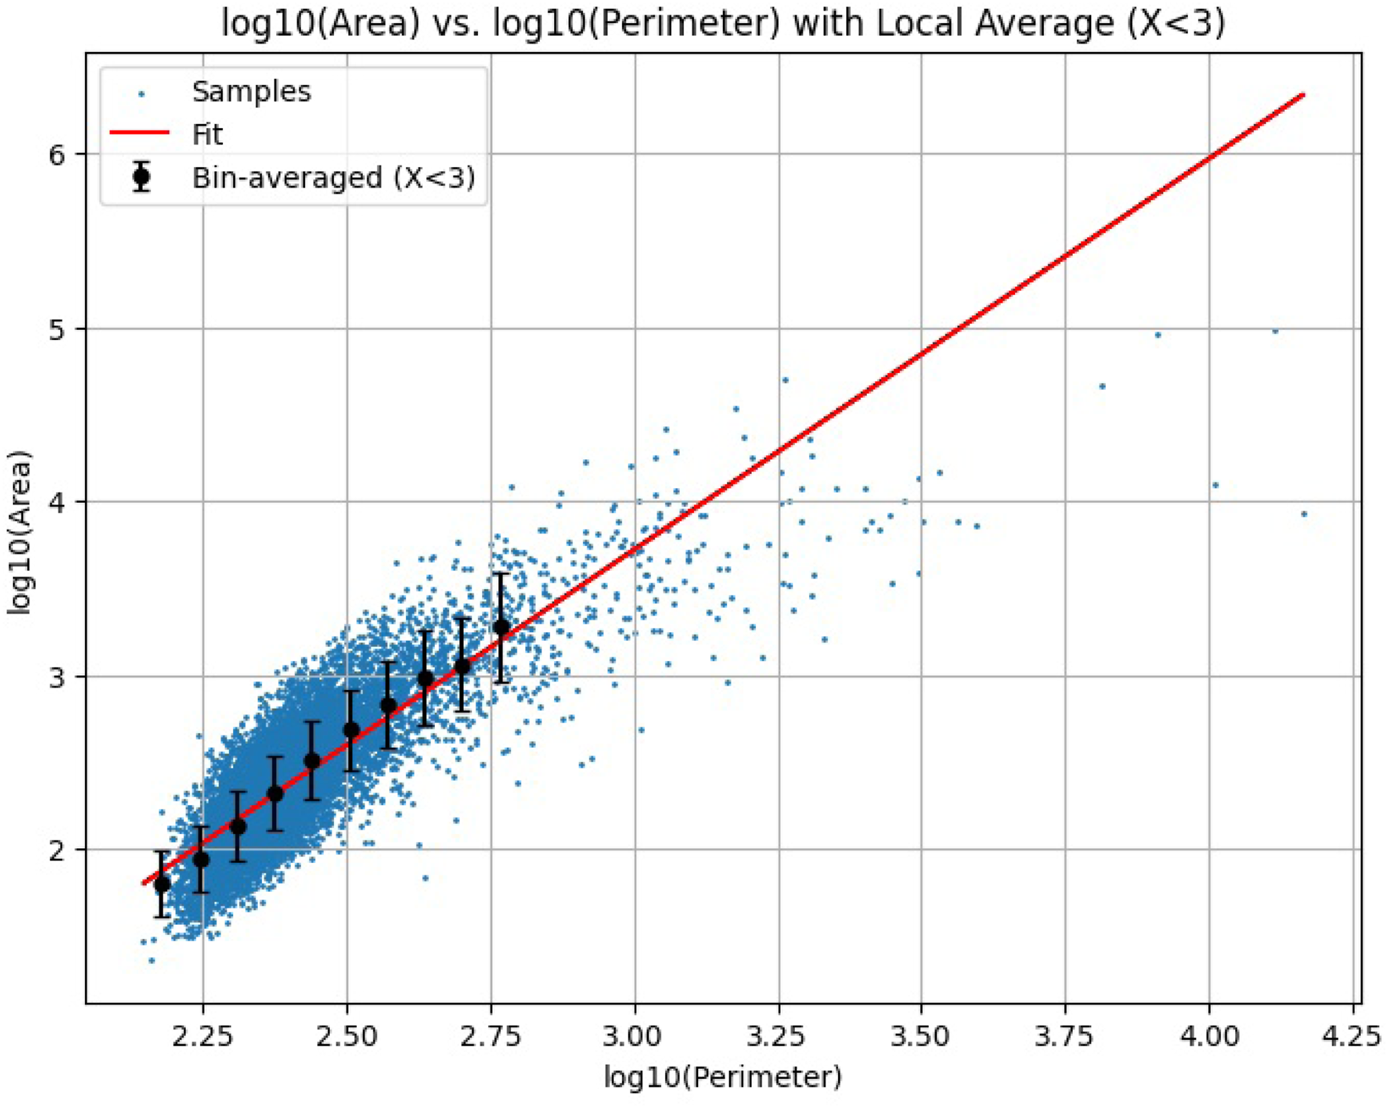
Scatter plot of the simulation repeated 10,000 times with trajectory length: and enclosed area: displayed on double-logarithmic axes. The slope of the best-fit line, , is evaluated by the least squares method as .
FIGURE 8

Results obtained by performing the analysis in Figure 7 for .
6 Results and conclusion
In this study, we used movement trajectory data from nine species of animals (common kestrel, demoiselle crane, tortoise, blue whale, reindeer, elephant, wildebeest, lion, and nomadic human populations) registered in the Movebank database, which integrates research data on animal movements worldwide, to examine statistical properties of these trajectories that transcend the classifications of birds, mammals, and reptiles. We first focused on the common kestrel, for which movement trajectories are recorded at several-minute intervals, and confirmed that its daily movement trajectories tend to become two-dimensional, enclosing a large area when the distance traveled is short, whereas they exhibit an increasingly one-dimensional tendency as the distance becomes longer. This finding aligns with our previous research, in which human movement trajectories were observed to display a similar property.
The daily trajectories analyzed in this study are subject to a stringent constraint: individuals must return to their point of departure within the same day. We contend that this requirement gives rise to the distinct geometric differences observed between short- and long-distance paths. It is therefore reasonable to assume that this property is not confined to humans or common kestrels, but is shared by any animal that completes a round trip within a single day. The model we proposed in our earlier work further substantiates this interpretation.
By examining the temporal evolution of the mean squared displacement from the initial observation point over the course of the study, we confirmed that all eight species of animals with recorded trajectories of over one year—excluding the kestrels analyzed in this study—exhibited periodic movement on an annual timescale. Building on this finding, we quantitatively evaluated the shape of these trajectories for each species by using the parameter derived from the correlation between the logarithms of the total distance traveled in 1 year and the enclosed area. As a result, we found that humans (nomadic populations), demoiselle cranes, tortoises, and blue whales formed trajectories that enclosed a large area, while reindeer engaged in round-trip movements in which outbound and return paths nearly overlapped. Moreover, wildebeests, elephants, and lions exhibited movement patterns intermediate between these two extremes.
Furthermore, by employing a Lévy flight model conditioned to return to the origin, we demonstrated that trajectories with no directional constraints tend to become more two-dimensional, whereas imposing stronger directional constraints leads to more one-dimensional trajectories.
The simulation supports the following interpretation. Species whose annual long-distance movement index is close to 2—namely nomadic pastoralists, demoiselle cranes, blue whales, and tortoises—experience few constraints on their trajectories other than the eventual need to return to their point of origin. This pattern typifies organisms that are, in principle, free to range across vast, unbounded arenas such as open plains, the sky, or the open ocean. In the tortoise’s case, its largely solitary habits further relax spatial constraints by eliminating the need to coordinate with conspecifics. By contrast, the other species exhibit directional restrictions: large herbivore herds generate collective movement constraints, and these, in turn, impose similar limitations on the carnivores that prey upon them. The social structure of each animal species—such as herd density and group size—likely plays a significant role in shaping the trajectory parameter . In our simulation, behavioral correlation distances mediated by tactile or olfactory cues (e.g., pheromones) and visual signals may also be interpreted as corresponding to the directional constraint parameter . This simulation was originally designed to explain interspecies differences in the trajectory exponent for annual long-distance movements. However, it may also help account for the observed differences in between long- and short-distance movements within the same species. The simulation results suggest that the smaller the deviation between the direction of the previous step and that of the next step, the smaller the resulting , approaching approximately 1.5. Conversely, when the influence of the previous direction on the next is minimal, tends to approach 2. This finding aligns with the interpretation that long-distance movements—assumed to return to the point of origin within a day—are often associated with specific destinations and therefore exhibit less directional variation. In contrast, short-distance movements are more likely to involve multiple destinations, resulting in greater directional variability. In this context, the 5 km threshold may reflect a distinction in the mode of transportation. Movements exceeding 5 km are likely dominated by highly linear modes of transport such as cars or trains, whereas movements under 5 km may primarily involve more maneuverable modes such as walking or cycling. Confirming this hypothesis remains a subject for future investigation.
However, to assert these conclusively, one would need to analyze a broader range of species rather than just the nine discussed in the present study. Using the approach we propose, it should be possible to perform such expanded analyses, and thus this remains an important task for future research.
The movement described in this paper can be understood qualitatively by simply plotting the trajectories on a map. Indeed, the animal-movement videos on the Movebank website’s top page can even be profoundly moving. However, examining the movement trajectories of more than a thousand species is exceedingly time-consuming. Consequently, by quantifying these trends using statistical indicators, it becomes possible to evaluate the movements of any animal using a uniform metric. Through this approach, similarities and differences among various animal species, as well as between animals and humans, can be elucidated. Many of the datasets in Movebank lack altitude information, so in this study we excluded all altitude data from our analysis. In the future, we plan to perform a three-dimensional analysis for trajectories that include reliable altitude measurements.
Statements
Data availability statement
Publicly available datasets were analyzed in this study. This data can be found here: https://www.agoop.co.jp/ and https://www.movebank.org/.
Ethics statement
Ethical approval was not required for the study involving humans in accordance with the local legislation and institutional requirements. Written informed consent to participate in this study was not required from the participants or the participants’ legal guardians/next of kin in accordance with the national legislation and the institutional requirements. Ethical approval was not required for the study involving animals in accordance with the local legislation and institutional requirements because Only publicly available movement trajectory data were used in this study, and no animals were directly involved.
Author contributions
AI: Data curation, Methodology, Formal Analysis, Software, Supervision, Writing – original draft, Funding acquisition, Investigation, Visualization, Conceptualization, Validation, Resources, Writing – review and editing, Project administration. SF: Software, Writing – review and editing. TM: Writing – review and editing, Validation, Conceptualization, Supervision.
Funding
The author(s) declare that financial support was received for the research and/or publication of this article. This work was supported by JSPS KAKENHI Grant Numbers 25K08191 and 22K04609, by RIOS NII Open Collaborative Research 2025-251S9-22495, and by The Obayashi Foundation.
Conflict of interest
The authors declare that the research was conducted in the absence of any commercial or financial relationships that could be construed as a potential conflict of interest.
Generative AI statement
The author(s) declare that Generative AI was used in the creation of this manuscript. Generative AI was used to correct spelling and grammatical errors, and to improve the expressions in the manuscript.
Publisher’s note
All claims expressed in this article are solely those of the authors and do not necessarily represent those of their affiliated organizations, or those of the publisher, the editors and the reviewers. Any product that may be evaluated in this article, or claim that may be made by its manufacturer, is not guaranteed or endorsed by the publisher.
References
1.
ZhaoCZengAYeungCH. Characteristics of human mobility patterns revealed by high-frequency cell-phone position data. EPJ Data Sci (2021) 10(5):5. 10.1140/epjds/s13688-021-00261-2
2.
AndradeTCancelaBGamaJ. Mining human mobility data to discover locations and habits. In: CellierPDriessensK, editors. Machine learning and knowledge discovery in databases. ECML PKDD 2019, 1168. Cham: Springer (2019). p. 390–401. 10.1007/978-3-030-43887-6_32
3.
GhahramaniMZhouMWangG. Urban sensing based on mobile phone data: approaches, applications and challenges. IEEE/CAA J Autom Sinica (2020) 7:627–37. 10.1109/jas.2020.1003120
4.
NigaYFujiokaEHeimONomiAFukuiDHiryuS. A glimpse into the foraging and movement behaviour of nyctalus aviator; a complementary study by acoustic recording and gps tracking. R Soc Open Sci (2023) 10:10230035. 10.1098/rsos.230035
5.
MastrantonioG. Modeling animal movement with directional persistence and attractive points. Ann Appl Stat (2022) 16:2030–53. 10.1214/21-aoas1584
6.
Agoop Corp. Agoop corp (2025). Available online at: https://agoop.co.jp/ (Accessed April 19, 2025).
7.
Movebank. Movebank (2025). Available online at: https://www.movebank.org/cms/movebank-main (Accessed April 19, 2025).
8.
IshikawaAFujimotoSMizunoTTanakaY. Statistical law between areas and perimeters created by a moving trajectory. Electronics (2024) 13:4018. 10.3390/electronics13204018
9.
BustamanteJ. Common kestrel (falco tinnunculus) movements, ebd-csic, projects mercurio and sumhal. Movebank Data Repository (2025). 10.5441/001/1.3r8g6k6f
10.
BatbayarNGaltbaltBNatsagdorjTSukhbaatarTWikelskiM. Study 1000 cranes. Mongolia. Movebank Data Repository (2024a). 10.5441/001/1.598
11.
IlyashenkoEIPokrovskyIMudrikEAPolitovDPostelnykhKIlyashenkoVYet alStudy 1000 cranes. Russia. altai. Movebank Data Repository (2024e). 10.5441/001/1.596
12.
IlyashenkoEIPokrovskyIIlyashenkoVYMudrikEAKorepovMMnatsekanovRAet alStudy 1000 cranes. Russia. taman. azov. Movebank Data Repository (2024c). 10.5441/001/1.594
13.
IlyashenkoEIPokrovskyIGoroshkoOAMudrikEAPolitovDIlyashenkoVYet alStudy 1000 cranes. Russia. transbaikalia. Movebank Data Repository (2024b). 10.5441/001/1.592
14.
IlyashenkoEIPokrovskyIIlyashenkoVYMudrikEAKorepovMPolitovDet alStudy 1000 cranes. Russia. volga-ural interfluve. Movebank Data Repository (2024d). 10.5441/001/1.595
15.
IlyashenkoEIPokrovskyIGavrilovAEZaripovaSFiedlerWWikelskiM. Study 1000 cranes. southern Kazakhstan. Movebank Data Repository (2024a). 10.5441/001/1.591
16.
AndryushchenkoYPokrovskyIBerndVFiedlerWWikelskiM. Study 1000 cranes. Ukraine. Movebank Data Repository (2024). 10.5441/001/1.590
17.
BatbayarNGaltbaltBNatsagdorjTSukhbaatarTWikelskiM. Study lifetrack Mongolia demoiselle cranes. Movebank Data Repository (2024b). 10.5441/001/1.599
18.
KilianWGetzWMZidonRTsalyukM. Temporal variation in resource selection of african elephants follows long term variability in resource availability. Movebank Data Repository (2018). 10.5441/001/1.3nj3qj45
19.
SlotowRThakerMVanakATVanakAT. Fine-scale tracking of ambient temperature and movement reveals shuttling behavior of elephants to water. Movebank Data Repository (2019) 7. 10.3389/fevo.2019.00004
20.
WikelskiM. Study elephants java fzg mpiab damn (2015). Unpublished study.
21.
MoritzM. Data from: pastoralist refugee crisis tests the resilience of open property regime in the logone floodplain, Cameroon. Movebank Data Repository (2019b). 10.5441/001/1.c45f2p05
22.
MoritzM. Data from: ideal free distributions of mobile pastoralists within multiple seasonal grazing areas. Movebank Data Repository (2019a). 10.5441/001/1.md069588
23.
MoritzM. Data from: simulating the transmission of foot-and-mouth disease among mobile herds in the far north region, Cameroon. Movebank Data Repository (2018a). 10.5441/001/1.61896g63
24.
BlakeS. Study forest elephant telemetry programme (2007). Unpublished study.
25.
Andrews-GoffVBellEMMillerBSWotherspoonSJDoubleMC. Deployment details for satellite tags deployed on antarctic blue whales during the antarctic blue whale voyage 2013 (2022) Version 2. 10.5441/001/1.vr276ns35
26.
IrvineLMWinsorMHFollettTMMateBRPalaciosDM. An at-sea assessment of argos location accuracy for three species of large whales, and the effect of deep-diving behavior on location error. Anim Biotelemetry (2020) 8:20. 10.1186/s40317-020-00207-x
27.
IrvineLMPalaciosDMLagerquistBAMateBRFollettTM. Scales of blue and fin whale feeding behavior off California, USA, with implications for prey patchiness. Movebank Data Repository (2019) 7. 10.3389/fevo.2019.00338
28.
MateBRPalaciosDMIrvineLMFollettTM. Behavioural estimation of blue whale movements in the northeast pacific from state-space model analysis of satellite tracks. Movebank Data Repository (2019b). 10.5441/001/1.5ph88fk2
29.
BaileyHMateBRPalaciosDMIrvineLBogradSJCostaDP. Study blue whales eastern north pacific 2003 state-space model output (2003). Unpublished study.
30.
MateBRPalaciosDMFollettTMUrbán R.J. Fin whale movements in the gulf of California, Mexico, from satellite telemetry. Movebank Data Repository (2019a) 14:e0209324. 10.1371/journal.pone.0209324
31.
TorneyCJLamontMDebellLAngohiatokRJLeclercL-MBerdahlAM. Inferring the rules of social interaction in migrating caribou. Phil Trans R Soc B (2018) 373:20170385. 10.1098/rstb.2017.0385
32.
SeipDRPriceE. Science update for the south peace northern caribou. Movebank Data Repository (2019). 10.5441/001/1.p5bn656k
33.
MacFarlaneK. The ecology and management of Kalahari lions in a conflict area in Central Botswana. Ph.d. thesis. Canberra, Australia: Australian National University (2014b).
34.
MacFarlaneK. The ecology and management of Kalahari lions in a conflict area in central Botswana. Ph.D. thesis. Dissertation: Australian National University (2014a). 10.25911/5d78d54c1a50c
35.
PattersonB. Study tsavo lion study (2007). Unpublished study.
36.
HopcraftJGCMorrisonTAStabachJA. Movement of resident wildebeest across the masai mara ecosystem, Kenya. Movebank Data Repository (2020). 10.5441/001/1.h0t27719
37.
StabachJAHugheyLReidRSWordenJSLeimgruberPBooneRB. Study white-bearded wildebeest in Kenya. Movebank Data Repository (2020). 10.5441/001/1.h0t27719
38.
MorrisonTALinkWNewmarkWFoleyCBolgerDT. Tarangire revisited: consequences of declining connectivity in a tropical ungulate population. Biol Conservation (2016) 197:53–60. 10.1016/j.biocon.2016.02.034
39.
MoritzM. Data from: spatial and temporal characteristics of pastoral mobility in the far north region, Cameroon: data analysis and modeling. Movebank Data Repository (2018b). 10.5441/001/1.pk5ps1r3
40.
WardMMarshallBMHodgesCWMontanoYArtchawakomTWaengsothornSet alNonchalant neighbors: space use and overlap of the critically endangered elongated tortoise. Biotropica (2016) 53:1342–55. 10.1111/btp.12981
41.
Bastille-RousseauGYackulicCBGibbsJFrairJLCabreraFBlakeS. Migration triggers in a large herbivore: galapagos giant tortoises navigating resource gradients on volcanoes. Ecology (2019) 100:e02658. 10.1002/ecy.2658
42.
BlakeS. Study icarus galapagos tortoises (2022). Unpublished study.
43.
Bastille-RousseauGPottsJRYackulicCBFrairJLEllingtonEHBlakeS. Flexible characterization of animal movement pattern using net squared displacement and a latent state model. arXiv (2022). 10.5441/001/1.356nb5mf
44.
Bastille-RousseauGYackulicCBFrairJLCabreraFBlakeS. Allometric and temporal scaling of movement characteristics in galapagos tortoises. J Anim Ecol (2016) 85:1171–81. 10.1111/1365-2656.12561
45.
De BruyneBMajumdarSNSchehrG. Generating discrete-time constrained random walks and Lévy flights. Phys Rev E (2021) 104:024117. 10.1103/physreve.104.024117
46.
ZhaoKJurdakRLiuJWestcottDKusyBParryHet alOptimal Lévy-flight foraging in a finite landscape. J R Soc Interf (2015) 12:20141158. 10.1098/rsif.2014.1158
47.
ChechkinAVGoncharVYKlafterJMetzlerR. Fundamentals of lévy flight processes. Adv Chem Phys (2006) 133:439–524. 10.1002/0470037148.ch9
48.
Garcia-GarciaRRossoASchehrG. Lévy flights on the half line. Phys Rev E (2012) 86:1:011101. 10.1103/PhysRevE.86.011101
49.
ZaburdaevVDenisovSKlafterJ. Lévy walks. Rev Mod Phys (2015) 87:483–530. 10.1103/RevModPhys.87.483
50.
KarneyC. F. F. Algorithms for geodesics. J Geod (2015) 87 (1):43–55. 10.1007/s00190-012-0578-z
Summary
Keywords
movement trajectories, Movebank, area-perimeter relationship, Lévy flight, annual periodicity, statistical properties
Citation
Ishikawa A, Fujimoto S and Mizuno T (2025) Statistical relationship between the enclosed area and trajectory length of animal movement trajectories. Front. Phys. 13:1617160. doi: 10.3389/fphy.2025.1617160
Received
23 April 2025
Accepted
27 May 2025
Published
06 June 2025
Volume
13 - 2025
Edited by
Ryosuke Yano, Tokio Marine dR Co., Ltd., Japan
Reviewed by
Yasuko Kawahata, Rikkyo University, Japan
Ryuji Ishizaki, Fukuoka Prefectural University, Japan
Updates
Copyright
© 2025 Ishikawa, Fujimoto and Mizuno.
This is an open-access article distributed under the terms of the Creative Commons Attribution License (CC BY). The use, distribution or reproduction in other forums is permitted, provided the original author(s) and the copyright owner(s) are credited and that the original publication in this journal is cited, in accordance with accepted academic practice. No use, distribution or reproduction is permitted which does not comply with these terms.
*Correspondence: Atushi Ishikawa, ishikawa@kanazawa-gu.ac.jp
Disclaimer
All claims expressed in this article are solely those of the authors and do not necessarily represent those of their affiliated organizations, or those of the publisher, the editors and the reviewers. Any product that may be evaluated in this article or claim that may be made by its manufacturer is not guaranteed or endorsed by the publisher.