 Tian Lan
 Yuezhou Wu
- Electric Power Dispatching and Control Center of Guangdong Power Grid Co., Ltd., Guangzhou, China
Traditional power grid fault diagnosis methods rely on manual experiences to handle massive amounts of alarm information, have complex modeling processes and insufficient generalization abilities, and lack direct diagnostic research on the alarm information text. Therefore, we propose an intelligent fault diagnosis method based on the deep pyramid convolutional neural network (DPCNN), where we build an end-to-end fault classification model and a key information extraction model to directly mine the implicit fault features from the alarm information text to achieve accurate classification of fault types and rapid location of faulty equipment. We performed comparative experiments to show that the proposed method performs well in complex power grid scenarios and noisy data environments; the highest fault classification accuracy achieved with this approach was up to 100%, and we could effectively identify multiple fault types, such as simple faults, switch operation failure, and protection operation failure. In addition, we integrated the temporal-sequence-prioritized faulty equipment identification strategy with the proposed method to further improve the fault location accuracy. A case study verification was also performed, which shows that our method has a fault recognition rate of up to 99.5% and can achieve 98.7% accurate positioning after one-by-one elimination through the identification strategy to significantly reduce manual intervention and have high applicability in actual power grids.
1 Introduction
The demand for electrical energy continues to grow with the development of social productive forces. The large-scale integration of new energy sources into power grids have made grid operations more complex and increased the risk of faults significantly. In such situations, dispatchers must quickly and accurately locate the fault areas and isolate them in a timely manner; otherwise, such conditions may trigger cascading faults, leading to large-scale power outages or even grid collapse, which could further cause significant economic losses. Grid fault diagnosis is an effective means of controlling the development of faults by analyzing different electrical and non-electrical fault information collected by the monitoring system to determine the fault areas and identify the faulty equipment. The commonly used grid fault diagnosis methods are based on expert systems [1–3], optimization techniques [4], Petri nets [5], Bayesian networks [6], fuzzy sets [7], and analytical models [8–10], among others. These methods mainly establish diagnostic models based on fault mechanisms and grid topology structures to achieve accurate judgments of most faults through model solving. However, given the expansion of grid scales, increased structural complexity, and intelligent system developments, the secondary measurements and monitoring data obtained by energy management systems (EMSs) show massive growth trends. Traditional diagnostic methods have difficulty handling such large amounts of alarm information directly and still rely on manual experiences for screening of key information, which cannot meet the demands of rapid diagnoses. Therefore, there is an urgent need to develop an intelligent fault diagnosis system that can assist dispatchers with improving their decision-making efficiencies and accuracies.
The rapid development of artificial intelligence technologies, such as deep learning, has necessitated the intelligent transformation of grid fault diagnosis as an inevitable trend. The methods by which we can use deep-learning technologies to effectively extract and represent deep fault features from massive EMS data and develop end-to-end intelligent fault diagnosis methods for EMS alarm information have become key problems that need express solutions. In response to the intelligent diagnosis needs in the field of grid fault diagnosis and considering the current rapid developments in artificial intelligence technologies, we propose a grid fault diagnosis method based on the deep pyramid convolutional neural network (DPCNN) for alarm information text. This approach realizes fault classification of and key information extraction from alarm information text; further, a decision-making strategy that fuses fault types with temporal sequence features is designed to accurately identify faulty equipment.
The main contributions of this study are as follows:
1. An end-to-end fault diagnosis framework: By constructing two fault classification models and a key information extraction model, we realize end-to-end fault diagnosis from alarm information text to classify faults while identifying the corresponding equipment locations, thereby reducing manual interventions significantly.
2. Efficient feature extraction and classification: Using the pyramid structure and residual connections of the DPCNN, the global features of the alarm information are extracted effectively to solve the problems of long text dependence and gradient dispersion, thus achieving a classification accuracy of up to 100%.
3. A temporal-sequence-prioritized faulty equipment identification strategy: By combining the fault types and temporal sequence distribution characteristics of the alarm information, we propose a differentiated equipment identification strategy for simple and complex faults that improves the accuracy of locating the faulty equipment.
2 Research status and related works
Power grid fault diagnosis is a key technology for ensuring reliable operation of a power grid while achieving fault self-healing. Since the application of the supervisory control and data acquisition (SCADA) system in the 1960s and given the advancements in computational intelligence technologies and diversification of monitoring data, research efforts on fault diagnosis have increased continuously and remarkable achievements have been made. The existing fault diagnosis methods can be mainly divided into rule-based methods (expert systems, Petri nets, Bayesian networks, and analytical models) and data-driven methods represented by neural networks. The remainder of this section introduces these diagnostic methods in detail.
2.1 Rule-based grid fault diagnosis methods
2.1.1 Expert systems
Expert systems are the oldest type of fault diagnosis method with excellent reasoning and interpretation capabilities; however, they are difficult to adapt to rule-based construction and maintenance problems caused by the scale expansion of modern power grids and frequent changes in topology. Accordingly, a variety of improvement schemes have been proposed in the past: Shan et al. [11] combined these systems with data mining technology to improve the rule base; Xu et al. [12] used knowledge grid technology to construct a knowledge map; Georgilakis et al. [13] improved the adaptability of the system through power grid partitioning using the Bayesian theorem. Although these methods significantly improve the diagnostic effects, the rule base still needs to be maintained manually, which is difficult when meeting the online diagnosis needs of large-scale power grids.
2.1.2 Petri nets
Petri nets entail graphical modeling to effectively represent the topological structures and sequential fault events of power grids for fault diagnoses. Ramirez-Trevino et al. [14] developed a dedicated Petri net model for lines/buses that significantly improved the positioning ability of severe faults, including protection operation failure; the authors also introduced fuzzy reasoning technology [15] to enhance the diagnostic robustness of the model for complex faults like operation failure of automatic devices and impact reduction of sequential chaos and noise interference. Zhu et al. [16] innovatively adopted a matrix topological description method that adapted to structural changes through dynamic matrix adjustment and established an enhanced model integrating topological and sequential information; however, when the scale of the power grid is expanded, the model complexity increases exponentially, the generalization ability of the model decreases with changes in the topological structure, and it is difficult to achieve automatic modeling in an environment with multiple data sources.
2.1.3 Bayesian networks
Bayesian network is a modeling method that combines graphical representation and probabilistic reasoning to effectively handle uncertain knowledge. For diagnosing power grid faults, Lu et al. [17] established a Bayesian network model for the lines, transformers, and buses to solve for uncertain alarm information. Ye et al. [18] proposed a complex fault deduction method that can diagnose faulty components and infer the timings of the protection actions. Zhang et al. [19] combined the power grid structure and recorder data to accurately identify faulty equipment and protection refusal/operating faults; however, this model relies on prior probabilities and has limited capacity to diagnose complex faults.
2.1.4 Analytical models
Analytical models constitute a type of fault diagnosis method that have garnered widespread attention in recent years. The aim of this model is to establish an objective function based on the fault hypothesis and screen the optimal fault hypothesis by minimizing the objective function. Huang et al. [20] introduced the time conflict index to the objective function to solve the problem of temporal disorder of the alarm information. Yi et al. [21] established a complete analytical model by setting differentiated weights for the protection and circuit breakers to realize dimensionality reduction and improve the diagnostic accuracy; although this model has a strict logic and strong theoretical support and can effectively handle complex faults and diagnostic problems with uncertain information, the model complexity increases as more fault information is integrated and the solution difficulty is enhanced significantly.
2.2 Data-driven grid fault diagnosis methods
In recent years, important research progress has been made on power grid fault diagnoses based on artificial neural networks. Bi et al. [22] conducted a series of explorations on the applications of traditional neural networks; here, they mainly explored radial basis function (RBF) networks for processing the status information of protection devices. Cardoso et al. [23] developed an improved RBF model coupled with a fuzzy network; dos Santos Fonseca et al. [24] successfully applied reset neural networks and multilayer perceptrons to model the protection action principle; Zou et al. [25] reported the conversion of protection action information to percentage inputs. With respect to deep learning, Wen et al. [26] reported a significant breakthrough by pioneering the use of convolutional neural networks (CNNs) to achieve fault-phase selection and discrimination between the inside and outside areas. Yang et al. [27] used signal-to-image conversion along with CNNs to greatly improve the feature extraction ability. The SR-CNN model proposed by Zhang et al. [28] effectively solved the processing problem of phasor measurement unit (PMU) time-series data. The P-CNN model developed by Alqudah et al. [29] showed promising performance in the positioning of DC transmission lines. Other researchers [30] have combined k-means clustering with recurrent neural networks (RNNs) to achieve accurate classification of fault types. The above studies provide new technical paths for intelligent power grid fault diagnoses through diverse data input methods like status signals, electrical quantities, and images as well as innovative network structure designs (parallel, coupled, etc.).
Although various scholars have achieved fruitful results with regard to power grid fault diagnoses, the existing methods are still constrained by the following main problems:
1. Rule-based fault diagnosis models rely on logical rules; thus, when constructing fault events with more complex logical relationships, the logical constraints are cumbersome, knowledge representation is difficult, and model complexity is high. In addition, large amounts of alarm information need to be screened and classified during the modeling process, which increases the modeling workload.
2. The portability and generalization ability of rule diagnosis models are poor and cannot be adapted to the constantly changing power grid operation modes or network topology structures; hence, they cannot handle uncertainty problems effectively.
3. Extant data-driven fault diagnosis methods mostly diagnose the electrical quantity information collected by wide area monitoring systems and PMUs; thus, they lack direct diagnosis research on the EMS alarm information text, making it difficult to automatically extract the characteristic differences of different power grids from fault cases.
In response to the intelligent needs of power grid fault diagnoses, we propose a fault diagnosis method based on deep reinforcement learning. This method directly processes the alarm information text to significantly improve the intelligent diagnosis level and operational efficiency of the diagnostic system.
2.3 Methods of representing alarm text information
In the proposed fault diagnosis framework for power grid systems, the alarm text information is represented using a word vector matrix approach integrated with the DPCNN. This approach converts each alarm statement into a word vector matrix A ∈ ℝM × N, where M is the number of words and N is the dimension of each word vector, as detailed in Equation 1. Using pretrained word embeddings, such as word2vec, this approach captures the semantic relationships within alarm texts, enabling the DPCNN to extract the implicit fault features critical for identifying fault types like simple faults, switch failures, and protection failures. Then, sentence vectors are formed by concatenating the word vectors while preserving the temporal context and word order, which are essential for processing sequential alarm data from SCADA systems, as shown in the example alarm sequences in Supplementary Appendix Table S1.
Several alternative text representation methods have been applied in fault diagnosis and related natural language processing tasks. The term frequency inverse document frequency (TF-IDF) method represents text parts as sparse vectors based on the word frequency and corpus rarity, offering computational simplicity but failing to capture the semantic relationships or temporal dependencies, which limits its effectiveness for complex alarm texts in power grid applications. The bag-of-words (BoW) model, which counts word occurrences without regard to order or context, is similarly constrained and unsuitable for distinguishing nuanced fault types where sequences matter. Recent advances like the bidirectional encoder representations from transformers (BERT) method provide contextualized embeddings by modeling the bidirectional sentence context to achieve superior semantic understanding. However, the high computational demands of BERT and its need for large labeled datasets make it less practical for real-time fault diagnoses in resource-constrained environments, such as power grid control centers.
The word vector matrix approach with DPCNN offers distinct advantages over the aforementioned alternatives. By leveraging pretrained embeddings, it captures semantic nuances and enables robust feature extraction for diverse fault scenarios. Compared to BERT, its computational efficiency ensures suitability for real-time application, which is critical for rapid fault diagnosis in a power grid. Additionally, preserving the temporal context allows effective analysis of the sequential alarm data, unlike TF-IDF and BoW, which overlook the word order. However, the proposed approach relies on the quality of pretrained embeddings, which may not fully address domain-specific terminology in power grid systems; long alarm texts may also challenge the ability of the DPCNN to model extended dependencies. Thus, future research efforts could explore hybrid models combining the efficiency of DPCNN with the contextual depth of BERT to enhance domain-specific text representation, provided the computational constraints are mitigated.
2.4 Comparative analysis of different feature extraction models
In our proposed framework for power grid fault diagnosis, the DPCNN is employed to extract features from alarm text information. The DPCNN leverages a pyramid structure with residual connections to capture both local and long-range dependencies in the alarm texts, enabling robust extraction of implicit fault features, as represented by the word vector matrix in Equation 1. This approach achieves high classification accuracy and fault recognition range, as evidenced by the experimental results presented in Section 3 and the alarm sequence analysis given in Supplementary Appendix Table S1. The ability of the DPCNN to model sequential data from SCADA systems makes it particularly suitable for identifying complex fault types, such as switch failures and protection malfunctions, in real-time power grid applications.
Several alternative models have been explored for feature extraction in fault diagnosis models and related efforts. The long short-term memory (LSTM) network is a type of RNN designed to handle sequential data and has been applied to power grid fault diagnosis for its ability to capture temporal dependencies. However, LSTM suffers from high computational complexity and vanishing potential gradients, which can hinder performance with long alarm texts. BERT offers superior feature extraction by capturing the bidirectional context, which makes it effective for complex text analyses in fault diagnosis scenarios. Despite their high accuracies, BERT-based models require substantial computational resources and large labeled datasets, rendering them less feasible for real-time applications in resource-constrained power grid environments. Graph neural networks (GNNs) have emerged as a promising approach for modeling power grid topologies in terms of graphs by integrating alarm text with structural information. Although GNNs excel in topology-aware fault diagnoses, their focus on the graph-based features makes them less optimized for pure text feature extraction compared to DPCNN.
The DPCNN used herein outperforms the above alternatives in several key aspects; its pyramid structure enables efficient capture of both local and global text features to achieve balance between high accuracy and computational efficiency, as demonstrated in Section 3. Unlike LSTM, the DPCNN is not prone to gradient issues and processes lengthy sequences more effectively, making it suitable for real-time fault diagnosis. Compared to BERT, the DPCNN requires fewer computational resources, aligning with the practical constraints at power grid control centers. Although GNNs are advantageous for topology-based analyses, the focus of DPCNN on text feature extraction ensures superior performance for alarm text processing. However, DPCNN relies on pretrained embeddings, which may limit its ability to capture highly domain-specific fault patterns; further, its performance on extremely lengthy texts could be constrained by its receptive field. Future works could therefore explore integrating DPCNN with GNNs to combine text-based and topology-based features, potentially enhancing fault localization in complex power grid scenarios.
3 Fault information feature extraction based on DPCNN
3.1 Alarm text information representation
In the aftermath of a power grid failure, the protection and circuit breaker operation information related to the faulty equipment will be uploaded to the SCADA system in real time. Meanwhile, the SCADA system will receive additional alarm information, such as device failure and uncharged spring of the switch mechanism. These details are recorded in chronological order to generate the alarm information set at the time of the fault. Table 1 shows an example of the alarm information in a certain area. To facilitate computer processing, it is necessary to represent the text of the alarm information set in a numerical manner. The available text representation methods are mainly divided into discrete representation methods based on one-hot, BoW, and TF-IDF models or distributed representation methods based on n-gram, word2vec, and GloVe models. Among these, the word2vec model can map words from a high-dimensional space to a low-dimensional space while retaining the associations between words, thereby solving the problems of vector sparsity and loose semantic connections in the text representation process effectively. Therefore, we use the word2vec model to vectorize the alarm text information. The vectorization process entails the following steps:
1. Remove the time column in the alarm text information.
2. Segment the alarm text information by dividing each text according to the plant station, equipment, equipment description, and action description.
3.Generate word vectors using the word2vec model. This model uses the contextual information of words to generate low-dimensional word vectors representing the associations between words; the closer the semantics of the words, the closer are the corresponding word vectors in the vector space.
4. Generate sentence vectors based on the word vectors by averaging the word vectors of all words in a single alarm information sentence to obtain the corresponding sentence vector.
5. Generate the sentence vector representation matrix of the text by sequentially concatenating the corresponding sentence vectors of the alarm information sentences.
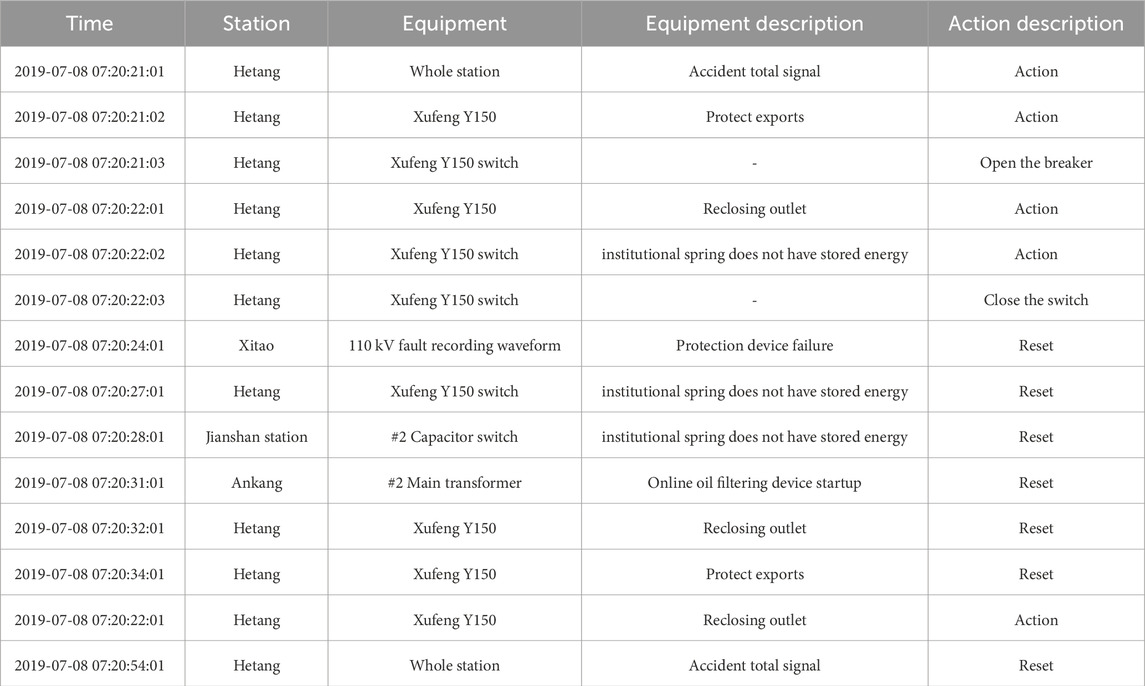
Table 1. Alarm information instances.
In the above equation, the symbol “⊕” represents vector concatenation, xi is the sentence vector of the ith alarm message, and x1:n is the concatenation of the sentence vectors of the first to nth alarm messages corresponding to the sentence vector matrix in Figure 1.
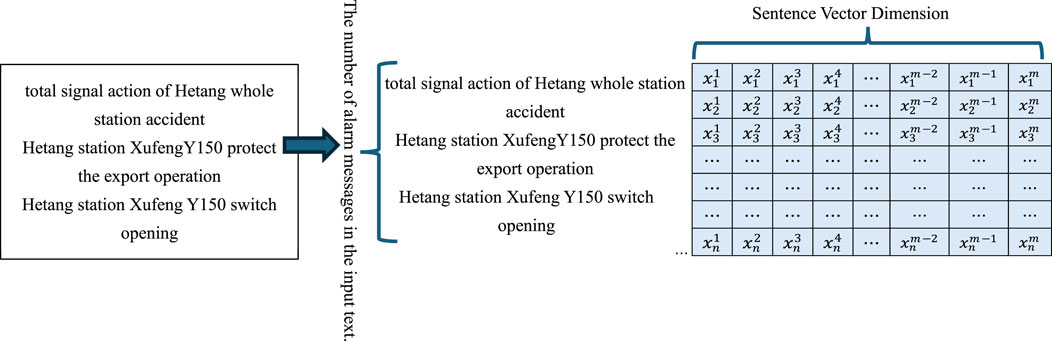
Figure 1. Sentence vector representation of the alarm text information.
In Equation 2, k is the dimension size of the sentence vector, and xij is the j-dimensional component of the sentence vector of the ith alarm information. For a single alarm message statement, steps (4) and (5) are omitted and the word vectors in the statement are directly spliced to form the word vector matrix, as shown in Figure 2.
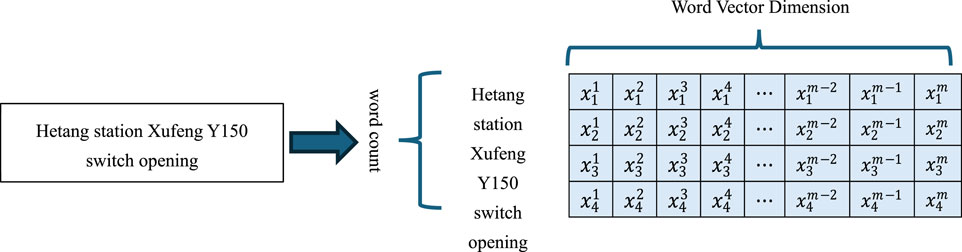
Figure 2. Word vector representation of the alarm text information.
3.2 DPCNN
The DPCNN constitutes a word-level-deep text classification network in which the convolutional and pooling layers are continuously deepened based on the CNN. The structure of the DPCNN model is shown in Figure 3 and is mainly composed of a text region embedding layer, two convolutional blocks, two pooling layers, and a fully connected layer. Among these, the convolutional blocks include residual modules to avoid the gradient vanishing problem caused by deepening of the network layers. Once the output from the region embedding layer passes through the operations of the convolutional blocks, the sequence length is halved and perceived text segments are doubled. If the model contains multiple pyramid convolutional modules, the alternating operations of the convolutional block and 1/2 pooling layer reduce the length of the text sequence exponentially, resulting in a “pyramid” shape as the number of modules increases. The pyramid convolutional module of the DPCNN model enables perception of long-distance text information and enhances the ability to extract global text features.
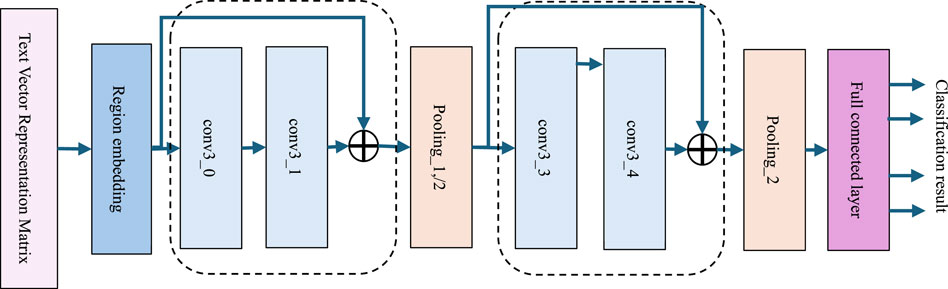
Figure 3. Structure of the deep pyramid convolutional neural network (DPCNN).
3.3 Feature extraction based on deep CNN
Given the global feature extraction ability of the DPCNN model for long-distance texts, we selected the DPCNN to extract features from the alarm text information. Given the alarm text A ∈ Rn × k, where n is the text sequence length and k is the sentence vector dimension, the regional features of the text are first extracted through the region embedding layer. Then, the convolutional operations are performed successively through the pyramid convolution module and convolution blocks, and the feature vector outputs of the convolutional blocks are max-pooled by the final pooling layer to obtain the global features of the alarm text. A convolution kernel parameterized by a weight matrix w ∈ Rh × k is used to perform the convolution operations in the direction of the text sequence length, and the convolution process is as shown in Equation 3:
In the above equation,
The above feature vector is input to the convolutional block for equal-length convolution and identity mapping, and the output feature vector is given as follows:
In Equation 5, the dimension of
The output from the first convolutional block is passed through the 1/2 pooling layer for downsampling before being input to the next convolutional block. The final pooling layer performs max pooling on the feature vector output from the convolutional block to produce the global features. Figure 4 shows the feature vector diagrams extracted by each of the convolutional and pooling layers in the pyramid convolutional module once an alarm text sequence of length 20 (seg_length = 20) is input to the DPCNN model (kernel_size = 3). The different colored areas represent feature values of different sizes; larger feature values are closer to the color white and have greater impacts on the text classification. It can be seen from the figure that the existence of the pyramid convolutional module changes the length of the feature vector in a pyramid shape.
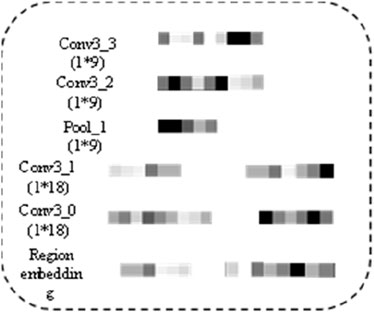
Figure 4. Visualization of the feature maps of the pyramid convolution module.
4 Power grid fault diagnosis model based on the DPCNN
We established two fault classification models based on the DPCNN to classify faults of different complexities and different types of faulty equipment for the alarm information set generated during a fault. Simultaneously, a key information extraction model based on the DPCNN is designed to retrieve the key sentences in the alarm text information to further determine the faulty equipment. Based on fault classification results of different complexities, a faulty equipment identification strategy is proposed by integrating the fault types with their temporal priorities.
4.1 Fault classification models
We designed two fault classification models based on DPCNN for the alarm information set, as shown in Figure 5. Classification model 1 can be used to distinguish between non-fault, simple fault, complete protection operation failure, incomplete protection operation failure, switch operation failure, and developing fault conditions. The definitions of these fault types are as follows:
1. Simple fault: There is only one faulty equipment in the fault event, and both the protection and circuit breaker operate correctly.
2. Switch operation failure: Here, there is only one faulty equipment in the fault event, and the protection operates correctly but the circuit breaker operation fails, resulting in deployment of the backup protection of the adjacent equipment.
3. Incomplete protection operation failure: This refers to failure of one or a part of the protection systems when an equipment with dual protection is faulty; here, the other protection system trips the circuit breaker so that the fault range does not expand.
4. Complete protection operation failure: This refers to the condition where the protection system of an electrical equipment fails; in this case, the backup protection of the adjacent equipment is deployed, and the fault range expands.
5. Developing fault: In this work, this type of fault refers to the protective actions of other equipment within the fault spread range owing to failure of a certain equipment and removal of the non-faulty equipment, such as 10-kV or 35-kV capacitors.
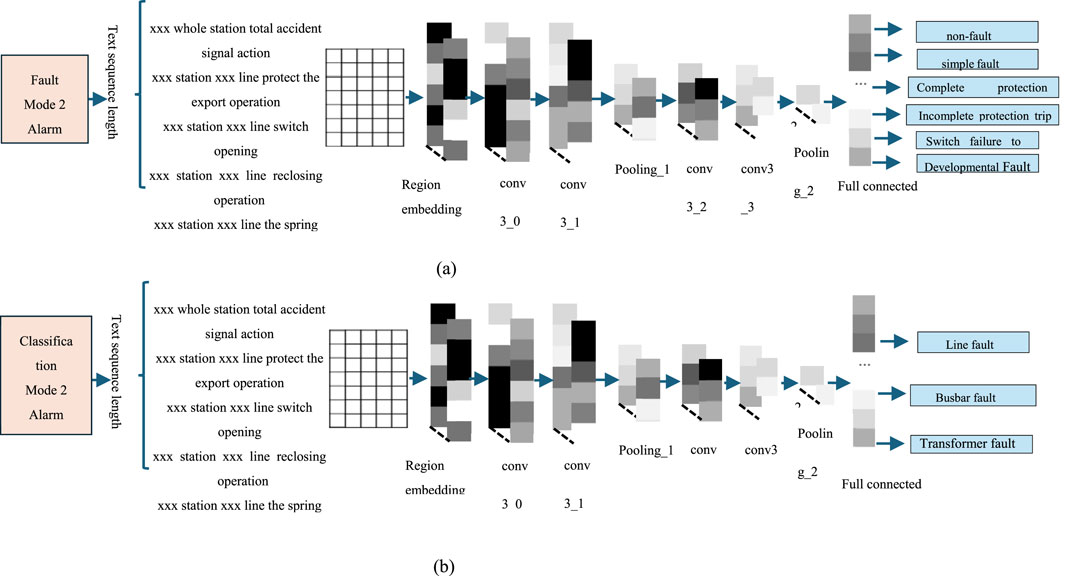
Figure 5. Fault classification models: (a) model 1 and (b) model 2.
Classification model 2 can be used to distinguish line, busbar, and transformer faults. The structures of the two classification models are identical, with only the inputs and outputs being different. The input layer of each model is the vector matrix
4.2 Key information extraction model
We also designed a key information extraction model based on the DPCNN for a single alarm message in the alarm information set to extract key details like the alarm information of the protection and circuit breaker actions. The input layer of this model is shown in Figure 6 and is the word vector matrix
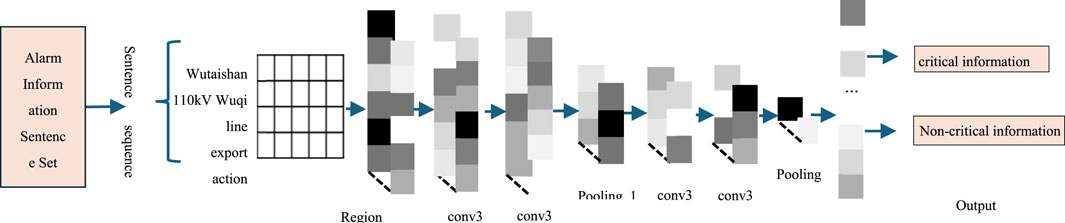
Figure 6. Key information extraction model.
In Equation 6,
4.3 Integrated fault-type and temporal-sequence-prioritized faulty equipment identification strategy
Once the set of suspicious faulty equipment is determined using the key information extraction model, it is necessary to identify the actual faulty equipment. In this work, we use an integrated fault-type and temporal-sequence-prioritized faulty equipment identification strategy to determine the temporal distribution characteristics of the alarm information from different fault types and obtain the final set of suspicious faulty devices
In Equation 7, m ≤ n. Based on the classification results of model 2, D′ may be the set of suspected faulty lines, set of suspected faulty buses, or set of suspected faulty transformers. The faulty equipment identification strategy used in this work is shown in Figure 7.
1. When the classification result of model 1 is a simple fault, the equipment in the set D are identified as the faulty equipment.
2. When the classification result of model 1 is switch operation failure, developing fault, or incomplete protection operation failure, the first equipment in set D is identified as the faulty equipment.
3. When the classification result of model 1 is complete protection operation failure, the faulty equipment must be determined using the network topology.
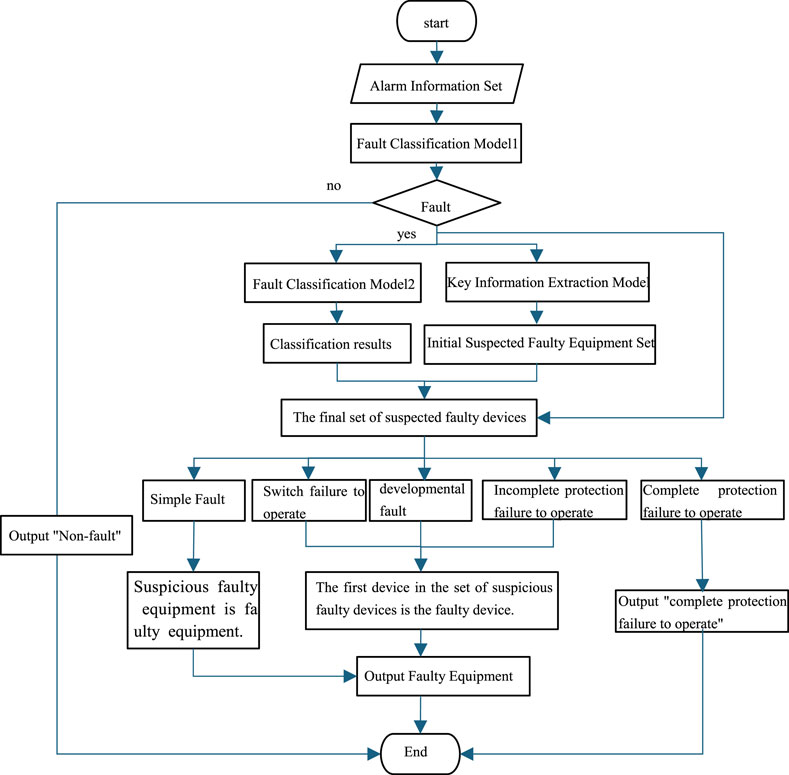
Figure 7. Framework of the faulty equipment identification strategy.
The power grid fault diagnosis framework based on DPCNN is shown in Figure 8 and consists of two parts: model training and testing as well as online diagnosis. The steps of the model training and testing process are as follows:
1. Obtain the alarm information sets of historical fault events collected by the SCADA system as the sample set, and use the word2vec model to vectorize the alarm information sample set and single alarm information separately.
2. Divide the sample set based on the two fault classification models to form two alarm information sample sets; then, label each fault sample set with the corresponding fault events for model learning.
3. Label the single alarm information statements in the sample sets with the key and non-key labels.
4. Build the fault classification and key information extraction models as well as set the model hyperparameters.
5. Divide the fault sample set and alarm information statement set into training and test sets to train the fault classification and key information extraction models; then, test the model classification effects on the test set.
6. Place the samples producing incorrect classification results into the training set for retraining to improve model classification accuracy until the requirements of online diagnosis are met.
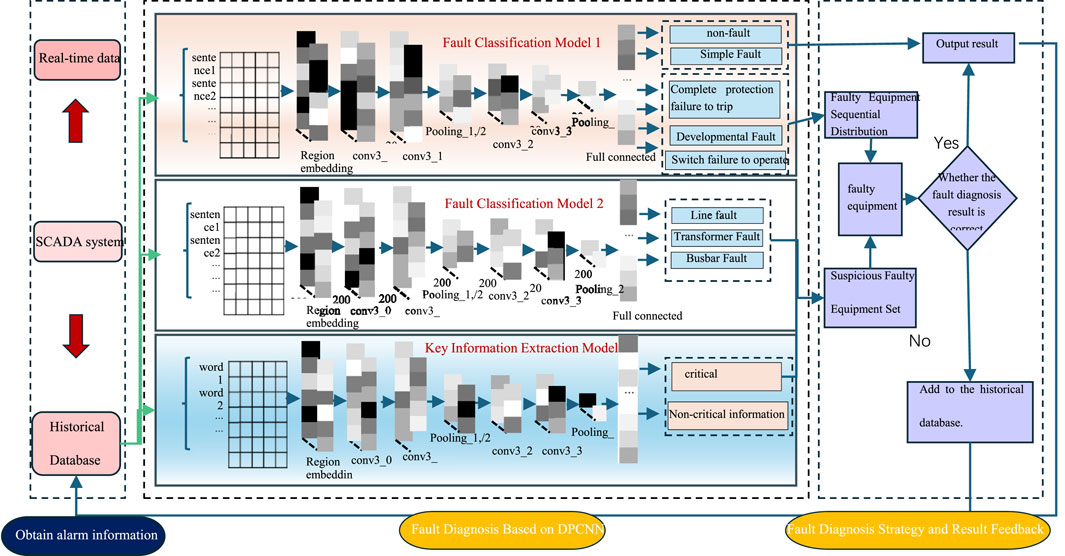
Figure 8. Power grid fault diagnosis framework based on the DPCNN.
The trained models are used for online fault diagnosis, whose steps are as follows:
1. A sliding time window is established with a time step of 5 s and window size of 10 s to intercept the real-time alarm information received by the SCADA system and vectorize it as described above.
2.The vectorized alarm information is input to the diagnosis model to obtain the fault classification result and determine the faulty equipment based on the faulty equipment identification strategy. If the fault classification result is complete protection operation failure, then the faulty equipment must be determined using the topology structure.
3. The dispatcher judges the diagnosis result. If this result is correct, it is directly added to the historical database for training and learning; if the result is incorrect, the dispatcher adds the correct fault label to the alarm information sample and sends it to the sample library to increase the library capacity.
5 Experimental analyses
5.1 Experimental data and evaluation indicators
To demonstrate the applicability of the proposed models to alarm information having different description methods, we selected an actual power grid in a certain area as well as the TS2000 simulation system used to simulate the D5000 smart grid dispatching technology support system as the data sources to obtain samples. Here, the actual power grid contains 731 plants and substations, 5,382 lines, and 13 voltage levels ranging from 0.22 kV to 500 kV. The TS2000 simulation system contains 60 plants and substations, 825 lines, and 5 voltage levels ranging from 10 kV to 500 kV. The alarm information samples generated by these two power grids have the following characteristics. The alarm information generated by the actual power grid is the aggregate-level information and contains more non-fault information; this information has the characteristics of high noise and simplistic descriptions, as shown in Supplementary Appendix Table S1. The alarm information generated by the TS2000 simulation system has more detailed fault descriptions and less non-fault information; it the characteristics of low noise and high descriptiveness, as shown in Supplementary Appendix Table S2.
Based on the two fault classification models proposed previously, two alarm information sample sets and two alarm information statement sets each are obtained from the historical monitoring alarm information of the power grid in a certain area for 2019 and the TS2000 simulation system; these data are then divided into training and test sets in the ratio of 7:3. The compositions of the two alarm information sample sets are shown in Tables 2, 3. The classification performances of the two models are evaluated using the metrics shown in Equation 8–10.
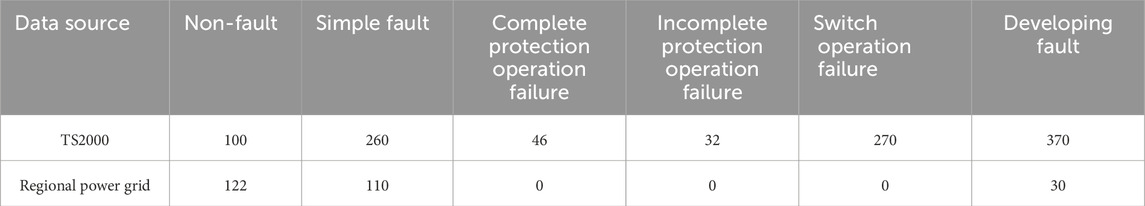
Table 2. Samples for fault classification model 1.
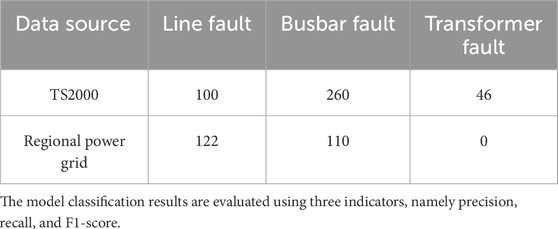
Table 3. Samples for fault classification model 2.
In these equations,
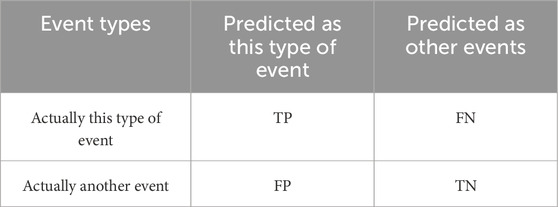
Table 4. Relationships between different event types.
5.2 Diagnostic model parameter settings
In this work, Python programming language was used to build the DPCNN model for fault diagnosis based on the deep-learning framework TensorFlow in the PyCharm development environment. To ensure that the model achieved the best classification performance and based on the samples shown in Table 3, the main parameters like convolution kernel size (kernel_size), number of convolution kernels (num_filters), and sequence length (seq_length) input to the model were changed to analyze the influences of different parameter values on the F1 value of the model. Accordingly, the convolution kernel size, number of convolution kernels, and input sequence length of the fault classification model were set to 3, 200, and 80, respectively, while the corresponding parameters of the key information extraction model were set to 3, 150, and 6. The other parameters of the models were set according to their performances and computing speeds, as shown in Table 5.
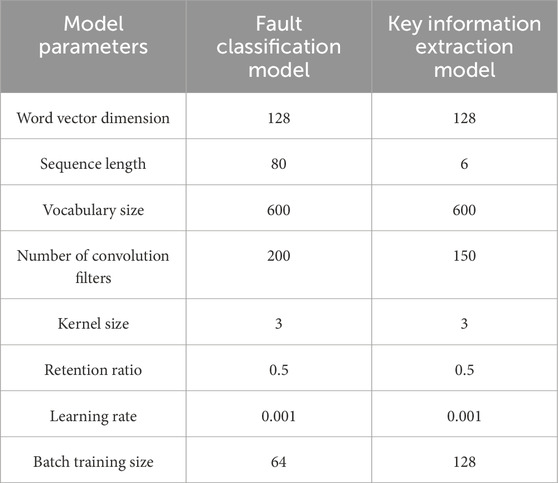
Table 5. Model parameter settings.
5.3 Experimental result analysis
5.3.1 Model test results
The two fault classification models and the key information extraction model were trained using the training sets of each group, and the corresponding test samples were tested. These test results are shown in Tables 6, 7, and 8. It is seen that both of the fault classification models can accurately determine the fault types of their respective samples and that the key information extraction model can correctly identify the key information in the alarm information samples.
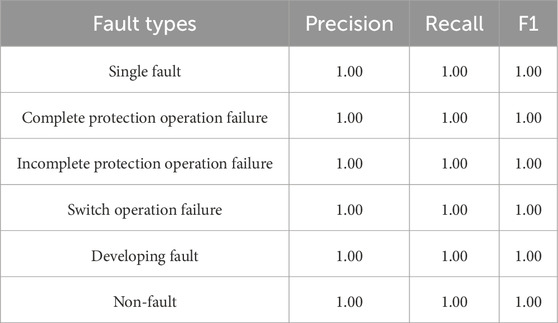
Table 6. Results of fault classification model 1.
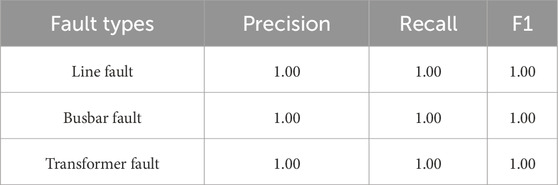
Table 7. Results of fault classification model 2.
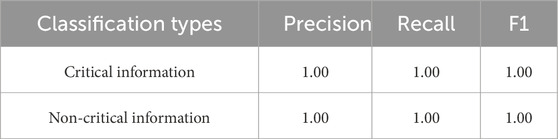
Table 8. Classification results of the key information extraction model.
5.3.2 Model diagnosis results for different fault sample sets
Different test sample sets were selected for fault classification and faulty equipment identification, and their results are shown in Table 9; it is seen from the table that the proposed method can accurately distinguish various fault types as well as identify the faulty equipment under single faults, developing faults, incomplete protection operation failure, and switch operation failure. However, it cannot identify the faulty equipment under the complete protection operation failure scenario as this requires the use of the network topology structure. The switch operation failure scenario also requires the use of the network topology to determine the faulty switches.
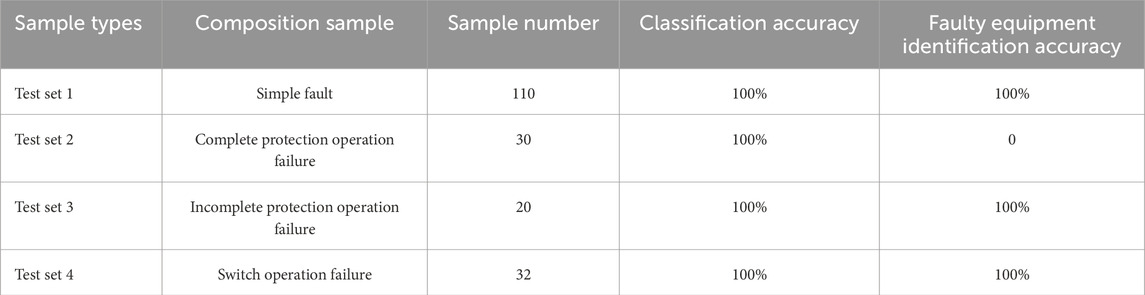
Table 9. Sample diagnosis results.
To address the concerns regarding the 100% classification accuracies reported in Tables 6, 7, and 8 for the fault classification models 1 and 2 as well as the key information extraction model, respectively, we reevaluated these models using 5-fold cross-validation and computed the 95% confidence intervals (CIs). This analysis yielded mean accuracies of 99% ± 0.8%, 98% ± 1.0%, and 99% ± 0.7% for the three models with 95% CIs of [97.5, 99.9], [96.2, 99.5], and [97.3, 99.8], respectively. These results are further discussed below and confirm the robustness of the models given the unrealistic nature of the initial 100% accuracy, thereby ensuring reliability for real-world power grid fault diagnoses.
To assess the performances of our models under noisy data conditions, we conducted experiments using the high-noise regional power grid dataset, which contains duplicate and delayed alarm signals. On this dataset, the fault classification models 1 and 2 as well as the key information extraction model achieved accuracies of 97%, 96%, and 97%, respectively; these results leverage the robustness of the DPCNN and confirm the effectiveness of the proposed models in handling noisy alarm logs, enhancing their practical relevance for real-world power grid fault diagnoses.
5.3.3 Comparisons with other models
To demonstrate the classification effects of the two fault classification and the key information extraction models based on DPCNN, we performed comparisons and verifications with the commonly used CNN model as well as the backpropagation neural network with TF-IDF (BPNN+TF-IDF) model used for text classification. Here, the BPNN+TF-IDF model uses the TF-IDF method for sample vectorization and BPNN for text classification. Figure 9 shows the comparison of the classification results of the three models; it can be seen that the classification accuracy of the DPCNN model is significantly higher than those of the CNN and BPNN+TF-IDF models. Moreover, as the number of classes increases, both the CNN and BPNN+TF-IDF models have lower accuracies.
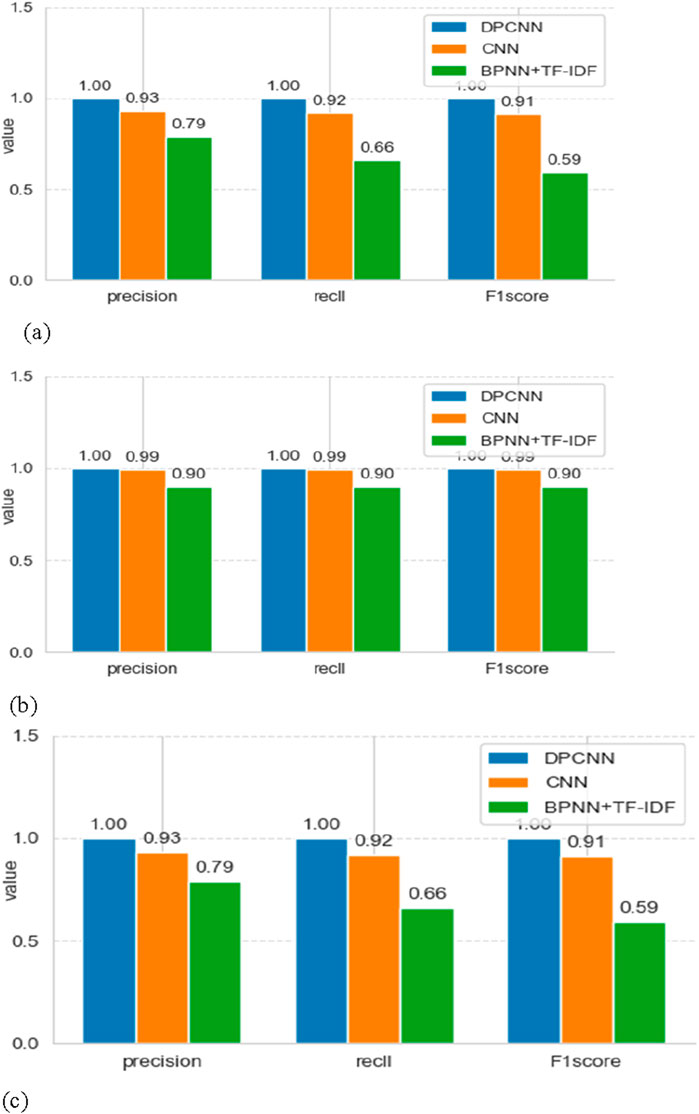
Figure 9. Comparison of the classification results of the three model types for (a) non-fault, simple fault, incomplete protection operation failure, complete protection operation failure, switch operation failure, and developing fault. (b) Classification results for line, bus, and transformer faults. (c) Alarm information statement classification results.
To enhance the credibility of the comparisons of the CNN and BPNN+TF-IDF models with the results shown in Tables 6, 7, and 8, we provide details of their architectures and hyperparameters. The CNN model consists of three convolutional layers (filter sizes: 3, 4, and 5) with each layer followed by a max-pooling layer (pool size = 2) and a fully connected layer with 128 units; it uses the rectified linear unit (ReLU) activation function and a dropout rate of 0.5. The CNN was trained with a learning rate of 0.001 and batch size of 32 for 50 epochs. The BPNN+TF-IDF model employs a BPNN with two hidden layers (256 and 128 units, ReLU activation) and the TF-IDF features extracted from alarm logs (maximum of 5,000 features); it was trained with a learning rate of 0.01, momentum of 0.9, and batch size of 64 for 100 epochs. These configurations ensure fair comparisons with the proposed DPCNN model.
5.3.4 Numerical example verification
Example 1. Analysis of an actual fault case at Weishan substation. Herein, the fault occurred in the Luolian D151 line, and the alarm information set generated by the fault is shown in Supplementary Appendix Table S1. The wiring diagram of the fault area is shown in Figure 10. The steps in the fault diagnosis are as follows:
1. The alarm information set shown in Supplementary Appendix Table S1 is imputed to the fault classification models 1 and 2 shown in Figure 5, and the corresponding classification results are shown in Table 10. Thus, it was determined that a simple line fault occurred in the system.
2. The key information extraction model was next used to extract the key information statements from the alarm information set, which produced statements with numbers 2, 6, 7, 11, 12, and 15; the suspicious faulty equipment set was obtained from these statements as
3. The fault classification results in Table 10 show that this sample is a simple line fault. According to the faulty equipment identification strategy, the suspected faulty equipment in D’ is “Luolian D151 Line,” which is determined as the faulty equipment. This finding is consistent with the actual faulty equipment, so the diagnosis result is correct.
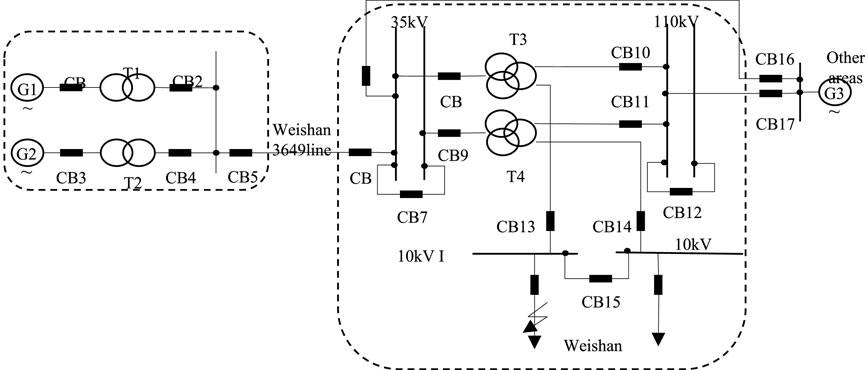
Figure 10. Wiring diagram of the fault area in Example 1.
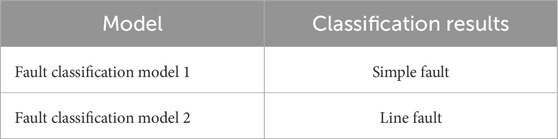
Table 10. Classification results of the fault models for example case 1.
Example 2. In the TS2000 simulation system, a permanent ABC three-phase fault occurred in the Yane line at Emei station, and the circuit breaker 2254 at Emei station failed to operate. The alarm information set generated by the fault is shown in Supplementary Appendix Table S2, and the wiring diagram of the fault area is shown in Figure 11. The steps in the fault diagnosis are as follows:
1. The alarm information set shown in Supplementary Appendix Table S2 is imputed to the fault classification models 1 and 2 shown in Figure 5, and the corresponding classification results are shown in Table 11. Thus, it was determined that a line fault and a switch operation failure occurred in the system.
2. The key information sentences in the alarm information set were then extracted using the key information extraction model, which indicated that there was key information in sentences 1, 2, 9–33, 36–38, 41–61, 64–76, 77–81, 83–86, and 93–107. The set of suspicious faulty equipment was obtained from these statements as
D = {“Emei Station 220 kV Bus”, “Emei Station 220 kV Yane Line”, “Yandang Station 220 kV Yane Line”, “Zhongshan Station 220 kV Zhonge Line I”, “Emei Station #2 Main Transformer”, “Emei Station 220 kV Zhonge Line II”}.
3. From the classification results of the meter fault, it is known that this sample set constitutes a line fault. Thus, the set of suspicious faulty devices D’ is obtained by further narrowing the scope of the suspected faulty equipment:
D' = {“Emei Station 220 kV Yane Line”, “Yandang Station 220 kV Yane Line”, “Zhongshan Station 220 kV Zhonge Line I”, “Emei Station 220 kV Zhonge Line II”}
4. The fault classification results in Table 11 show that this sample is a switch operation failure. According to the faulty equipment identification strategy, the first suspected faulty equipment in D’ is “Emei Station 220 kV Yane Line,” which is determined as the faulty equipment. This finding is consistent with the actual faulty equipment, so the diagnosis result is correct. To determine the faulty circuit breaker, further analysis is required in combination with the network topology.
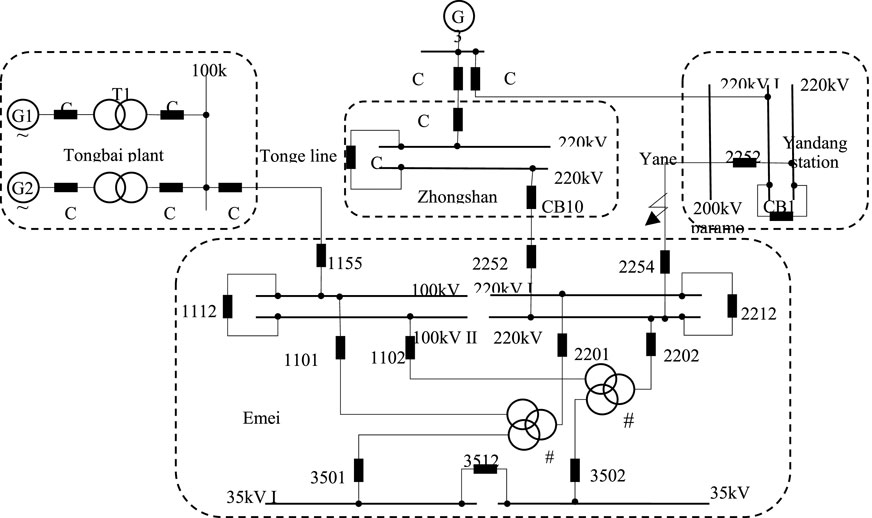
Figure 11. Wiring diagram of the fault area in Example 2.
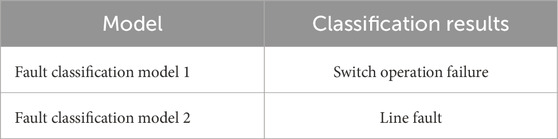
Table 11. Classification results of the fault models for example case 2.
6 Summary
We propose a power grid fault diagnosis method based on the DPCNN for classifying and analyzing alarm text information. Accordingly, we established two fault classification models and a key information extraction model based on the DPCNN along with a faulty equipment identification strategy by integrating fault types with their temporal priorities. Compared with traditional fault diagnosis methods, the proposed method has the following advantages:
1. The model can extract fault event features from the alarm text information directly to determine whether the faults contain unobservable events, such as switch and protection operation failures. Although these events must be determined through complex rule matching and reasoning in the rule system, the corresponding measurement function settings are not sufficiently established.
2. The model results directly correspond with the alarm information without the need for manual alarm information timing analyses, information screening, or modeling, which helps achieve end-to-end power grid fault diagnosis using only the alarm text information while greatly reducing the workload of the personnel, modeling, and maintenance.
3. The proposed method is tested on simulated and actual fault cases. The results show that this method can be adapted to different power grid environments as well as solved accurately under complex power grid fault conditions and complex data environments; therefore, it has high applicability for power grid fault diagnosis.
Aside from the demonstrated benefits of the proposed models based on the DPCNN, there exist certain limitations. When diagnosing complete protection and switch operation failures, there is still a need to rely on topological analysis to determine the possible fault ranges of these failures. However, the approach presented herein has high accuracy for identifying faulty equipment under complex conditions despite the aforementioned limitation and therefore has high application value.
Data availability statement
The original contributions presented in this study are included in the article/Supplementary Material, and any further inquiries may be directed to the corresponding author.
Author contributions
TL: Writing – original draft, Writing – review and editing. YW: Writing – original draft, Writing – review and editing. CW: Writing – original draft, Writing – review and editing.
Funding
The author(s) declare that no financial support was received for the research and/or publication of this article.
Conflict of interest
Authors TL, YW, and CW were employed by the Electric Power Dispatching and Control Center of Guangdong Power Grid Co., Ltd.
Generative AI statement
The author(s) declare that no Generative AI was used in the creation of this manuscript.
Any alternative text (alt text) provided alongside figures in this article has been generated by Frontiers with the support of artificial intelligence and reasonable efforts have been made to ensure accuracy, including review by the authors wherever possible. If you identify any issues, please contact us.
Publisher’s note
All claims expressed in this article are solely those of the authors and do not necessarily represent those of their affiliated organizations, or those of the publisher, the editors and the reviewers. Any product that may be evaluated in this article, or claim that may be made by its manufacturer, is not guaranteed or endorsed by the publisher.
Supplementary material
The Supplementary Material for this article can be found online at: https://www.frontiersin.org/articles/10.3389/fphy.2025.1624919/full#supplementary-material
References
1. Fukui C, Kawakami J. An expert system for fault section estimation using information from protective relays and circuit breakers. IEEE Trans. Power Deliv. (1986) 6(4):83–90. doi:10.1109/tpwrd.1986.4308033
2. Vale Z, Moura AME. An expert system with temporal reasoning for alarm processing in power system control centers. IEEE Trans. Power Syst. (1993) 8(3):1307–14. doi:10.1109/59.260863
3. Wang T, Wei X, Wang J, Huang T, Peng H, Song X, et al. A weighted corrective fuzzy reasoning spiking neural P system for fault diagnosis in power systems with variable topologies. Eng. Appl. Artif. Intell. (2020) 92:103680. doi:10.1016/j.engappai.2020.103680
4. Zhang Q, Han Z, Wen F. A new approach for fault diagnosis in power systems based on rough set theory. APSCOM-97 Int. Conf. Adv. Power Syst. Control Oper. Manage. (1997) 1997:597–602. doi:10.1049/cp:19971902
5. Francesco B, Luigi F. Residuals-based fault diagnosis of industrial automation systems using timed and untimed interpreted petri nets. Control Eng. Pract. (2022) 129. doi:10.1016/j.conengprac.2022.105361
6. Yan W, Lanqin G. Bayesian network based fault section estimation in power systems. Proc. TENCON IEEE (2006) 1–4. doi:10.1109/TENCON.2006.343894
7. Chang CS, Chen JM, Liew AC, Srinivasan D, Wen FS. Power system fault diagnosis using fuzzy sets for uncertainties processing. In: International Conference on Intelligent Systems Applications to Power Systems. IEEE (1996).
8. Wen F, Ledwich G, Liao Z, Guo W, He X, Liang J. An analytic model for fault diagnosis in power systems considering malfunctions of protective relays and circuit breakers. IEEE Trans. Power Deliv. (2010) 25(3):1393–1401. doi:10.1109/TPWRD.2010.2048344
9. Hinton GE, Salakhutdinov RR. Reducing the dimensionality of data with neural networks. Science (2006) 313(5768):504–7. doi:10.1126/science.1127647
10. Park YM, Kim G-W, Sohn J-M. A logic based expert system (LBES) for fault diagnosis of power system. IEEE Trans. Power Syst. (1997) 12(1):363–9. doi:10.1109/59.574960
11. Shan LF, Ai X, Liu YK, Xie CL, Zhou HK. A concurrent fault diagnosis method for electric isolation valves in nuclear power plants based on rule-based reasoning and data-driven methods. Progr. Nucl. Energy (2023) 171. doi:10.1016/j.pnucene.2024.105190
12. Xu XJ, Yan XP, Sheng CX, Yuan C, Xu D, Yang J. A belief rule-based expert system for fault diagnosis of marine diesel engines. IEEE Trans. Syst. Man Cybernetics (2022) 50(2):656–72. doi:10.1109/tsmc.2017.2759026
13. Georgilakis PS, Katsigiannis JA, Valavanis KP, Souflaris AT. A systematic stochastic petri net based methodology for transformer fault diagnosis and repair actions. J. Intell. Robotic Syst. (2006) 45(2):181–201. doi:10.1007/s10846-006-9033-9
14. Ramírez-Treviño A, Ruiz-Beltrán E, Arámburo-Lizárraga J, Lopez-Mellado E. Structural diagnosability of DES and design of reduced petri net diagnosers. IEEE Trans. Syst. Man Cybernetics A: Syst. Humans (2012) 42(2):416–29. doi:10.1109/TSMCA.2011.2169950
15. Ramírez-Treviño A, Ruiz-Beltrán E, Rivera-Rangel R, Lopez-Mellado E. Online fault diagnosis of discrete event systems: a petri net-based approach. IEEE Trans. Autom. Sci. Eng. (2007) 4(1):31–9. doi:10.1109/TASE.2006.872120
16. Zhu YL, Limin H, Lu JJ. Bayesian networks-based approach for power systems fault diagnosis. IEEE Trans. Power Deliv. (2006) 21(2):634–9. doi:10.1109/TPWRD.2005.858774
17. Lu XD, Yuan LF, Cheng Z, He Y, Yin B, Ding C. Sparse Bayesian learning-based topology reconstruction under measurement perturbation for fault location. IEEE Trans. Instrum. Meas. (2024) 73:1–9. doi:10.1109/tim.2023.3332942
18. Ye G, Xiang Y, Nijhuis M, Cuk V, Cobben JFG. Bayesian-inference-based voltage dip state estimation. IEEE Trans. Instrum. Meas. (2017) 66(11):2977–87. doi:10.1109/tim.2017.2734138
19. Zhang Y, Chung CY, Wen F, Zhong J. An analytic model for fault diagnosis in power systems utilizing redundancy and temporal information of alarm messages. IEEE Trans. Power Syst. (2016) 31(6):4877–86. doi:10.1109/tpwrs.2016.2519452
20. Huang Y, Tang J, Cheng Y, Li H, Campbell KA, Han Z. Real-time detection of false data injection in smart grid networks: an adaptive CUSUM method and analysis. IEEE Syst. J. (2016) 10(2):532–43. doi:10.1109/jsyst.2014.2323266
21. Yi Y, Chen ZY, Wang LM. Intelligent aging diagnosis of conductor in smart grid using label-distribution deep convolutional neural networks. IEEE Trans. Instrum. Meas. (2022) 17. doi:10.1109/TIM.2022.3141160
22. Bi T, Wen F, Ni Y. Distributed fault section estimation system using radial basis function neural network and its companion fuzzy system. Int. J. Electr. Power Energy Syst. (2003) 25(5):377–86. doi:10.1016/S0142-0615(02)00083-2
23. Cardoso G, Rolim JG, Zurn HH Application of neural-network modules to electric power system fault section estimation. lEEE Trans. Power Deliv. (2004) 19(3):1034–41. doi:10.1109/tpwrd.2004.829911
24. dos Santos Fonseca WA, Bezerra UH, Barros FGN, Moutinho JAPM, Nunes VA Simultaneous fault section estimation and protective device failure detection using percentage values of the protective device alarms. IEEE Trans. Power Syst. (2013) 28(1):170–80. doi:10.1109/tpwrs.2012.2207747
25. Zou M, Zhao Y, Yan D, Tang XL, Duan P, Liu SW. Double convolutional neural network for fault identification of power distribution network. Electr. Power Syst. Res. (2022) 210. doi:10.1016/j.epsr.2022.108085
26. Wen L, Li X, Gao L, Zhang Y. A new convolutional neural network-based data-driven fault diagnosis method. lEEE Trans. Ind. Electron. (2018) 65(99):5990–8. doi:10.1109/tie.2017.2774777
27. Yang D, Pang Y, Zhou B, Li K. Fault diagnosis for energy internet using correlation processing-based convolutional neural networks. IEEE Trans. Syst. Man Cybernetics (2019) 49(8):1739–48. doi:10.1109/TSMC.2019.2919940
28. Zhang Q, Ma WH, Li GL, Ding J, Xie M. Fault diagnosis of power grid based on variational mode decomposition and convolutional neural network. Electr. Power Syst. Res. (2022) 208:107871. doi:10.1016/j.epsr.2022.107871
29. Alqudah M, Pavlovski M, Dokic T, Kezunovic M, Hu Y, Obradovic Z. Fault detection utilizing convolutional neural network on timeseries synchrophasor data from phasor measurement units. IEEE Trans. Power Syst. (2022) 37(5):3434–42. doi:10.1109/tpwrs.2021.3135336
Keywords: deep pyramid convolutional neural network, power grid fault diagnosis, alarm information text, feature extraction, fault classification
Citation: Lan T, Wu Y and Wang C (2025) Grid fault diagnosis based on the deep pyramid convolutional neural network. Front. Phys. 13:1624919. doi: 10.3389/fphy.2025.1624919
Received: 08 May 2025; Accepted: 18 August 2025;
Published: 23 October 2025.
Edited by:
Yuanyuan Huang, Chengdu University of Information Technology, ChinaReviewed by:
Can Ding, China Three Gorges University, ChinaWeisha Zhang, University of Electronic Science and Technology of China, China
Copyright © 2025 Lan, Wu and Wang. This is an open-access article distributed under the terms of the Creative Commons Attribution License (CC BY). The use, distribution or reproduction in other forums is permitted, provided the original author(s) and the copyright owner(s) are credited and that the original publication in this journal is cited, in accordance with accepted academic practice. No use, distribution or reproduction is permitted which does not comply with these terms.
*Correspondence: Tian Lan, YTE1OTY4Mzc3MDA3QHNpbmEuY29t