 Mitra Mohammadi Bazargani
 Mohsen Falahati-Anbaran
 Jens Rohloff
- 1Agriculture Institute, Iranian Research Organization for Science and Technology, Tehran, Iran
- 2Department of Plant Sciences, School of Biology, University of Tehran, Tehran, Iran
- 3NTNU University Museum, Norwegian University of Science and Technology, Trondheim, Norway
- 4Department of Biology, Norwegian University of Science and Technology, Trondheim, Norway
The plants in the Epilobium genus are considered to have several important medicinal properties due to their unique chemical composition. Although metabolic profiles of medicinal plants are mainly controlled by genetic factors, their production is also to some degree influenced by environmental factors, thus, variations in the levels of phytochemicals may represent long-term ecological and evolutionary interactions. In order to depict the magnitude of natural variation in level of chemical compounds among conspecific populations of Epilobium hirsutum (n = 31) and E. parviflorum (n = 16), metabolite profiling of aerial parts of plants was performed with gas chromatography/mass spectrometry analysis. Putative identification and structure annotation revealed the presence of 74 compounds including 46 compounds considered secondary metabolites categorized into flavonoids (n = 8), phenolic acids (n = 26), steroids (n = 3), and terpenes (n = 5) across all populations. Although there was a considerable natural variation among conspecific populations, principal component analysis revealed a clear separation of populations of each species based on the second main principal component which was highly correlated with eight secondary metabolites. The level of secondary metabolites was significantly correlated between species (r = 0.91), suggesting shared metabolic pathways underlying the production of chemical compounds. In addition, redundancy and variance partitioning analyses by including bioclimatic variables and altitude revealed a significant contribution of elevation in explaining the total variation of secondary metabolites in E. hirsutum. Two-thirds of all secondary metabolites were significantly correlated with altitude in E. hirsutum. The large-scale geographic analyses of populations revealed additionally detected flavonoids and terpenes (E. hirsutum and E. parviflorum) and steroids (E. hirsutum) for the first time. This study provides significant information on additional chemical compounds found across the distribution range of the two ecologically important species of willow herb and emphasizes the importance of geographic-wide sampling as a valuable strategy to depict intraspecific and interspecific variability in chemical traits.
Introduction
An herbal product is economically affordable when the content of secondary metabolites or the so-called specialized metabolites (Tissier et al., 2014) and its active ingredients has reached a desirable and significant level. Both genetic and environmental factors that affect growth and development consequently may alter the biosynthesis of primary and secondary compounds in plants (Moore et al., 2014; Yang et al., 2018). Although these compounds are essentially supervised by genetic processes, their production is also influenced by various environmental factors, and the effect may vary considerably among compounds. The environment is considered an important factor affecting the level of gene expression in pathways involved in biosynthesis of secondary metabolites in medicinal plants. Thus, a large variation in the level of secondary metabolites among populations is expected, as habitat heterogeneity is increased across a larger geographical scale (Falahati-Anbaran et al., 2018).
Although various abiotic environmental factors including geographic features (latitude, altitude), light, and climatic, edaphic, and biotic interactions may affect the content and amount of secondary metabolites in plants, the correlation between the level of secondary metabolites and external variables may reflect the extent of variation and adaptation to specific environmental features (Jaakola and Hohtola, 2010; Gouvea et al., 2012; Sampaio et al., 2016; Demasi et al., 2018; Yang et al., 2018; Li et al., 2020). As shown in the study by Monschein et al. (2015), the phytochemical analysis of aerial tissues of three wild populations of Epilobium angustifolium suggested a positive correlation between altitude and the levels of flavanols. To our knowledge, most studies investigating natural variation in the level of secondary metabolites have mostly focused on intraspecific level from limited populations (e.g., Monschein et al., 2015). Although limited studies have also screened the intraspecific variability of secondary metabolites (e.g., Falahati-Anbaran et al., 2018), little is known regarding the interspecific variation in the level of metabolites while comparing multiple populations from a larger geographical range.
The Epilobium genus (Onagraceae) consists of nearly 200 species with worldwide distribution, ranging from tropical to temperate regions. Medicinal properties of various species of Epilobium have previously been studied. For instance, some Epilobium species have been widely used to treat and even prevent a variety of diseases and to enhance wound healing (Sõukand et al., 2020). In addition, the plant has been suggested for the treatment of skin diseases and inflammation such as eczema, acne, burns, and ulcers in traditional medicine (Vogl et al., 2013). The plant has also been successfully applied for bladder health maintenance, male health maintenance, hormonal imbalances, and urinary system health (Constantin et al., 2013).
Epilobium plants are rich sources of secondary metabolites, especially polyphenols, such as flavonoids, phenolic acids, and tannins (Granica et al., 2014). Generally, they include two pharmacologically important compounds: flavanols (mainly glycosides of myricetin and quercetin) (Averett et al., 1979; Slacanin et al., 1991; Ducrey et al., 1995; Bazylko et al., 2007a; Hevesi Tóth et al., 2009) and tannins, especially macrocyclic ellagitannins such as oenothein A (OeA) and B (OeB) (Lesuisse et al., 1996; Ducrey et al., 1997; Bazylko et al., 2007b; Shikov et al., 2010). Beside polyphenols, some lipophilic compounds such as steroids (Hiermann and Mayr, 1985; Nowak and Krzaczek, 1998; Pelc et al., 2005; Hevesi Tóth, 2009) and triterpenoids (Glen et al., 1967; Hiermann, 1983; Hevesi Tóth et al., 2006) are also synthesized in the Epilobium species.
In recent decades, attention has been increased to understand the chemical composition of Epilobium. Although the phytochemical compounds of some species including E. hirsutum, E. angustifolium, E. dodonaei, E. fleischeri, E. roseum, E. montanum, E. parviflorum, and E. tetragonum has previously been determined (Slacanin et al., 1991; Ducrey et al., 1995; Hiermann, 1995; Hevesi Tóth et al., 2009; Granica et al., 2014), limited knowledge is available on the extent of natural variation among natural populations. In addition, all studies on Epilobium have studied chemical composition on a single or few populations within species. Eighteen species of Epilobium have been reported in flora of Iran which mainly occur in riparian habitats or moist soil from various geographical regions of Iran (Akbari and Azizian, 2006). Two species, E. hirsutum and E. parviflorum, are native and widely distributed in Iran. These species are growing in a wide range of mountainous regions producing relatively high shoot biomass compared with the other known species in which the size of E. hirsutum reaches up to 2 m in some localities (personal observation by authors). The occurrence of E. hirsutum and E. parviflorum across a wide range of altitudes may suggest adaptation to different ecological conditions and provides an opportunity to perform interspecific comparative analyses of metabolite variation.
Based on our knowledge from extensive literature review, no studies have been done on multiple wild populations of E. hirsutum and E. parviflorum to demonstrate the extent of natural variation in the content of secondary metabolites and the occurrence of additionally detected chemical compounds. The aims of this study were to quantify the magnitude of natural variation within and among E. hirsutum and E. parviflorum, two widely distributed species with high shoot biomass. We also tested whether the level of chemical compounds was correlated between species and with environmental variables.
Materials and Methods
Plant Material
Aerial parts of plants consisting of leaves and flowers from 47 populations of Epilobium (Onagraceae) were collected during the flowering period at the end of June from natural habitats, where each individual consisted of at least 50% of opened flowers (Table 1 and Figure 1). The study populations consisted of 31 and 16 natural populations of E. hirsutum and E. parviflorum, respectively. From each population, the aerial parts of 20 randomly selected individual plants were collected and the samples of each population placed in a paper bag and then air dried at room temperature at ca 30°C in shade. Finally, the plant samples of each population were pooled together and used for phytochemical analysis. It is likely that sample collection and processing on the amount of secondary metabolites and the procedure of air drying may affect compound levels. Since we have used the same drying conditions for all populations, we expect negligible effects of bias caused by air drying on the amount of secondary metabolites.
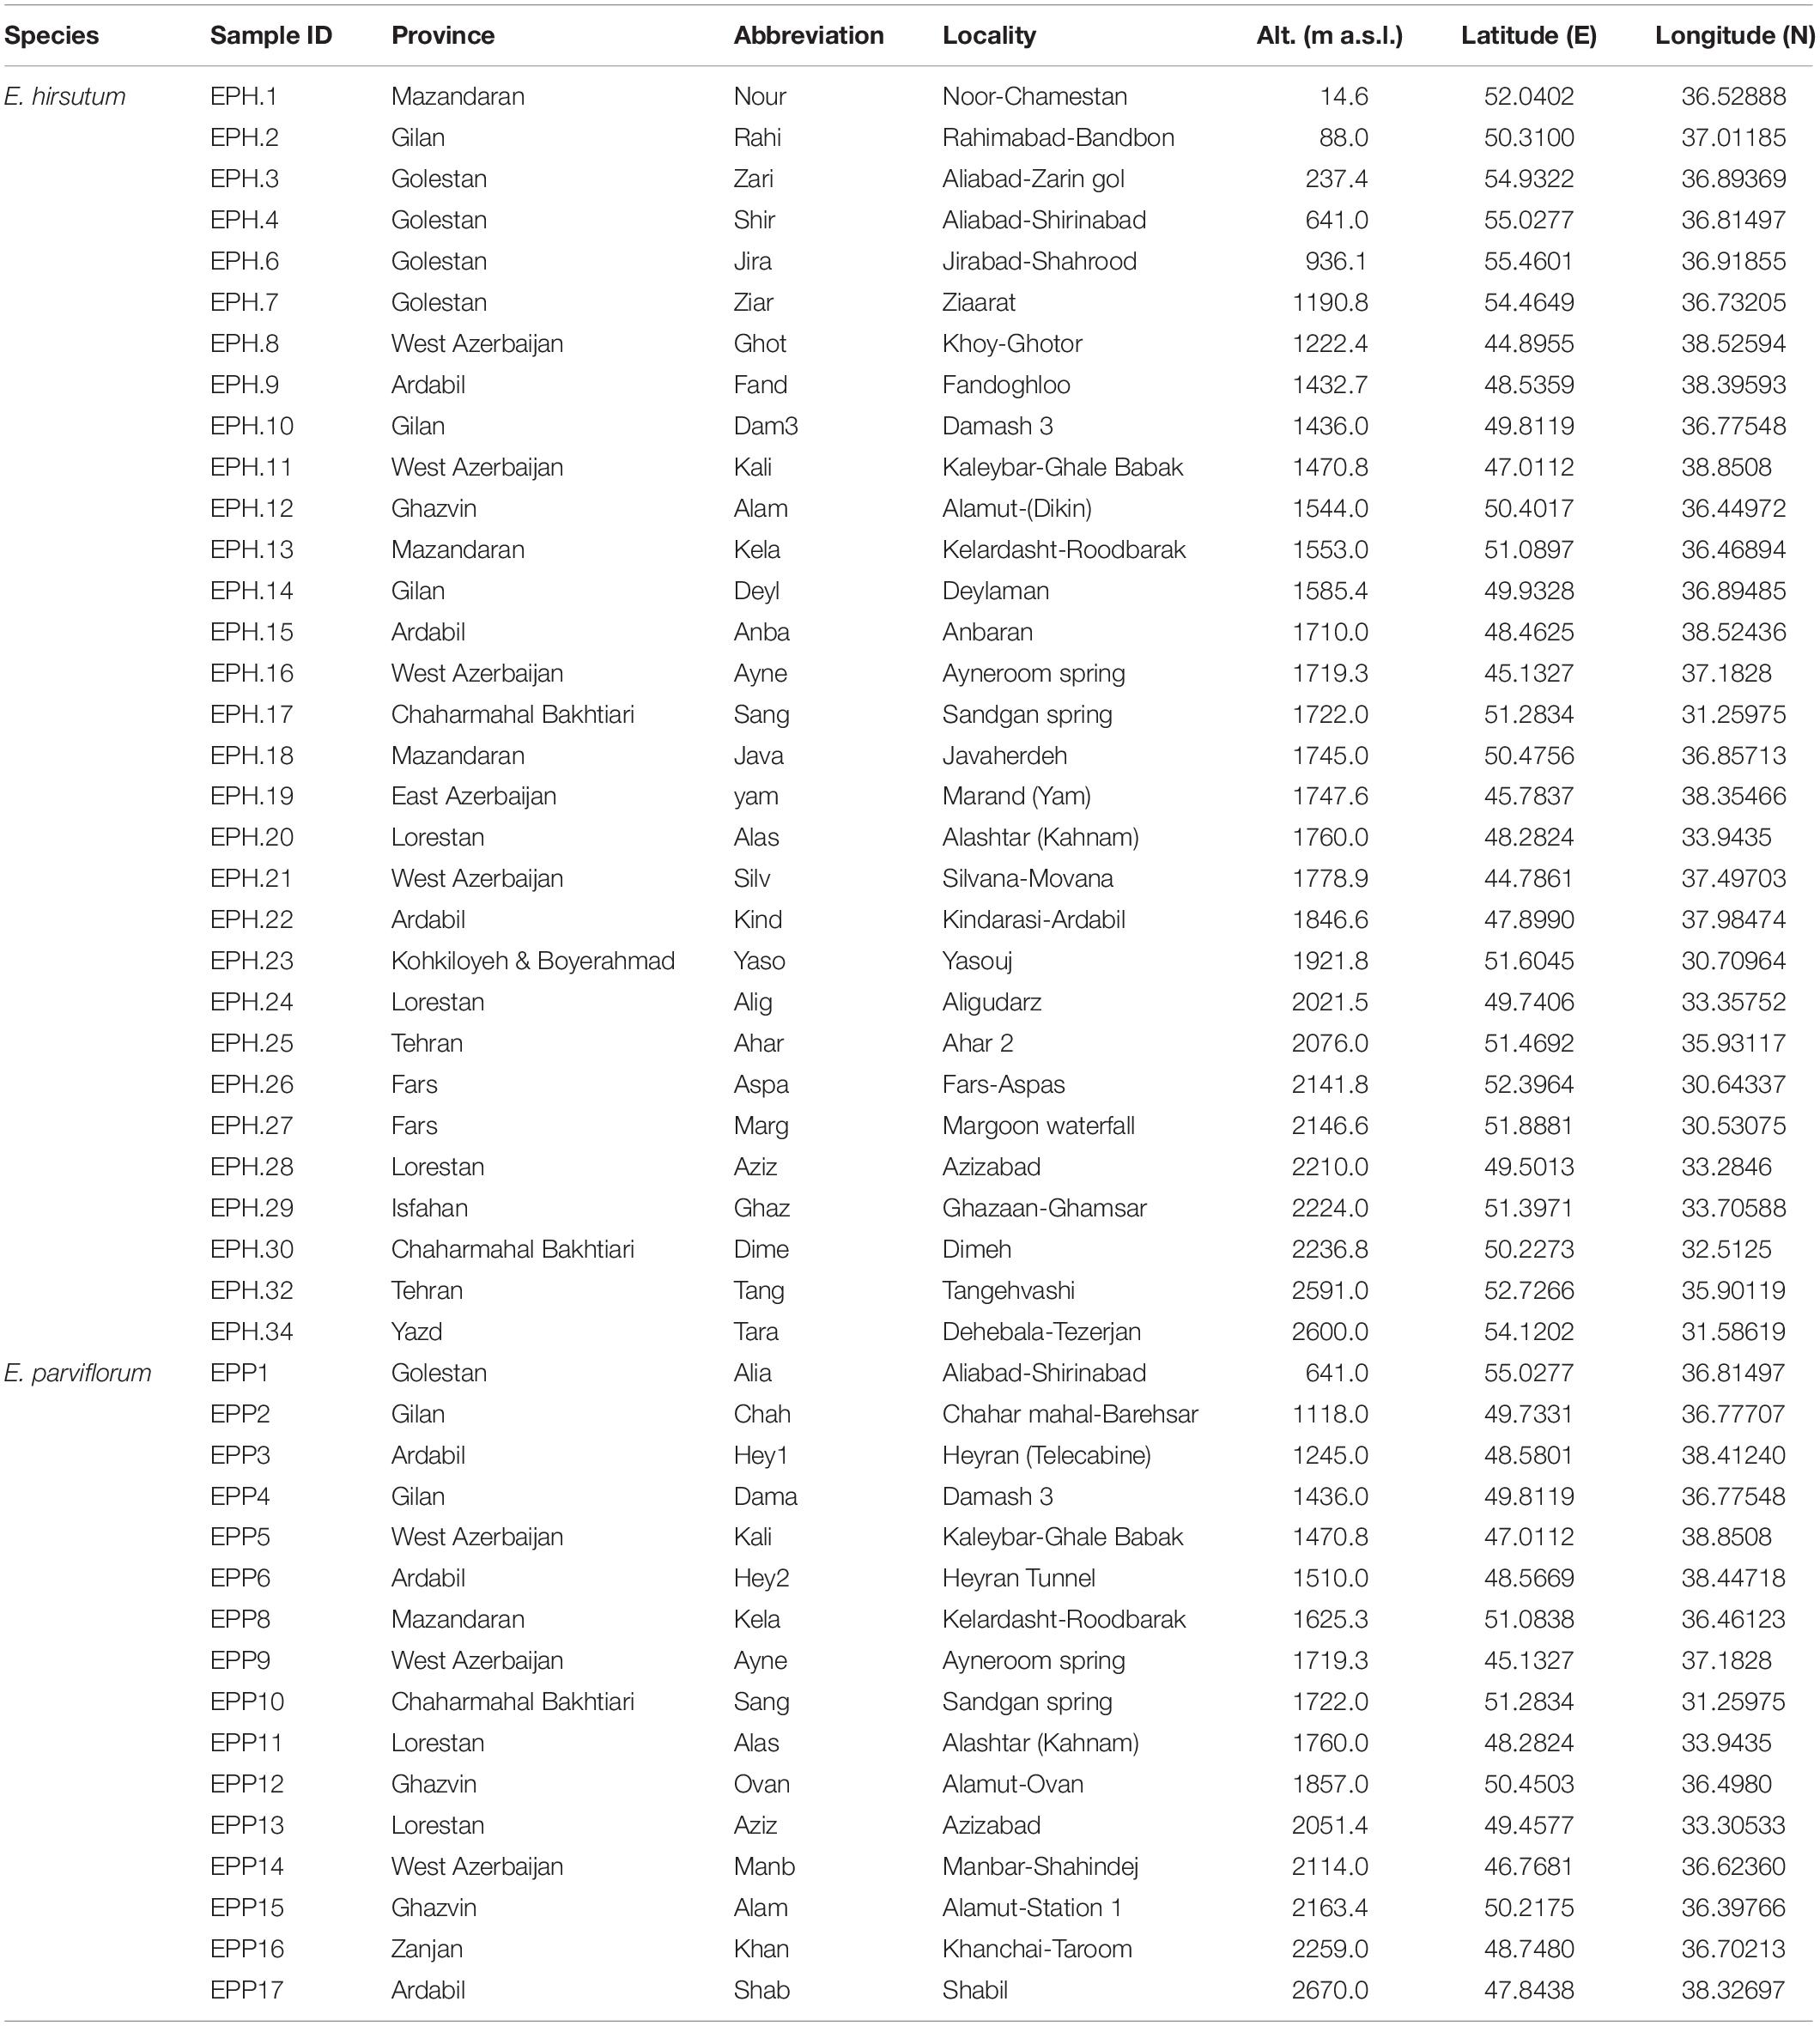
Table 1. The geographic information of natural populations of E. hirsutum and E. parviflorum.

Figure 1. The geographic distribution of natural populations of Epilobium hirsutum (A) and E. parviflorum (B) used in the study. Each pie represents the proportion of secondary metabolites for each population. Only those compounds detected at a higher level than 0.25 mg/g DW in at least one population were included (n = 31). Gallic acid, quinic acid, 4-hydroxyphenyl ethyl-b-D-glucopyranoside, flavonoid 1 myricetin, and ellagic acid are presented as green, gray, orange, brown, red, and blue color, respectively.
Extraction of Polar Compounds and Derivatization
Dried plant material was cut into similar small pieces with scissors, and 2 g of tissue was then mixed with 20 ml of 80% methanol (99.8%, anhydrous; Sigma-Aldrich) containing the internal standard ribitol (≥99%; Sigma-Aldrich) at a concentration of 150 μg/ml. Samples were then incubated on a shaking incubator at 25°C for 24 h under fume hood. The extracts were filtered through quantitative and ashless filter paper (Whatman) and centrifuged for 3 min at 3,100 rpm (825 × g) at 4°C. The supernatant of each extract was transferred into 1.5 ml round-bottomed microtubes and stored at −20°C until use. Aliquots of sample extracts (500 μl) were dried in a Speed Vac (Savant) overnight (18 h) without heating. Residues were redissolved in 80 μl of 20 mg/ml methoxyamine hydrochloride (98.0%; Sigma-Aldrich) in pyridine (≥99.0%; Sigma-Aldrich) and incubated at 30°C for 90 min. Then, samples were derivatized with 80 μl of N-methyl-N-(trimethylsilyl) trifluoroacetamide (MSTFA) (≥98.5%; Supelco) by incubation at 37°C for 30 min. Finally, samples were transferred to 1.5 ml autosampler vials with glass inserts and stored at −20°C prior to gas chromatography/mass spectrometry (GC/MS) analysis.
GC/MS-Based Metabolite Profiling
An Agilent 6890/5975 GC/MS (Agilent Technologies Inc., Palo Alto, CA, United States) was used to analyze all samples. GC separations were carried out using a Supelco SLB 5 ms capillary column (30 m × 0.25 mm and film thickness 0.25 μm). Sample volumes of 1 μl were injected with a split ratio of 15:1. Injection temperature was set at 230°C, and the interface was set to 250°C. The carrier gas used was He at a constant flow rate of 1 ml/min. The GC temperature program was held isothermically at 70°C for 5 min, ramped from 70 to 310°C at a rate of 5°C/min, and finally held at 310°C for 7 min (analysis time: 60 min). The MS source was adjusted to 230°C, and a mass range of m/z 70–700 was recorded. All mass spectra were acquired in electron impact ionization (EI) mode (70 eV). Upon visual inspection of GC/MS chromatograms using Agilent ChemStation software (Agilent Technologies, Waldbronn, Germany), raw data was subjected to peak detection, baseline correction, alignment of mass signals, and peak height integration using the data alignment software MetAlign (Wageningen UR, Netherlands). Metabolomics raw data have been deposited to the GNPS database (Global Natural Products Social Molecular Networking, Wang et al., 2016) with the identifier: MassIVE MSV000086585. The complete dataset can be accessed here— doi: 10.25345/C5Z19Z.
Putative Identification and Structure Annotation of Compounds
Using selected, unique MS intensities, metabolites were semiquantitatively determined as relative metabolite abundance, calculated by normalization of signal intensity to that of ribitol, and concentrations of compounds were finally expressed as milligrams per gram dry weight (DW) (e.g., Lisec et al., 2006). For mass spectral evaluation, deconvolution analysis, and putative identification or structure annotation of metabolite peaks, AMDIS software (National Institute of Standards and Technology, Boulder, CO, United States) was used in combination with the Golm Metabolome database (GMD) (Max-Planck Institute for Molecular Plant Physiology, Golm, Germany), the MassBank high-resolution mass spectral database (NORMAN Association, Verneuil-en-Halatte, France), the NIST05 spectral library (National Institute of Standards and Technology, Gaithersburg, MD, United States), and an in-house MS and retention index (RI) library of derivatized plant metabolites [GMD linear retention indices (LRI) and LRI values from literature]. An AMDIS minimum net match factor of ≥80% could be reported for all phytochemicals, which are included with mass spectra in the applied MS libraries (phenolic acids, flavonoids, terpenes, and steroids). The putative characterization and structure annotation of metabolite peaks (aromatic compounds) was based on the presence of known qualifier ions (Rohloff, 2015). In addition, LRI of detected metabolites were recalculated using a homologous series of n-alkanes in order to validate putative identifications, based on a combination of mass spectral data and RI values.
Statistical Analyses
To determine the differences between the study species, the level of major secondary metabolites were compared between E. hirsutum and E. parviflorum (Supplementary Table 1). In addition, to determine the overall similarity between E. hirsutum and E. parviflorum, the correlation between the average amount of secondary metabolites (n = 46) between species was tested. To illustrate the amount of natural variation within and between species, principal component analysis was performed using XLSTAT 2007.6, and the results were presented as a two-dimensional plot based on two first main components. In addition, the correlation between chemical compounds and the two main principal components were illustrated.
In order to produce a topographic map, elevation data with spatial resolution of 30 s was obtained from WorldClim 2.0 database (Fick and Hijmans, 2017) and plotted on geographic map with raster package in R (Hijmans and Etten, 2020). The chemical composition of populations were presented as a pie chart on the topographic map with Plotrix (Lemon, 2006). The geographic coordinates of each population was used to extract 19 bioclimatic variables from WorldClim 2.0 based on spatial resolution 30 s (Supplementary Table 2). To determine the contribution of bioclimatic variables and altitude in total variation of chemical variables, variance partitioning and redundancy analysis (RDA) were performed on scaled data using varpart and rda functions with vegan in R package, respectively (Oksanen et al., 2019). We applied maximum absolute scaling on both climatic and secondary metabolite data by dividing the value of each observation to the maximum value for a given variable using decostand function with vegan. RDA is a multivariate analysis that combines multiple linear regressions with classical ordination technique, PCA. The significance of canonical ordinations was tested by means of 1,000 permutations. In order to investigate the relationship between scaled value of phytochemical compounds and altitude, the correlation analysis was performed using XLSTAT 2007.6. This analysis was also performed on scaled data for the major groups of chemical compounds, i.e., flavonoids, phenolic acids, steroids, and triterpenes, separately, and the relationship was further reported as scatter plot.
Results
The Number of Chemical Compounds
The results of metabolite profiling with GC/MS analysis in E. hirsutum and E. parviflorum populations revealed 74 chemical compounds including 46 secondary metabolites (Table 2). Other compounds were mainly classified as primary metabolites (n = 18) and non-identifiable aromatic compounds (n = 10) putatively characterized based on aromatic qualifier ions, and therefore were less discussed in this paper. In terms of phytochemical properties, 46 compounds were classified into different groups including flavonoids (n = 8), phenolic acids and its derivatives (n = 26), steroids (n = 3), terpenes (four triterpenes and one diterpene), lignin and neolignan glycosides (n = 3), and a compound belonging to the group of plant hormones (Table 2).
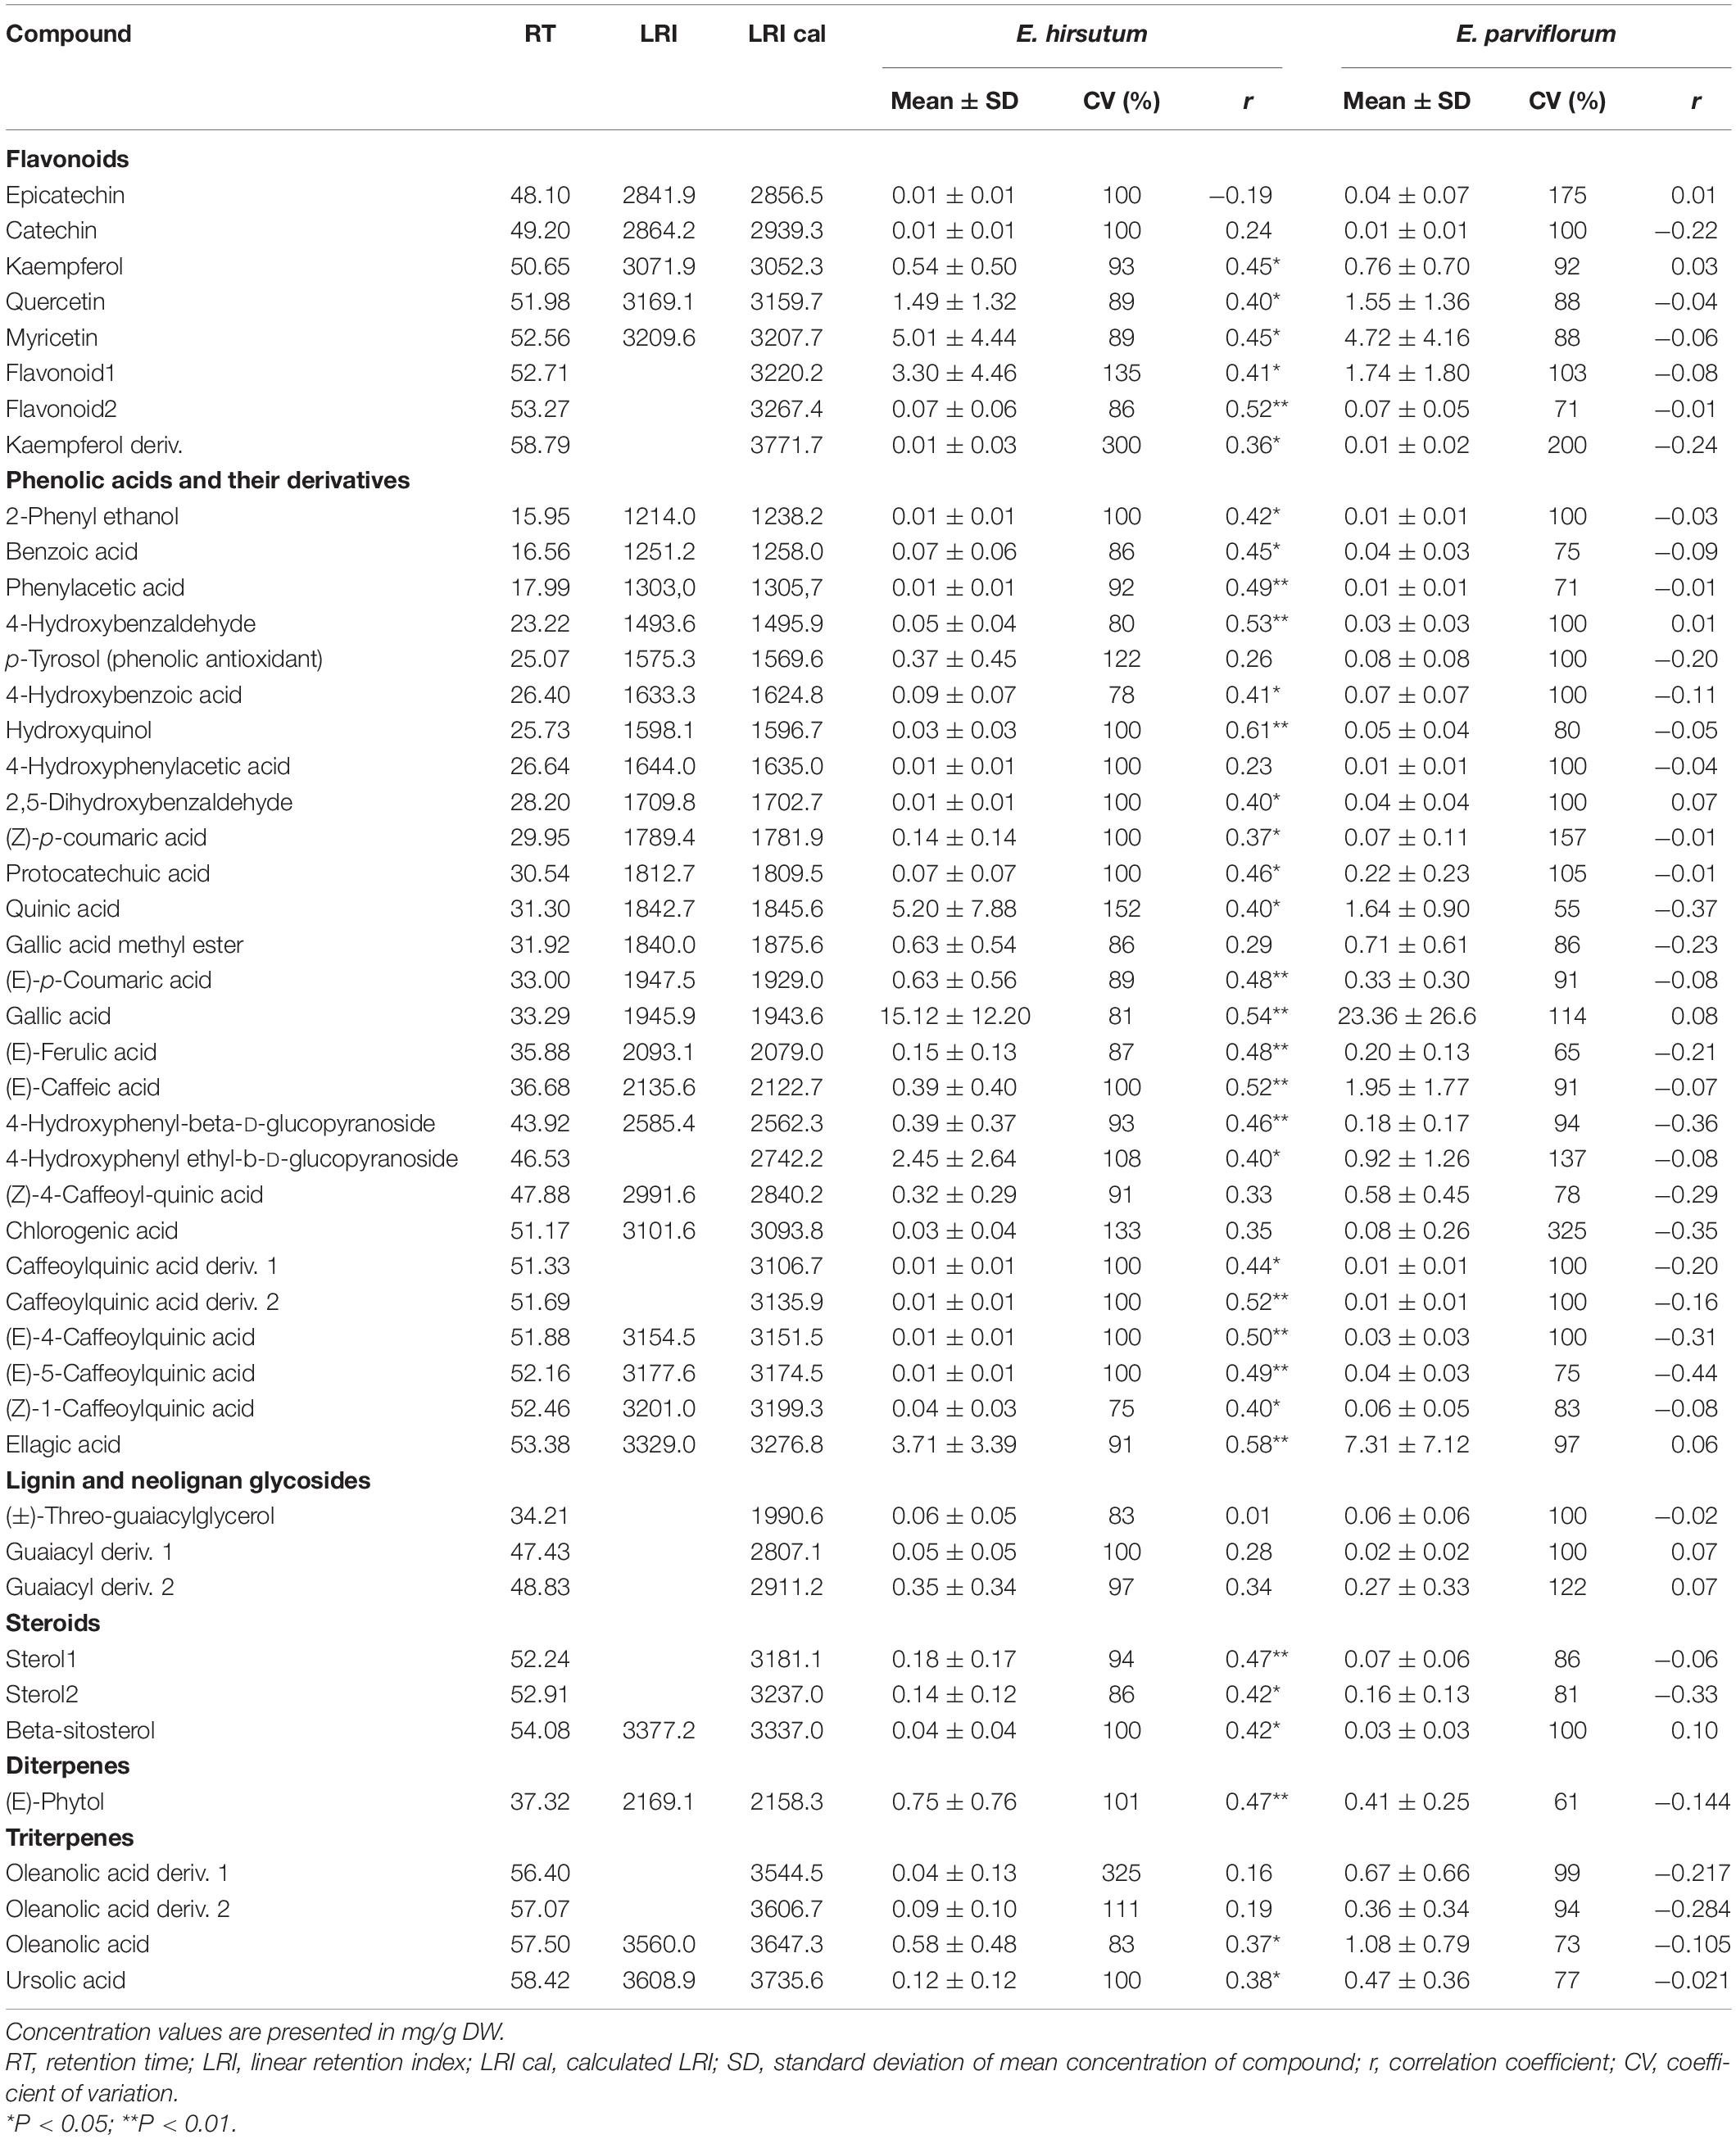
Table 2. The average amount of secondary metabolites across populations of Epilobium hirsutum and E. parviflorum and the relationship between chemical compounds and altitude.
Variability Between Species Across All Secondary Metabolites
The two-dimensional plot obtained from principal component analysis revealed a high variation between species, and the second principal component clearly separated most populations of each species (Figure 2). The two main components explained 71% total variation in the chemical compounds. The high contribution of the two first components suggested a considerable correlation between chemical compounds (data not shown). Eight compounds including ursolic acid, oleanolic acid deriv. 1, (E)-caffeic acid, oleanolic acid deriv. 2, (E)-4-caffeoylquinic acid, (E)-5-caffeoylquinic acid, 2,5-dihydroxybenzaldehyde, and protocatechuic acid revealed a positive correlation (loading factor > 0.6), with the second principal component (PC2) represented by populations of E. parviflorum (Figure 2). The results of PCA were similar to that including all 74 detected compounds (Supplementary Figure 1). Interestingly, the average level for secondary metabolites was positively correlated between E. hirsutum and E. parviflorum (n = 46, r = 0.91, P < 0.0001, Figure 3).
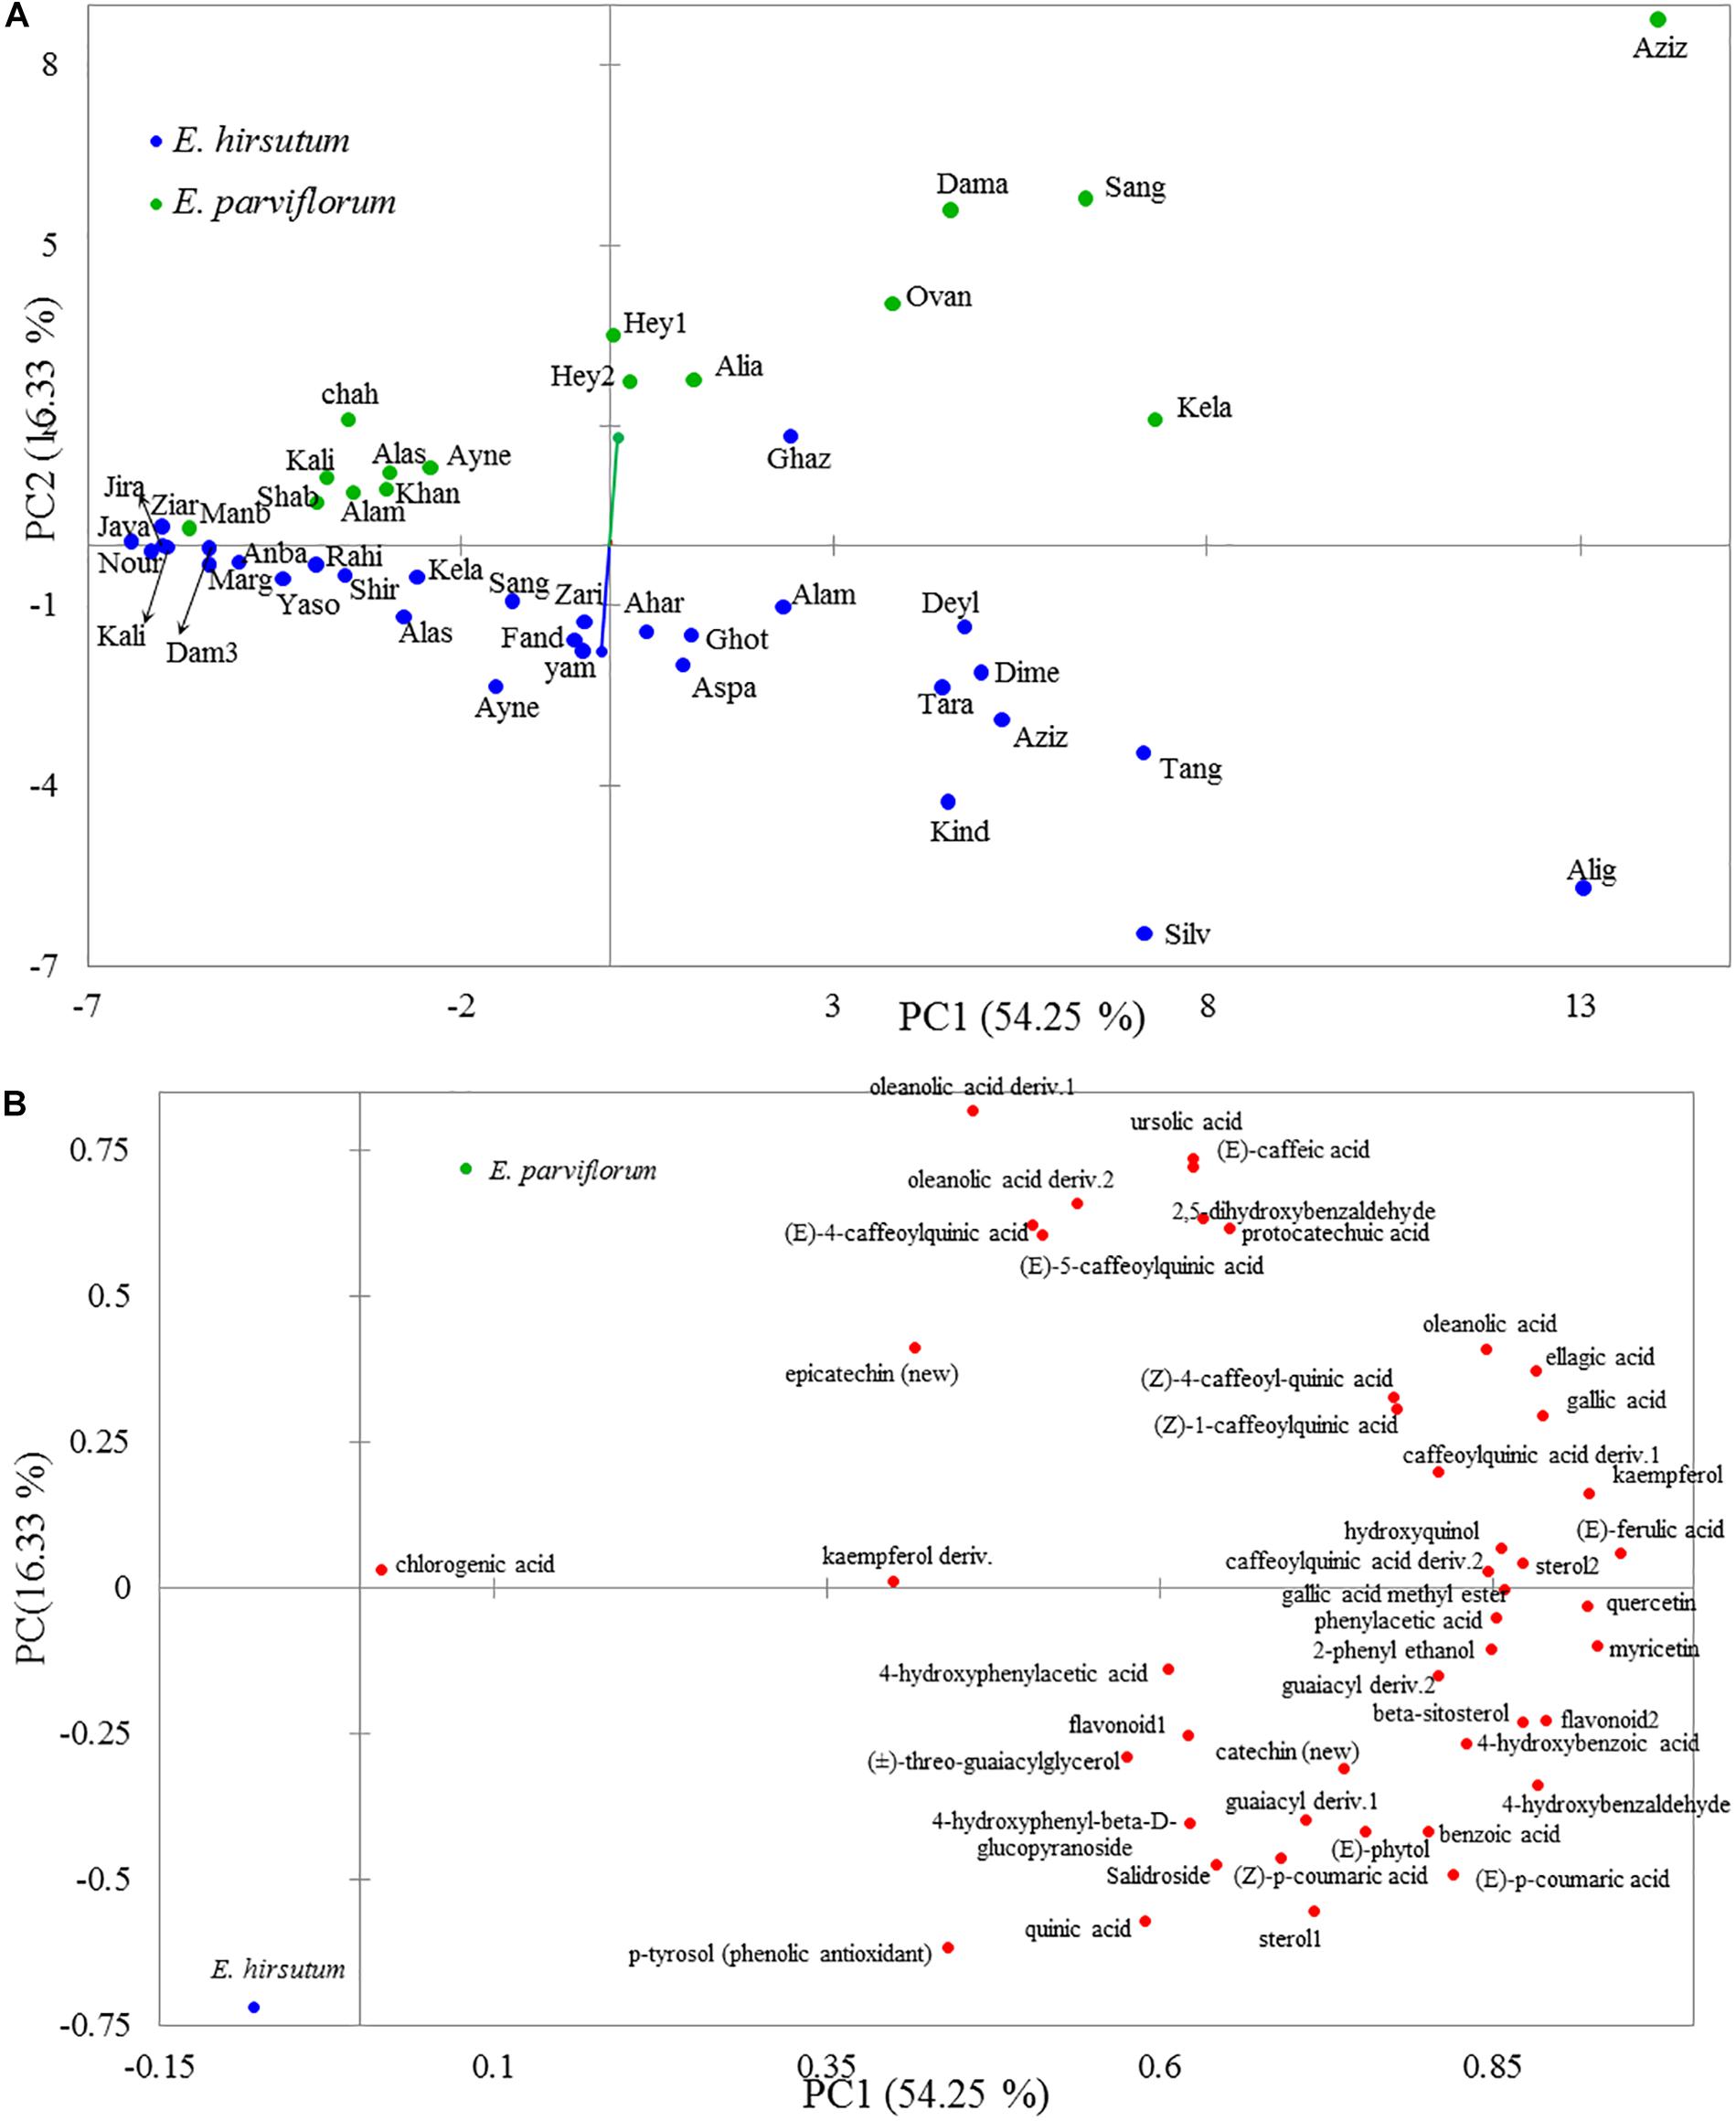
Figure 2. The two-dimensional plot obtained by principal component analysis from 46 secondary metabolites illustrating the variation among E. hirsutum and E. parviflorum populations (A) and the correlation between each chemical variable and the first two principal components (B).
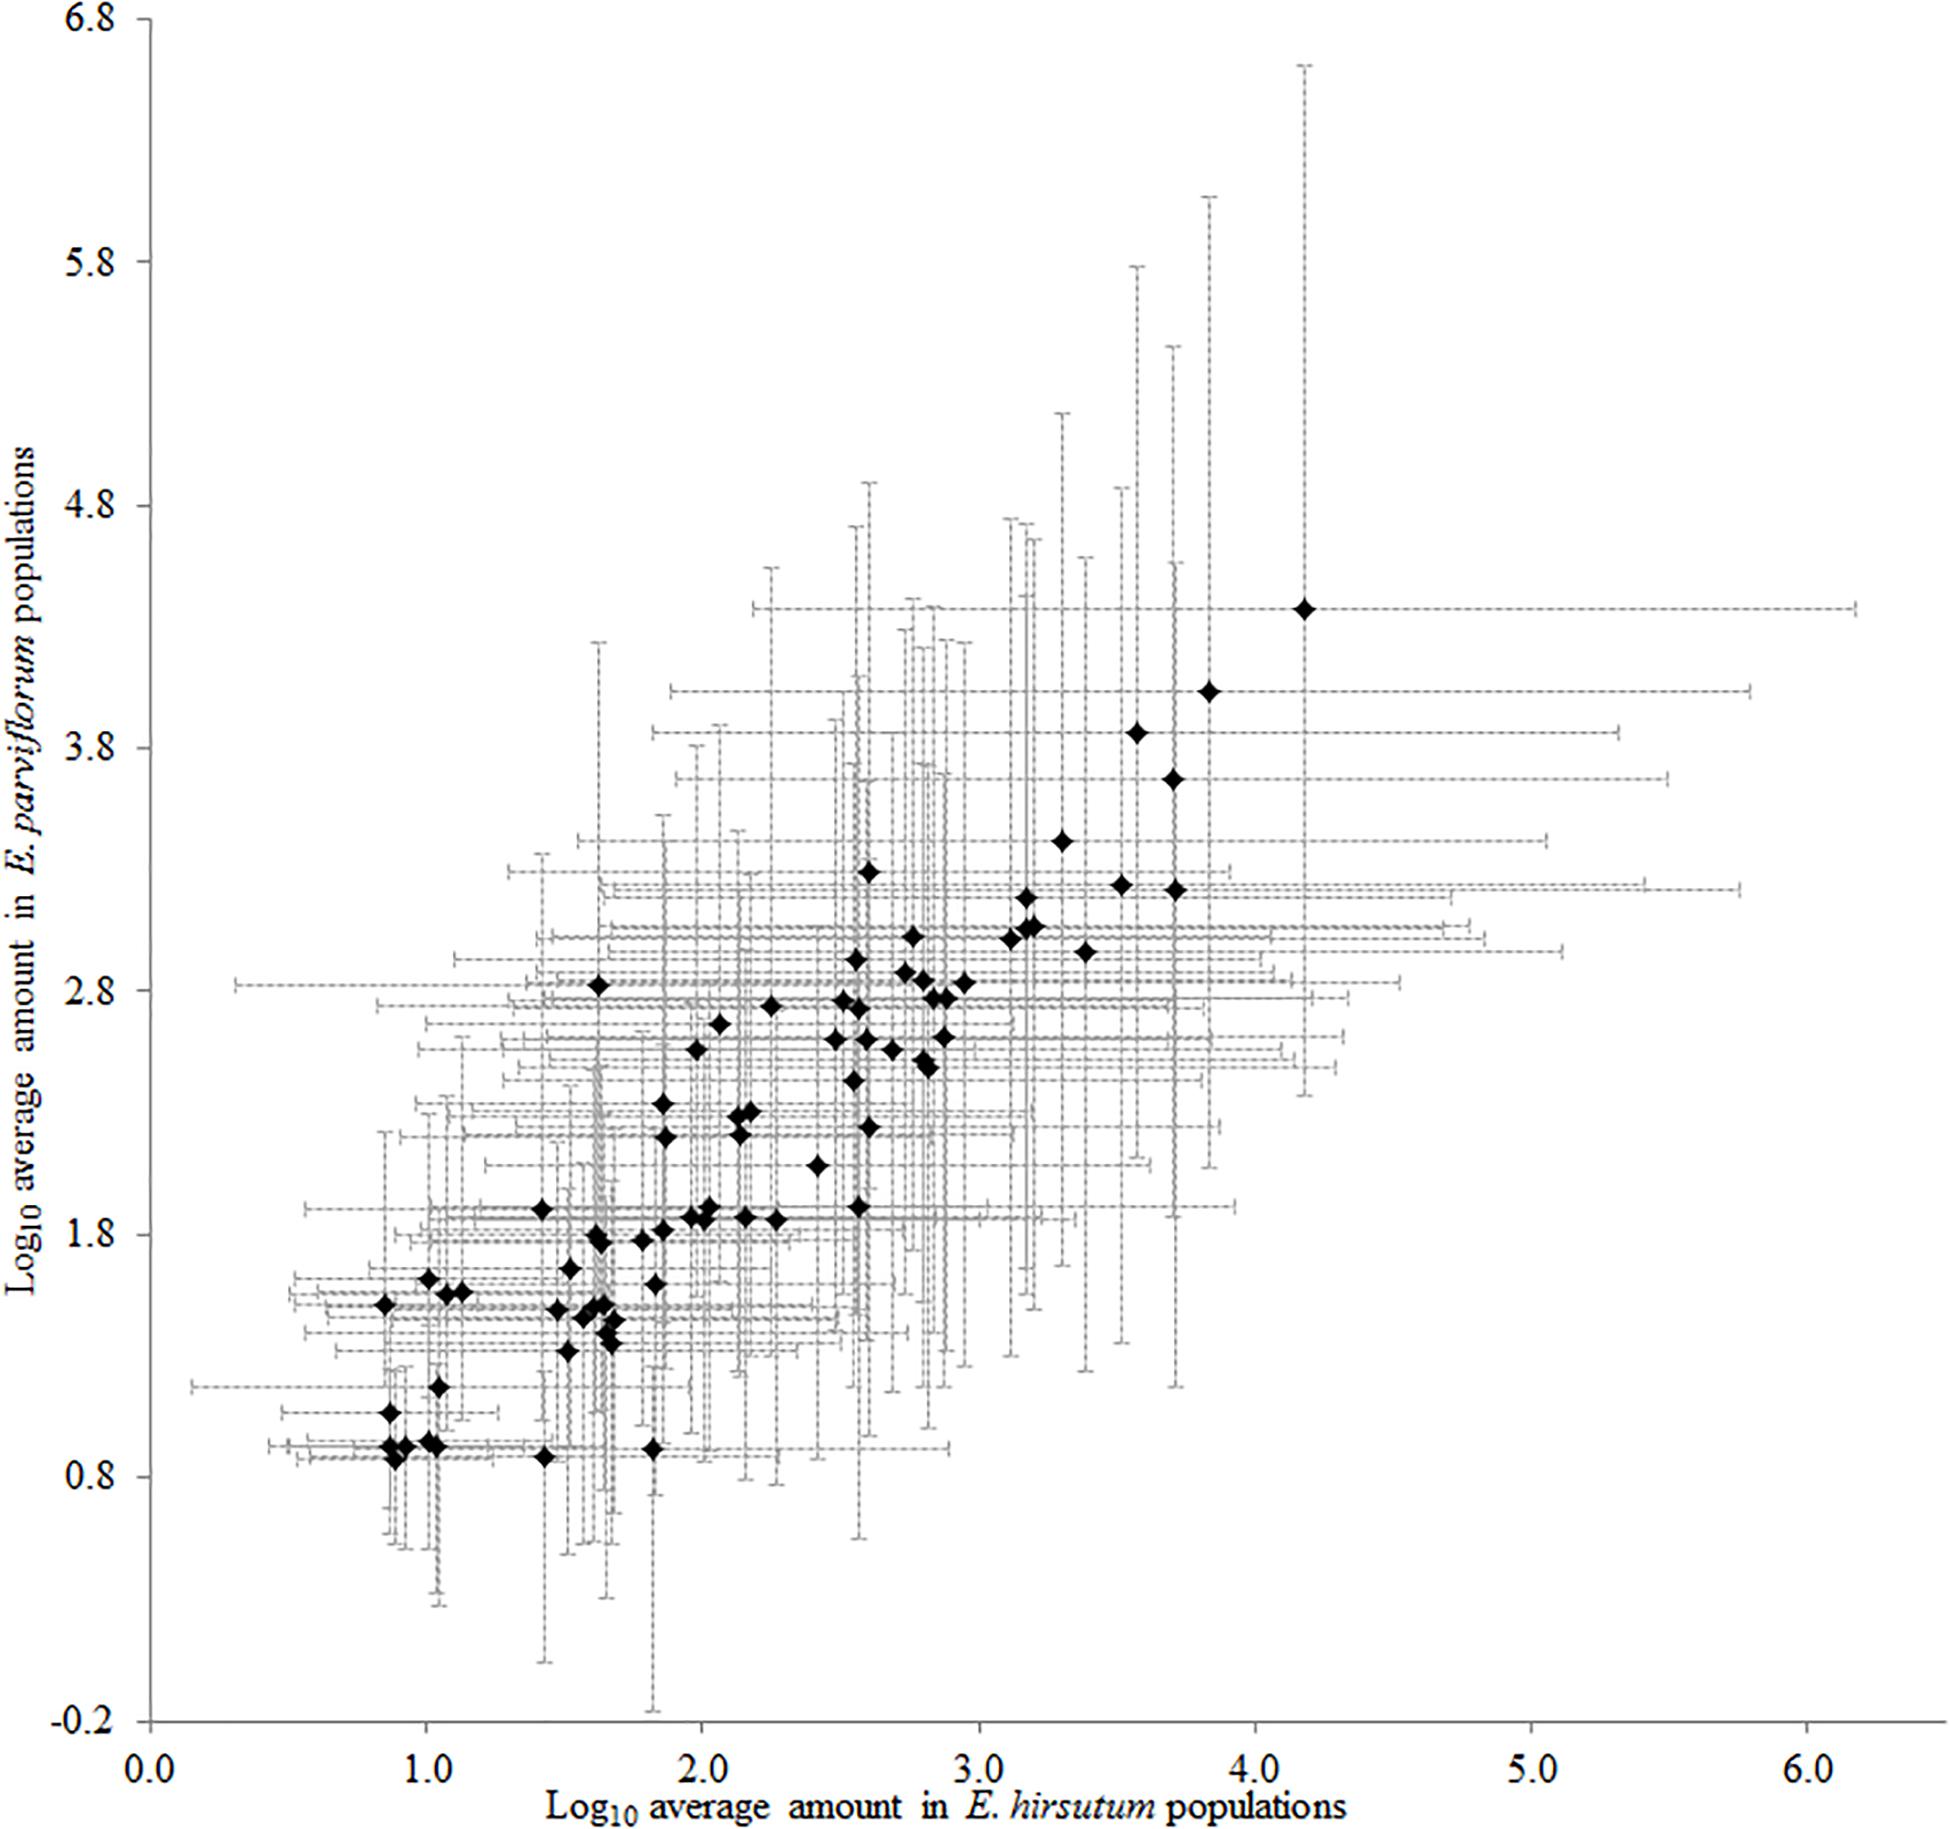
Figure 3. The similarity between E. hirsutum and E. parviflorum in the amount of 46 secondary metabolites (Pearson’s r = 0.91, R2 = 0.82, P < 0.0001).
Interspecific Variation in the Level of Flavonoids, Phenolic, Steroids, and Terpenes
All secondary metabolites were classified into four major groups including flavonoids, phenolic, steroids, and terpenes. The mean total amounts of flavonoids (n = 8 compounds) in E. hirsutum populations (10.46 mg/g DW) was similar to that in E. parviflorum (8.90 mg/g DW) (t = 0.57, P = 0.57, Figure 4). Myricetin was the dominant compound in both E. hirsutum and E. parviflorum with an average amount of 5.01 and 4.72 mg/g DW (t = 0.22, P = 0.83), respectively. Catechin was observed in lowest amount in both species (Table 2). On average, the order of the main components of the flavonoids for both E. hirsutum and E. parviflorum populations was myricetin > flavonoid 1 > quercetin > kaempferol. No significant difference was observed for the main flavonoid compounds between E. hirsutum and E. parviflorum (Figure 5).
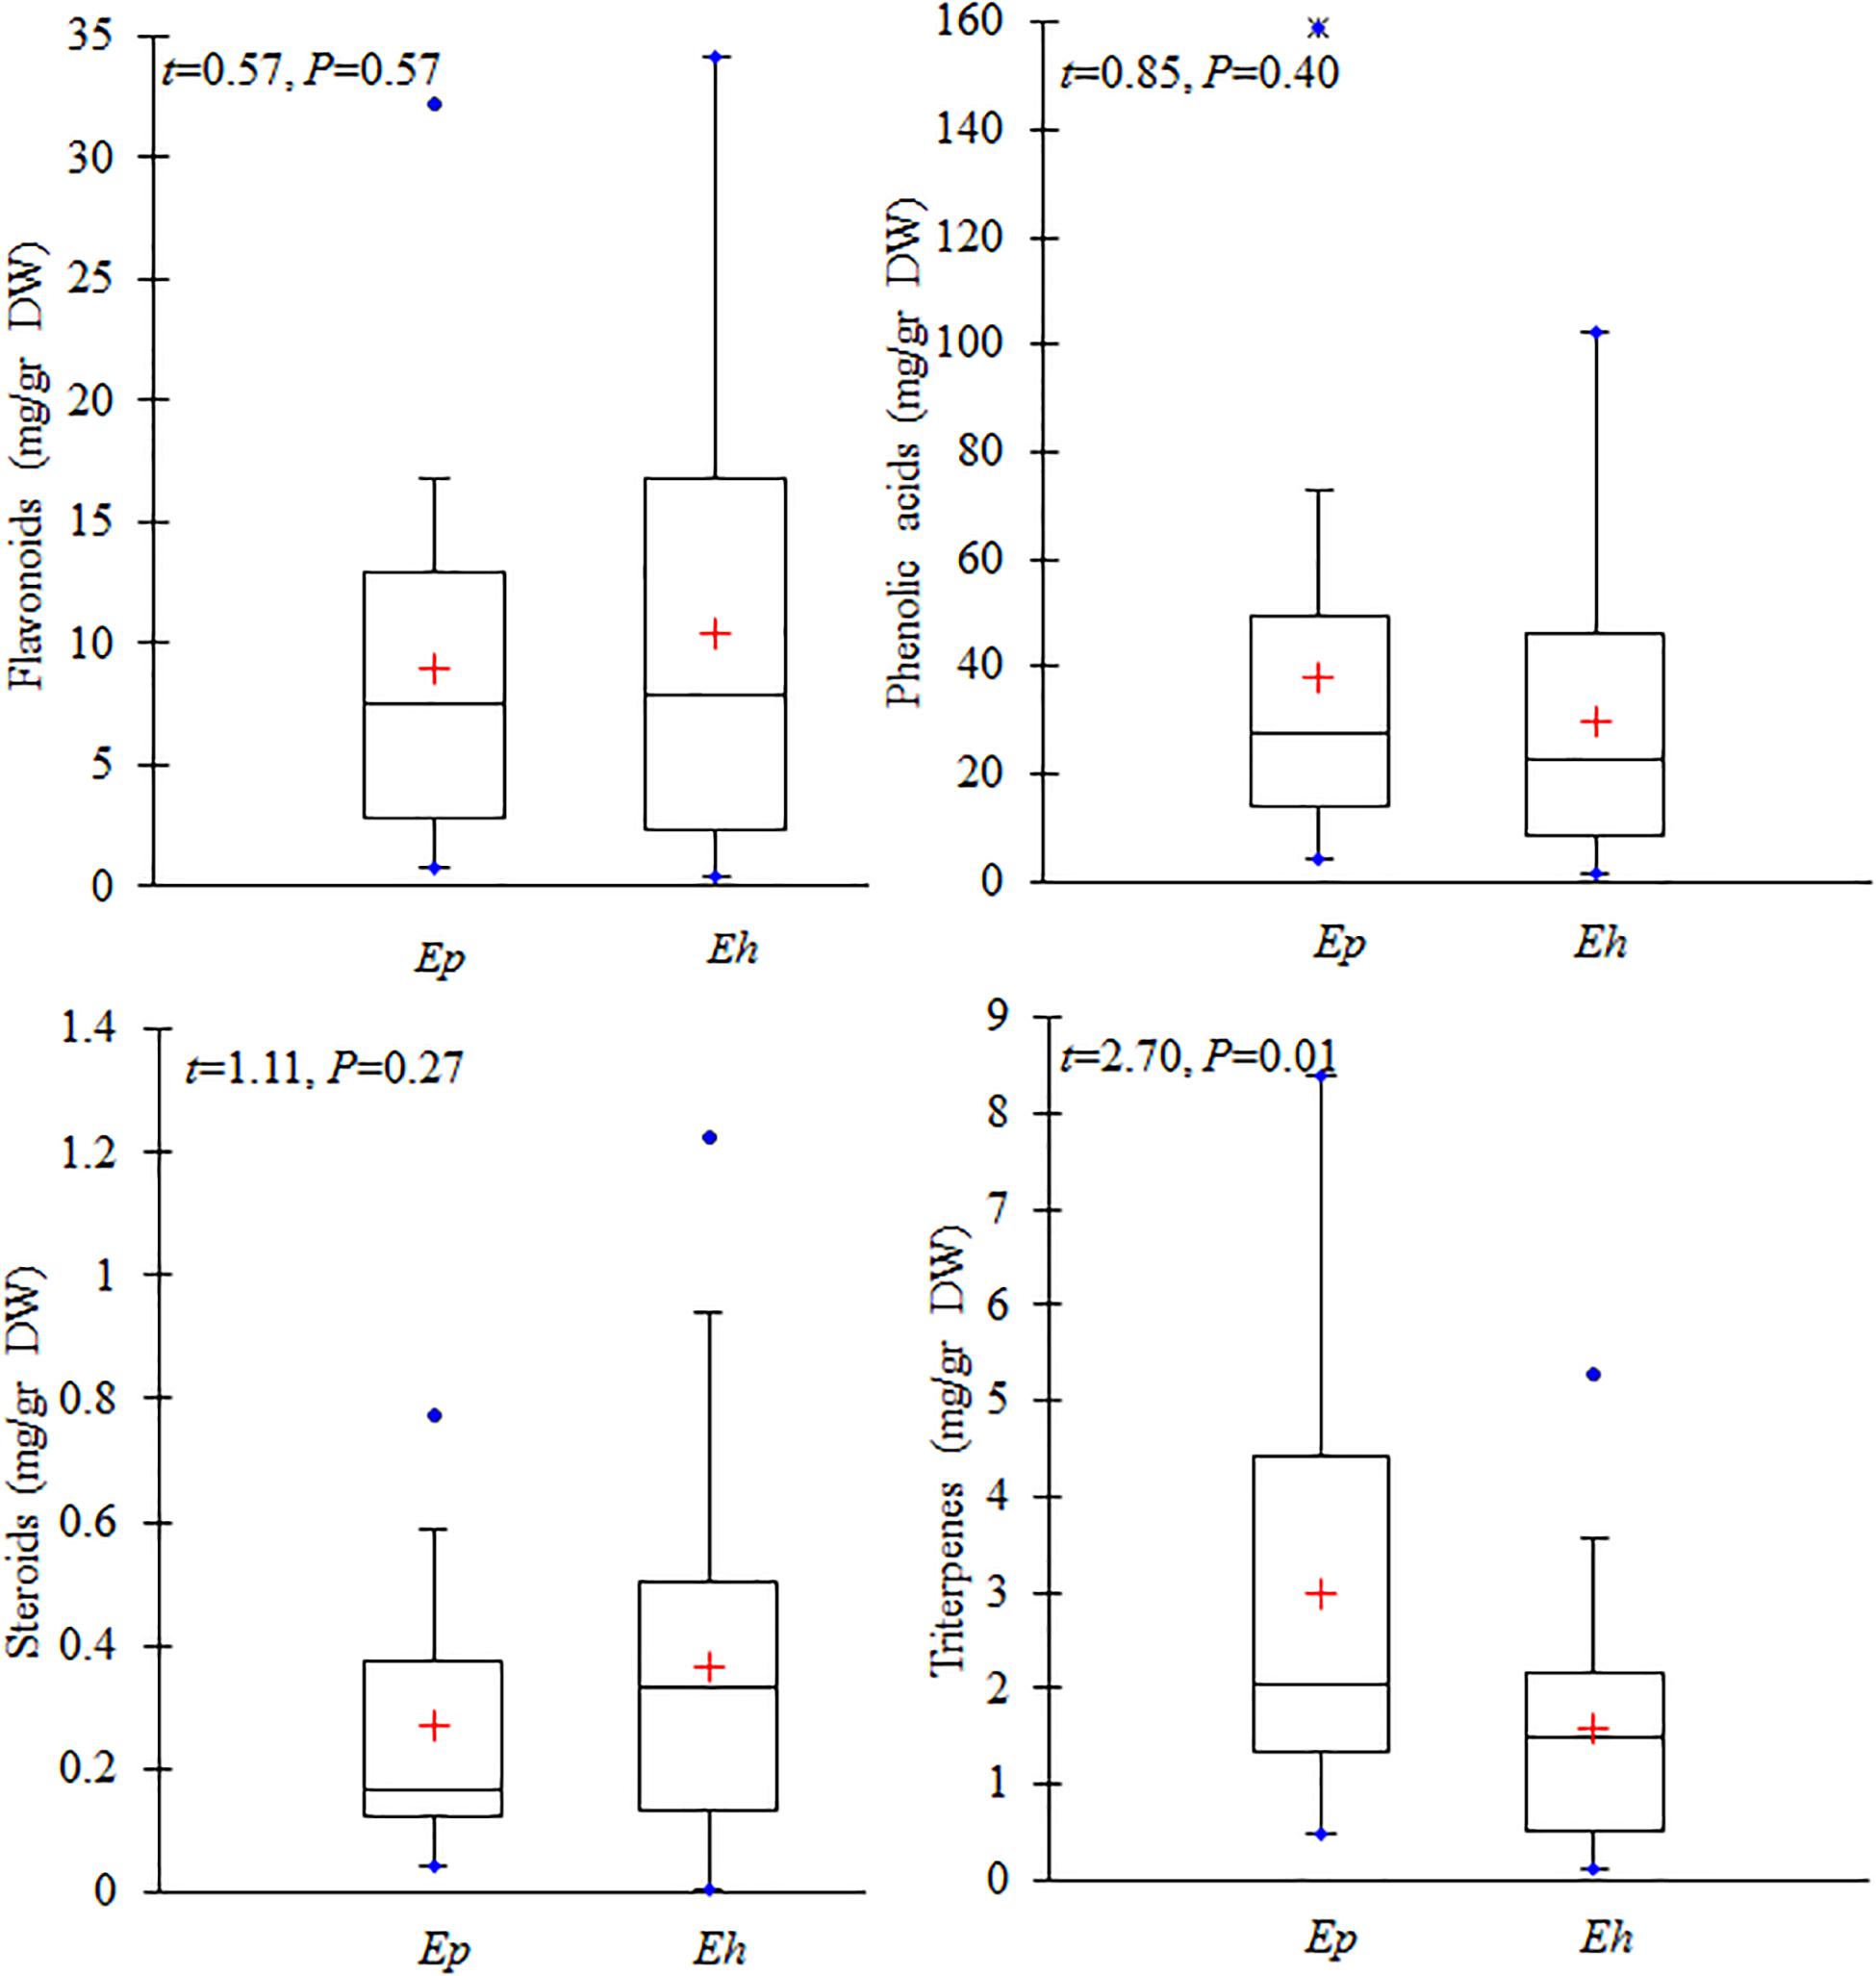
Figure 4. Contents of total flavonoids, phenolic acid and derivatives, steroids, and terpenes in E. hirsutum (Eh) and E. parviflorum (Ep) populations. The mean (+), 1st and 3rd quartiles (box), min and max values (blue dot) are shown (N = 31 and 16 for E. hirsutum and E. parviflorum, respectively).
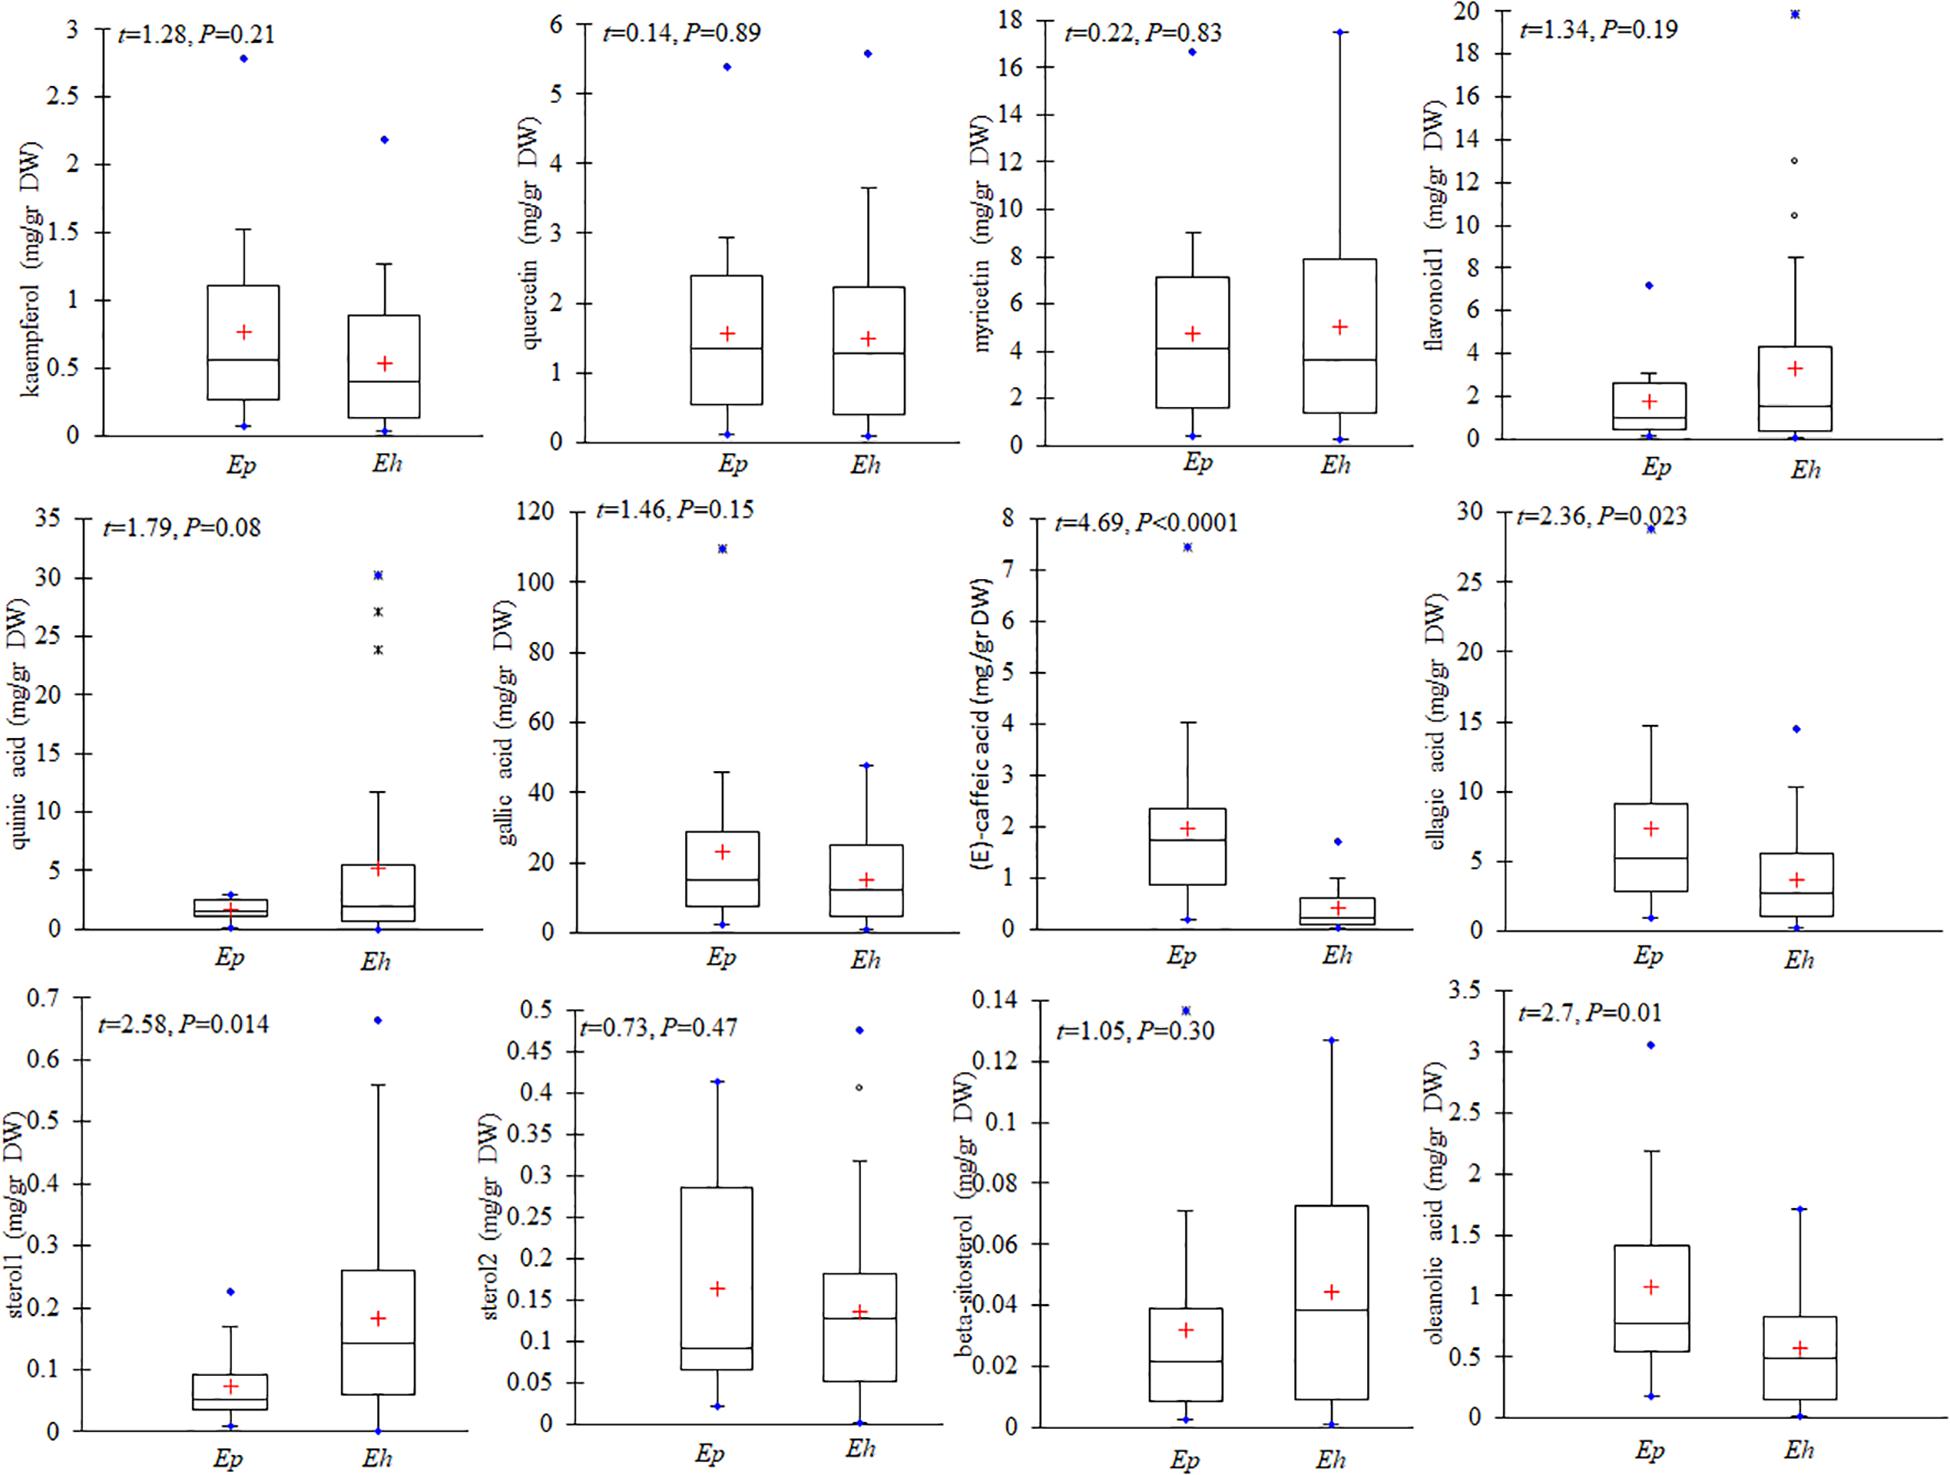
Figure 5. Contents of kaempferol, quercetin, myricetin, flavonoid 1, quinic acid, gallic acid, (E)-caffeic acid, sterol 1, sterol 2, beta sitosterol, and oleanolic acid in E. hirsutum (Eh) and E. parviflorum (Ep) populations. The mean (+), median, 1st and 3rd quartiles (box), and min and max values are shown (n = 31 and 16 for E. hirsutum and E. parviflorum, respectively).
The average total phenolic acid compounds in E. parviflorum populations (38.04 mg/g DW) was similar to contents detected in E. hirsutum (29.95 mg/g DW, t = 0.85, P = 0.4, Figure 4). Gallic acid showed the highest concentration among phenolic compounds and also among all other secondary metabolites with a mean value of 15.12 and 23.36 mg/g DW in E. hirsutum and E. parviflorum, respectively (t = 1.46, P = 0.15). The other major phenolic components found in E. hirsutum were quinic acid and ellagic acid with mean values of 5.20 and 3.71 mg/g DW, respectively (Table 2). Other major phenolic acid components in E. parviflorum were ellagic acid, (E)-caffeic acid and quinic acid with mean values of 7.31, 1.95, and 1.64 mg/g DW, respectively. The amount of quinic acid was similar between E. hirsutum and E. parviflorum populations (t = 1.79, P = 0.08), conversely ellagic acid (t = 2.36, P = 0.023) and (E)-caffeic acid (t = 4.69, P < 0.0001) were significantly greater in E. parviflorum than E. hirsutum populations (Figure 5).
The total amount of steroid compounds did not vary between E. hirsutum (0.36 mg/g DW) and E. parviflorum (0.27 mg/g DW, t = 1.11, P = 0.27, Figure 4). The putatively identified steroids compounds consisted of structurally annotated sterol 1, sterol 2 and β-cytosterol in both E. hirsutum and E. parviflorum. On average, the amount of sterol 1 was significantly higher in E. hirsutum compared with E. parviflorum with an average of 0.18 and 0.07 mg/g DW, respectively (t = 2.55, P = 0.014). β-sitosterol showed the lowest but similar amount in E. hirsutum and E. parviflorum, with an average of 0.04 and 0.03 mg/g DW, respectively (t = 1.05, P = 0.30, Table 2 and Figure 4).
The total amount of terpenes in E. parviflorum (2.98 mg/g DW) was significantly higher than that detected in E. hirsutum (1.58 mg/g DW) (t = 2.7, P = 0.01, Figure 4). The compounds putatively identified as terpenes consisted of a diterpene, (E)-phytol, and four triterpenes, including structurally annotated oleanolic acid deriv. 1, oleanolic acid deriv. 2, oleanolic acid, and ursolic acid (Table 2 and Supplementary Table 1). Oleanolic acid was the most abundant compound among triterpenes in both E. hirsutum and E. parviflorum with an average of 0.58 and 1.08 mg/g DW, respectively (t = 2.7, P = 0.01, Figure 5). The amount of (E)-phytol was higher in E. hirsutum (0.75 mg/g DW) as compared to that observed in E. parviflorum (0.41 mg/g DW, t = 2.30, t = 0.027).
Intraspecific Variation in E. hirsutum for Major Groups of Chemical Compounds
A survey of all flavonoids among E. hirsutum populations revealed that Alig population contained the highest level of myricetin, quercetin, and kaempferol with 17.5, 5.58, and 2.18 mg/g DW, respectively (Supplementary Table 1). Three populations, Rahi, Ziar, and Java, showed the lowest content (0.03 mg/g DW) of kaempferol and the lowest content of quercetin was also recorded for Java with an amount of 0.09 mg/g DW. The epicatechin showed the highest amount, 0.05 mg/g DW in Alia and Java populations and was found in negligible amount (<0.01 mg/g DW) in 10 E. hirsutum populations. Similarly, the highest amount of catechin was recorded for Alig (0.07 mg/g DW) and represented with negligible amount (<0.01 mg/g DW) in 11 (35%) populations. Overall, Alig among the other populations of E. hirsutum was rich in flavonoids (Supplementary Table 1).
The results showed that the lowest and highest amounts of total phenolic compounds was found in Java (1.19 mg/g DW, n = 26 compounds) and Alig (102.21 mg/g DW), respectively (Supplementary Table 1). The highest amount of gallic acid (47.80 mg/g DW) and ellagic acid (14.53 mg/g DW) was found in Alig population. Two populations Javah and Kali showed the lowest level of gallic acid and ellagic acid (0.91 and 0.22 mg/g DW respectively, Supplementary Table 1). The Silv population exhibited the highest content of quinic acid (30.29 mg/g DW), and interestingly the compound was not detected in Java.
The amounts of steroids and terpenes showed considerable variation among populations. For example, steroids were not found in Java and the highest amount of steroids was observed in Tang and (12.2 mg/g DW, Supplementary Table 1). The content of triterpenes varied from 0.03 mg/g DW (in Kali) to 2.90 mg/g DW (in Gham). The amount of oleanolic acid was remarkable in the Alig population (1.72 mg/g DW) compared to that observed in other populations of E. hirsutum (Supplementary Table 1). The amount of (E)-phytol considerably varied from 0.08 mg/g DW in Jira, Ziar, Kale, and Marg to 3.3 mg/g DW in Alig (Supplementary Table 1).
Intraspecific Variation in E. parviflorum for Major Chemical Compounds
Among E. parviflorum populations, the highest amount of all flavonoid compounds (32.21 mg/g DW) was observed in Aziz (Supplementary Table 2). Aziz showed the highest content for all four major flavonoid compounds including myricetin, flavonoid 1, quercetin, and kaempferol with 16.65, 7.15, 5.39, and 2.78 mg/g DW, respectively (Supplementary Table 2). The lowest content of main flavonoid compounds (<0.4 mg/g DW) was observed in Manb population. The amount of epicatechin ranged from <0.004 mg/g DW in Chah, Kali, Manb, and Shab to 0.28 mg/g DW in Sang. Similarly, the amount of another additionally detected flavonoid compound, catechin, observed for Alam and Aziz was 0.02 mg/g DW. This compound was found in negligible amounts in several other populations.
Similarly, Aziz population revealed the highest content of the three main phenolic acid compounds including gallic acid, ellagic acid, and (E)-caffeic acid, with 109.55, 28.83, and 7.47 mg/g DW, respectively. The lowest and highest total phenolic compounds among populations of E. parviflorum, was found for Manb (4.16 mg/g DW) and Aziz (159.07 mg/g DW), respectively (Supplementary Table 1). The lowest and the highest amount of quinic acid was observed in Kali (0.49 mg/g DW) and Alia (2.99) populations, respectively (Supplementary Table 1).
The lowest and the highest amoun ts of steroids were observed in Manb (0.04 mg/g DW) and Aziz (0.78 mg/g DW) (Supplementary Table 1). Similarly, the lowest and highest amount of triterpenes were observed in Manb (0.38 mg/g DW) and Aziz (7.55 mg/g DW) populations, respectively. In addition, the amount of a diterpene, (E)-phytol, varied from 0.09 (mg/g DW) to 0.84 in Manb and Aziz, respectively (Supplementary Table 1).
Contribution of Environmental Variables on Phytochemical Variation
The results of redundancy combined with variance partitioning analyses exhibited that altitude (adjusted R2 = 0.17, P = 0.001) significantly contributed to the total variation found in the level of secondary metabolites compared to that estimated for climate in E. hirsutum (adjusted R2 = 0.16, P = 0.22). In addition, the regression analyses showed that out of 46 secondary metabolites, 34 compounds (74%) showed significant correlation with the altitude in E. hirsutum (P < 0.05, Table 2). Most of the compounds with a significant correlation, were grouped in flavonoids group (n = 6), phenolic acids group (n = 21), steroids (n = 3), terpenes (n = 3). In contrast the redundancy and variance partitioning analyses revealed negligible contribution of both altitude and climatic variable (P > 0.05), and none of the compounds revealed a significant correlation with altitude in E. parviflorum (P > 0.05, Table 2). In addition, the relationship between altitude and four major groups including flavonoids, phenolic acids, steroids, and terpenes were tested separately. Interestingly all pairwise correlations between altitude and these groups were strongly significant in E. hirsutum (r = 0.48–0.53, P < 0.01, Figure 6).
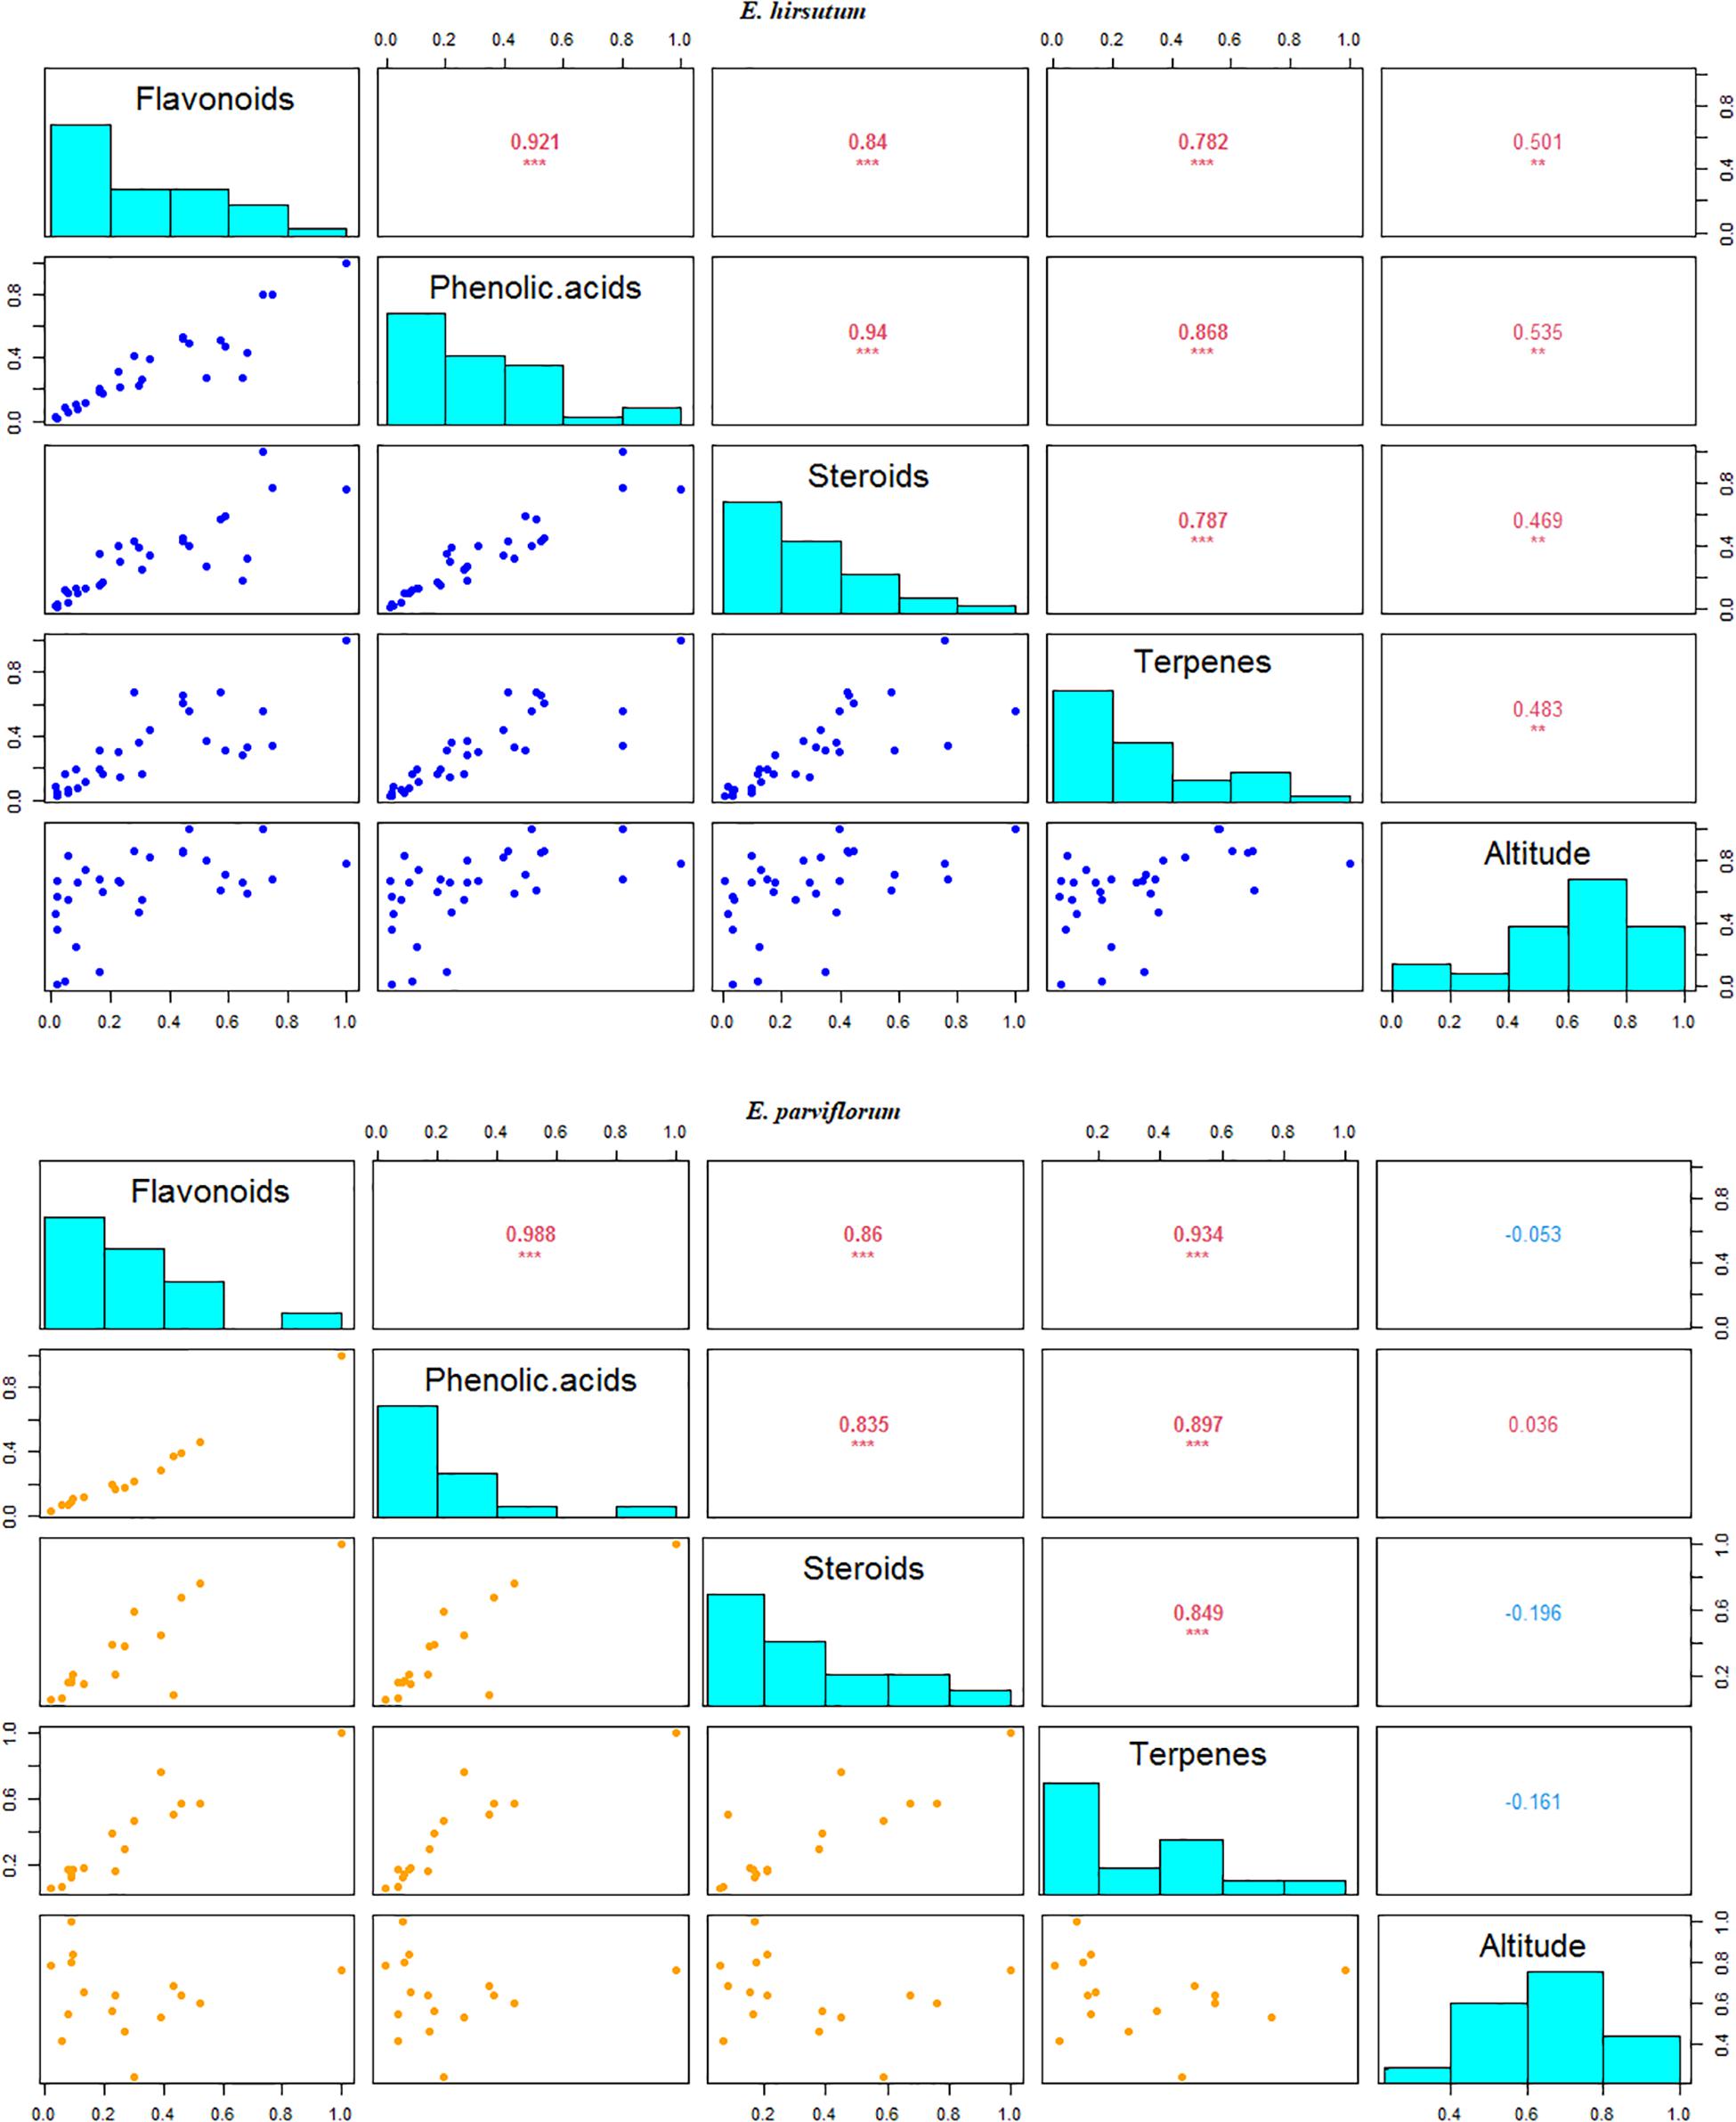
Figure 6. Correlation between the major groups of secondary metabolites and altitude in E. hirsutum and E. parviflorum. The numbers in upper diagonal represent correlation coefficient; levels of significance at **0.01 and ***0.001.
Discussion
Natural Variation in the Level of Chemical Compounds
Based on GC/MS analysis and either putative identification or structure annotation, the major compounds in E. hirsutum and E. parviflorum populations were flavonoids, phenolic acids, steroids, and terpenes. Several studies have also shown that species in Epilobium genus are a rich source of secondary metabolites especially polyphenols including flavonoids, phenolic acids, and tannins (e.g., Granica et al., 2014). Some other lipophilic metabolites such as steroids, triterpenoids, and fatty acids have also been detected in various Epilobium species (Granica et al., 2014). In our study, myricetin was dominant and constituted the major component of flavonoid group in E. hirsutum and E. parviflorum populations. Similar studies have reported the occurrence of myricetin as a dominant flavonoid in several Epilobium species including E. hirsutum, E. dodonaei, E. fleischeri, E. roseum, E. parviflorum, E. montanum, and E. tetragonum whereas quercetin glycosides were a dominant flavonoid in E. angustifolium (Slacanin et al., 1991; Ducrey et al., 1995; Hiermann, 1995; Hevesi Tóth et al., 2006; Granica et al., 2014). In this study, the order of the most abundant flavonoids was similar (myricetin > flavonoid 1 > quercetin > kaempferol) in both E. hirsutum and E. parviflorum. In a similar study, myricetin, quercetin, kaempferol, and their various glycosides were dominant in E. parviflorum (Hevesi Tóth et al., 2009).
The similar level of total flavonoids in E. hirsutum and E. parviflorum in our study is consistent with the results obtained by a photometric method exhibiting no significant difference between five Epilobium species (varies from 7.3 to 8.3 mg/g herb among E. parviflorum Schreb., E. roseum Schreb., E. tetragonum L., E. montanum L., E. angustifolium L.) from Hungary (Hevesi Tóth, 2009). Although the average flavonoid content observed for our study species was slightly higher than that reported in Hevesi Tóth (2009), some populations of E. hirsutum (Alig, 34 mg/g DW) and E. parviflorum (Aziz 32 mg/g DW) showed three times higher concentrations compared with those observed in species from Hungary.
Gallic acid showed the highest amount among all phenolic compounds with 35 and 46% of all secondary metabolites detected in both E. hirsutum and E. parviflorum, respectively. Although there was no significant difference in the total level of phenolic compounds, quinic acid, and gallic acid between species, the level of ellagic acid and (E)-caffeic acid was significantly different between species. Contrary to our study, the level of polyphenols was two times higher in E. hirsutum compared to that reported in E. parviflorum in a population from Estonia (Remmel et al., 2012). However, similar to our results, the level of gallic acid was similar between species and the amount of ellagic acid was significantly higher in E. parviflorum than that in E. hirsutum (Remmel et al., 2012). Ellagic acid is a marker compound indicating the presence of ellagitannins consistent with earlier reports in five species of Epilobium including the most popular E. angustifolium, E. hirsutum, and E. parviflorum (Slacanin et al., 1991; Barakat et al., 1997; Nawwar et al., 1997; Kiss et al., 2004; Hevesi Tóth et al., 2006; Shikov et al., 2006; Stolarczyk et al., 2013; Granica et al., 2014; Monschein et al., 2015). Thus, our results suggest that E. parviflorum populations might also contain higher contents of ellagitannins compared to E. hirsutum populations due to high amounts of ellagic acid. The antioxidant capacity of plant extracts of Epilobium has generally been associated with high levels of phenolic compounds (Katalinic et al., 2006; Wojdyło et al., 2007; Hevesi Tóth et al., 2009). Thus, our results indicate that Alig (E. hirsutum) and Aziz (E. parviflorum) populations might also exhibit the highest antioxidant capacity because of rich phenolic compounds compared with other populations.
Additionally Detected Compounds and Medicinal Prospects
In this study, the large-scale geographic investigations on the natural populations from both species provide opportunity for the putative identification of additionally detected chemical compounds not previously reported including catechin, epicatechin, terpenes, allantoin, and steroids. Two flavonoid compounds including catechin and epicatechin were detected in low level in most populations of E. hirsutum and E. parviflorum and are reported in this study for the first time. All other putatively identified flavonoid compounds except catechin and epicatechin have also been reported in most species of Epilobium (Granica et al., 2014). Although the total mean values of terpenes in E. parviflorum was significantly higher than E. hirsutum, triterpenoid acids have only been detected in the aerial part of E. angustifolium and are not reported from other Epilobium species (e.g., Glen et al., 1967; Granica et al., 2014). Therefore, the result of our study is interesting because of the detection and semiquantification of terpenes (diterpenes and triterpenes) in Iranian populations of E. hirsutum and E. parviflorum.
Several steroid compounds including cholesterol, campesterol, stigmasterol, β-sitosterol, and its glycosides and esters have been reported in E. angustifolium, E. parviflorum, and E. obscurum, which are not found in other species of Epilobium (Haddock et al., 1982; Hiermann and Mayr, 1985; Nowak and Krzaczek, 1998; Granica et al., 2014). In our study, the presence of β-sitosterol in E. hirsutum populations is reported for the first time. Considering the high yield of shoot biomass, a higher level of metabolites is expected in E. hirsutum compared with E. parviflorum (Constantin et al., 2013).
Allantoin has not been reported in any studies on Epilobium species, and it is detected in most populations of E. hirsutum and E. parviflorum, in our study. Allantoin has several beneficial effects as an active ingredient in cosmetics including its protective effect on the skin and moisturizing and keratolytic effects, promoting cell proliferation and wound healing, as well as anti-irritant and skin-protecting effects through the formation of complexes with sensitizing and stimulating agents (Araújo et al., 2010). According to the reports, a soft lotion with 5% allantoin improves recovery of inflammation and the wound-healing process, and quantitative analysis supports the idea that allantoin promotes proliferation of fibroblasts and synthesis of extracellular matrix (Araújo et al., 2010). Similarly, treatment of itching in mild-to-moderate atopic dermatitis is also reported with a topical steroid drug containing allantoin (Veraldi et al., 2009). In addition, allantoin is often used in toothpaste, mouthwash, and other oral hygiene products in shampoos, lipsticks, anti-acne products, sun care products, clarifying and cleansing lotions, various makeup lotions and creams, and other cosmetic and pharmaceutical products (Thornfeldt, 2005). One of the reasons that Epilobium is effective in the treatment of skin and mucosa diseases as well as bodily injuries might be due to the presence of allantoin. On the other hand, the leaf and flower extract of the plant is effective for many skin problems such as eczema, acne, skin rashes, minor burns, and ulcers. North American Indians have used Epilobium species to treat infected wounds, hemorrhages after parturition, and swelling (Smith, 1923; Barrett and Gifford, 1933; Bocek, 1984; Granica et al., 2014). Thus, due to its high shoot biomass and easier seed and clonal propagation especially for E. hirsutum, this plant can be used as a putative natural source to extract several compounds including catechin, epicatechin, and allantoin.
Inter- and Intraspecific Variability and Environmental Clines
Although almost all compounds were found in both species in reasonable amounts, our study revealed extensive natural variation among species and within each species (high variation in CV for various compounds). Our results showed that the level of chemical compounds are correlated between species, suggesting similarity in metabolic pathways between species (Wink, 2003). In addition, the results also show that several compounds within each species are tightly correlated together, indicating a common genetic basis including genes with pleiotropic effect affecting multiple traits simultaneously.
Although climatic factors have been major drivers of genetic differentiation among populations for various species (Castilla et al., 2020; Gibson and Moyle, 2020), bioclimatic variables exhibit less profound effect on the level of chemical variation in our study. However, altitude is found to be a major environmental factor affecting the level of secondary metabolites by explaining 17% of total variation found in E. hirsutum. Accordingly, the results showed a significant relationship between the amount of chemicals in two-thirds of secondary metabolites and altitude in E. hirsutum. One reason to explain the negligible effect of altitude on secondary metabolites in E. parviflorum compared with E. hirsutum may be due to a narrower altitudinal range in 641–2,670 m a.s.l. in the former relative to a wider geographic range surveyed for the latter species (14.6–2600 m a.s.l.). In a similar study, the concentration of quercetin and flavanol was correlated with altitude in E. angustifolium (Monschein et al., 2015). It has also been suggested that plants respond to cooler temperature and other environmental stimuli including UV radiation by increasing production of flavonoids (Jaakola and Hohtola, 2010). Congruent to our results obtained from E. hirsutum, the correlation between altitude and phenolic and terpenoid compounds has also been reported in other studies (e.g., Martz et al. (2009). Hence, the observed altitudinal effects on the level of flavonoids, phenolic acid, steroids, terpenes, and allantoin suggest that the production of these compounds as potential markers can significantly be manipulated in E. hirsutum populations. In addition, these results suggest that other environmental variables correlated with altitude including temperature and UV-B are likely to influence the amount of chemical compounds. Moreover, to determine the specific factors affecting the chemical compounds, further laboratory investigations are required.
Conclusion
This research is the first study that applies a comparative approach by including multiple populations from two congeneric species to evaluate intra- and interpopulation phytochemical variation for E. hirsutum and E. parviflorum. The wide geographic sampling revealed additionally detected compounds such as catechin, epicatechin, terpenes, and allantoin in both species and steroids in E. hirsutum which have not been reported previously. While the level of secondary metabolites was correlated between species suggesting similarity in metabolic pathways in congeneric species, each compound exhibited a considerable variation among populations with species. In addition, we found that the populations of two species were differentiated in few compounds including oleanolic acid deriv. 1, ursolic acid, and (E)-caffeic acid as demonstrated based on correlation with the second principal component of PCA splitting most congeneric populations from each other. The effect of climate based on 19 bioclimatic variables to explain the total variation was not significant in both species. However, altitude exhibited a significant contribution on total chemical variation, and the four major groups of secondary metabolites were also significantly correlated with altitude in E. hirsutum. We also found significant positive correlation between altitude and most of the individual compounds from flavonoids, phenolic acids, steroids, and terpenes mainly in E. hirsutum. These results suggest that other biotic or abiotic factors that are dependent on altitude might affect the production of specialized metabolites, thus further experiments can elaborate these factors in more details.
Data Availability Statement
Metabolomics raw data have been deposited to the GNPS database (Global Natural Products Social Molecular Networking, Wang et al. (2016)) with the identifier: MassIVE MSV000086585. The complete dataset can be accessed here - doi: 10.25345/C5Z19Z.
Author Contributions
MMB designed and planned the study. MMB, MF-A, and JR conducted the field sampling, laboratory, and data analyses. MMB wrote the manuscript and all co-authors contributed to the revision. All authors contributed to the article and approved the submitted version.
Funding
This work was supported by a grant from the Iran National Science Foundation (INSF) with project no. 92034833.
Conflict of Interest
The authors declare that the research was conducted in the absence of any commercial or financial relationships that could be construed as a potential conflict of interest.
Acknowledgments
We thank the Department of Biology, Norwegian University of Science and Technology (NTNU) for providing resources for laboratory analyses. We also thank the constructive comments and inputs by the reviewers on the earlier version of the manuscript.
Supplementary Material
The Supplementary Material for this article can be found online at: https://www.frontiersin.org/articles/10.3389/fpls.2020.595190/full#supplementary-material
Supplementary Figure 1 | The two-dimensional plot obtained from all 74 compounds detected in the extracts of Epilobium hirsutum and E. parviflorum. The first two principal components explained 67% of all variation found in the chemical compounds.
Supplementary Table 1 | Chemical composition (mg/g DW) of 31 and 16 natural populations of Epilobium hirsutum and E. parviflorum, respectively.
Supplementary Table 2 | Bioclimatic variables extracted from WorldClim 2 databases for natural populations of Epilobium hirsutum and E. parviflorum.
References
Akbari, R. S., and Azizian, D. (2006). Seed morphology and seed coat sculpturing of Epilobium L. species (Onagraceae Juss.) from Iran. Turk. J. Bot. 30, 435–440.
Araújo, L. U., Grabe-Guimarães, A., Mosqueira, V. C. F., Carneiro, C. M., and Silva-Barcellos, N. M. (2010). Profile of wound healing process induced by allantoin. Acta Cir. Bras. 25, 460–461. doi: 10.1590/s0102-86502010000500014
Averett, J. E., Raven, P. H., and Becker, H. (1979). The flavonoids of Onagraceae: tribe Epilobieae. Am. J. Bot. 66, 1151–1155. doi: 10.1002/j.1537-2197.1979.tb06334.x
Barakat, H. H., Hussein, S. A., Marzouk, M. S., Merfort, I., Linscheid, M., and Nawwar, M. A. (1997). Polyphenolic metabolites of Epilobium hirsutum. Phytochemistry 46, 935–941. doi: 10.1016/s0031-9422(97)00370-1
Barrett, S. A., and Gifford, E. W. (1933). Indian Life of the Yosemite Region: Miwok Material Culture. Bulletin ofthe Public Museum: Milwaukee 2:174.
Bazylko, A., Kiss, A., and Kowalski, J. (2007a). Densitometric determination of flavonoids in methanolic and aqueous extracts of Epilobii angustifolii herba by use of HPTLC. JPC–J. Planar Chromat. 20, 53–56. doi: 10.1556/jpc.20.2007.1.8
Bazylko, A., Kiss, A. K., and Kowalski, J. Z. (2007b). High-performance thin-layer chromatography method for quantitative determination of oenothein B and quercetin glucuronide in aqueous extract of Epilobii angustifolii herba. J. Chromatogr. 1173, 146–150. doi: 10.1016/j.chroma.2007.10.019
Bocek, B. R. (1984). Ethnobotany of Costanoan Indians, California, based on collections by John P. Harrington. Econ. Bot. 38, 240–255. doi: 10.1007/bf02858839
Castilla, A. R., Méndez-Vigo, B., Marcer, A., Martínez-Minaya, J., Conesa, D., Picó, F. X., et al. (2020). Ecological, genetic and evolutionary drivers of regional genetic differentiation in Arabidopsis thaliana. BMC Evol. Biol. 20:71.
Constantin, D., Coste, A., and Mircea, T. (2013). “Epilobium Sp.(willow herb): micropropagation and production of secondary metabolites,” in Biotechnology for Medicinal Plants, eds S. Chandra, H. Lata, and A. Varma (Berlin: Springer), 149–170. doi: 10.1007/978-3-642-29974-2_6
Demasi, S., Caser, M., Lonati, M., Cioni, P. L., Pistelli, L., Najar, B., et al. (2018). Latitude and altitude influence secondary metabolite production in peripheral apine populations of the Mediterranean species Lavandula angustifolia Mill. Front. Plant Sci. 9:983.
Ducrey, B., Marston, A., Göhring, S., Hartmann, R., and Hostettmann, K. (1997). Inhibition of 5 alpha-reductase and aromatase by the ellagitannins oenothein A and oenothein B from Epilobium species. Planta Med. 63, 111–114. doi: 10.1055/s-2006-957624
Ducrey, B., Wolfender, J. L., Marston, A., and Hostettmann, K. (1995). Analysis of flavonol glycosides of thirteen Epilobium species (onagraceae) by LC-UV and thermospray LC-MS. Phytochemistry 38, 129–137. doi: 10.1016/0031-9422(94)00629-8
Falahati-Anbaran, M., Mohammadi Bazargani, M., and Rohloff, J. (2018). Large scale geographical mapping of essential oil volatiles in Heracleum (Apiaceae): identification of novel compounds and unraveling cryptic variation. Chem. Biodivers. 15:e1800230. doi: 10.1002/cbdv.201800230
Fick, S. E., and Hijmans, R. J. (2017). WorldClim 2: new 1-km spatial resolution climate surfaces for global land areas. Int. J. Climatol. 37, 4302–4315. doi: 10.1002/joc.5086
Gibson, M. J. S., and Moyle, L. C. (2020). Regional differences in the abiotic environment contribute to genomic divergence within a wild tomato species. Mol. Ecol. 29, 2204–2217. doi: 10.1111/mec.15477
Glen, A. T., Lawrie, W., Mclean, J., and Younes, M. E.-G. (1967). Triterpenoid constituents of rose-bay willow-herb. J. Chem. Soc. C Org. 1967, 510–515. doi: 10.1039/j39670000510
Gouvea, D. R., Gobbo-Neto, L., and Lopes, N. P. (2012). “The influence of biotic and abiotic factors on the production of secondary metabolites in medicinal plants,” in Plant Bioactives and Drug Discovery, eds B. Wang and V. Cechinel-Filho (Hoboken, NJ: John Wiley & Sons, Inc) 419–452. doi: 10.1002/9781118260005.ch12
Granica, S., Piwowarski, J. P., Czerwińska, M. E., and Kiss, A. K. (2014). Phytochemistry, pharmacology and traditional uses of different Epilobium species (Onagraceae): a review. J. Ethnopharmacol. 156, 316–346. doi: 10.1016/j.jep.2014.08.036
Haddock, E. A., Gupta, R. K., Al-Shafi, S. M., Haslam, E., and Magnolato, D. (1982). The metabolism of gallic acid and hexahydroxydiphenic acid in plants. part 1. introduction. naturally occurring galloyl esters. J. Chem. Soc. Perkin Trans. 1, 2515–2524. doi: 10.1039/p19820002515
Hevesi Tóth, B. (2009). Phytochemical and in Vitro Biological Evaluation of Potentially Active Compounds in Epilobium Species. Ph.D. dissertation, Semmelweis University, Budapest.
Hevesi Tóth, B., Balázs, A., Vukics, V., and Szõke, É, and Kéry, Á (2006). Identification of Epilobium species and willow-herbs (Onagraceae) by HPLC analysis of flavonoids as chemotaxonomic markers. Chroma 63, S119–S123.
Hevesi Tóth, B., Blazics, B., and Kéry, Á (2009). Polyphenol composition and antioxidant capacity of Epilobium species. J. Pharm. Biomed. Anal. 49, 26–31. doi: 10.1016/j.jpba.2008.09.047
Hiermann, A. (1983). Die Untersuchung potentieller Wirkstoffe in Epilobium-Arten. 1. Mitteilung: Aufklärung der Flavonoidmuster. Sci. Pharm. 51, 158–167.
Hiermann, A. (1995). Phytochemical characterization of Epilobium angustifolium L. and its differentiation to other Epilobium species by TLC and HPLC. Sci. Pharm. 63, 135–135.
Hiermann, A., and Mayr, K. (1985). The investigation of active compounds from Epilobium species. The occurrence of sitosterol derivatives in Epilobium angustifolium L. and Epilobium parviflorum Schreb. Sci. Pharm. 53, 39–44.
Hijmans, R. J., and Etten, J. V. (2020). Raster: Geographic Analysis and Modeling with Raster Data. R Package Version 2.0-12.
Jaakola, L., and Hohtola, A. (2010). Effect of latitude on flavonoid biosynthesis in plants. Plant Cell Environ. 33, 1239–1247.
Katalinic, V., Milos, M., Kulisic, T., and Jukic, M. (2006). Screening of 70 medicinal plant extracts for antioxidant capacity and total phenols. Food Chem. 94, 550–557. doi: 10.1016/j.foodchem.2004.12.004
Kiss, A., Kowalski, J., and Melzig, M. F. (2004). Compounds from Epilobium angustifolium inhibit the specific metallopeptidases ACE. NEP and APN. Planta Med. 70, 919–923. doi: 10.1055/s-2004-832617
Lesuisse, D., Berjonneau, J., Ciot, C., Devaux, P., Doucet, B., Gourvest, J., et al. (1996). Determination of oenothein B as the active 5-α-reductase-inhibiting principle of the folk medicine Epilobium parviflorum. J. Nat. Prod. 59, 490–492. doi: 10.1021/np960231c
Li, Y., Kong, D., Fu, Y., Sussman, M. R., and Wu, H. (2020). The effect of developmental and environmental factors on secondary metabolites in medicinal plants. Plant Physiol. Biochem. 148, 80–89. doi: 10.1016/j.plaphy.2020.01.006
Lisec, J., Schauer, N., Kopka, J., Willmitzer, L., and Fernie, A. R. (2006). Gas chromatography mass spectrometry–based metabolite profiling in plants. Nat. Protoc. 1, 387–396. doi: 10.1038/nprot.2006.59
Martz, F., Peltola, R., Fontanay, S., Duval, R. E., Julkunen-Tiitto, R., and Stark, S. (2009). Effect of latitude and altitude on the terpenoid and soluble phenolic composition of juniper (Juniperus communis) needles and evaluation of their antibacterial activity in the boreal zone. J. Agric. Food Chem. 57, 9575–9584. doi: 10.1021/jf902423k
Monschein, M., Jaindl, K., Buzimkić, S., and Bucar, F. (2015). Content of phenolic compounds in wild populations of Epilobium angustifolium growing at different altitudes. Pharm. Biol. 53, 1576–1582. doi: 10.3109/13880209.2014.993039
Moore, B. D., Andrew, R. L., Külheim, C., and Foley, W. J. (2014). Explaining intraspecific diversity in plant secondary metabolites in an ecological context. New Phytol. 201, 733–750. doi: 10.1111/nph.12526
Nawwar, M., Marzouk, M., Nigge, W., and Linscheid, M. (1997). High-performance liquid chromatographic/electrospray ionization mass spectrometric screening for polyphenolic compounds of Epilobium hirsutum—the structure of the unique ellagitannin Epilobamide-A. J. Mass Spectrom. 32, 645–654. doi: 10.1002/(sici)1096-9888(199706)32:6<645::aid-jms518>3.0.co;2-p
Nowak, R., and Krzaczek, T. (1998). Sterole w zielu Epilobium angustifolium L. Herba Polonica 4, 297–299.
Oksanen, J., Blanchet, F. G., Friendly, M., Kindt, R., Legendre, P., Mcglinn, D., et al. (2019). Vegan: Community Ecology Package. R Package Version 2.5-6.
Pelc, M., Kosakowska, O., Weglarz, Z., Przybyl, J., and Geszprych, A. (2005). Sterols and fatty acids in the seeds of evening primrose (Oenothera sp.) and willow herb (Epilobium sp.). Herba Polonica 51, 21–25.
Remmel, I., Vares, L., Toom, L., Matto, V., and Raal, A. (2012). Phenolic compounds in five Epilobium species collected from Estonia. Nat. Prod. Commun. 7, 1323–1324.
Rohloff, J. (2015). Analysis of phenolic and cyclic compounds in plants using derivatization techniques in combination with GC-MS-based metabolite profiling. Molecules 20, 3431–3462. doi: 10.3390/molecules20023431
Sampaio, B. L., Edrada-Ebel, R., and Da Costa, F. B. (2016). Effect of the environment on the secondary metabolic profile of Tithonia diversifolia: a model for environmental metabolomics of plants. Sci. Rep. 6:29265.
Shikov, A. N., Poltanov, E. A., Dorman, H. J. D., Makarov, V. G., Tikhonov, V. P., and Hiltunen, R. (2006). Chemical composition and in vitro antioxidant evaluation of commercial water-soluble willow herb (Epilobium angustifolium L.) extracts. J. Agric. Food Chem. 54, 3617–3624. doi: 10.1021/jf052606i
Shikov, A. N., Pozharitskaya, O. N., Ivanova, S. A., Makarov, V. G., Tikhonov, V. P., and Galambosi, B. (2010). Improved and validated HPTLC method for quantification of oenothein B and its use for analysis of Epilobium angustifolium L. JPC–J. Planar Chromat. 23, 70–74. doi: 10.1556/jpc.23.2010.1.12
Slacanin, I., Marston, A., Hostettmann, K., Delabays, N., and Darbellay, C. (1991). Isolation and determination of flavonol glycosides from Epilobium species. J. Chromatogr. 557, 391–398. doi: 10.1016/s0021-9673(01)87147-8
Smith, H. H. (1923). Ethnobotany of the Menomini Indians. Bulletin of the Public Museum: Milwaukee 4:40.
Sõukand, R., Mattalia, G., Kolosova, V., Stryamets, N., Prakofjewa, J., Belichenko, O., et al. (2020). Inventing a herbal tradition: the complex roots of the current popularity of Epilobium angustifolium in Eastern Europe. J. Ethnopharmacol. 247:112254. doi: 10.1016/j.jep.2019.112254
Stolarczyk, M., Naruszewicz, M., and Kiss, A. K. (2013). Extracts from Epilobium sp. herbs induce apoptosis in human hormone-dependent prostate cancer cells by activating the mitochondrial pathway. J. Pharm. Pharmacol. 65, 1044–1054. doi: 10.1111/jphp.12063
Thornfeldt, C. (2005). Cosmeceuticals containing herbs: fact, fiction, and future. Dermatol. Surg. 31, 873–881. doi: 10.1111/j.1524-4725.2005.31734
Tissier, A., Ziegler, J., and Vogt, T. (2014). “Specialized plant metabolites: diversity and biosynthesis,” in Ecological Biochemistry: Environmental and Interspecies Interactions, eds G. J. Krauss and D. H. Nies (Wiley-VCH Verlag GmbH & Co. KGaA: Weinheim), 14–37. doi: 10.1002/9783527686063.ch2
Veraldi, S., De, P. M., Schianchi, R., and Lunardon, L. (2009). Treatment of pruritus in mild-to-moderate atopic dermatitis with a topical non-steroidal agent. J. Drugs Dermatol. 8, 537–539.
Vogl, S., Picker, P., Mihaly-Bison, J., Fakhrudin, N., Atanasov, A. G., Heiss, E. H., et al. (2013). Ethnopharmacological in vitro studies on Austria’s folk medicine—an unexplored lore in vitro anti-inflammatory activities of 71 Austrian traditional herbal drugs. J. Ethnopharmacol. 149, 750–771. doi: 10.1016/j.jep.2013.06.007
Wang, M., Carver, J. J., Phelan, V. V., Sanchez, L. M., Garg, N., Peng, Y., et al. (2016). Sharing and community curation of mass spectrometry data with global natural products social molecular networking. Nat. Biotechnol. 34, 828–837.
Wink, M. (2003). Evolution of secondary metabolites from an ecological and molecular phylogenetic perspective. Phytochemistry 64, 3–19. doi: 10.1016/s0031-9422(03)00300-5
Wojdyło, A., Oszmiański, J., and Czemerys, R. (2007). Antioxidant activity and phenolic compounds in 32 selected herbs. Food Chem. 105, 940–949. doi: 10.1016/j.foodchem.2007.04.038
Keywords: bioclimatic variables, E. hirsutum, E. parviflorum, flavonoid, GC/MS, secondary metabolites, terpenes, steroids
Citation: Mohammadi Bazargani M, Falahati-Anbaran M and Rohloff J (2021) Comparative Analyses of Phytochemical Variation Within and Between Congeneric Species of Willow Herb, Epilobium hirsutum and E. parviflorum: Contribution of Environmental Factors. Front. Plant Sci. 11:595190. doi: 10.3389/fpls.2020.595190
Received: 15 August 2020; Accepted: 24 December 2020;
Published: 17 February 2021.
Edited by:
Supaart Sirikantaramas, Chulalongkorn University, ThailandReviewed by:
Ericsson Coy-Barrera, Universidad Militar Nueva Granada, ColombiaNishikant Wase, University of Virginia, United States
Copyright © 2021 Mohammadi Bazargani, Falahati-Anbaran and Rohloff. This is an open-access article distributed under the terms of the Creative Commons Attribution License (CC BY). The use, distribution or reproduction in other forums is permitted, provided the original author(s) and the copyright owner(s) are credited and that the original publication in this journal is cited, in accordance with accepted academic practice. No use, distribution or reproduction is permitted which does not comply with these terms.
*Correspondence: Mitra Mohammadi Bazargani, bazargani@irost.ir; mitra_cb@yahoo.com; Jens Rohloff, jens.rohloff@ntnu.no
†Present address: Jens Rohloff, Research Section, Faculty of Social and Educational Sciences, Norwegian University of Science and Technology, Trondheim, Norway