Corrigendum: Activation of CO2 assimilation during photosynthetic induction is slower in C4 than in C3 photosynthesis in three phylogenetically controlled experiments
 Lucía Arce Cubas1
 Richard L. Vath1
 Emmanuel L. Bernardo1,2
 Cristina Rodrigues Gabriel Sales1Angela C. Burnett1
 Johannes Kromdijk1*
- 1The University of Cambridge, Department of Plant Sciences, Cambridge, United Kingdom
- 2University of the Philippines Los Baños, Institute of Crop Science, College of Agriculture and Food Science, College, Laguna, Philippines
Introduction: Despite their importance for the global carbon cycle and crop production, species with C4 photosynthesis are still somewhat understudied relative to C3 species. Although the benefits of the C4 carbon concentrating mechanism are readily observable under optimal steady state conditions, it is less clear how the presence of C4 affects activation of CO2 assimilation during photosynthetic induction.
Methods: In this study we aimed to characterise differences between C4 and C3 photosynthetic induction responses by analysing steady state photosynthesis and photosynthetic induction in three phylogenetically linked pairs of C3 and C4 species from Alloteropsis, Flaveria, and Cleome genera. Experiments were conducted both at 21% and 2% O2 to evaluate the role of photorespiration during photosynthetic induction.
Results: Our results confirm C4 species have slower activation of CO2 assimilation during photosynthetic induction than C3 species, but the apparent mechanism behind these differences varied between genera. Incomplete suppression of photorespiration was found to impact photosynthetic induction significantly in C4 Flaveria bidentis, whereas in the Cleome and Alloteropsis C4 species, delayed activation of the C3 cycle appeared to limit induction and a potentially supporting role for photorespiration was also identified.
Discussion: The sheer variation in photosynthetic induction responses observed in our limited sample of species highlights the importance of controlling for evolutionary distance when comparing C3 and C4 photosynthetic pathways.
Introduction
Photosynthesis is the foundation of life on earth, the source of food, oxygen, and most of our energy. A particularly successful adaptation to the ancestral form is C4 photosynthesis, which despite its complexity has independently arisen in at least 66 lineages of angiosperms and appeared in 19 unrelated plant families (Sage, 2004; Kellogg, 2013). Although only 3% of flowering species use the C4 pathway, C4 species represent 23% of global carbon fixation (Still et al., 2003), and maize and sugar cane are two of the four crops that account for half of the world’s crop production (FAO, 2020). Despite the undeniable importance of C4 species, there is comparatively less focus on improving C4 performance – photosynthetic induction has consistently been flagged as a source of inefficiency in C4 species relative to C3 ones (Sage and McKown, 2006; Slattery et al., 2018; Sales et al., 2021), yet a lack of knowledge on the specifics of the C4 induction response persists due to limited understanding of variation in photosynthetic induction between C3 and C4 photosynthesis, as well as across different C4 species.
Most C4 species display ‘Kranz’ anatomy, in which mesophyll (M) and bundle sheath (BS) cells are arranged concentrically around the leaf veins. Unlike in C3 species, where initial CO2 fixation and assimilation processes occur within the same cell, in C4 species these activities are typically partitioned between M and BS cells. In the cytosol of M cells, equilibrium between CO2 and bicarbonate is rapidly established by carbonic anhydrase. Bicarbonate is then fixed by phosphoenolpyruvate carboxylase (PEPC) into 4-carbon molecules that are further reduced before diffusing into the BS, where they are decarboxylated to release CO2 around ribulose 1,5-biphosphate carboxylase/oxygenase (Rubisco), the central enzyme in carbon fixation (Leegood, 2002). The C4 carbon concentrating mechanism (CCM) thus enhances photosynthesis and suppresses Rubisco’s oxygenase activity and resulting photorespiration – the phospho-glycolate salvaging pathway that consumes energy and reducing equivalents, and releases CO2. However, the operation of the CCM has an energetic cost, and C4 species require additional ATP for PEP regeneration on top of the energetic demands of the C3 cycle (Yin and Struik, 2018).
The increased efficiency of the C4 pathway relative to the C3 ancestral state is especially apparent under constant high light (Wang et al., 2012). However, during changes in light intensity, some C4 species display impaired carbon assimilation in comparison to C3 species (Kubásek et al., 2013; Slattery et al., 2018; Li et al., 2021). Decreases in photosynthetic efficiency during light induction (in response to an increase in light intensity) occur irrespective of photosynthetic pathway and are often explained by lags in regeneration of ribulose-1,5-biphosphate (RuBP) within the C3 cycle, Rubisco activation, and stomatal opening (Pearcy and Seemann, 1990; Pearcy, 1990; Sassenrath-Cole and Pearcy, 1992; Mott and Woodrow, 2000). In addition, C4 photosynthesis requires synchronous operation of C3 and C4 cycles and any loss of coordination during induction could lead to reduced efficiency of carbon fixation in C4 species. Faster activation of the CCM relative to C3 cycle activation in the BS may result in diffusional leakage of highly concentrated CO2 out of the permeable BS back into M cells and a raised energetic cost for CO2 assimilation, as recently suggested by Wang et al. (2022) and Lee et al. (2022). A 30-60% increase in BS leakiness of CO2 during photosynthetic induction relative to steady state photosynthesis has been identified in maize and sorghum (Wang et al., 2022). This suggests that the C3 cycle in some C4 species is slower to activate than the C4 CCM. Alternatively, the C4 cycle could be the limiting factor during induction due to the need to build up metabolite gradients for the shuttling of CCM intermediates between M and BS cells. If so, the reduced supply of CO2 to the BS would lead to weaker suppression of photorespiration, and a temporary disconnect between photosynthetic electron transport and CO2 fixation (Sage and McKown, 2006; Kromdijk et al., 2010; Slattery et al., 2018). Although incomplete suppression of photorespiration can reduce photosynthetic efficiency, photorespiratory metabolite pools have also been suggested to help prime the C4 cycle (Kromdijk et al., 2014; Stitt and Zhu, 2014; Schlüter and Weber, 2020; Medeiros et al., 2022). Higher relative photorespiratory rates appear to occur under low light and during photosynthetic induction (Kromdijk et al., 2010; Medeiros et al., 2022); the resulting photorespiratory intermediates could act as a carbon reservoir from which to build C3 and C4 metabolite pools (Fu and Walker, 2022). The presence of an endogenous source of carbon is supported by the inability to account for the net increase in C3 and C4 cycle intermediates during light induction based on rates of CO2 assimilation alone (Leegood and Furbank, 1984; Usuda, 1985).
Whilst the experimental evidence and putative mechanisms detailed above may indeed suggest that C4 species could be more affected by transient decreases in photosynthetic efficiency during induction relative to steady state than C3 species, most of the work does not directly compare C3 and C4 species in a common experiment, but instead often focuses on a single species, such as maize (Zelitch et al., 2009; Kromdijk et al., 2010; Medeiros et al., 2022). Some direct comparisons between C3 and C4 photosynthesis have been made in sets of contrasting grass species (Lee et al., 2022) and species within the same genus (Kubásek et al., 2013), but so far the only C3 and C4 species studied that share a relatively recent common ancestor are Flaveria (Li et al., 2021). Phylogenetic distance can strongly confound the apparent photosynthetic differences observed (Taylor et al., 2010) and to confirm whether observed differences are due to photosynthetic pathway or evolutionary variation, studies conducted on phylogenetically linked C3 and C4 species are necessary. Furthermore, despite striking similarities in the anatomy and biochemistry of C4 species from diverse evolutionary origins, there is still great diversity amongst species. Some common variations are the main decarboxylases utilised to release CO2 in BS cells: nicotinamide adenine dinucleotide-malic enzyme (NAD-ME), nicotinamide adenine dinucleotide phosphate-malic enzyme (NADP-ME), and phosphoenolpyruvate carboxykinase (PEPCK). Although C4 subtypes had initially been defined by these main decarboxylases (Hatch et al., 1975), more recent work suggests there is a greater degree of nuance than traditional C4 classifications connote, as NADP-ME and NAD-ME often operate alongside a PEPCK auxiliary pathway, and the energetic requirements of C4 photosynthesis render a pure PEPCK subtype unlikely (Wang et al., 2014a). Variations across C4 species and phylogenetic distance are thus important considerations when trying to derive generic differences between C3 and C4 photosynthesis.
In this study we analysed steady state photosynthesis and photosynthetic induction in three phylogenetically linked pairs of C3 and C4 species from Alloteropsis, Flaveria, and Cleome genera, representative of monocots and dicots, and all three C4 decarboxylation enzymes. Photosynthetic gas exchange was measured in response to a step-change to moderate and strongly saturating light intensities to characterise differences in photosynthetic induction rates. Experiments were conducted at both 21% and 2% O2 concentration to evaluate the role of photorespiration during induction. Activation of CO2 assimilation at the start of light induction was slower in all C4 species compared to their C3 counterparts although the mechanism of impairment varied across genera. Furthermore, although both C3 and C4 Flaveria had greater CO2 assimilation under 2% O2, assimilation in C3 and C4 Alloteropsis species as well as C3 T. hassleriana was negatively impacted by low O2. The variation in responses highlights the natural diversity of C4 species, and the importance of controlling for phylogenetic distance in comparisons between C3 and C4 photosynthesis.
Materials and methods
Plant materials
Three pairs of phylogenetically linked Alloteropsis, Flaveria and Cleome C3 and C4 species were selected to decrease evolutionary variation within each pair (see Figure 1) (Lyu et al., 2015) but maintain significant evolutionary distance between the three genera, as C4 origins arose ~ 17 million years ago (Ma) in Cleome, ~ 2 Ma in Flaveria, and even earlier in Alloteropsis (Christin et al., 2011; Lundgren et al., 2015). The selected species include monocots (C3 Alloteropsis semialata subspecies semialata accession GMT and C4 Alloteropsis semialata subspecies eckloniana accession MDG), dicots (C3 Flaveria cronquistii, C4 Flaveria bidentis, C3 Tarenaya hassleriana and C4 Gynandropsis gynandra), and the three major decarboxylase enzymes of the C4 pathway, which have been suggested to be dominant in different C4 species: PEPCK in mixed NADP-ME-PEPCK pathway in A. semialata MDG (Ueno and Sentoku, 2006), NADP-ME in F. bidentis (Gowik et al., 2011), and NAD-ME in G. gynandra (Bräutigam et al., 2010).
FIGURE 1
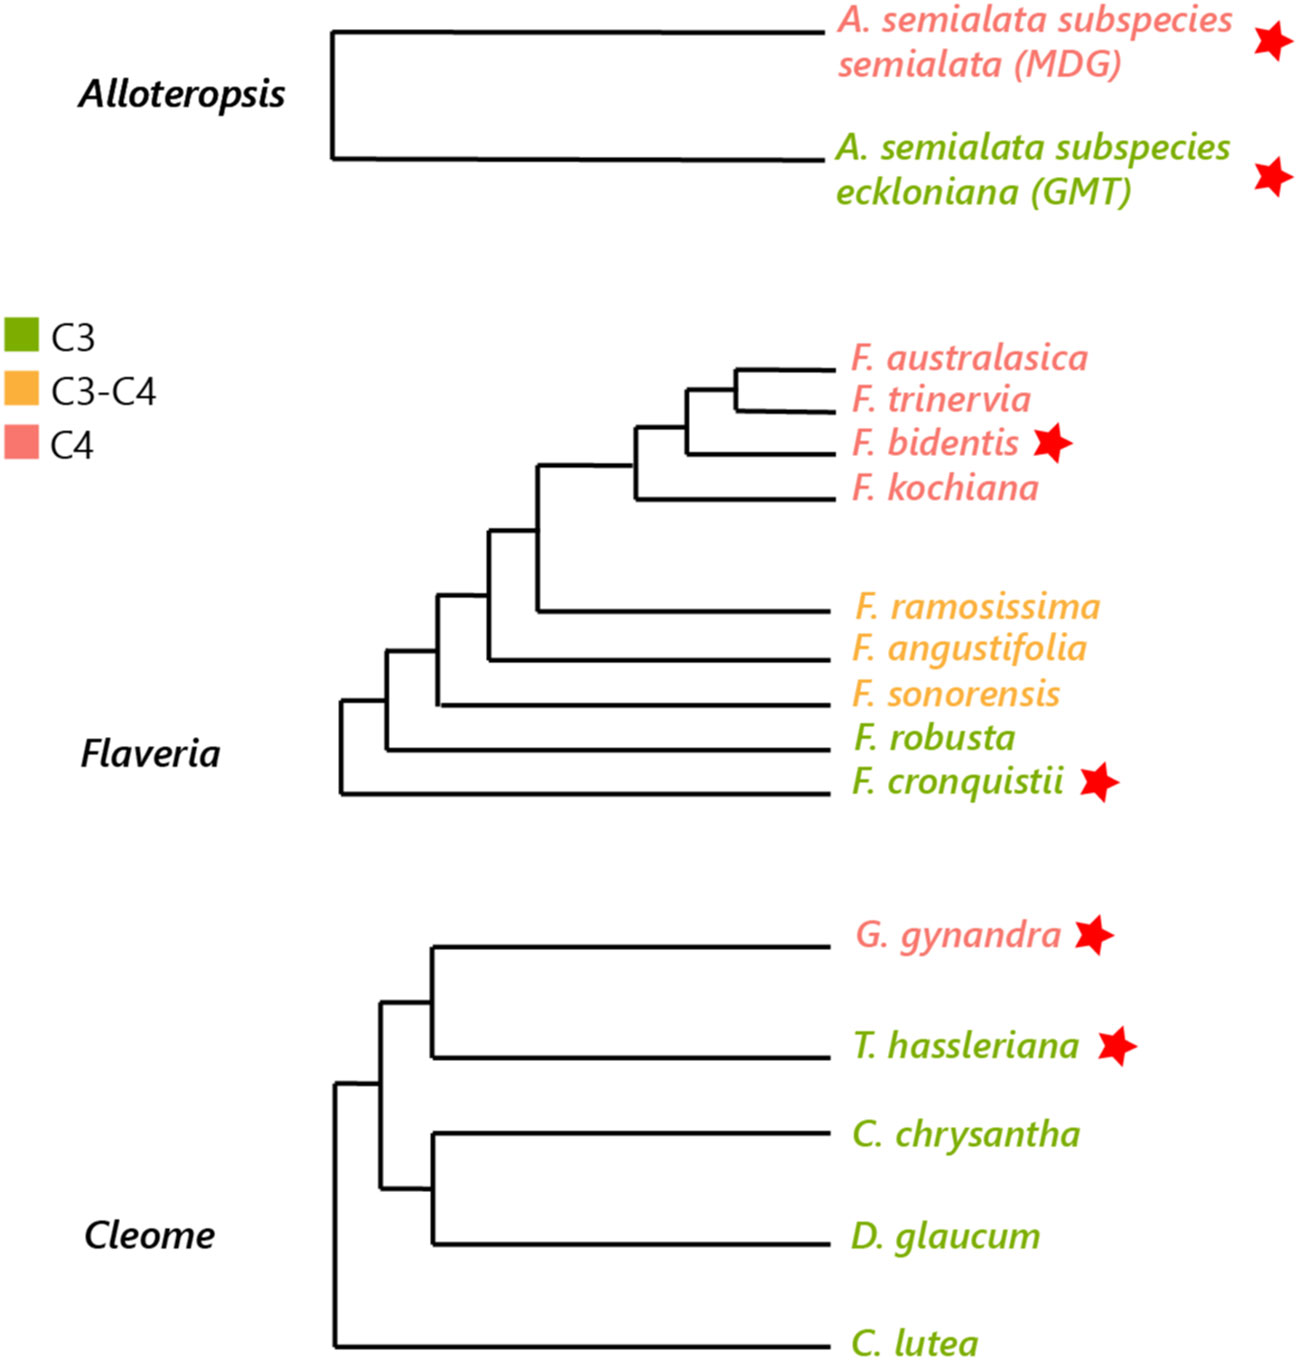
Figure 1 Phylogenetic tree of Alloteropsis, Flaveria and Cleome genera. Species used in the study are marked with a red star (adapted from Ibrahim et al., 2009; Lyu et al., 2015; Shi et al., 2021).
Plant growth and propagation
All plants were measured during the vegetative growth phase. Plants were grown in Levington Advance M3 compost (Scotts, Ipswich, UK) mixed with Miracle-Gro All Purpose Continuous Release Osmocote (Scotts Miracle-Gro Company, Marysville, OH, USA; 4 L compost: 25g Osmocote). Medium vermiculite was added to the Alloteropsis soil mix (4 L compost: 1 L vermiculite: 25g Osmocote) to prevent waterlogging.
The Alloteropsis GMT and MDG accessions were vegetatively propagated and grown on 2 L pots under well-watered conditions in a glasshouse at 18-25°C, 40-60% relative humidity (RH), with supplemental lightning provided to ensure at least 140-160 µmol m-2 s-1 photon flux density (PFD) across a 16-hour photoperiod. Plants were measured two weeks after propagation.
The Flaveria and Cleome species were grown under well-watered conditions in a Conviron growth room (Conviron Ltd., Winnipeg, MB, CA) at 20°C temperature, 60% RH, and 150 µmol m-2 s-1 PFD over a 16-hour photoperiod. Because F. cronquistii requires vegetative propagation, plants from both Flaveria species were propagated from lateral shoot cuttings – F. bidentis plants were initially grown from seed and then propagated. Cuttings were dipped in Doff Hormone Rooting Powder (Doff Portland Ltd., Hucknall, UK) to induce root development, and Flaveria cuttings were grown on 0.25 L pots and measured after 8-10 weeks.
Cleome germination was induced under sterile conditions at 30°C/20°C day/night cycle for T. hassleriana, and at 30°C for G. gynandra. Germinated seeds were initially sown in 24-cell seed trays before transfer to 0.25 L pots. As G. gynandra has a lower development rate than T. hassleriana, germination was staggered so both species could be measured at approximately the same developmental stage, after 8-10 weeks for G. gynandra and 4-6 weeks for T. hassleriana.
Gas exchange and chlorophyll fluorescence
Gas exchange and chlorophyll fluorescence were measured simultaneously using an open gas exchange system (LI-6400XT, LI-COR, Lincoln, NE, USA) with an integrated leaf chamber fluorometer (6400-40 LCF). Leaves were measured in a 2 cm2 chamber at 25°C block temperature, 410 ppm sample CO2 concentration, and 50-65% RH with flow of 300 µmol s-1. Average leaf VPD was 1.1 ± 0.1 kPa at the start and 1.35 ± 0.1 kPa at the end of the light treatment. Actinic light was provided by the LCF and composed of 10% blue (470 nm) and 90% red light (630 nm).
The LCF used a 0.25 Hz modulated measuring light and a multiphase flash (Loriaux et al., 2013) to measure steady (F’) and maximal (Fm’) fluorescence to derive the quantum yield of Photosystem II (ΦPSII) (Genty et al., 1989).
For experiments using 2% O2, a pre-mixed 2% O2 and 98% N2 gas mixture was supplied to the LI-6400XT through the air inlet, using a mass flow controller (EL-FLOW, Bronkhorst High-tech BV, Ruurlo, NL) and an open T-junction to regulate constant surplus flow. Infrared Gas Analyzer (IRGA) calibration was adjusted to the O2 gaseous composition in the instrument settings prior to measurement.
Leaf absorptance
Light absorptance of the plants used in experiments was measured with an integrating sphere (LI-1800-12, LI-COR) optically connected to a miniature spectrometer (Li-Cor, 1988). Incident PFD was converted to absorbed photon flux density (PFDabs) using the measured leaf absorptance of the emission wavelengths of the 6400-40 LCF light source. The specific absorptance values can be found in Supplementary Material 1.
Steady state light response curves
Steady state light response curves of photosynthetic gas exchange were measured for all species at both 21% and 2% O2. Leaves were light-adapted at 1000 µmol m-2 s-1 PFD and once CO2 assimilation and stomatal conductance reached steady state, gas exchange and chlorophyll fluorescence parameters were measured in a descending gradient of light intensity: 2000, 1700, 1500, 1200, 1000, 800, 600, 400, 300, 200, 100, 75, 30, and 0 µmol m-2 s-1 PFD. Gas exchange and chlorophyll fluorescence parameters were logged after 120 – 240 s, when leaf intracellular CO2 concentration (Ci) and CO2 assimilation were stable.
To analyse steady state responses, a non-rectangular hyperbola was fitted to the light response curves (Stinziano et al., 2021). The quantum yield of assimilation (α) was derived from the initial slope, and the light-saturated photosynthetic rate (Amax) from the asymptote of the curve. Ci values obtained above 600 µmol m-2 s-1 PFD were averaged to estimate light-saturated Ci (Ci max).
Approximate light intensities at the inflection point (600 µmol m-2 s-1 PFD) and in the saturating part of the response (1500 µmol m-2 s-1 PFD) were used in the light induction experiments. Respiration in the light (Rd) was estimated for all species at each O2 concentration as the y-intercept using a linear regression of the initial light response curve slope. To account for the Kok effect, measurements in darkness and at 30 µmol m-2 s-1 light intensity were not included in the regression (Kok, 1949).
Light induction experiments and analysis of lag in carbon assimilation
Leaves were dark-adapted until stomatal conductance reached constant levels (between 30-60 minutes depending on the species), illuminated with 600 µmol m-2 s-1 or 1500 µmol m-2 s-1 PFD for 1 hour, and then returned to darkness for another half hour. Starting from the last 5 minutes of initial dark adaption, gas exchange parameters were logged every minute, and chlorophyll fluorescence parameters at 5, 15, 25, 35, 45, and 60 minutes after starting light exposure. Light induction experiments at both light intensities were conducted at 21% and 2% O2. Carbon assimilation was corrected for respiration to determine net photosynthetic CO2 assimilation (ACO2) using the Rd obtained from light response curves.
To analyse photosynthetic responses across the induction period, the trapezoidal rule (Jawień, 2014) was used to integrate the area under the curve (AUC) (Makowski et al., 2019) of ACO2 during the 0 – 5, 5 – 10, and 10 – 60 minute phases of light exposure.
Alternative electron sinks
The electron cost of assimilation can be approximated by the ΦPSII/ΦCO2 ratio (Genty et al., 1989; Oberhuber and Edwards, 1993), with ΦCO2 being the quantum yield of CO2 assimilation (Equation 1). Lower ratios are associated with greater coupling as more electrons captured by PSII go towards CO2 assimilation (Krall and Edwards, 1990). For light response curves the ΦPSII/ΦCO2 ratio was calculated for the values obtained at 600 µmol m-2 s-1 PFD (600 ΦPSII/ΦCO2) and 1500 µmol m-2 s-1 PFD (1500 ΦPSII/ΦCO2). During light induction ΦPSII/ΦCO2 values were taken from across the light period at each intensity. Data points were excluded if calculated ΦCO2 showed negative values.
Statistical analysis
All statistical analyses were conducted separately on paired Alloteropsis, Flaveria, and Cleome light response curves, light induction at 600 µmol m-2 s-1 PFD, and light induction at 1500 µmol m-2 s-1 PFD. Mean and standard error of the mean of light response curve parameters (Amax, α, Ci max, 600 ΦPSII/ΦCO2 and 1500 ΦPSII/ΦCO2), ACO2 AUC at different phases of induction, and ΦPSII/ΦCO2 across light induction were calculated. Linear mixed models (LMMs) were fitted to the light response curve parameters and ACO2 AUC at different phases of induction using photosynthetic pathway, O2 concentration and their interaction as fixed effects; and to ΦPSII/ΦCO2 across light induction using photosynthetic pathway, O2 concentration, time, and their interactions as fixed effects. Time of day and measured plant were included as random effects in all models. Two and three-way ANOVA tables for the fixed effects were generated from the LMMs using the Satterthwaite’s approximation method (Kuznetsova et al., 2017). The data was independent and assumptions of normality, homogeneity of variance and sphericity were satisfied.
All data analysis and plot generation was done on RStudio 1.3 (RStudio Team, 2022) with R 4.1.1 (R Core Team, 2021) using the tidyverse (Wickham et al., 2019), RColorBrewer (Neuwirth, 2014), lme4 (Bates et al., 2015), lmerTest (Kuznetsova et al., 2017) and bayestestR libraries (Makowski et al., 2019).
Results
Steady state measurements confirm canonical differences in CO2 assimilation between C3 and C4 species
Light response curves were used to first characterise C3 and C4 responses under steady state at 21% (Figures 2A-C, 3A-C and Table 1). The responses of C4 species in comparison to their C3 phylogenetic pairs were genus specific – C4 F. bidentis had higher maximum rates of net carbon assimilation (Amax) than C3 F. cronquistii (P = 0.03; C3 12.5 ± 1.3 vs C4 16.7 ± 1.0 µmol m-2 s-1), but Amax values in C4 G. gynandra were similar to those found in C3 T. hassleriana (P = 0.24; C3 15.5 ± 2.0 vs C4 16.7 ± 0.7 µmol m-2 s-1), and Amax values in C4 A. semialata MDG also were similar to C3 A. semialata GMT (P = 0.02; C3 11.8 ± 1.1 vs C4 10.2 ± 2.7 µmol m-2 s-1). A two-way ANOVA (Table 2) showed photosynthetic pathway had a significant effect on Ci during light saturation in all genera. However, whilst the C4 pathway was associated with lower Ci max in Flaveria (P ≤ 0.001; C3 238 ± 19 vs C4 86 ± 27 µmol mol-1) and Cleome (P ≤ 0.001; C3 310 ± 8 vs C4 125 ± 27 µmol mol-1), in Alloteropsis the C4 association was instead with higher Ci max (P ≤ 0.01; C3 242 ± 9 vs C4 285 ± 21 µmol mol-1). Figure 2C shows that the lower Ci of C4 species corresponded to lower stomatal conductance, excepting C4 A. semialata MDG, where stomatal conductance to water vapour (gsw) was similar to C3 A. semialata GMT across the light response.
FIGURE 2
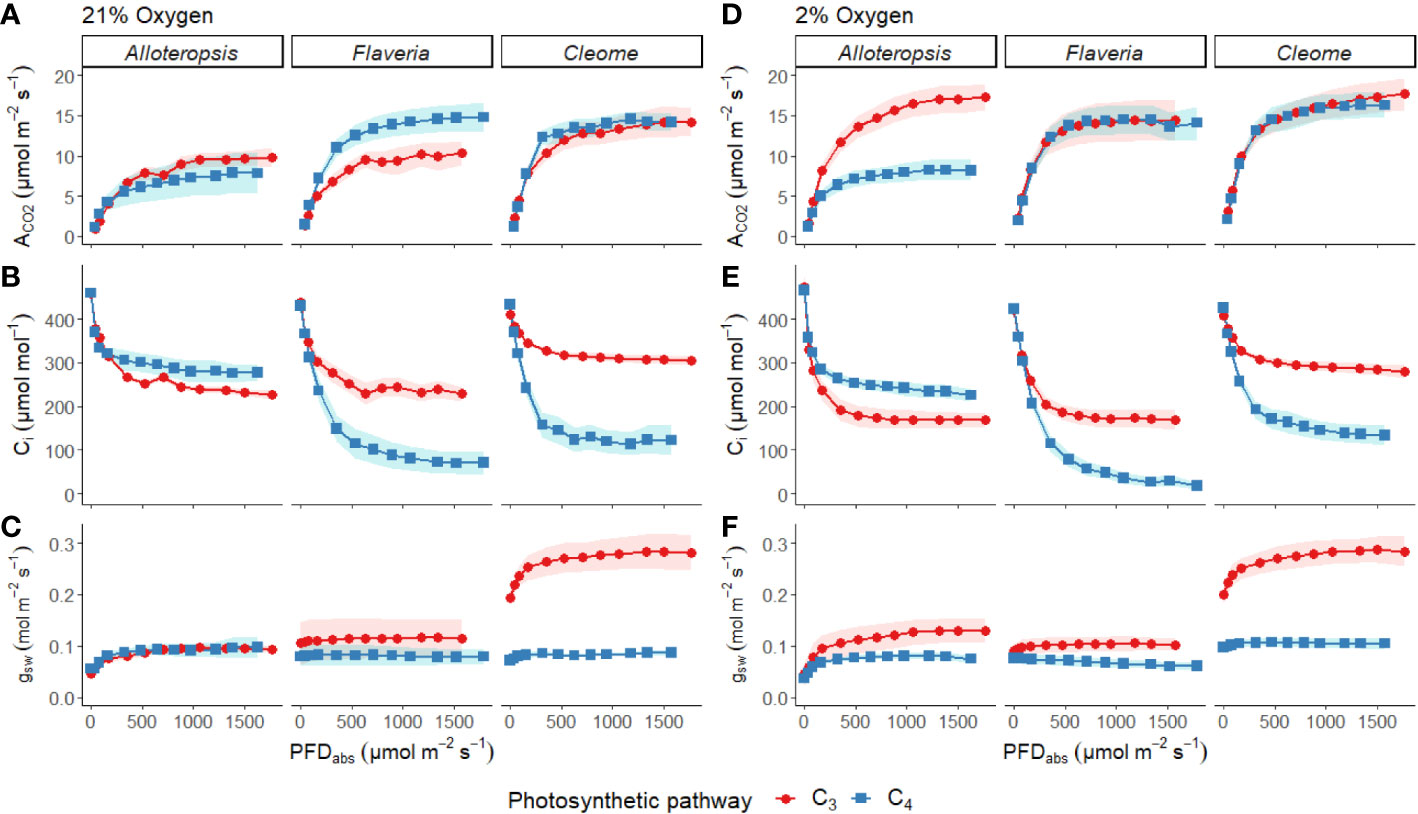
Figure 2 Measurements of gas exchange traits during light response curves for phylogenetically linked C3 and C4 Alloteropsis, Flaveria and Cleome species under 21% and 2% O2. Plots show net CO2 assimilation (ACO2, A, D), intercellular CO2 concentration (Ci, B, E), and stomatal conductance to water vapour (gsw, C, F) as a function of absorbed light intensity. Ribbons represent standard error of the mean (n=5).
FIGURE 3
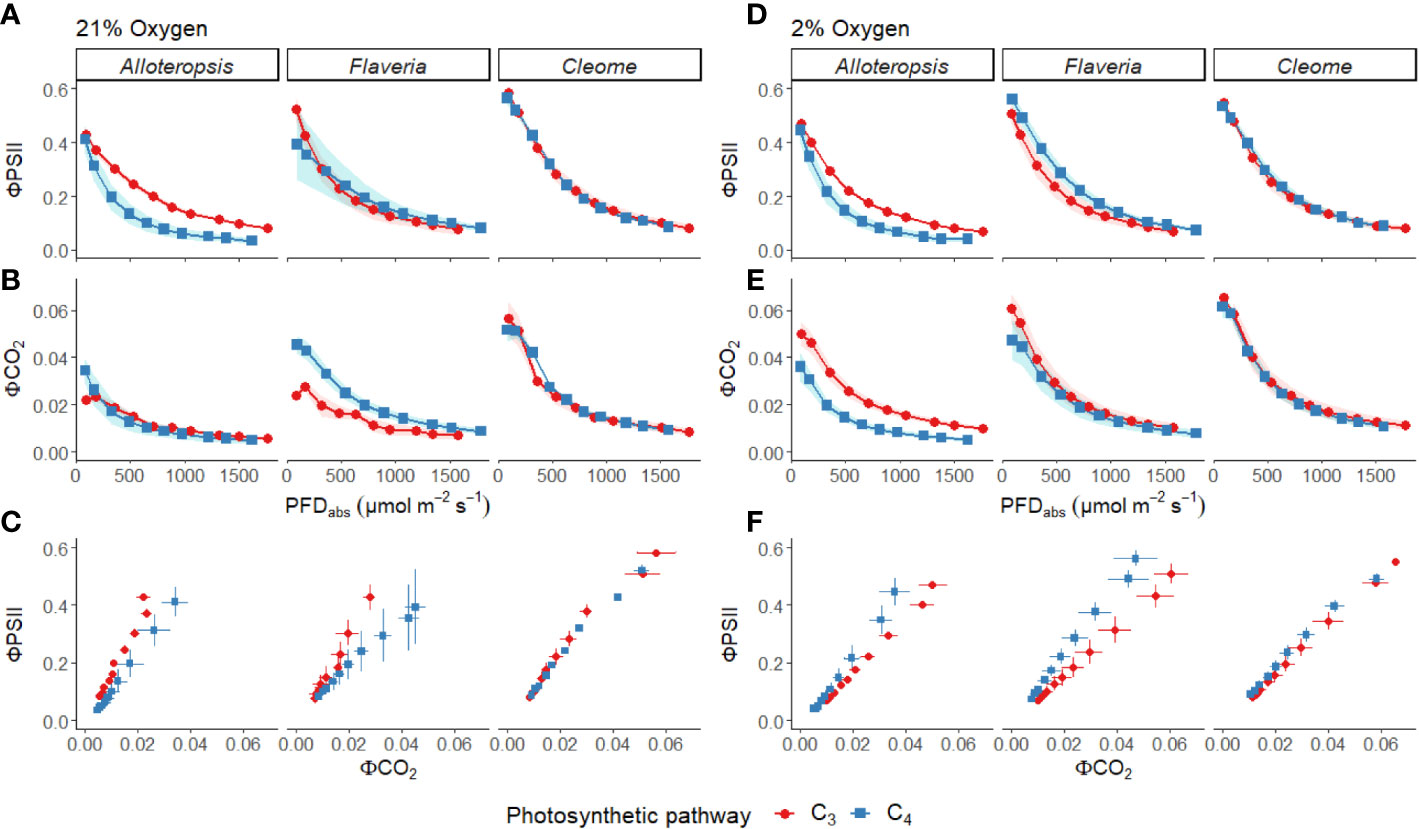
Figure 3 Measurements of gas exchange and chlorophyll fluorescence traits during light response curves for phylogenetically linked C3 and C4 Alloteropsis, Flaveria and Cleome species under 21% and 2% O2. Plots show quantum yield of PSII (ΦPSII, A, D), and quantum yield of CO2 assimilation (ΦCO2, B, E) as a function of absorbed light intensity. Ribbons represent standard error of the mean (n=5). Plots (C, F) display the relationship between ΦPSII and ΦCO2. Error bars represent standard error of the mean for both parameters.
TABLE 1
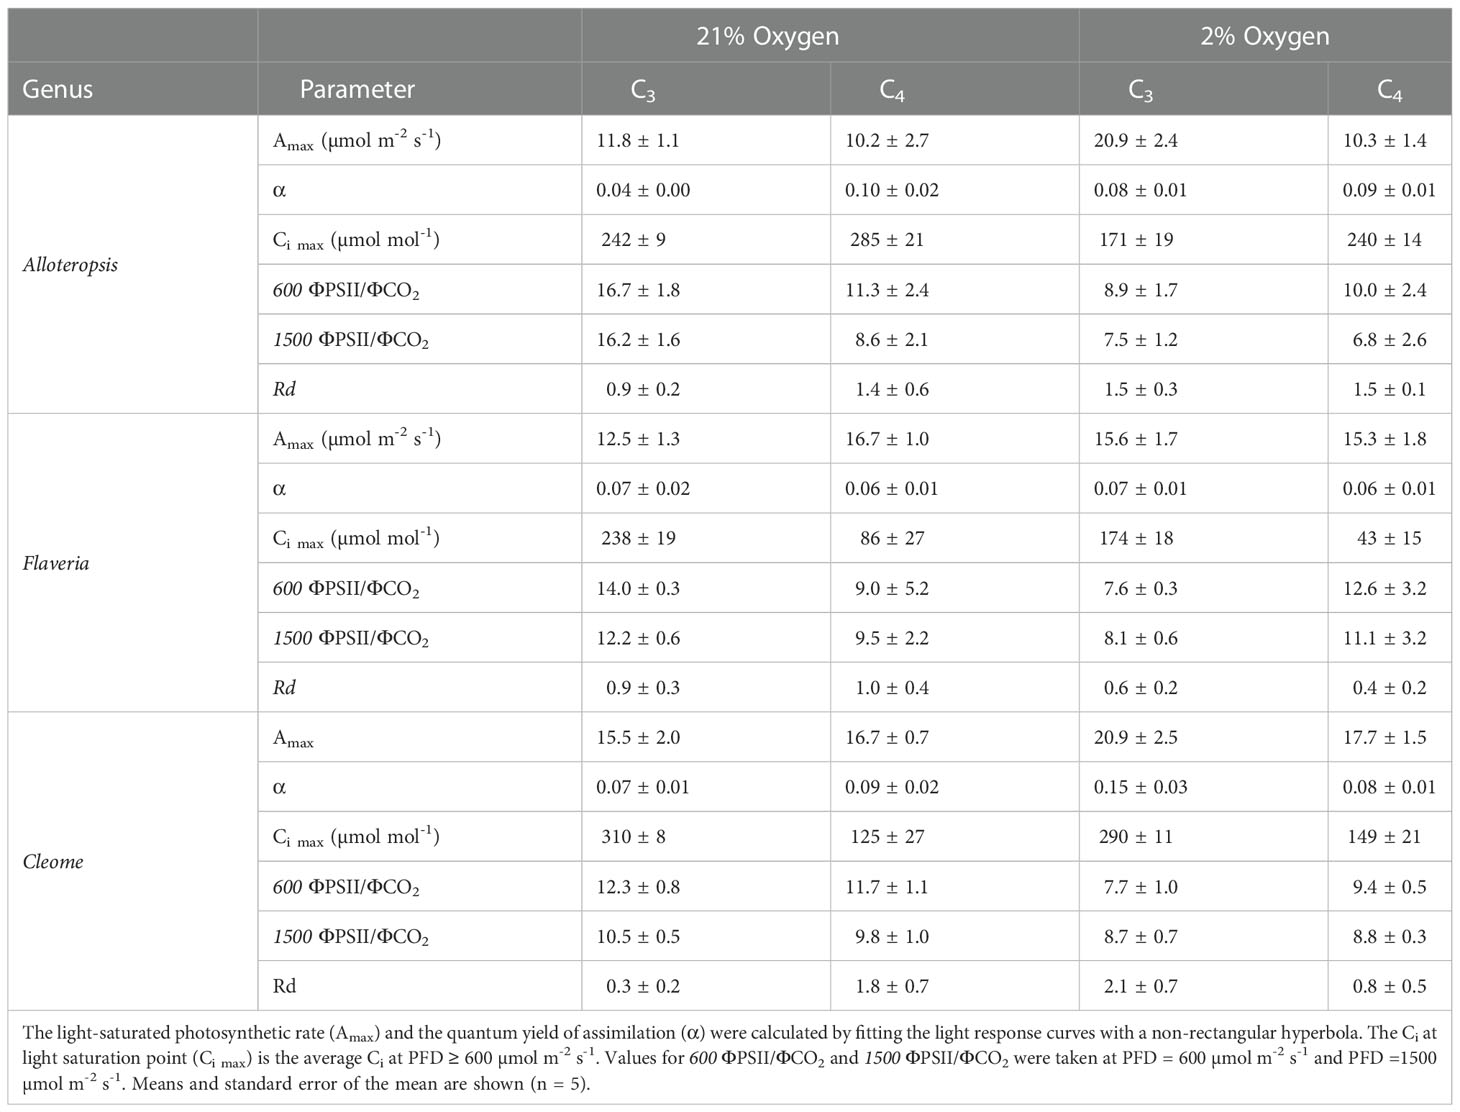
Table 1 Light response curve parameters estimated from steady state light response curves under 21% and 2% O2 on phylogenetically linked C3 and C4 Alloteropsis, Flaveria and Cleome species.
TABLE 2
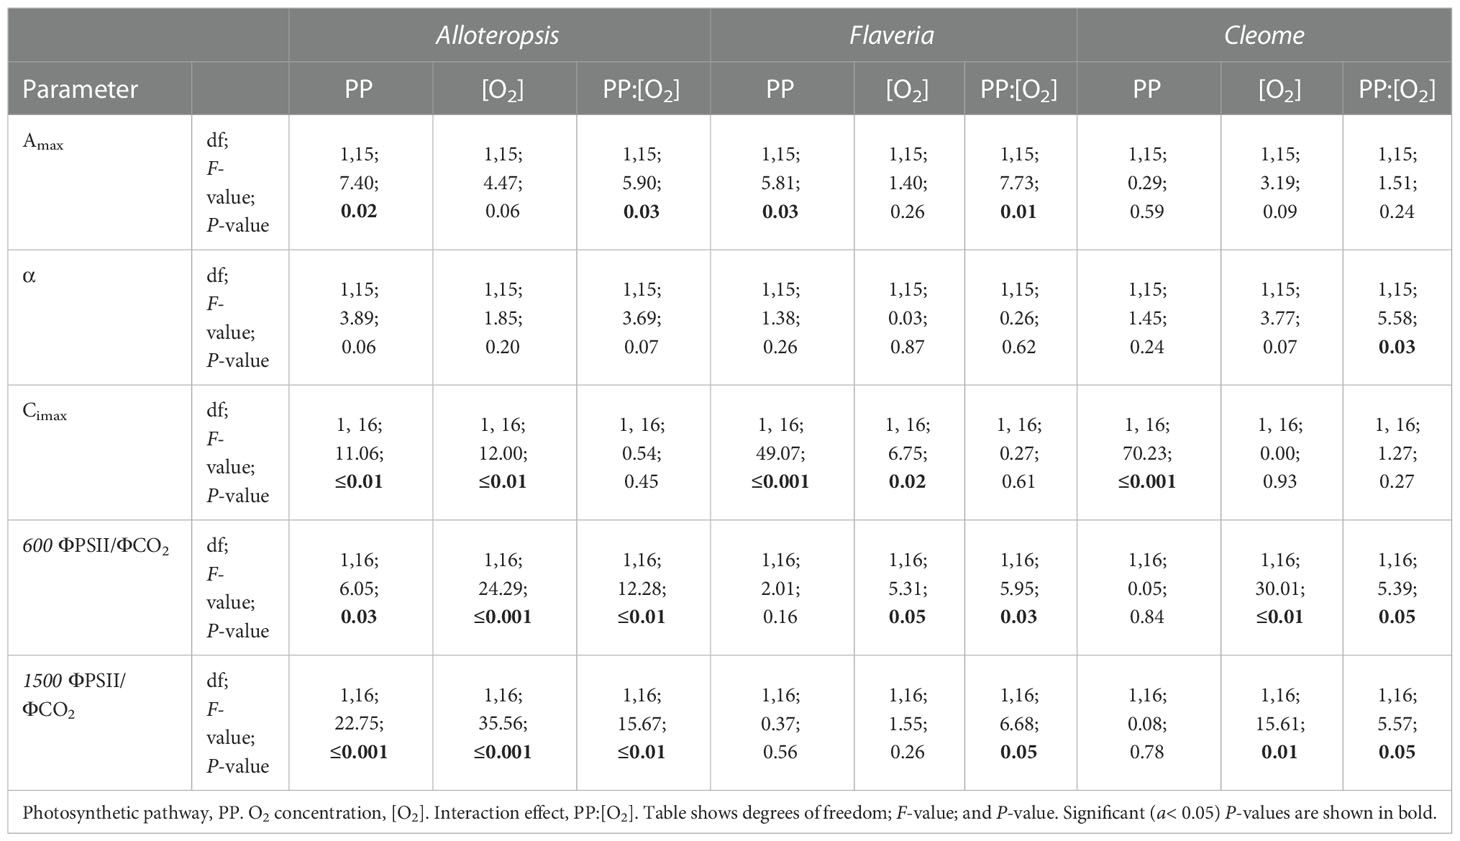
Table 2 ANOVA table of modelled light response curve parameters for phylogenetically linked C3 and C4 Alloteropsis, Flaveria and Cleome species.
ΦPSII decreased exponentially with higher light intensities. Although ΦPSII values were very similar across C3 and C4 pairs in Flaveria and Cleome, more pronounced decreases were observed in C4 A. semialata MDG than in C3 A. semialata GMT (Figure 3A). ΦCO2 was also lower at higher light intensities, following a similar pattern to Amax across the light response, as ΦCO2 was similar between C3 and C4 species in Alloteropsis and Cleome, but higher in C4 F. bidentis compared to C3 F. cronquistii (Figure 3B). These differences across genera were also apparent for the observed ΦPSII and ΦCO2 ratios, but not always significantly so. C4 F. bidentis had lower ΦPSII/ΦCO2 than C3 F. cronquistii (P = 0.16; C3 14.0 ± 0.3 vs C4 9.0 ± 2.4 at PFD = 600 µmol m-2 s-1, and P = 0.56; C3 12.2 ± 0.6, C4 9.5 ± 2.2 at PFD = 1500 µmol m-2 s-1) and the same was observed for C4 A. semialata MDG compared to C3 A. semialata GMT (P = 0.03; C3 16.7 ± 1.8 vs C4 11.3 ± 2.4 at PFD = 600 µmol m-2 s-1, and P ≤ 0.001; C3 16.2 ± 1.6 vs C4 8.6 ± 2.1 at PFD = 1500 µmol m-2 s-1), suggesting that in these C4 species less electron transfer through PSII is needed per CO2 fixed. Figure 3C shows that the lower ratio of ΦPSII to ΦCO2 in C4 Flaveria and Alloteropsis in relation to their C3 counterparts was observed across most light intensities, although the difference appeared to be marginal at higher light intensities. At 21% O2, both C3 and C4 Cleome species had very similar ΦPSII/ΦCO2 (P = 0.84; C3 12.3 ± 0.8 vs C4 11.7 ± 1.1 at PFD = 600 µmol m-2 s-1, and P = 0.78; C3 10.5 ± 0.5 vs C4 9.8 ± 1.0 at PFD = 1500 µmol m-2 s-1).
Light response curves were also performed at 2% O2 to minimize photorespiration (Figures 2D-F, 3D-F and Table 1). All three C3 species had substantially higher CO2 assimilation rates under low O2 – Amax was around 75% higher in C3 A. semialata MDG, 25% higher in C3 F. cronquistii, and 35% higher in C3 T. hassleriana than under 21% O2. 2% O2 also led to a decrease in Ci max in Alloteropsis (P ≤ 0.01 in C3 171 ± 19 vs C4 240 ± 14 µmol mol-1) and Flaveria (P = 0.02; C3 174 ± 18 vs C4 43 ± 15 µmol mol-1) but no significant change in either Cleome species (P = 0.93; C3 290 ± 11 vs C4 149 ± 21 µmol mol-1), where ACO2 and gsw appeared tightly coordinated. The increase in Amax was not mirrored in C4 species, as evidenced by significant interactions (Table 2) between photosynthetic pathway and oxygen in Alloteropsis (P = 0.03) and Flaveria (P = 0.01), where low O2 concentrations were associated with higher Amax on C3 but not C4 species. (Table 2). Similar patterns were observed for the two Cleome species, however the increase in Amax at 2% O2 for C3 T. hassleriana was less pronounced than for the other C3 species and instead the initial slope α appeared to be subject to a significant interaction between effects of photosynthetic pathway and O2 (P = 0.03). The different effects on assimilation at low O2 between C3 and C4 species were also reflected in the changing relationship between ΦPSII and ΦCO2 (Figures 3C, F) – photosynthetic pathway and O2 concentration were found to have significant interactions on ΦPSII/ΦCO2 in all three genera (Table 2, P = 0.05 in Flaveria and Cleome, P ≤ 0.01 in Alloteropsis), due to decreases in ΦPSII/ΦCO2 in C3 species at 2% O2 not observed in C4 species. This data confirms that photorespiration is a significant electron sink under steady state for all three C3 species, whereas the steady state suppression of photorespiration at 21% O2 in the C4 species is sufficient to prevent any significant further decreases in ΦPSII/ΦCO2 under 2% O2.
Substantial differences in photosynthetic traits exist between C3 and C4 species during light induction
Photosynthetic induction rates were measured in leaves exposed to 600 µmol m-2 s-1 or 1500 µmol m-2 s-1 PFD from darkness (Figures 4A-C, G-I). The light induction response across all species and light intensities generally consisted of gradual stomatal opening in line with a rise in ACO2 towards steady state, and a sharp drop in Ci at the start of induction, followed by a gradual recovery.
FIGURE 4
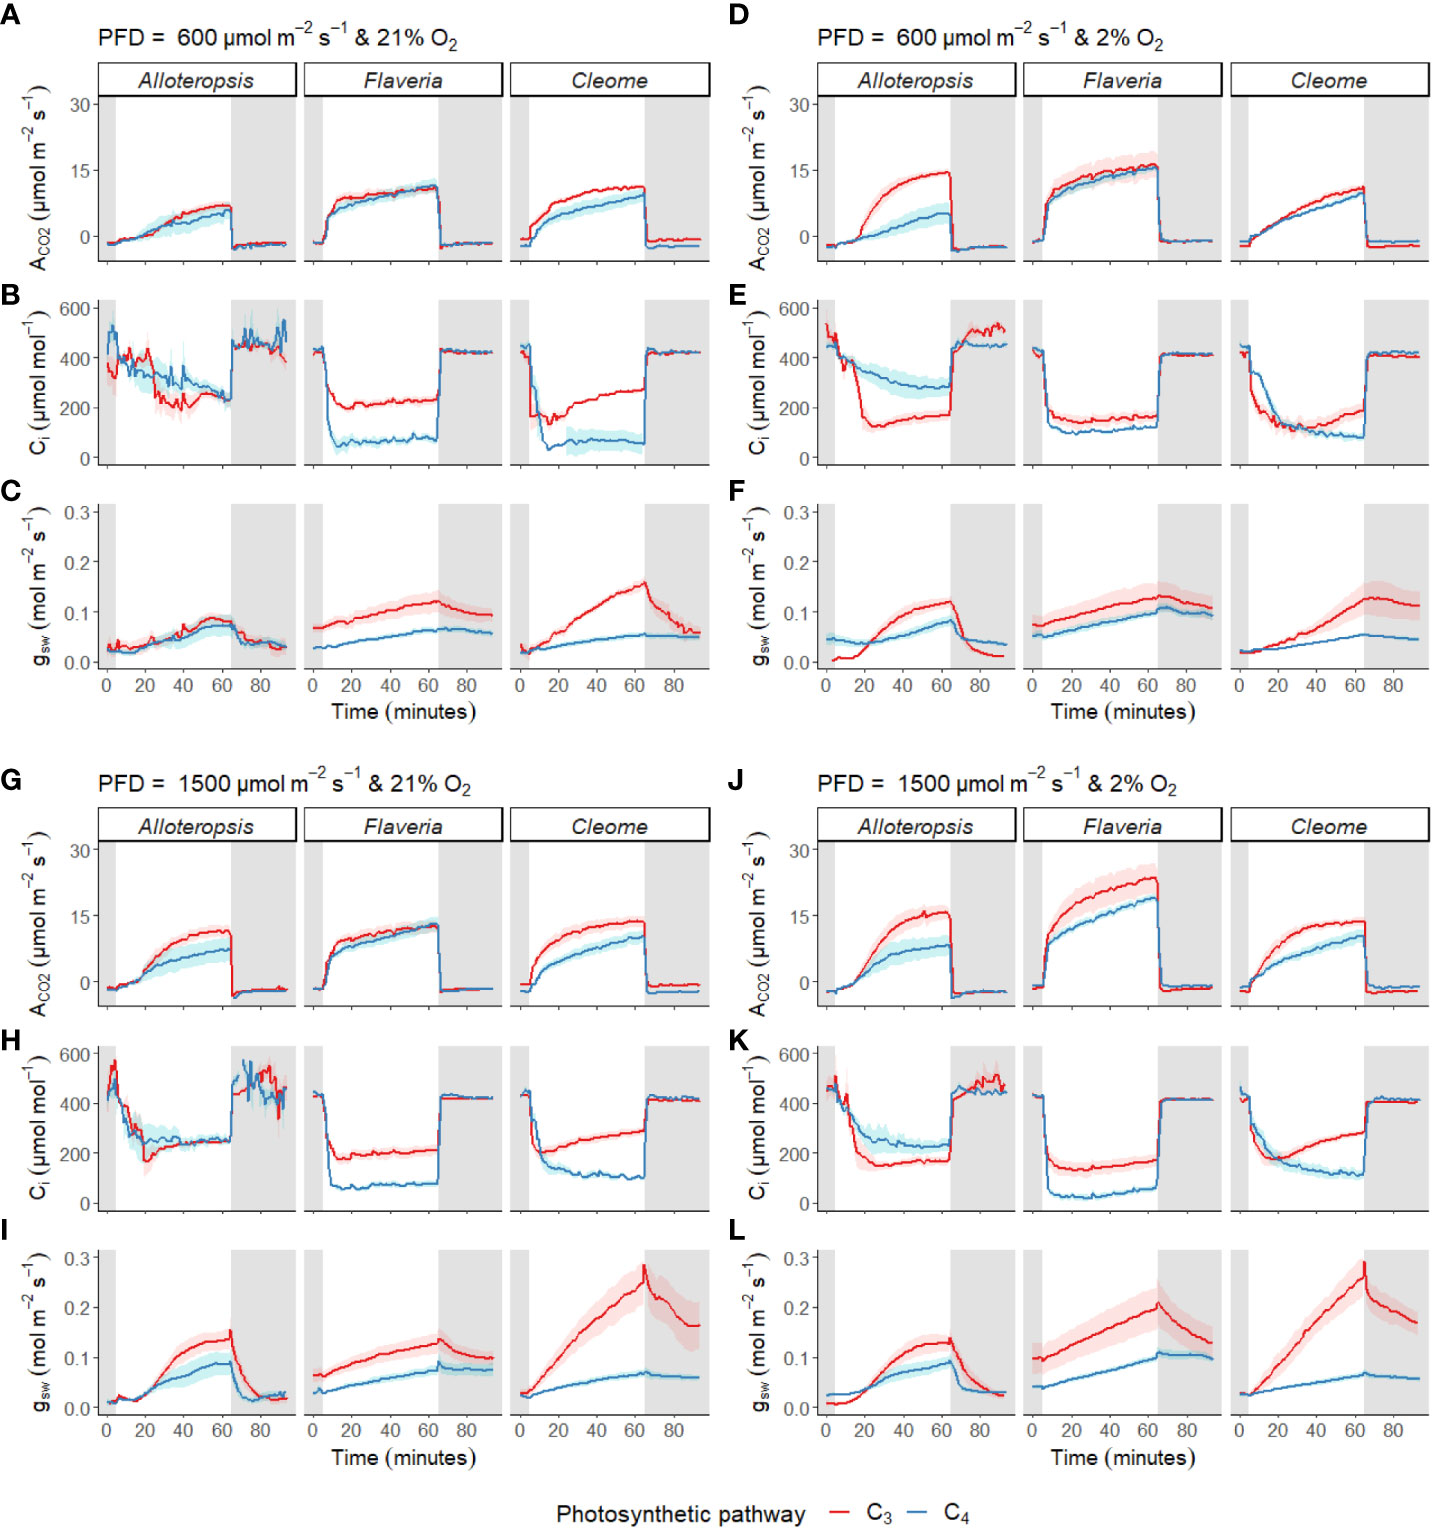
Figure 4 Measurements of gas exchange during light induction in phylogenetically linked C3 and C4 Alloteropsis, Flaveria and Cleome species. Leaves were acclimated to darkness, exposed to 1 hour of light, and returned to darkness for another half hour. Plots show net CO2 assimilation (ACO2, A, D, G, J), intercellular CO2 concentration (Ci, B, E, H, K) and stomatal conductance to water vapour (gsw, C, F, I, L) across the light induction experiment, at PFD = 600 µmol m-2 s-1 and PFD = 1500 µmol m-2 s-1, in 21% and 2% O2. Ribbons represent standard error of the mean (n = 5).
In addition to these general patterns, several differences were observed across genera and between paired species. Stomata tended to open more quickly in the C3 species than in their respective C4 counterparts. Furthermore, the speed of ACO2 induction appeared to vary between some C3 and C4 pairs; where carbon assimilation was notably slower to induce in C4 G. gynandra compared to C3 T. hassleriana under both light intensities, with more subtle differences observed in the Alloteropsis and Flaveria C3 and C4 pairs.
Reductions in assimilation of CO2 at the start of induction in C3 and C4 species vary across genera
In order to systematically explore C3 and C4 differences in the activation of CO2 assimilation, the induction time-series were subdivided into three periods, 0 – 5 min, 5 – 10 min, and the remaining 10 – 60 min, and integrated carbon assimilation (AUC) was calculated for each period (Figure 5). During the 0 – 5 min period, C4 F. bidentis had lower AUC than C3 F. cronquistii under both PFD = 600 µmol m-2 s-1 (P = 0.09; C3 12.4 ± 1.7 vs C4 5.8 ± 2.0 µmol m-2) and PFD = 1500 µmol m-2 s-1 (P = 0.02; C3 14.8 ± 1.8 vs C4 8.0 ± 1.8 µmol m-2), with the difference becoming significant under higher light (Table 3). The difference in assimilated CO2 between C3 and C4 species at the start of induction was even more pronounced in Cleome, where the AUC of C4 G. gynandra was significantly lower than that of C3 T. hassleriana under both light intensities (P ≤ 0.01; C3 12.6 ± 2.0 vs C4 -1.4 ± 1.9 µmol m-2 at PFD = 600 µmol m-2 s-1, and P ≤ 0.01; C3 13.8 ± 3.2 vs C4 -3.1 ± 1.8 µmol m-2 at PFD = 1500 µmol m-2 s-1). The AUC in C4 G. gynandra continued to be significantly lower than in C3 T. hassleriana under both light intensities during the following two periods of induction analysed (Table 3). In contrast, the significant difference in cumulative CO2 uptake between Flaveria species was only significant during the first five minutes of induction (Figure 5A). Thus, there was a more pronounced lag in CO2 assimilation during induction in C4 photosynthesis in Flaveria and Cleome than in C3 photosynthesis in the same genera. This was especially apparent in relation to the steady state comparison between both species-pairs (Figure 2A). In Alloteropsis, the C4 A. semialata MDG also started at lower AUC than C3 A. semialata GMT during the 0 – 5 min period under both light intensities (P = 0.36; C3 -4.4 ± 0.5 vs C4 -6.22 ± 0.39 at PFD = 600 µmol m-2 s-1, and P = 0.07; C3 -4.2 ± 0.2, vs C4 -6.8 ± 0.6 at PFD = 1500 µmol m-2 s-1), but the difference in AUC between pathways was only found to be significant for the final 10 – 60 min (P ≤ 0.01; C3 194.8 ± 34.3 vs C4 142.2 ± 101.0 at PFD = 600 µmol m-2 s-1, and P = 0.03; C3 403.3 ± 59.5 vs C4 241.5 ± 115.6 at PFD = 1500 µmol m-2 s-1).
FIGURE 5
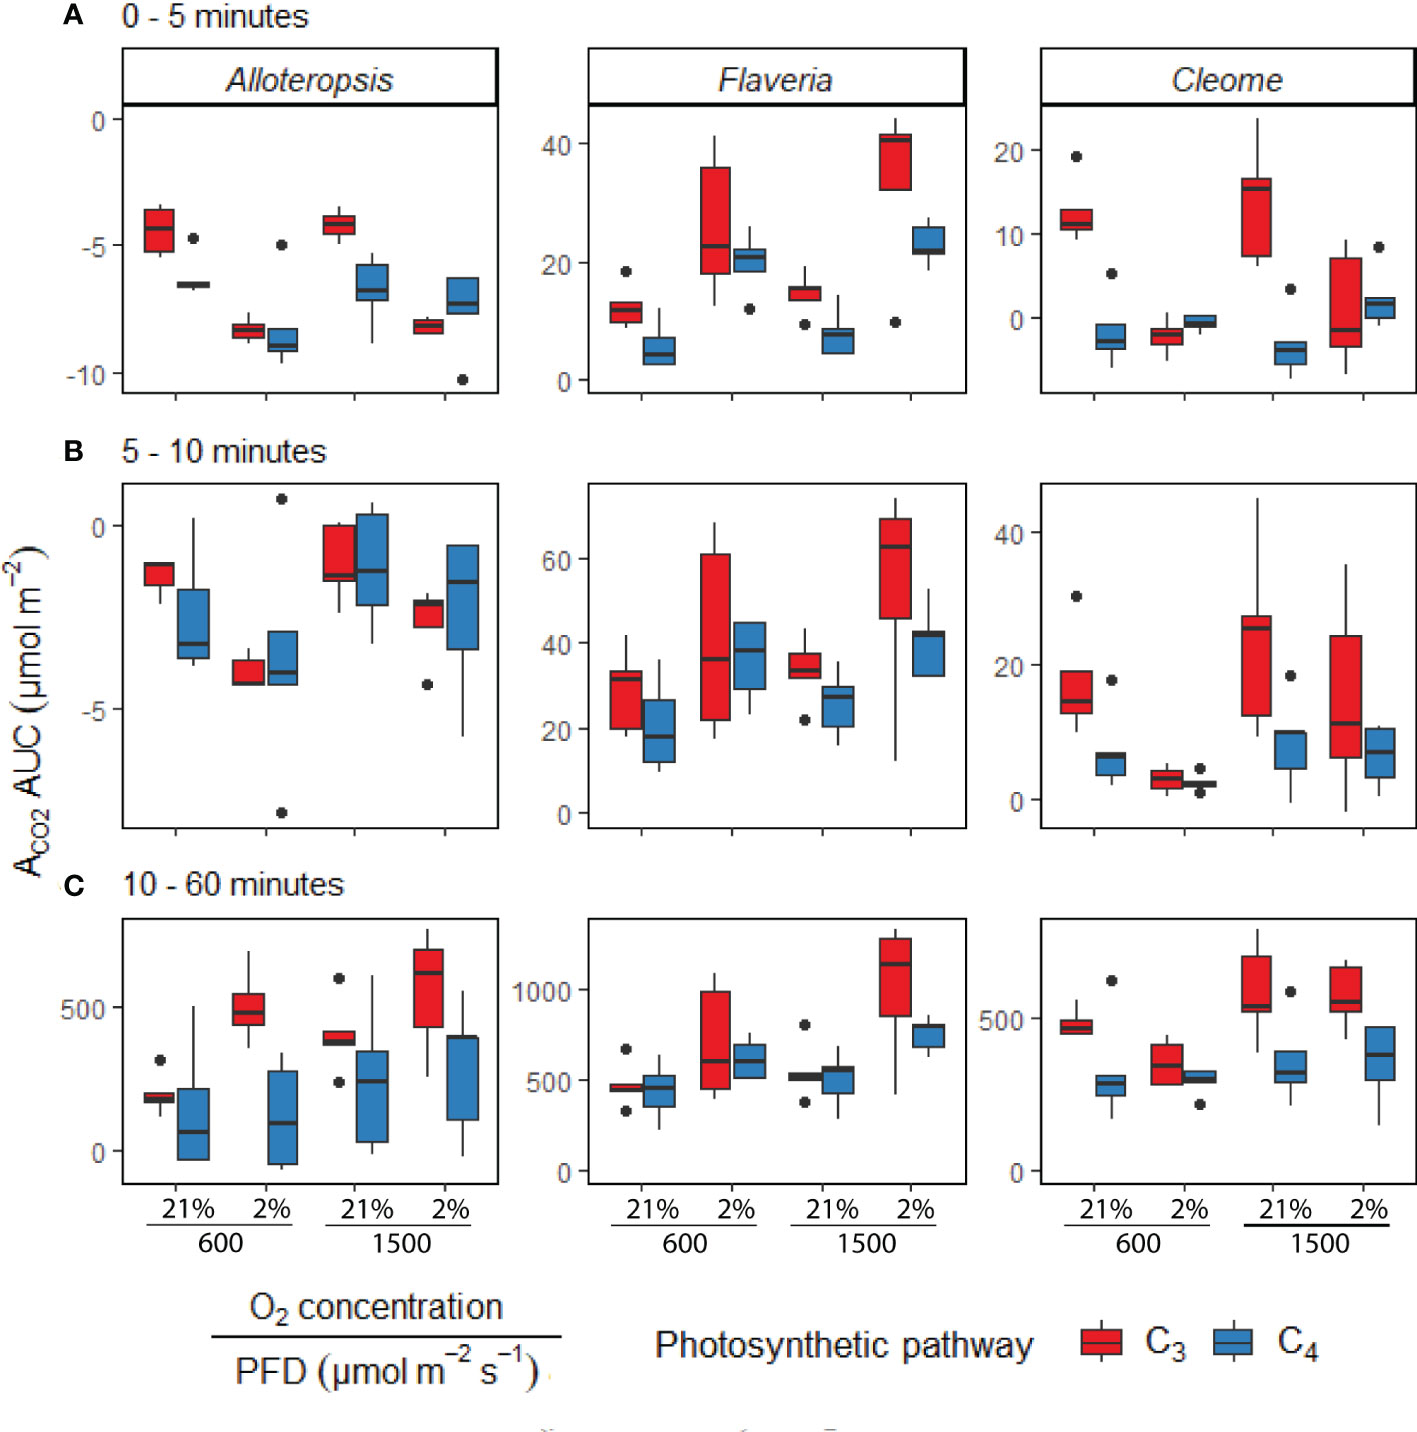
Figure 5 Boxplots of cumulative CO2 assimilation over different phases of light induction in phylogenetically linked C3 and C4 Alloteropsis, Flaveria and Cleome species, under different light and O2 treatments (n = 5 for each combination of species/measurement condition). Box edges represent first and third quartiles, the solid line indicates the median, and points represent outliers beyond 1.5 times the interquartile range. The area under the curve (AUC) was calculated from the ACO2 of light induction experiments where plants at 21% or 2% O2 concentrations were dark-adapted and exposed to PFD = 600 µmol m-2 s-1 or PFD = 1500 µmol m-2 s-1 for 1 hour. Plots show the AUC of induction during 0 – 5 minutes (A), 5 – 10 minutes (B), and 10 – 60 minutes (C). Two-way ANOVAs (Table 3) were used to test the effect of photosynthetic pathway, O2 concentration and their interaction on ACO2 AUC at different phases of light induction in Alloteropsis, Flaveria, and Cleome.
TABLE 3
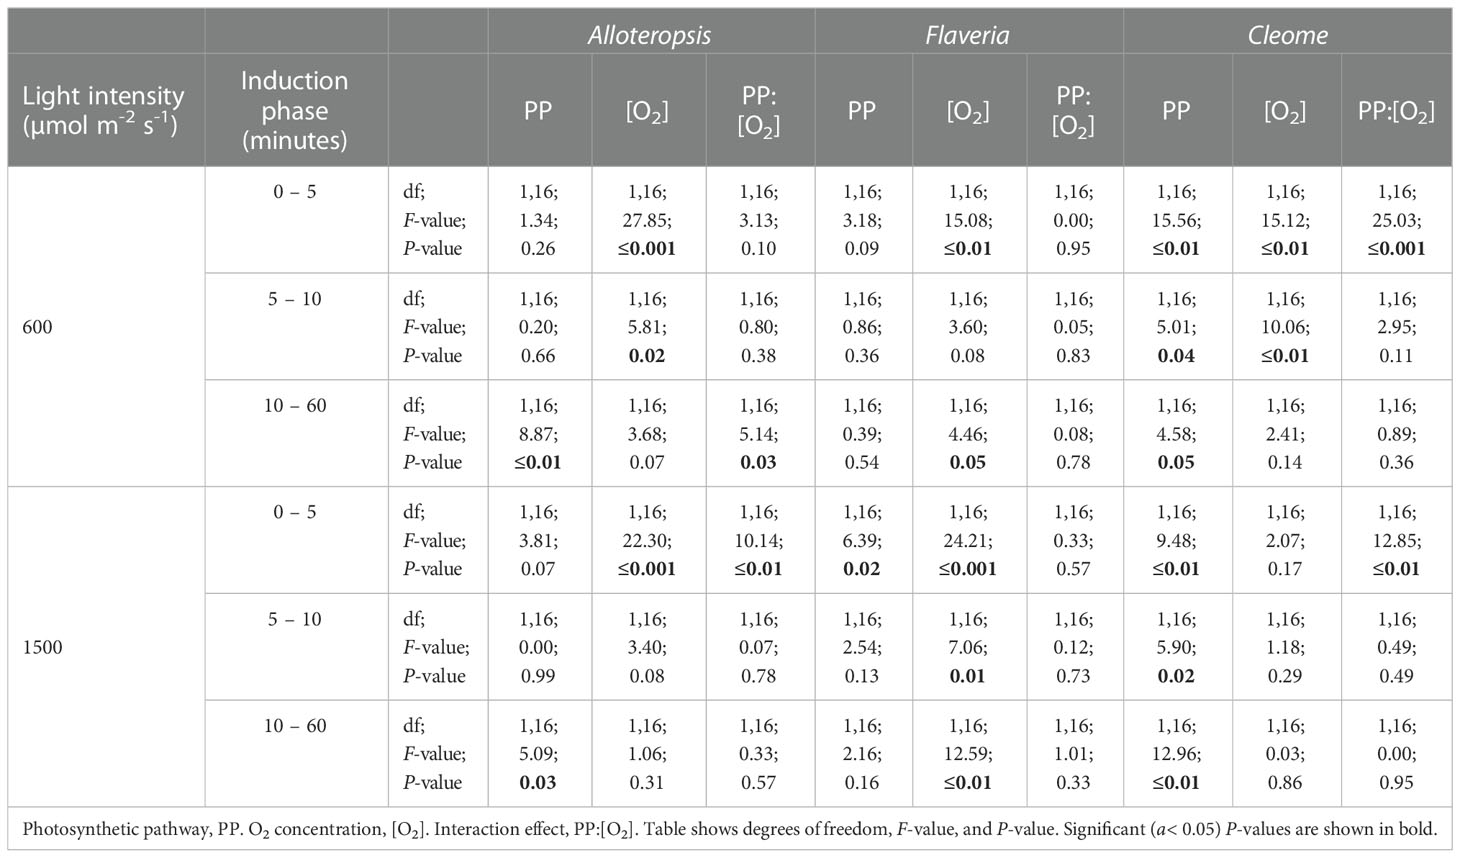
Table 3 ANOVA table of the carbon assimilation AUC of different phases of light induction for phylogenetically linked C3 and C4 Alloteropsis, Flaveria and Cleome species.
CO2 assimilation during induction is enhanced under 2% O2 in some species but suppressed in others
In order to test whether the presence or absence of photorespiration affected the activation of CO2 assimilation, both light treatments were also conducted under 2% O2 (Figures 4D-F, J-L). In Flaveria, the decrease in O2 concentration significantly increased the AUC of both C3 F. cronquistii and C4 F. bidentis during the first five minutes of induction (Table 3 and Figure 5A), under both light intensities (P ≤ 0.01; C3 26.1 ± 5.4 vs C4 19.9 ± 2.6 µmol m-2 at PFD = 600 µmol m-2 s-1 and P ≤ 0.001; C3 33.8 ± 6.3 vs C4 23.1 ± 1.6 at PFD = 1500 µmol m-2 s-1). Interestingly, although the stimulating effect of 2% O2 on C4 F. bidentis was less pronounced for 5 – 10 min and 10 – 60 min, the effect was still significant across both periods under both light intensities, except for 5 – 10 min at PFD = 600 µmol m-2 s-1 (P = 0.08, Table 3). This suggests that photorespiration is insufficiently suppressed during induction in C4 F. bidentis, whereas in contrast, no change was observed for CO2 assimilation in steady state C4 F. bidentis under 2% O2 (Figures 2A, D). In Cleome no such enhancement of the photosynthetic response was observed in C4 G. gynandra. Instead, the significant interaction between photosynthetic pathway and O2 concentration from 0 – 5 min was primarily associated with a decrease in assimilated CO2 in C3 T. hassleriana and only a marginal increase in C4 G. gynandra AUC under 2% O2 compared to under 21% O2 (P ≤ 0.001). The negative effect of 2% O2 on AUC in C3 T. hassleriana was transiently observed from 0 – 10 min at PFD = 600 µmol m-2 s-1 and only from 0 – 5 min at PFD = 1500 µmol m-2 s-1. From 10 – 60 min AUC at 2% O2 in C3 T. hassleriana was similar to the AUC at 21% O2 under both light intensities. Thus, the stimulation of steady state CO2 assimilation by 2% O2 in this species was not observed under any of the transient conditions (Table 3 and Figure 5). Suppression of carbon assimilation by low O2 was also observed during the start of induction in both C3 and C4 Alloteropsis species. The AUC from 0 – 5 min was reduced in C3 A. semialata GMT and C4 A. semialata MDG compared to AUC in 21% O2 under both light intensities, a significant effect (P ≤ 0.001) that persisted well into the 5 – 10 min period for PPFD = 600 µmol m-2 s-1 (P ≤ 0.02). However, by 10 – 60 min the effect of O2 was reversed in C3 A. semialata GMT, with AUC for this period being significantly higher than for 21% O2 (P = 0.03). For this period C3 A. semialata GMT also had a significantly higher AUC in 2% O2 than C4 A. semialata MDG (P ≤ 0.01; C3 504.4 ± 57.5 vs C4 116.4 ± 84.7 µmol m-2 at PFD = 600 µmol m-2 s-1, and P = 0.03; C3 558.71 ± 94.6 vs C4 285.2 ± 108.7 µmol m-2 at PFD = 1500 µmol m-2 s-1). Whereas the stimulating effect of 2% O2 on transient CO2 assimilation may be indicative of photorespiration as a negative factor during photosynthetic induction, the suppression of carbon assimilation found under 2% O2 for both Alloteropsis species as well as the Cleome C3 T. hassleriana could indicate photorespiration is not always detrimental to photosynthetic efficiency and may indeed support the activation of CO2 assimilation in some C3 and C4 species.
Transient decoupling between electron transport and carbon fixation during induction is more pronounced in C4 species and ameliorated by 2% O2
During activation of CO2 assimilation, a temporary decoupling between the electron transport chain and photosynthetic carbon fixation in C4 species could occur due to the time needed to activate the C3 cycle, incomplete suppression of photorespiration due to an inactive CCM, or because of an increase in the energetic cost of carbon fixation via BS CO2 leakage. To look for evidence of transient decoupling during induction, ΦPSII/ΦCO2 ratios across the light induction period under each light and O2 condition were further analysed within each genus (Figure 6 and Table 4).
FIGURE 6
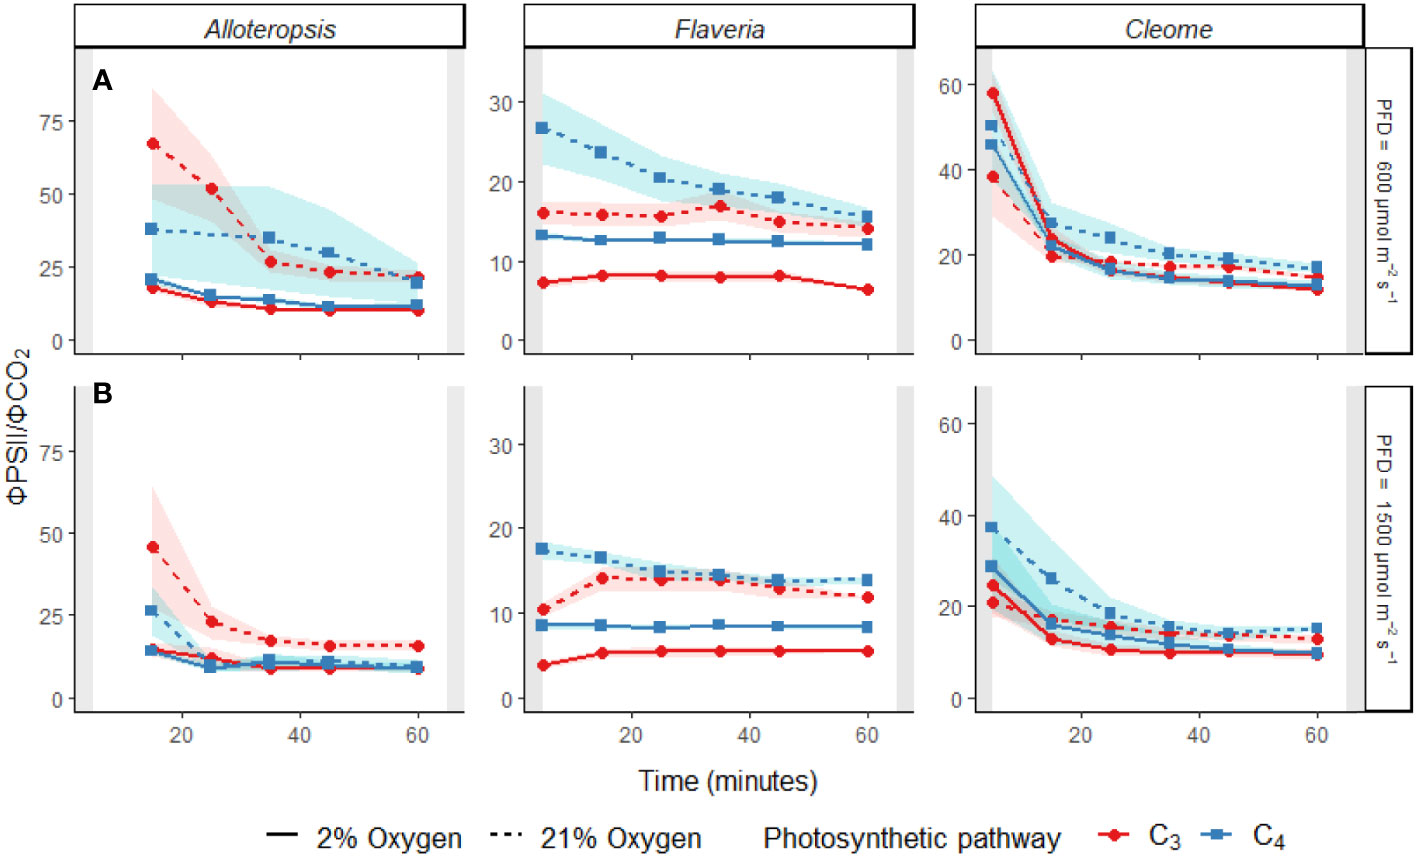
Figure 6 Line plots of the ΦPSII/ΦCO2 ratio during light induction at PFD = 600 µmol m-2 s-1 (A) and PFD = 1500 µmol m-2 s-1 (B) in phylogenetically linked C3 and C4 Alloteropsis, Flaveria and Cleome species. Plots show ΦPSII/ΦCO2 under 21% (dashed line) and 2% O2 (solid line). Values of ΦPSII/ΦCO2 were excluded if ΦCO2 values were negative, resulting in the 5 minute Alloteropsis values being excluded. Ribbons show standard error of the mean (n = 5).
TABLE 4
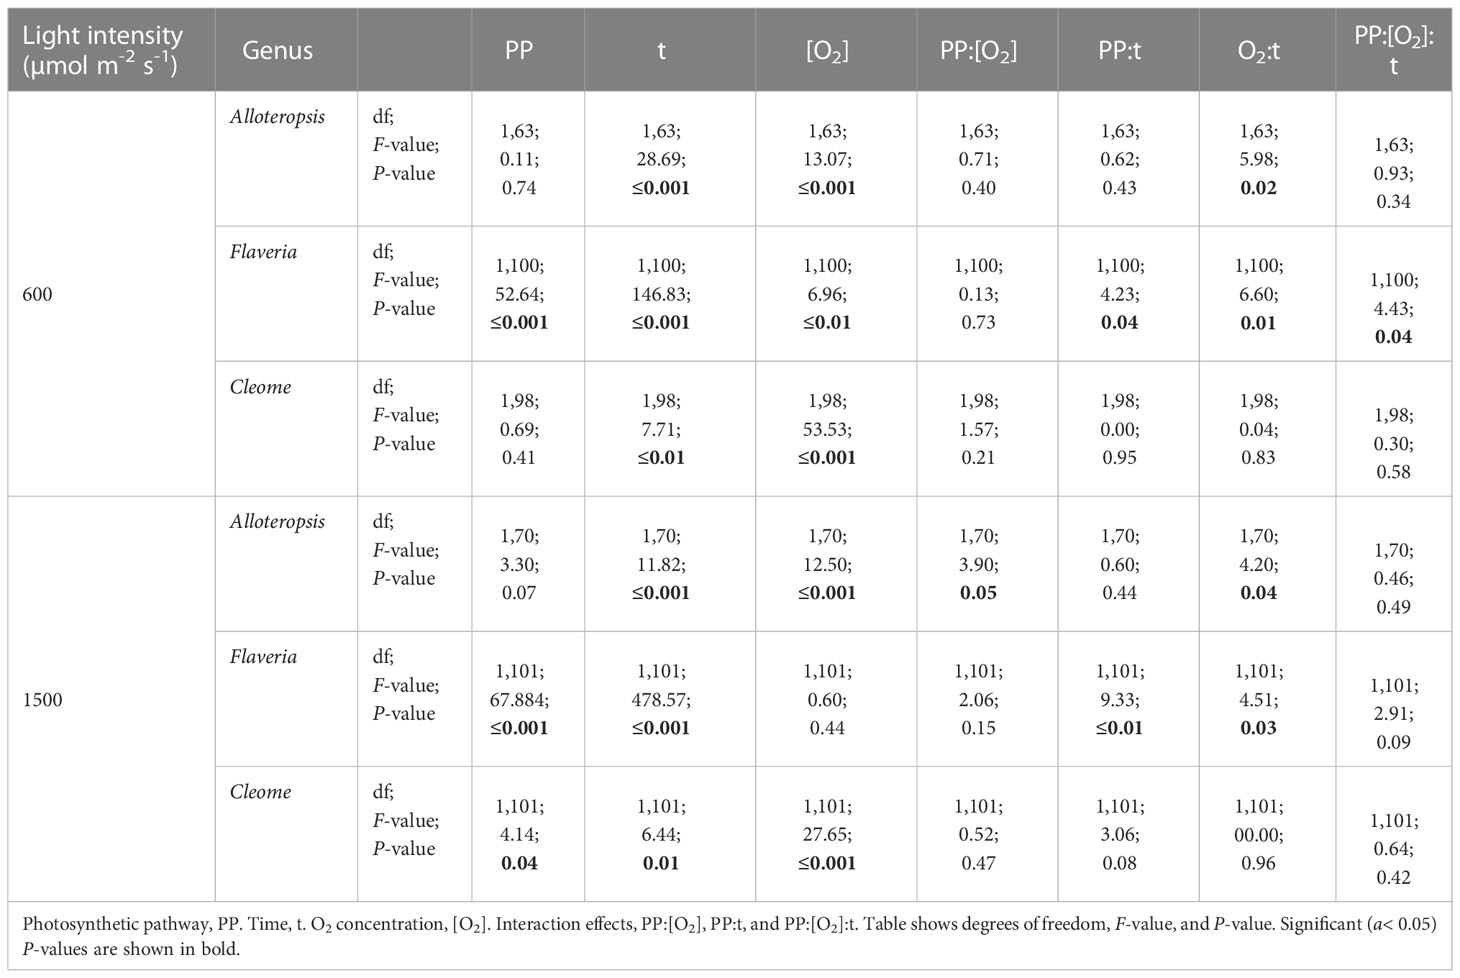
Table 4 ANOVA table of the ΦPSII/ΦCO2 ratio during light induction for phylogenetically linked C3 and C4 Alloteropsis, Flaveria and Cleome species.
The effect of time was significant for all genera. All the C4 species showed higher ΦPSII/ΦCO2 at the start of induction under 21% O2, with values gradually decreasing as the leaves became more acclimated to the light conditions. The average ΦPSII/ΦCO2 ratio during induction was also noticeably higher than the steady state ΦPSII/ΦCO2 for all species, which ranged between 8-12 e-/CO2 depending on the species, indicating a significant transient decoupling during induction compared to steady state. In Flaveria, C4 F. bidentis had higher ΦPSII/ΦCO2 ratio than C3 F. cronquistii under all light and oxygen conditions, the complete opposite of steady state. This suggests the C4 pathway in Flaveria does have some features that make the activation of photosynthesis more energetically demanding at the onset of light induction. Notably, the interaction of O2 concentration and time also had a significant effect on ΦPSII/ΦCO2 (P = 0.01 at PFD = 600 µmol m-2 s-1, P = 0.01 at PFD = 1500 µmol m-2 s-1), since in 2% O2 the ratio decreased at an earlier point of induction than in 21% O2. During induction at PFD = 600 µmol m-2 s-1, the three-way interaction was significant (P = 0.04), reflecting the strong decrease in ΦPSII/ΦCO2 over time observed at 21% O2 in C4 F. bidentis. This decrease may reflect the progressive suppression of photorespiration by activation of the C4 CCM, since the same trend in ΦPSII/ΦCO2 was not present in C3 F. cronquistii, nor under 2% O2 when photorespiration would have been negligible.
In Cleome, C3 T. hassleriana also had a lower ΦPSII/ΦCO2 ratio than C4 G. gynandra, in another reversal of differences observed during steady state conditions. ΦPSII/ΦCO2 was significantly affected by time (P ≤ 0.01 at PFD = 600 µmol m-2 s-1, P = 0.01 at PFD = 1500 µmol m-2 s-1) as well as O2 concentration (P ≤ 0.001 at both light intensities), but in contrast to Flaveria no significant interaction was found between O2 and time (P = 0.21 at PFD = 600 µmol m-2 s-1, P = 0.47 at PFD = 1500 µmol m-2 s-1). Instead, in Cleome ΦPSII/ΦCO2 was marginally lower at 2% O2 than at 21% O2 across the induction period. The temporal decrease in ΦPSII/ΦCO2 was similar under both O2 concentrations, suggesting that the transient decoupling between electron transport and CO2 fixation was relatively insensitive to O2 in both Cleome species.
Finally, ΦPSII/ΦCO2 ratios in Alloteropsis were not significantly affected by a main effect of photosynthetic pathway (P = 0.74 at PFD = 600 µmol m-2 s-1, P = 0.07 at PFD = 1500 µmol m-2 s-1), again in contrast to steady state where C4 A. semialata MDG had lower ratios than C3 A. semialata GMT. However, the interaction between photosynthetic pathway and O2 was significant (P ≤ 0.001 at both light intensities), due to the fact that the O2 effect on ΦPSII/ΦCO2 was much less pronounced in C4 A. semialata MDG than in C3 A. semialata GMT. Similar to the Flaveria and Cleome results, a significant interaction between O2 concentration and time (P ≤ 0.001 at both light intensities) was also observed in Alloteropsis, with 2% O2 more significantly reducing ΦPSII/ΦCO2 during the start of induction than towards the end.
Discussion
The presented experiments investigated the efficiency of photosynthesis during light induction in phylogenetically linked Alloteropsis, Flaveria, and Cleome C3 and C4 species. Steady state and photosynthetic induction responses to light were measured to evaluate relative differences between paired species – controlling for evolutionary distance allowed for better differentiation between the effects of photosynthetic pathway and species-specific variation. At the start of light induction C4 species had greater lag in CO2 assimilation than C3 species in all three comparisons (Figure 5A), confirming that the activation of CO2 assimilation is generally slower in C4 photosynthesis within the studied genera. However, the underlying reasons for this difference appeared to be genus specific. In C4 Flaveria, slower induction appeared to be explained at least in part by less efficient suppression of photorespiration, since 2% O2 resulted in increased CO2 assimilation and fewer transferred electrons per fixed CO2 (Figure 6). Although decreased photorespiratory electron sinks were also observable in C4 Alloteropsis and Cleome induction under 2% O2, there were no concurrent increases in CO2 assimilation (Figure 5A), implying alternative limiting factors were at play, such as C3 cycle activation. In C3 Cleome and both Alloteropsis species, 2% O2 actually suppressed activation of CO2 assimilation, suggesting that photorespiration may support the induction of photosynthesis in these species.
Slower activation of CO2 assimilation during light induction in C4 versus C3 photosynthesis
In line with previously observed photosynthetic induction responses (Pearcy and Seemann, 1990; Pearcy, 1990; Sassenrath-Cole and Pearcy, 1992; Mott and Woodrow, 2000) a transient reduction in CO2 assimilation relative to steady state was observed in all species during light induction, with a more pronounced effect found in C4 species (Figure 5). Greater losses of photosynthetic efficiency have previously been observed in C4 grown under dynamic light in comparison to C3 species and linked to mechanisms involving photosynthetic induction (Kubásek et al., 2013). Further fluctuating light work on plants grown under constant light (including C4 F. bidentis) has also shown an increased lag in CO2 assimilation in C4 compared to C3 species following step-increases in light intensity (Li et al., 2021). Similarly, in a study comparing a selection of C3 and C4 grasses (Lee et al., 2022), a biphasic increase in assimilation during the low to high light transition was the most significant limitation in maize and big bluestem, again emphasizing the C4 lag in CO2 assimilation. However, both Li et al. (2021) and Lee et al. (2022) studies examined the efficiency of fully induced photosynthesis subsequently exposed to stepwise decreases and increases in light intensity, whereas the C4 lag-time when activation starts from darkness or from prolonged periods of low light may be even more pronounced.
During darkness or low light periods, stomatal closure could subsequently restrict photosynthetic assimilation during light induction due to a lack of coordination between CO2 influx and assimilation. However, gsw appears to increase in tandem with decreases in Ci, so stomatal opening does not seem to be the major source of limitation (Figures 4C, F, I, L). The lower gsw found in C4 species during light induction is consistent with studies that show C4 species to have lower stomatal conductance and greater water use efficiency (Way et al., 2014; McAusland et al., 2016). It is worth noting that C4 monocots under dynamic light have been reported to have faster stomatal opening and closing than C3 monocots and dicots (Ozeki et al., 2022) yet stomatal kinetics in C4 A. semialata MDG instead appear to be slower, again emphasizing the importance of accounting for species or genus-specific phenomena. However, although CO2 availability can affect CO2 assimilation during induction, other biochemical limitations appeared to dominate the responses observed here, as discussed in more detail below. The different C4 decarboxylase pathways found across the three C4 species studied have distinct energetic demands per cell type. The NADP-ME subtype found in C4 F. bidentis and NAD-ME subtype in C4 G. gynandra require substantial transfer of reductant between M and BS cells (Ishikawa et al., 2016) and steeper metabolite gradients for CCM operation, whilst mixed NADP-ME-PEPCK CCM found in C4 A. semialata MDG can meet ATP and NADPH requirements more cell autonomously (Yin and Struik, 2021). Modelling simulations indicate that reduced metabolite concentrations may be required to sustain this C4 pathway (Wang et al., 2014a). The greater cell autonomy regarding energetic supply and demand found in C4 A. semialata MDG could suggest a capacity for faster activation of photosynthetic assimilation, yet in the light induction experiments CO2 assimilation in C4 A. semialata MDG lagged behind the other C4 species during the first ten minutes after starting light exposure (Figure 5A, B). In the following paragraphs we explore the different mechanisms underlying the slow activation of C4 photosynthesis across the three genera.
Photorespiration during C4 photosynthetic induction, disadvantageous or beneficial?
Reduced CO2 assimilation during induction in C4 species has been hypothesised to derive from the need to build up C4 cycle intermediates leading to a lag in the efficient suppression of photorespiration (Sage and Mckown, 2006). If so, induction in C4 species when the photorespiratory pathway is suppressed by low O2 should result in an increase in photosynthetic carbon assimilation. This appeared to be confirmed in C4 F. bidentis, where CO2 assimilation during induction was higher under 2% O2 than under 21% O2 (Figure 5), in contrast to CO2 assimilation in C4 F. bidentis under steady state which showed no difference in ACO2 between O2 concentrations (Figures 2A, D and Table 1). Comparatively, the lack of an equivalent improvement in CO2 assimilation under 2% O2 in C4 A. semialata GMT and C4 G. gynandra suggests that in these species the activation of the C3 cycle (Sassenrath-Cole and Pearcy, 1992; Mott and Woodrow, 2000) could instead be the limiting factor.
Surprisingly, despite the stimulating effect of 2% O2 on steady state CO2 assimilation in C3 A. semialata GMT and C3 T. hassleriana, and lack of O2 sensitivity in C4 A. semialata GMT (Figures 2A, D and Table 1), CO2 assimilation in all three species during the first 10 min of light induction was lower in 2% O2 than in 21% O2 (Figures 5A, B). Reverse sensitivity to O2 in C3 species has been linked to limitation by the rate of triose phosphate utilisation (TPU) (Sharkey, 1985). Low O2 suppresses the net export of photorespiratory intermediates serine or glycine and limits endogenous pools of inorganic phosphate (Pi), as the amino acids come from phosphorylated plastidic metabolites that when used up in the cytosol liberate Pi otherwise used in the glycerate-PGA conversion (McClain and Sharkey, 2019). Additionally, reduced rates of starch biosynthesis from triose phosphates, and phosphoglucose isomerase inhibition have been found in low O2 conditions (Dietz, 1985). The lower CO2 assimilation observed in 2% O2 compared to 21% O2 during induction in C3 A. semialata GMT and C3 T. hassleriana could thus be due to 2% O2 causing suboptimal stromal phosphate levels, thereby transiently exacerbating TPU limitation. It remains unclear whether C4 species suffer from TPU limitation (Zhou et al., 2019), or whether alternative mechanisms may be involved.
The photorespiratory pathway has previously been suggested to help prime the C4 cycle by providing a carbon source from which to build C3 and C4 metabolite pools (Kromdijk et al., 2014; Stitt and Zhu, 2014; Schlüter and Weber, 2020; Fu and Walker, 2022; Medeiros et al., 2022). In C4 species, photorespiration could help establish CCM metabolic gradients through interconversion of 3-phosphoglyceric acid (3-PGA) and PEP (Arrivault et al., 2016), and in plants with NADP-ME decarboxylase, such as mixed subtype NADP-ME PEPCK C4 A. semialata GMT, models suggest photorespiration could support the activation of redox-regulated C3 enzymes and contribute to the formation of C3 cycle intermediates in the BS through the triose phosphate transporter (TPT) (Weber and Von Caemmerer, 2010; Wang et al., 2014b). In C3 photosynthesis, beyond its photoprotective role (Kozaki and Takeba, 1996), photorespiration has been shown to enhance CO2 fixation through the assimilation of nitrogen (Busch et al., 2018). A recent metabolomic analysis in maize suggested that photorespiratory intermediates may also provide this supporting role in C4 species (Medeiros et al., 2022).
Decoupling between electron transport and photosynthesis: Alternative electron sinks and BS leakiness
Particularly at the start of light induction, C3 and C4 species had significantly higher ΦPSII/ΦCO2 ratios (Figure 6) than during steady state measurements (Table 1), indicating less of the reducing power of the electron transport chain was going towards photosynthetic carbon fixation. This was particularly prominent in the C4 species, both in absolute values and relative to steady state, where C4 plants had either lower (C4 Alloteropsis and Flaveria) or equal (C4 Cleome) ΦPSII/ΦCO2 values compared to their C3 counterparts. The build-up of metabolite pools to establish sufficient concentration gradients between M and BS cells required for the efficient operation of C4 photosynthesis seems a likely contributing factor increasing ΦPSII/ΦCO2 ratios in C4 photosynthesis. However, the change in ratio could also be due to a variety of alternative electron sinks having greater presence during induction and drawing electrons away from the C3 cycle.
Not surprisingly, reductions in ΦPSII/ΦCO2 ratio under 2% O2 were observed in all C3 species as well as in C4 F. bidentis, showing the importance of photorespiration as an electron sink. Although a gradual decrease in ΦPSII/ΦCO2 across time was observed during induction in both Alloteropsis and Cleome C4 species (Figure 5), in contrast to C4 F. bidentis the temporal changes were not O2 sensitive. An alternative electron sink to photorespiration could be the Mehler reaction, which reduces O2 in the chloroplast to hydrogen peroxide and has been suggested to play a role in C3 and C4 photosynthesis (Sagun et al., 2021). Suppression of the Mehler reaction under 2% O2 could be consistent with the small reductions in CO2 assimilation observed in both Alloteropsis species and C3 T. hassleriana, as the Mehler reaction supports ATP formation and the activity of related enzymes has been found to increase when photosynthesis is impaired (Fryer et al., 1998). However, evidence to support a significant contribution of the Mehler reaction to high rates of photosynthesis in both C3 and C4 species is generally lacking (Driever and Baker, 2011).
A transient increase in BS leakiness could be an alternative contributing factor to the elevated energetic cost of CO2 assimilation during induction in C4 A. semialata and C4 G. gynandra that accounts for the lack of O2 sensitivity. A lag in activation of the C3 cycle following light exposure would result in an imbalance between the C3 and C4 cycles and greater leakage of CO2 from the BS due to the CCM over-pumping, reducing quantum efficiency by requiring more ATP per CO2 fixed (Kromdijk et al., 2014, Sage and McKown, 2006). Transient isotope discrimination measurements on sorghum and maize during the first 10 min following a step-increase in light intensity suggested that bundle sheath leakiness could be 60% higher than steady state (Kubásek et al., 2013; Wang et al., 2022) and remain elevated for up to 30 min. This seems consistent with the timing of the decrease in ΦPSII/ΦCO2 during induction in the Alloteropsis and Cleome C4 species. Thus, activation of CO2 assimilation in these species may be limited by activation of the C3 cycle, whereas the stable ΦPSII/ΦCO2 values in C4 F. bidentis under 2% O2 suggest C3 cycle activation is faster than the CCM in this species.
Conclusion
This study confirms C4 photosynthesis experiences greater lag than C3 photosynthesis during light induction – the greater depression of CO2 assimilation in C4 species was independently found in three evolutionary divergent comparisons of phylogenetically linked C3 and C4 species, providing experimental support for previous hypotheses and observations of less efficient photosynthetic induction in C4 photosynthesis (Sage and Mckown, 2006; Kubásek et al., 2013; Slattery et al., 2018; Li et al., 2021; Sales et al., 2021). Despite the generally slower induction of CO2 assimilation found in all C4 species in comparison to their C3 pairs, the underlying mechanisms to explain these differences were distinctly different – less effective suppression of photorespiration seemed to underlie the reduction in CO2 assimilation in C4 Flaveria whereas delayed activation of the C3 cycle appeared to be the limiting factor in C4 species in Alloteropsis and Cleome, where a potential supporting role for photorespiration in photosynthetic induction was also identified. The substantial variation observed between and across phylogenetic pairs during both steady state and light induction measurements underscores the crucial importance of controlling for evolutionary distance when studying differences between photosynthetic pathways.
Data availability statement
The raw data supporting the conclusions of this article will be made available by the authors, without undue reservation.
Author contributions
JK conceived the study. JK, LAC and ACB designed the experiments. LAC carried out all experiments, data analysis and interpretation, and drafted the manuscript. RLV helped with the 2% O2 experimental setup and provided support with gas exchange experiments. ELB procured the initial plant material. CRGS helped with data interpretation. All authors contributed to the article and approved the submitted version.
Funding
LAC was jointly funded by The Cambridge Commonwealth, European & International Trust; and by Mexico’s Consejo Nacional de Ciencia y Tecnología (CONACyT).
Acknowledgments
The authors wish to thank Dr. Pascal-Antoine Christin at The University of Sheffield, Dr. Marjorie Lundgren at Lancaster Environmental Centre, and Prof. Peter Westhoff at Heinrich Heine University Düsseldorf for providing A. semialata GMT and MDG accessions, F. cronquistii cuttings, and F. bidentis seeds, respectively. For the purpose of open access, the author has applied a Creative Commons Attribution (CC BY) license to any Author Accepted Manuscript version arising from this submission.
Conflict of interest
The authors declare that the research was conducted in the absence of any commercial or financial relationships that could be construed as a potential conflict of interest.
Publisher’s note
All claims expressed in this article are solely those of the authors and do not necessarily represent those of their affiliated organizations, or those of the publisher, the editors and the reviewers. Any product that may be evaluated in this article, or claim that may be made by its manufacturer, is not guaranteed or endorsed by the publisher.
Supplementary material
The Supplementary Material for this article can be found online at: https://www.frontiersin.org/articles/10.3389/fpls.2022.1091115/full#supplementary-material
References
Arrivault, S., Obata, T., Szecówka, M., Mengin, V., Guenther, M., Hoehne, M., et al. (2016). Metabolite pools and carbon flow during C4 photosynthesis in maize: 13CO2 labeling kinetics and cell type fractionation. J. Exp. Bot. 68, 283–298. doi: 10.1093/jxb/erw414
Bates, D., Mächler, M., Bolker, B., Walker, S. (2015). Fitting linear mixed-effects models using lme4. J. Stat. Software 67, 1–48. doi: 10.18637/jss.v067.i01
Bräutigam, A., Kajala, K., Wullenweber, J., Sommer, M., Gagneul, D., Weber, K. L., et al. (2010). An mRNA blueprint for C4 photosynthesis derived from comparative transcriptomics of closely related C3 and C4 species. Plant Physiol. 155, 142–156. doi: 10.1104/pp.110.159442
Busch, F. A., Sage, R. F., Farquhar, G. D. (2018). Plants increase CO2 uptake by assimilating nitrogen via the photorespiratory pathway. Nat. Plants 4, 46–54. doi: 10.1038/s41477-017-0065-x
Christin, P.-A., Osborne, C. P., Sage, R. F., Arakaki, M., Edwards, E. J. (2011). C4 eudicots are not younger than C4 monocots. J. Exp. Bot. 62, 3171–3181. doi: 10.1093/jxb/err041
Dietz, K.-J. (1985). A possible rate-limiting function of chloroplast hexosemonophosphate isomerase in starch synthesis of leaves. Biochim. Biophys. Acta (BBA) - Gen. Subj. 839, 240–248. doi: 10.1016/0304-4165(85)90004-2
Driever, S. M., Baker, N. R. (2011). The water-water cycle in leaves is not a major alternative electron sink for dissipation of excess excitation energy when CO2 assimilation is restricted. Plant Cell Environ. 34, 837–846. doi: 10.1111/j.1365-3040.2011.02288.x
FAO (2020). “Production, trade and prices of commodities,” in World food and agriculture - statistical yearbook 2020 (Rome, Italy: FAO).
Fryer, M. J., Andrews, J. R., Oxborough, K., Blowers, D. A., Baker, N. R. (1998). Relationship between CO2 assimilation, photosynthetic electron transport, and active O2 metabolism in leaves of maize in the field during periods of low temperature. Plant Physiol. 116, 571–580. doi: 10.1104/pp.116.2.571
Fu, X., Walker, B. J. (2022). Dynamic response of photorespiration in fluctuating light environments. J. Exp. Botany. doi: 10.1093/jxb/erac335
Genty, B., Briantais, J.-M., Baker, N. R. (1989). The relationship between the quantum yield of photosynthetic electron transport and quenching of chlorophyll fluorescence. Biochim. Biophys. Acta (BBA) - Gen. Subj. 990, 87–92. doi: 10.1016/S0304-4165(89)80016-9
Gowik, U., Bräutigam, A., Weber, K. L., Weber, A. P. M., Westhoff, P. (2011). Evolution of C4 photosynthesis in the genus Flaveria: How many and which genes does it take to make C4? Plant Cell 23, 2087–2105. doi: 10.1105/tpc.111.086264
Hatch, M., Kagawa, T., Craig, S. (1975). Subdivision of C4-pathway species based on differing C4 acid decarboxylating systems and ultrastructural features. Funct. Plant Biol. 2, 111–128. doi: 10.1071/PP9750111
Ibrahim, D. G., Burke, T., Ripley, B. S., Osborne, C. P. (2009). A molecular phylogeny of the genus Alloteropsis (Panicoideae, Poaceae) suggests an evolutionary reversion from C4 to C3 photosynthesis. Ann. Bot. 103, 127–136. doi: 10.1093/aob/mcn204
Ishikawa, N., Takabayashi, A., Sato, F., Endo, T. (2016). Accumulation of the components of cyclic electron flow around photosystem I in C4 plants, with respect to the requirements for ATP. Photosynthesis Res. 129, 261–277. doi: 10.1007/s11120-016-0251-0
Jawień, W. (2014). Searching for an optimal AUC estimation method: a never-ending task? J. Pharmacokinet. Pharmacodynamics 41, 655–673. doi: 10.1007/s10928-014-9392-y
Kok, B. (1949). On the interrelation of respiration and photosynthesis in green plants. Biochimica et Biophysica Acta 3, 625–631. doi: 10.1016/0006-3002(49)90136-5
Kozaki, A., Takeba, G. (1996). Photorespiration protects C3 plants from photooxidation. Nature 384, 557–560. doi: 10.1038/384557a0
Krall, J. P., Edwards, G. E. (1990). Quantum yields of photosystem II electron transport and carbon dioxide fixation in C4 plants. Aust. J. Plant Physiol. 17, 579–588. doi: 10.1071/PP9900579
Kromdijk, J., Griffiths, H., Schepers, H. E. (2010). Can the progressive increase of C4 bundle sheath leakiness at low PFD be explained by incomplete suppression of photorespiration? Plant Cell Environ. 33, 1935–1948. doi: 10.1111/j.1365-3040.2010.02196.x
Kromdijk, J., Ubierna, N., Cousins, A. B., Griffiths, H. (2014). Bundle-sheath leakiness in C4 photosynthesis: a careful balancing act between CO2 concentration and assimilation. J. Exp. Bot. 65, 3443–3457. doi: 10.1093/jxb/eru157
Kubásek, J., Urban, O., Šantrůček, J. (2013). C4 plants use fluctuating light less efficiently than do C3 plants: a study of growth, photosynthesis and carbon isotope discrimination. Physiologia Plantarum 149, 528–539. doi: 10.1111/ppl.12057
Kuznetsova, A., Brockhoff, P. B., Christensen, R. H. B. (2017). lmerTest package: Tests in linear mixed effects models. J. Stat. Software 821–26. doi: 10.18637/jss.v082.i13
Lee, M. S., Boyd, R. A., Ort, D. R. (2022). The photosynthetic response of C3 and C4 bioenergy grass species to fluctuating light. GCB Bioenergy 14, 37–53. doi: 10.1111/gcbb.12899
Leegood, R. C. (2002). C4 photosynthesis: principles of CO2 concentration and prospects for its introduction into C3 plants. J. Exp. Bot. 53, 581–590. doi: 10.1093/jexbot/53.369.581
Leegood, R. C., Furbank, R. T. (1984). Carbon metabolism and gas exchange in leaves of Zea mays l. Planta 162, 450–456. doi: 10.1007/BF00393458
Li, Y.-T., Luo, J., Liu, P., Zhang, Z.-S. (2021). C4 species utilize fluctuating light less efficiently than C3 species. Plant Physiol. 187, 1288–1291. doi: 10.1093/plphys/kiab411
Loriaux, S. D., Avenson, T. J., Welles, J. M., Mcdermitt, D. K., Eckles, R. D., Riensche, B., et al. (2013). Closing in on maximum yield of chlorophyll fluorescence using a single multiphase flash of sub-saturating intensity. Plant Cell Environ. 36, 1755–1770. doi: 10.1111/pce.12115
Lundgren, M. R., Besnard, G., Ripley, B. S., Lehmann, C. E. R., Chatelet, D. S., Kynast, R. G., et al. (2015). Photosynthetic innovation broadens the niche within a single species. Ecol. Lett. 18, 1021–1029. doi: 10.1111/ele.12484
Lyu, M.-J. A., Gowik, U., Kelly, S., Covshoff, S., Mallmann, J., Westhoff, P., et al. (2015). RNA-Seq based phylogeny recapitulates previous phylogeny of the genus flaveria (Asteraceae) with some modifications. BMC Evolutionary Biol. 15, 116. doi: 10.1186/s12862-015-0399-9
Makowski, D., Ben-Shachar, M. S., Lüdecke, D. (2019). bayestestR: Describing effects and their uncertainty, existence and significance within the Bayesian framework. J. Open Source Software 4, 40. doi: 10.21105/joss.01541
McAusland, L., Vialet-Chabrand, S., Davey, P., Baker, N. R., Brendel, O., Lawson, T. (2016). Effects of kinetics of light-induced stomatal responses on photosynthesis and water-use efficiency. New Phytol. 211, 1209–1220. doi: 10.1111/nph.14000
McClain, A. M., Sharkey, T. D. (2019). Triose phosphate utilization and beyond: from photosynthesis to end product synthesis. J. Exp. Bot. 70, 1755–1766. doi: 10.1093/jxb/erz058
Medeiros, D. B., Ishihara, H., Guenther, M., Rosado De Souza, L., Fernie, A. R., Stitt, M., et al. (2022). 13CO2 labeling kinetics in maize reveal impaired efficiency of C4 photosynthesis under low irradiance. Plant Physiol. 190, 280–304. doi: 10.1093/plphys/kiac306
Mott, K. A., Woodrow, I. E. (2000). Modelling the role of rubisco activase in limiting non-steady-state photosynthesis. J. Exp. Bot. 51, 399–406. doi: 10.1093/jexbot/51.suppl_1.399
Oberhuber, W., Edwards, G. E. (1993). Temperature dependence of the linkage of quantum yield of photosystem II to CO2 fixation in C4 and C3 plants. Plant Physiol. 101, 507–512. doi: 10.1104/pp.101.2.507
Ozeki, K., Miyazawa, Y., Sugiura, D. (2022). Rapid stomatal closure contributes to higher water use efficiency in major C4 compared to C3 Poaceae crops. Plant Physiol. 189, 188–203. doi: 10.1093/plphys/kiac040
Pearcy, R. W. (1990). Sunflecks and photosynthesis in plant canopies. Annu. Rev. Plant Physiol. Plant Mol. Biol. 41, 421–453. doi: 10.1146/annurev.pp.41.060190.002225
Pearcy, R. W., Seemann, J. R. (1990). Photosynthetic induction state of leaves in a soybean canopy in relation to light regulation of ribulose-1-5-Bisphosphate carboxylase and stomatal conductance. Plant Physiol. 94, 628–633. doi: 10.1104/pp.94.2.628
R Core Team (2021). R: A language and environment for statistical computing (Vienna, Austria: R Foundation for Statistical Computing).
Sage, R. F. (2004). The evolution of C4 photosynthesis. New Phytol. 161, 341–370. doi: 10.1111/j.1469-8137.2004.00974.x
Sage, R. F., McKown, A. D. (2006). Is C4 photosynthesis less phenotypically plastic than C3 photosynthesis? J. Exp. Bot. 57, 303–317. doi: 10.1093/jxb/erj040
Sagun, J. V., Badger, M. R., Chow, W. S., Ghannoum, O. (2021). Mehler reaction plays a role in C3 and C4 photosynthesis under shade and low CO2. Photosynthesis Res. 149, 171–185. doi: 10.1007/s11120-021-00819-1
Sales, C. R. G., Wang, Y., Evers, J. B., Kromdijk, J. (2021). Improving C4 photosynthesis to increase productivity under optimal and suboptimal conditions. J. Exp. Bot. 72, 5942–5960. doi: 10.1093/jxb/erab327
Sassenrath-Cole, G. F., Pearcy, R. W. (1992). The role of ribulose-1,5-Bisphosphate regeneration in the induction requirement of photosynthetic CO2 exchange under transient light conditions. Plant Physiol. 99, 227–234. doi: 10.1104/pp.99.1.227
Schlüter, U., Weber, A. P. M. (2020). Regulation and evolution of C4 photosynthesis. Annu. Rev. Plant Biol. 71, 183–215. doi: 10.1146/annurev-arplant-042916-040915
Sharkey, T. D. (1985). O2-insensitive photosynthesis in C3 plants: its occurrence and a possible explanation. Plant Physiol. 78, 71–75. doi: 10.1104/pp.78.1.71
Shi, D., Li, J., Li, Y., Li, Y., Xie, L. (2021). The complete chloroplast genome sequence of Gynandropsis gynandra (Cleomaceae). Mitochondrial 6 (7), 1909–1910. doi: 10.1080/23802359.2021.1935339
Slattery, R. A., Walker, B. J., Weber, A. P. M., Ort, D. R. (2018). The impacts of fluctuating light on crop performance. Plant Physiol. 176, 990–1003. doi: 10.1104/pp.17.01234
Still, C. J., Berry, J. A., Collatz, G. J., Defries, R. S. (2003). Global distribution of C3 and C4 vegetation: Carbon cycle implications. Global Biogeochemical Cycles 17, 6–1-6-14. doi: 10.1029/2001gb001807
Stinziano, J. R., Roback, C., Sargent, D., Murphy, B. K., Hudson, P. J., Muir, C. D. (2021). Principles of resilient coding for plant ecophysiologists. AoB PLANTS 13. doi: 10.1093/aobpla/plab059
Stitt, M., Zhu, X.-G. (2014). The large pools of metabolites involved in intercellular metabolite shuttles in C4 photosynthesis provide enormous flexibility and robustness in a fluctuating light environment. Plant Cell Environ. 37, 1985–1988. doi: 10.1111/pce.12290
Taylor, S. H., Hulme, S. P., Rees, M., Ripley, B. S., Ian Woodward, F., Osborne, C. P. (2010). Ecophysiological traits in C3 and C4 grasses: a phylogenetically controlled screening experiment. New Phytol. 185, 780–791. doi: 10.1111/j.1469-8137.2009.03102.x
Ueno, O., Sentoku, N. (2006). Comparison of leaf structure and photosynthetic characteristics of C3 and C4 Alloteropsis semialata subspecies. Plant Cell Environ. 29, 257–268. doi: 10.1111/j.1365-3040.2005.01418.x
Usuda, H. (1985). Changes in levels of intermediates of the C4 cycle and reductive pentose phosphate pathway during induction of photosynthesis in maize leaves. Plant Physiol. 78, 859–864. doi: 10.1104/pp.78.4.859
Wang, Y., Bräutigam, A., Weber, A. P. M., Zhu, X.-G. (2014a). Three distinct biochemical subtypes of C4 photosynthesis? A modelling analysis. J. Exp. Bot. 65, 3567–3578. doi: 10.1093/jxb/eru058
Wang, C., Guo, L., Li, Y., Wang, Z. (2012). Systematic comparison of C3 and C4 plants based on metabolic network analysis. BMC Syst. Biol. 6, S9. doi: 10.1186/1752-0509-6-S2-S9
Wang, Y., Long, S. P., Zhu, X. G. (2014b). Elements required for an efficient NADP-malic enzyme type C4 photosynthesis. Plant Physiol. 164, 2231–2246. doi: 10.1104/pp.113.230284
Wang, Y., Stutz, S. S., Bernacchi, C. J., Boyd, R. A., Ort, D. R., Long, S. P. (2022). Increased bundle-sheath leakiness of CO2 during photosynthetic induction shows a lack of coordination between the C4 and C4 cycles. New Phytol. 236, 1661–1675. doi: 10.1111/nph.18485
Way, D. A., Katul, G. G., Manzoni, S., Vico, G. (2014). Increasing water use efficiency along the C3 to C4 evolutionary pathway: a stomatal optimization perspective. J. Exp. Bot. 65, 3683–3693. doi: 10.1093/jxb/eru205
Weber, A. P., Von Caemmerer, S. (2010). Plastid transport and metabolism of C3 and C4 plants–comparative analysis and possible biotechnological exploitation. Curr. Opin. Plant Biol. 13, 257–265. doi: 10.1016/j.pbi.2010.01.007
Wickham, H., Averick, M., Bryan, J., Chang, W., Mcgowan, L., François, R., et al. (2019). Welcome to the tidyverse. J. Open Source Software 4, 1686. doi: 10.21105/joss.01686
Yin, X., Struik, P. C. (2018). The energy budget in C4 photosynthesis: insights from a cell-type-specific electron transport model. New Phytol. 218, 986–998. doi: 10.1111/nph.15051
Yin, X., Struik, P. C. (2021). Exploiting differences in the energy budget among C4 subtypes to improve crop productivity. New Phytol. 229, 2400–2409. doi: 10.1111/nph.17011
Zelitch, I., Schultes, N. P., Peterson, R. B., Brown, P., Brutnell, T. P. (2009). High glycolate oxidase activity is required for survival of maize in normal air. Plant Physiol. 149, 195–204. doi: 10.1104/pp.108.128439
Keywords: C4 photosynthesis, C3 photosynthesis, photosynthetic induction, CO2 assimilation, photorespiration, non-steady state, light response
Citation: Arce Cubas L, Vath RL, Bernardo EL, Sales CRG, Burnett AC and Kromdijk J (2023) Activation of CO2 assimilation during photosynthetic induction is slower in C4 than in C3 photosynthesis in three phylogenetically controlled experiments. Front. Plant Sci. 13:1091115. doi: 10.3389/fpls.2022.1091115
Received: 06 November 2022; Accepted: 05 December 2022;
Published: 04 January 2023.
Edited by:
Shizue Matsubara, Forschungszentrum Jülich, GermanyReviewed by:
Daisuke Sugiura, Nagoya University, JapanBerkley James Walker, Michigan State University, United States
Copyright © 2023 Arce Cubas, Vath, Bernardo, Sales, Burnett and Kromdijk. This is an open-access article distributed under the terms of the Creative Commons Attribution License (CC BY). The use, distribution or reproduction in other forums is permitted, provided the original author(s) and the copyright owner(s) are credited and that the original publication in this journal is cited, in accordance with accepted academic practice. No use, distribution or reproduction is permitted which does not comply with these terms.
*Correspondence: Johannes Kromdijk, Wannekromdijk@gmail.com