 Xiao Zhou
 Zhen Li1,2
 Ram P. Sharma
- 1International Center for Bamboo and Rattan, Key Laboratory of National Forestry and Grassland Administration, Beijing, China
- 2National Location Observation and Research Station of the Bamboo Forest Ecosystem in Yixing, National Forestry and Grassland Administration, Yixing, China
- 3Institute of Forestry, Tribhuwan University, Kritipur, Kathmandu, Nepal
Bamboo crown width (CW) is a reliable index for evaluating growth, yield, health and vitality of bamboo, and light capture ability and carbon fixation efficiency of bamboo forests. Based on statistical results produced from fitting the eight basic growth functions using data from 1374 Phyllostachys pubescens in Yixing, Jiangsu Province, China, this study identified the most suitable function (logistic function) to construct a two-level mixed effects (NLME) CW model with the forest block and sample plot-level effects included as random effects in the model. Four methods for selecting sample bamboos per sample plot (largest bamboo, medium-sized bamboo, smallest bamboo, and randomly selected bamboos) and eight sample sizes (1–8 selected bamboos per sample plot) were evaluated to calibrate our NLME CW model. Using diameter at breast height (DBH), height to crown base (HCB), arithmetic mean diameter at breast height (MDBH), and height (H) as predictor variables, the model produced the best fit statistics (Max R2, min RMSE, and TRE). This model was further improved by introducing random effects at two levels. The results showed a positive correlation of CW with HCB and DBH and a negative correlation with H. The smallest two bamboo poles per sample plot used to estimate the random effects of the NLME model provided a satisfactory compromise regarding measurement cost, model efficiency, and prediction accuracy. The presented NLME CW model may guide effective management and carbon estimation of bamboo forests.
1 Introduction
Tree crowns represent a crucial site for material exchanges and energy conversions between forests and the environment (Fu et al., 2017a; Fu et al., 2017b; Lei et al., 2018; Pan et al., 2020). Variables related to tree crowns are important predictors of forestry models, including those for crown length (Tahvanainen and Forss, 2008; Fu et al., 2017a; Fu et al., 2017b; Fu et al., 2017c), crown length to tree height ratio (Tahvanainen and Forss, 2008; Leites et al., 2009; Fu et al., 2015), height to crown base (HCB) (Fu et al., 2017c; Yang et al., 2020; Pan et al., 2020; Zhou et al., 2022), and crown width (CW) (Bragg, 2001; Sánchez-González et al., 2007; Stephanie and Stephen, 2011; Ma et al., 2022). CW, which is half of the sum of crown radii and is measured in four directions of south, east, north, and west (Fu et al., 2017b; Fu et al., 2013; Paulo et al., 2015; Fu et al., 2017a; Lei et al., 2018) reflects the vitality and competitiveness of plants. Analyzing CW and understanding its relations to other factors will enable predicting crown productivity (Larocque and Marshall, 1994), forest mortality (Monserud and Sterba, 1996), and forest biomass (Horntvedt, 1993; Hoffmann and Usoltsev, 2002). Crown diameter is also an important parameter for stand visualization (Lei et al., 2006). Detailed information on tree crowns can assist the management of ecosystem characteristics, such as forest productivity, biodiversity, and wildlife habitats.
Despite these benefits, measuring the CW of each tree in all sample plots is time-consuming, laborious, and costly (Bragg, 2001; Buchacher and Ledermann, 2020). CW measurements of representative sample trees per sample plot from an adequate number of sample plots allocated across forests are necessary to build high-precision CW models.
Early studies on applying the CW model used the diameter at breast height (DBH) as a predictor (Hetherington, 1967). Today, researchers prefer to add additional factors to the CW model to reduce potential bias. These factors may include tree size and stand vitality (e.g., stand age, stand density, canopy density, tree height, HCB), site quality (site index), stand competition factors (Fu and Sun, 2013; Fu et al., 2013; Ma et al., 2022) and other environmental factors such as slope, direction, and location (Zarnoch et al., 2004 ;Fu et al., 2017b; Fu et al., 2017c; Fu and Sun, 2013; Fu et al., 2013; Fu et al., 2017a; Lei et al., 2018).
CW data needed to build CW models are often acquired from varying growth conditions within different forest stands, which creates nested conditions. Thus, similar to other tree attribute data, CW data are more or less hierarchically structured, and observations are most likely correlated with each other. Using ordinary least squares (OLS) regression to estimate the CW models with the nested data structure will lead to a significant bias (West et al., 1984; Zhang et al., 2017). Mixed-effects modeling, which effectively addresses the aforementioned observation dependence [the data are hierarchically structured (a sample plot nested in the blocks)] problems, must be applied to reduce potential bias (Fu et al., 2013; Yang et al., 2020; Pan et al., 2020; Zhou et al., 2021a; Zhou et al., 2021b; Ma et al., 2022). Mixed-effects modeling accounts for most of the heterogeneity and randomness caused by known or unknown factors. Mixed-effects models demonstrate a promising flexibility because only the fixed effect part [M response model (without random effects)] or both fixed and random effects parts following response calibration can be applied (Fu et al., 2017c; Fu et al., 2013; Yang et al., 2020; Zhou et al., 2021a). Most CW models have been based on data from tree species (Fu and Sun, 2013; Fu et al., 2013; Fu et al., 2017c; Lei et al., 2018; Ma et al., 2022). However, bamboo CW modeling is limited.
Because of the global climate warming, the concentration of carbon dioxide in the atmosphere has reached the highest level of 410 ppm (Masson-Delmotte et al., 2021), carbon sequestration by growing forests is a cost-effective option for mitigating CO2 emission caused by human activities. Thus, the carbon cycle remains an important topic worldwide for research, and all green plants, including bamboo, play major roles for carbon storage. Although the world’s forest area has decreased continuously over the past 30 years, the planet’s bamboo forest area has increased by an average annual rate of 3% (FAO, 2010). Bamboo is an important carbon sink that can accumulate a large amount of carbon in a short period (Yen and Lee, 2011; Yen, 2016). Because bamboo forests are important in mitigating climate warming, the relationships between bamboo CW and various factors that influence CW should be investigated.
Based on existing research problems such as the absence of bamboo CW modeling, a hierarchical data structure, and correlations among the observations, we used Phyllostachys edulis (moso bamboo) as a target species in this study to (1) develop a two-level nonlinear mixed-effects (NLME) CW model (NLME model) through including multiple factors as predictor variables, (2) simulate the impacts of those factors on CW, and (3) select the optimal strategy to predict the random effects in the response calibration of the NLME CW model. The NLME CW model presented in this study can reduce the time and cost of CW measurements and help formulate bamboo forest management plans.
2 Materials and methods
2.1 Study area and data collection
The study area is located in Yixing State, Forest Farm, Jiangsu Province (Figure 1). This transitional zone is a typical representation of the northern subtropical bioclimate, Jiangnan bamboo area, and scattered bamboo area. The forest farm has a subtropical monsoon climate, with high and low temperatures of 38.8 and -4.5 °C, respectively, an average annual temperature of 16.5 °C, and an average annual precipitation of 1229.9 mm. The main tree species on forest farms are Cunninghamia lanceolata (Lamb.) Hook., Pinus massoniana (Lamb.) var. massoniana, Parrotia subaequalis (H. T. Chang) R. M. Hao & H. T. Wei, and Camellia japonica (L.).
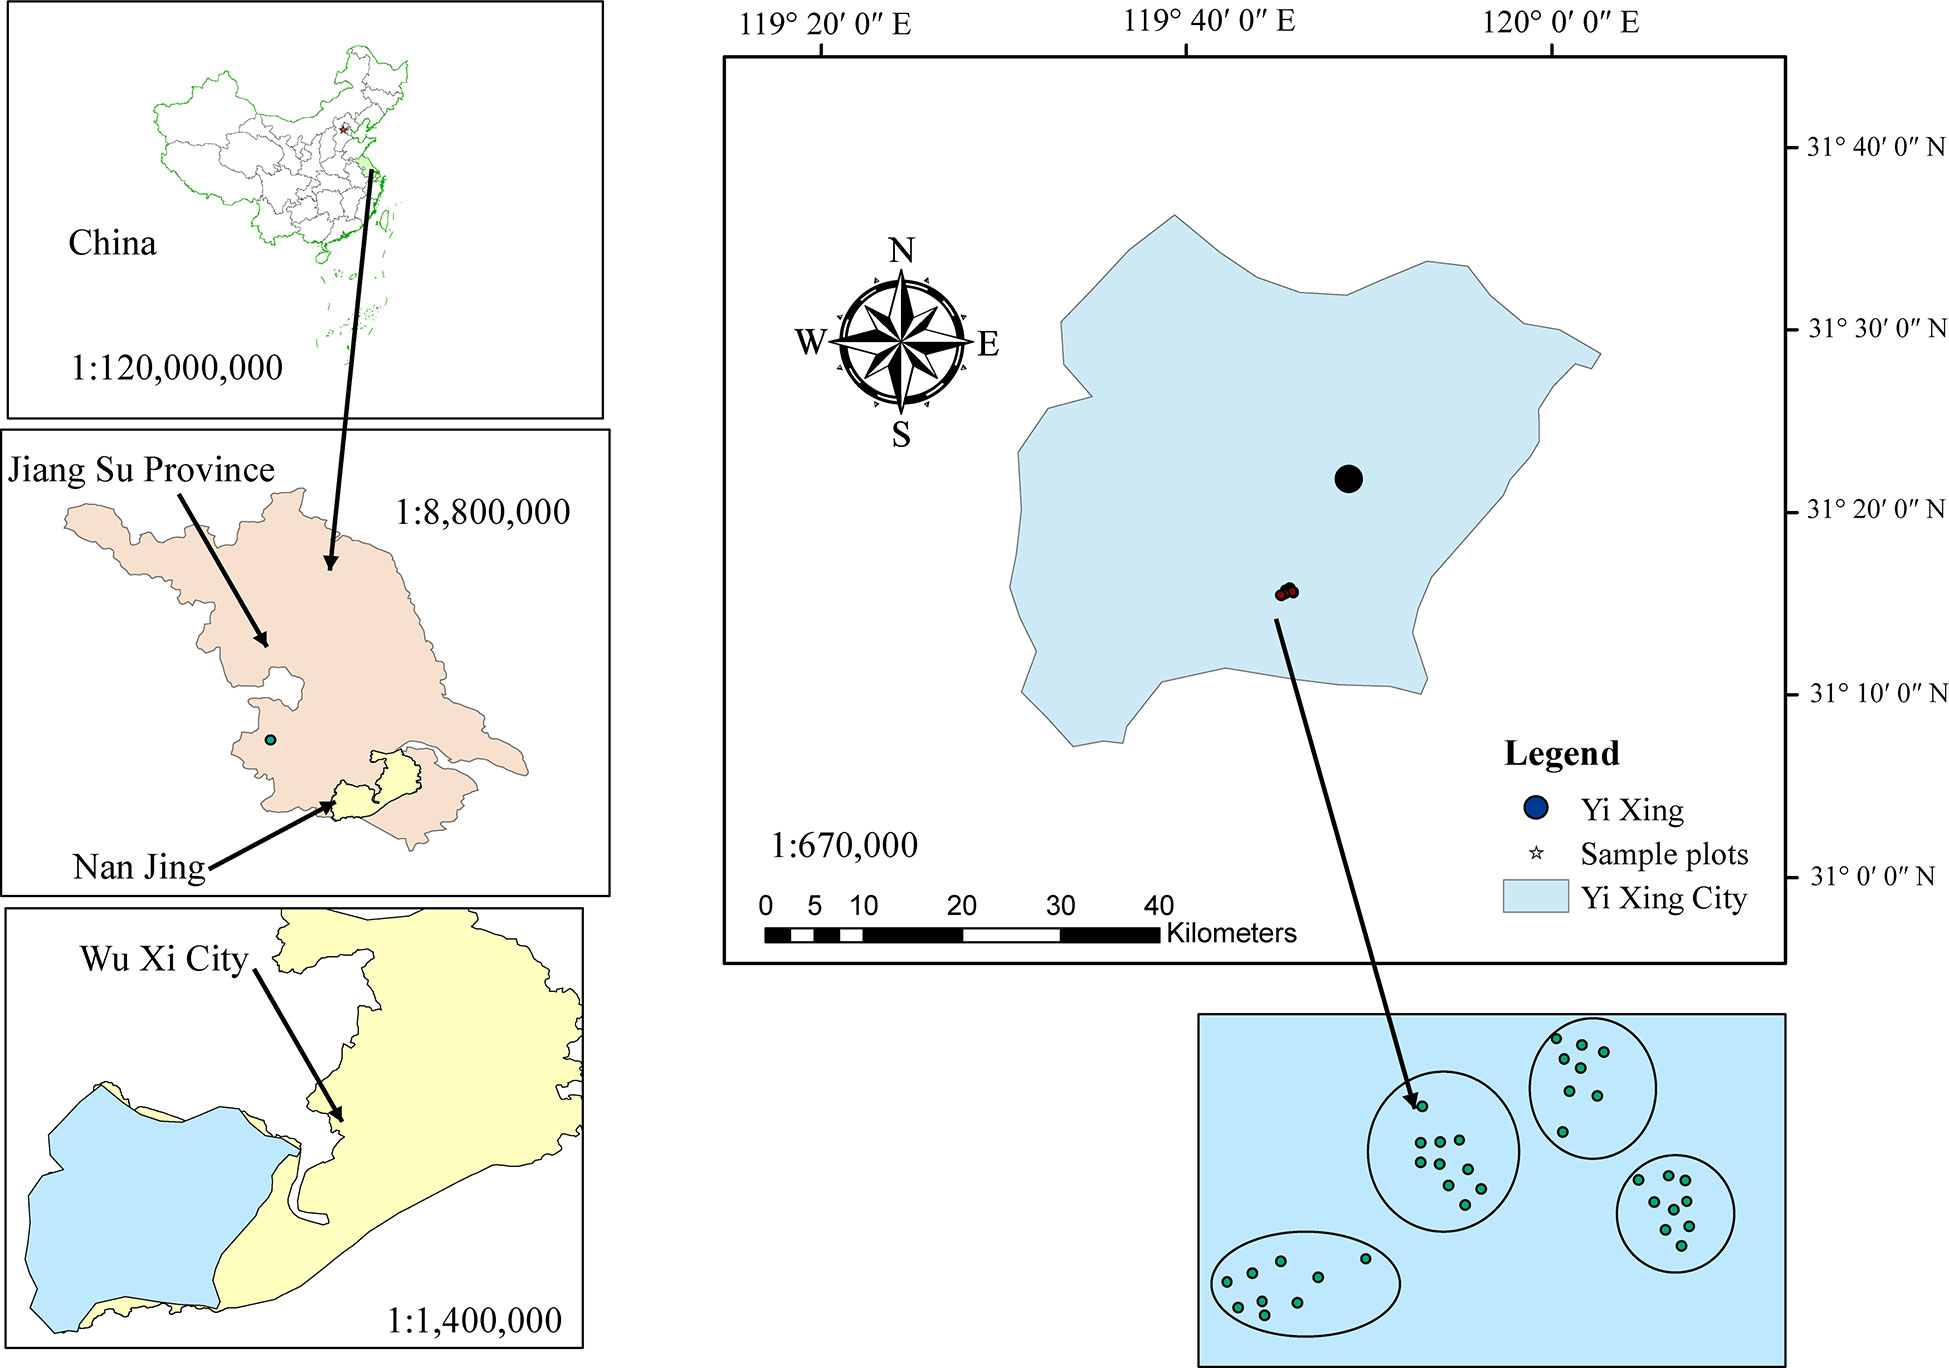
Figure 1 Location of the study area.
We used 35 temporary sample plots data of Phyllostachys edulis (moso bamboo) forests in Yixing Forestry Farm, Jiangsu Province. Each sample plot was 20 × 20 m (Figure 1). In July 2022, a total of 1,374 bamboo samples were collected from 4 blocks and 35 sample plots (Table 1). The diameter at breast height (DBH), total height (H), HCB (the height from the ground to the base of the first normal green branch as a part of the crown, excluding secondary branches, i.e., epicormic and adventitious), and CW in four perpendicular directions (CWS, south; CWN, north; CWW, west; CWE, east) of all living bamboos with a DBH > 5 cm were measured. Each component of the bamboo crown was measured as the horizontal distance from the center of the bamboo stem to the maximum range of the bamboo crown (Marshall et al., 2003). The CW was measured using a horizontal rangefinder and the average CW was calculated as follows: (CWS + CWN + CWE + CWW)/2. DBH measurements were performed using a diameter tape, and an ultrasonic altimeter was used to measure H and HCB. The canopy density (CD) was measured using fisheye lenses. Because of the unique growth characteristics of moso bamboo forests with a vegetative cycle of 2 years (on- and off-year), stand age was expressed as “du” (Tang et al., 2016). One “du” (I) represents 1–2 years, and 2 and 3 “du” (II and III) correspond to 3–4 and 5–6 years, respectively (Tang et al., 2016). Based on the locations of the sample plots and the growth status of forests on slope and direction, we grouped the sample plots into four blocks according to their slopes (Table 1). Data from the bamboo individuals and stand factors investigated are summarized in Table 2.
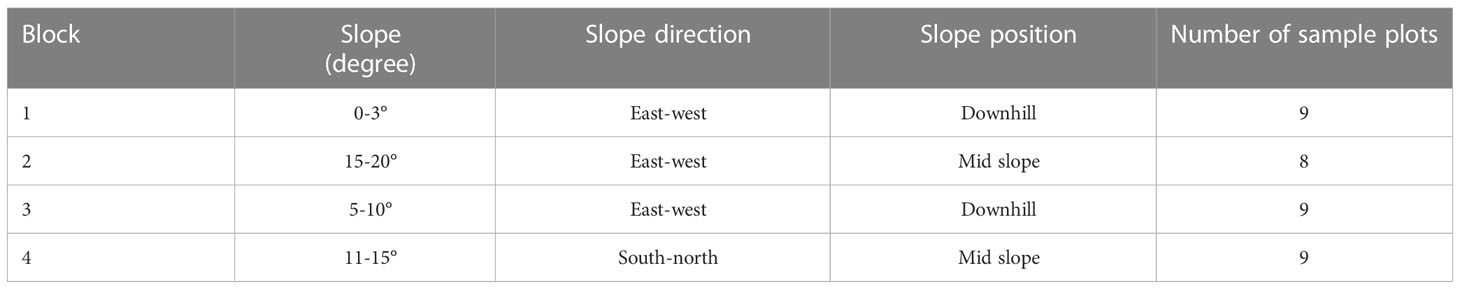
Table 1 Division of bamboo forest area into four blocks and number of sample plots in each block.
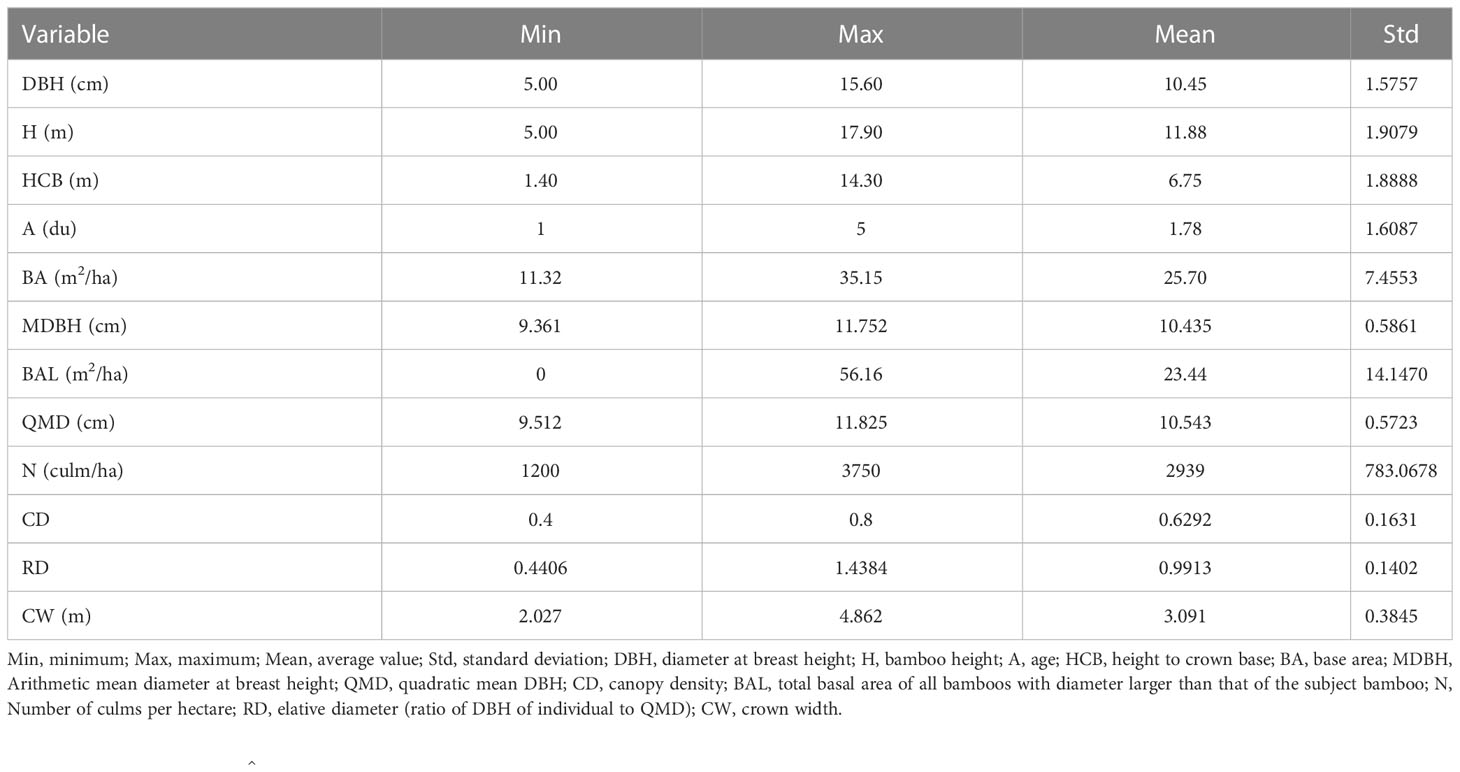
Table 2 Summary measurements of bamboo forest characteristics.
2.2 CW models
2.2.1 Base function
In bamboo forests, DBH comprises an important factor reflecting the growth of bamboo forests. DBH measurements are accurate and represent a relatively reliable variable in bamboo forest surveys. Our analysis started by fitting the eight commonly used forest growth functions (Table 3) to the data and choosing the best performing function based on major statistical indicators (Eqs. 9–12). The best fit function was then used for further extension and evaluation.
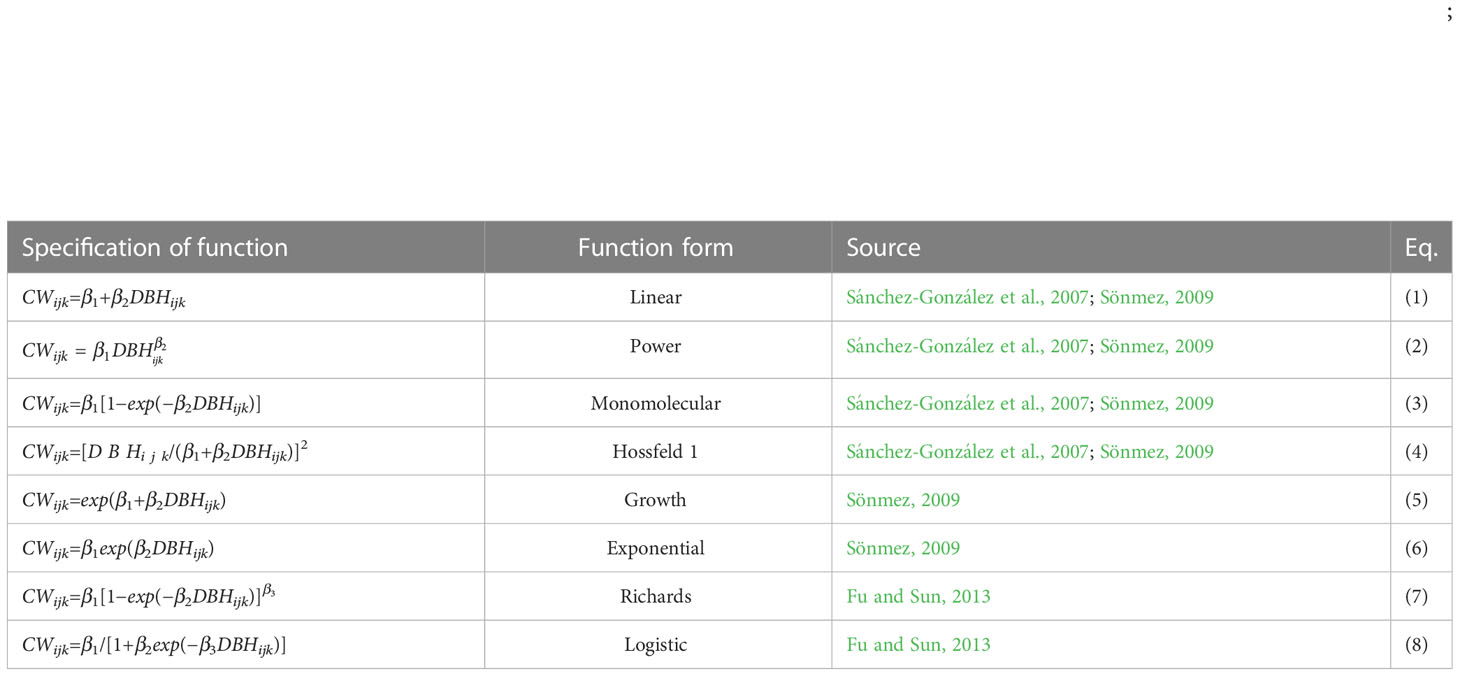
Table 3 Form of the base functions. CWijk is the crown width of the k bamboo in the j sample plot in the i block, DBH is the diameter at breast height of the k bamboo in the j sample plot in the i block, β1−β3 : model parameters.
Four statistical indicators (MD, mean residual error; R2, coefficient of determination; TRE, total relative error; and RMSE, root mean square error; Eqs. 9–12), commonly used to evaluate the fitting behavior of models, were considered.
where CWijk and are the measured and predicted CW for the k bamboo in the j sample plot in the i block, respectively, and n represents the number of CW observations.
2.2.2 Factors affecting CW
In addition to DBH, other factors may significantly influence CW and are related to stand variables, such as bamboo size and stand vitality, site, and competition factors (Sánchez-González et al., 2007; Sönmez, 2009; Fu et al., 2013). Thus, we evaluated the impact of 12 variables on CW: total height (H), HCB, stand density (N), CD, base area (BA) (bamboo size and stand vitality variables), arithmetic mean diameter at breast height (MDBH), quadratic mean diameter at breast height (QMD), the total base area of all bamboo with diameters larger than that of the tested bamboo (BAL), relative diameter (RD, ratio of individual DBH to DBH), slope, slope position, and humus thickness (site condition factor).
We used graphical analyses and relevant statistical tests to select significantly influencing variables (Uzoh and Oliver, 2008). RMSE (Eq. 12) and Akaike Information Criterion (AIC) were used to evaluate different combinations and logarithmic transformations of the variables and identify the significant variables. We used the R nls function for fitting the models and selected the optimal model, which was then used to construct a two-level NLME CW model.
2.2.3 Two-level NLME CW model
In the optimal model selected above, random effects were introduced at the block and sample plot levels. The model with the smallest AIC and largest log likelihood was selected for further analysis (Yang et al., 2009). The likelihood ratio test was used to avoid over-parametrization (Fang and Bailey, 2001). We reduced the heteroscedasticity problem using the variance function in the NLME CW model. Three variance-stabilizing functions were evaluated: the exponential (Eq. 13), power (Eq. 14), and constant plus power functions (Eq. 15) (Davidian and Giltinan, 1995; Pinheiro and Bates, 2000). We included the best-performing model in the final model. We used the AIC and likelihood ratio test to select the best-performing function (Pinheiro and Bates, 2000; Fang and Bailey, 2001).
where MDBHij is the arithmetic mean diameter at breast height (MDBH) of the j sample plot in the i block and γ, γ1, and γ2 are parameters to be estimated. σ is the residual variance of the CW model.
2.3 Parameter estimation
All basic models were estimated using the R nls function, and the NLME CW model was estimated using the nlme function (Lindstrom and Bates, 1990; Pinheiro and Bates, 2000). The fitted model variants were evaluated using the major statistical indicators (Eq. 9–12).
2.4 Model prediction
The optimal NLME CW model selected above was used for predictions, with and without the random effects considered. The former and latter models are called the M-response model and localized model, respectively; the latter is response calibrated with the local measurements (before the measurement of a response variable, in our case, CW) (Calama and Montero, 2004; Yang et al., 2009). We applied the empirical best linear unbiased prediction (EBLUP) to estimate the random effects and response calibration of the NLME CW model.
Where is the estimated random effect for the i sample plot (i = 1,…M); f(·) is the NLME CW model; is the vector of the fixed effects β ; xi is the vector of the predictor variables; is the estimated variance-covariance matrix for the random effects ui (i = 1,… M); is the estimated variance-covariance matrix of the errors ei ei ; and Zi is the f(·) ni×q design matrix of the partial derivatives of the estimated NLME CW model f(·) ui with respect to the random effects ui . The EBLUP theory was applied to estimate random effects (Meng and Huang, 2009; Fu et al., 2017a).
2.5 Prior measurement strategy
The mixed-effects model estimates the random effects and response calibration using single or multiple samples measured in each sample plot. Various sampling methods affect the random effects differently, thereby affecting the prediction accuracy of the NLME CW model. A few studies have evaluated the number of sample trees necessary to predict the random effects of NLME CW models and suggest the optimal numbers (Fu et al., 2013; Fu et al., 2015; Fu et al., 2017a). However, based on our broad literature review, no study of a similar type has been conducted on bamboo forests. Therefore, to evaluate the variability of bamboo CW, we used the following sampling methods and identified the optimal strategy:
(1) 1–8 randomly selected bamboo(s) per sample plot;
(2) 1–8 bamboo(s) with the largest DBH per sample plot;
(3) 1–8 bamboo(s) with average DBH per sample plot, and
(4) 1–8 bamboo(s) with the smallest DBH per sample plot.
The RMSE and TRE statistics were used to evaluate the prediction performance of the various sampling methods, and each sampling method was repeated 100 times to obtain the average statistics.
We used a three-step iterative algorithm proposed by Meng and Huang (2009) that involves computing random effects at the block and sample plot levels to calibrate the two-level NLME CW model (Meng and Huang, 2009). The first step is obtaining the initial (approximate) prediction of the random effects. The second step is updating the estimation of the random effect values by adding the estimated values of the model fitting parameters. The third step is the repetition of Step 2 until the required accuracy is obtained using iteration k. The precision was and is the estimated value of random effect). The computational process was implemented in R software (version 3.4.2) using the nlme function. Details on this process are available in modeling studies (e.g., Meng and Huang, 2009, Fu et al., 2017a).
2.6 Model evaluation
The effectiveness of the NLME CW model can be evaluated using an independent dataset. However, this data acquisition method would be laborious and limited. Therefore, this study employed leave-one-out cross-validation (LOOCV) to validate the CW model. One sample plot was removed each time, and the remaining sample plot data were used to fit the model. This step was repeated 35 times. Next, the average statistical indicators (Eqs. 9–12) were calculated using the difference between the predicted and observed CW values.
3 Results
We evaluated the model fitting performance using the LOOCV method. Model 8 (logistic form) showed relatively better fit statistics (Table 4) (Eq. 17). Therefore, Model 8 was selected for further analysis, i.e., for developing a mixed-effects model.
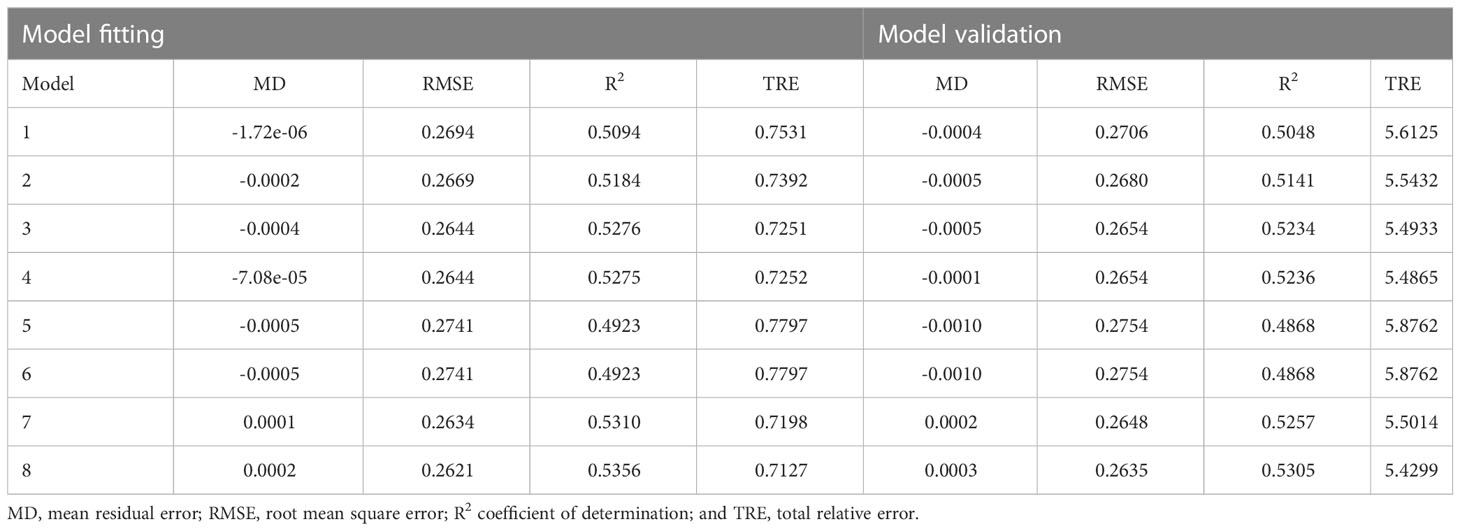
Table 4 Fit indicators of the basic models (Table 3).
3.1 Extension of base model
As previously mentioned, only the variables that contributed significantly to CW variations were added to the optimal CW model (Eq. 18). These variables were H, HCB, and MDBH. This model performed satisfactorily (R2 = 0.5392, RMSE = 0.2611, and TRE = 0.7071).
where β1−β6 are the parameters to be estimated. Hijk is the height of the k bamboo in the j sample plot in the i block; MDBHij is the arithmetic mean DBH of the j sample plot in the i block; DBHijk is the diameter breast height of the k bamboo in the j sample plot in the i block; and CWijk is the crown width of the k bamboo in the j sample plot in the i block.
We evaluated the effects of HCB, H, and DBH on CW using Eq. 18 via graphical simulation (Figure 2). As DBH and HCB increased, CW increased. However, CW decreased as H increased. DBH had the greatest influence on the variation in CW, followed by HCB and H.
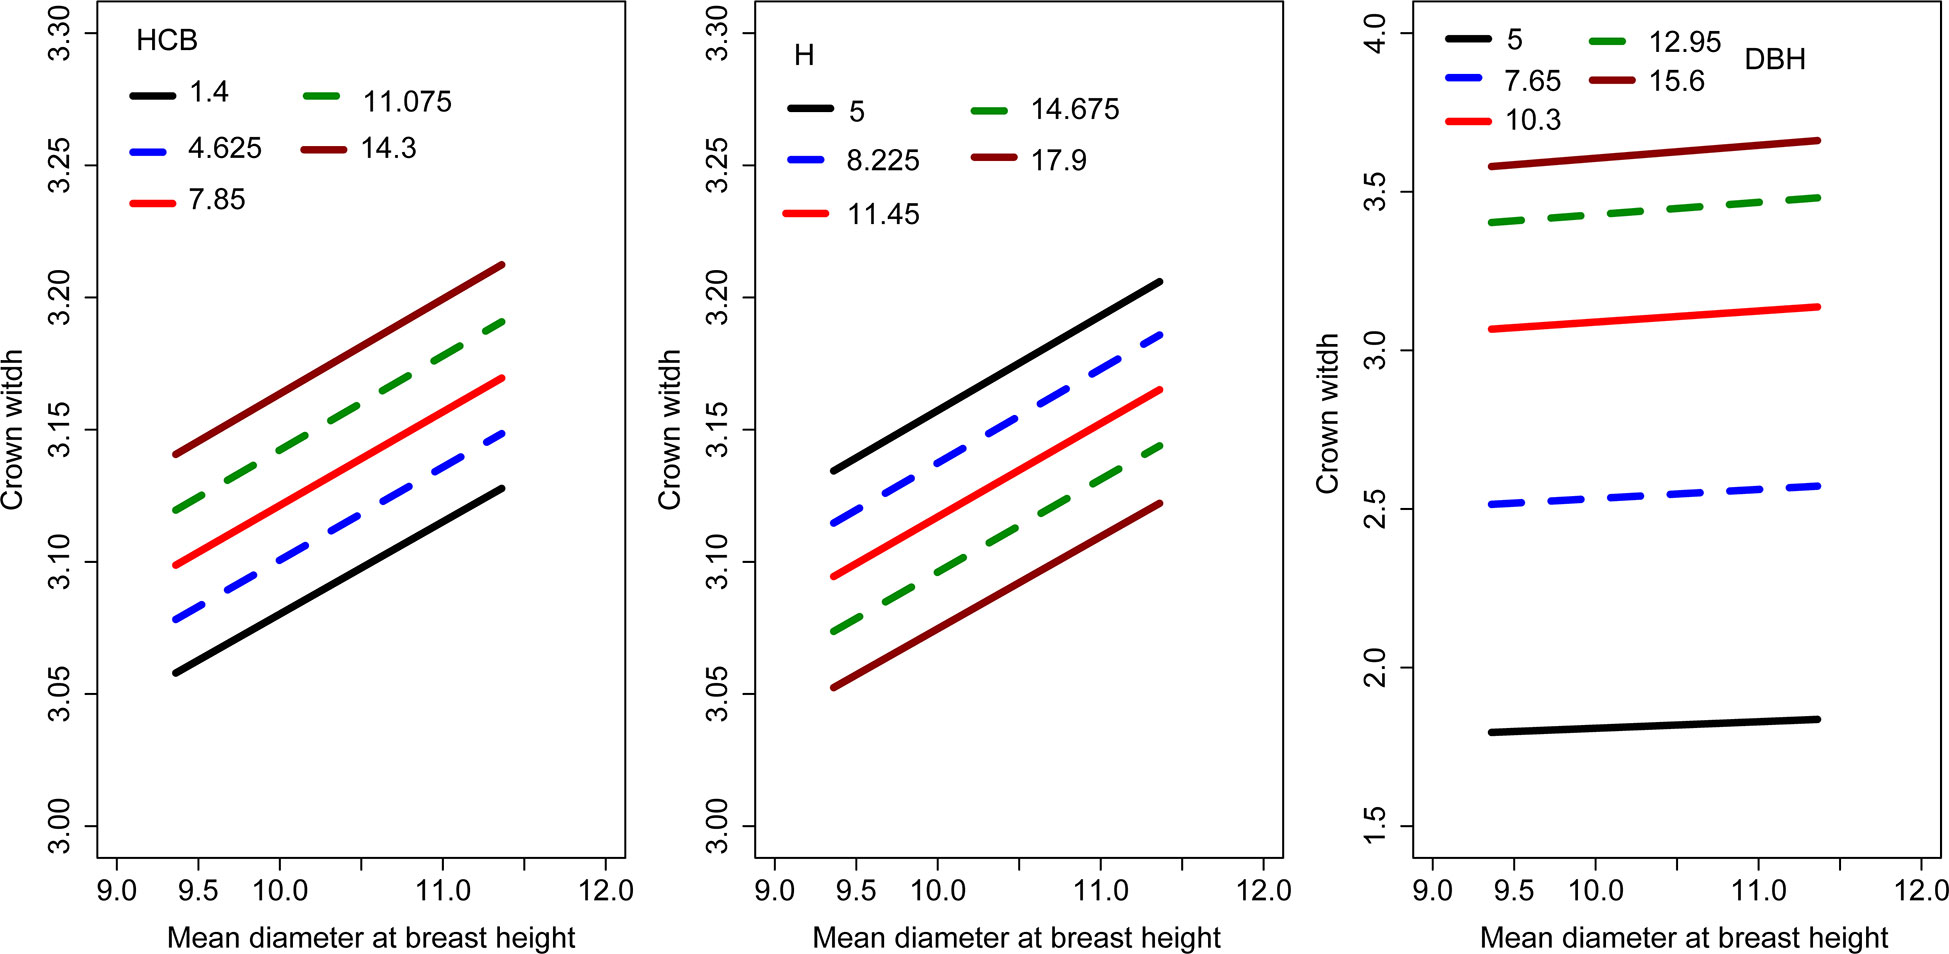
Figure 2 Effects of H, HCB and DBH on the CW. The curves were produced using the logistic model, i.e., Eq. 18.
By comparing AIC and log-likelihood values of different parameter forms with random effects, only b1 and b2 in Eq. 19 were suitable for introducing block- and sample-plot-level random effects, which resulted in Eq. 19. The model produced minimum AIC (AIC = 189.7019), maximum log-likelihood (LL = -84.8509), and other fit statistics (R2 = 0.5724, RMSE = 0.2515, TRE = 0.6560). The constant plus power variance function (Eq. 15) accounted for heteroscedasticity most effectively (Tables 4, 5; Figure 3). The final NLME CW model is as follows:
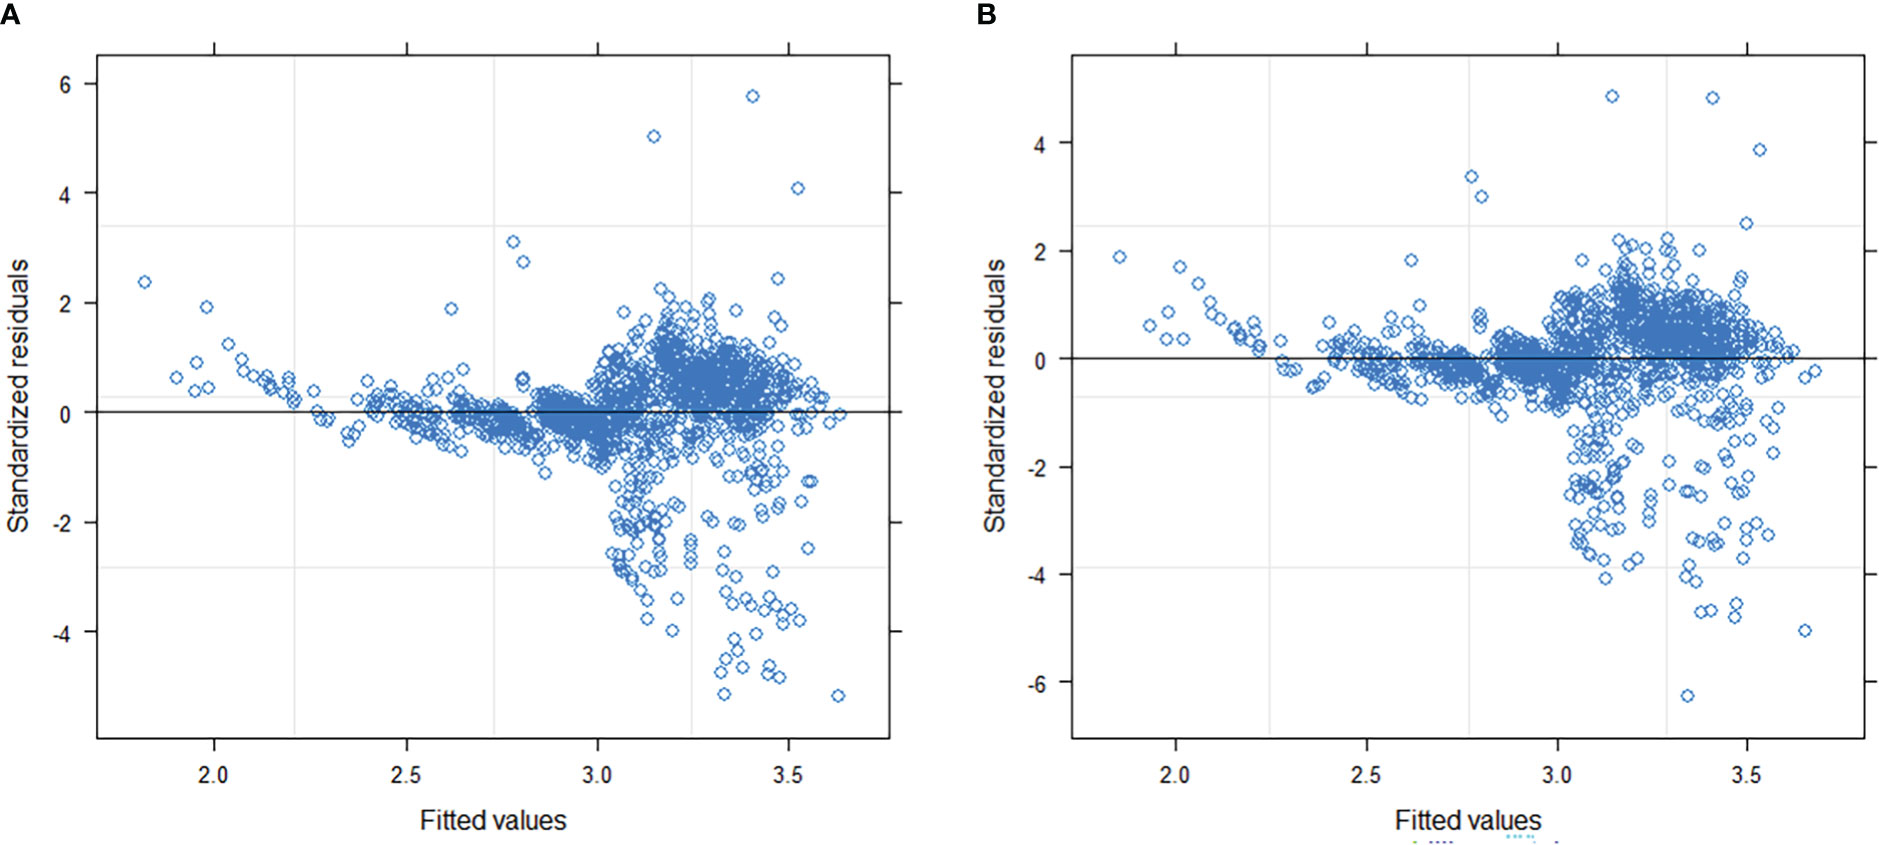
Figure 3 Residual distribution of Model 19 (A) and Model 19 + Eq. 15 (B).
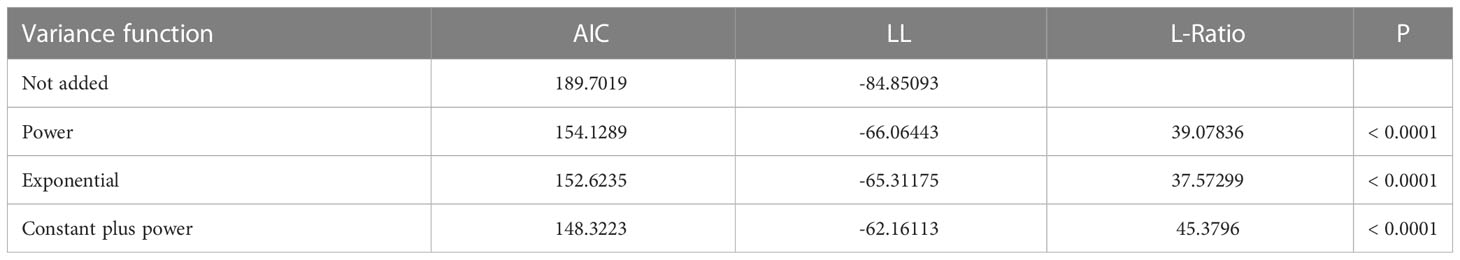
Table 5 Comparison among three variance functions (Eqs. 13–15) of NLME CW model (LL, logliklihood; AIC, Akaike Information Criterion; and L-Ratio, log-likelihood ratio test).
where , μi1, μi2 is forest block-level random effect, and μi j1 is sample plot-level random effect.
3.2 Parameter estimation
The parameter estimates of Eq. 18 using the nls function and those of Eq. 19 estimated using the nlme function were significantly different from zero (p< 0.05). The estimated optimal CW model of Eq. 18 is as follows:
where ξijk~N(0,0.2616) .
The estimated NLME CW model is shown in Eq. 21:
where
3.3 Model prediction
Four sampling methods were evaluated to predict the random effects of the NLME CW model (Figure 4). The RMSE and TRE of the four sampling methods exhibited the same trend: the prediction accuracy of the model gradually increased as the number of samples increased. When the minimum DBH was used, the model generated the minimum RMSE and TRE, indicating the suitability of the minimum DBH for calibrating and predicting bamboo CW. The decline rates of RMSE and TRE were the largest when the two bamboos with the smallest DBH were used for the random effects estimation.
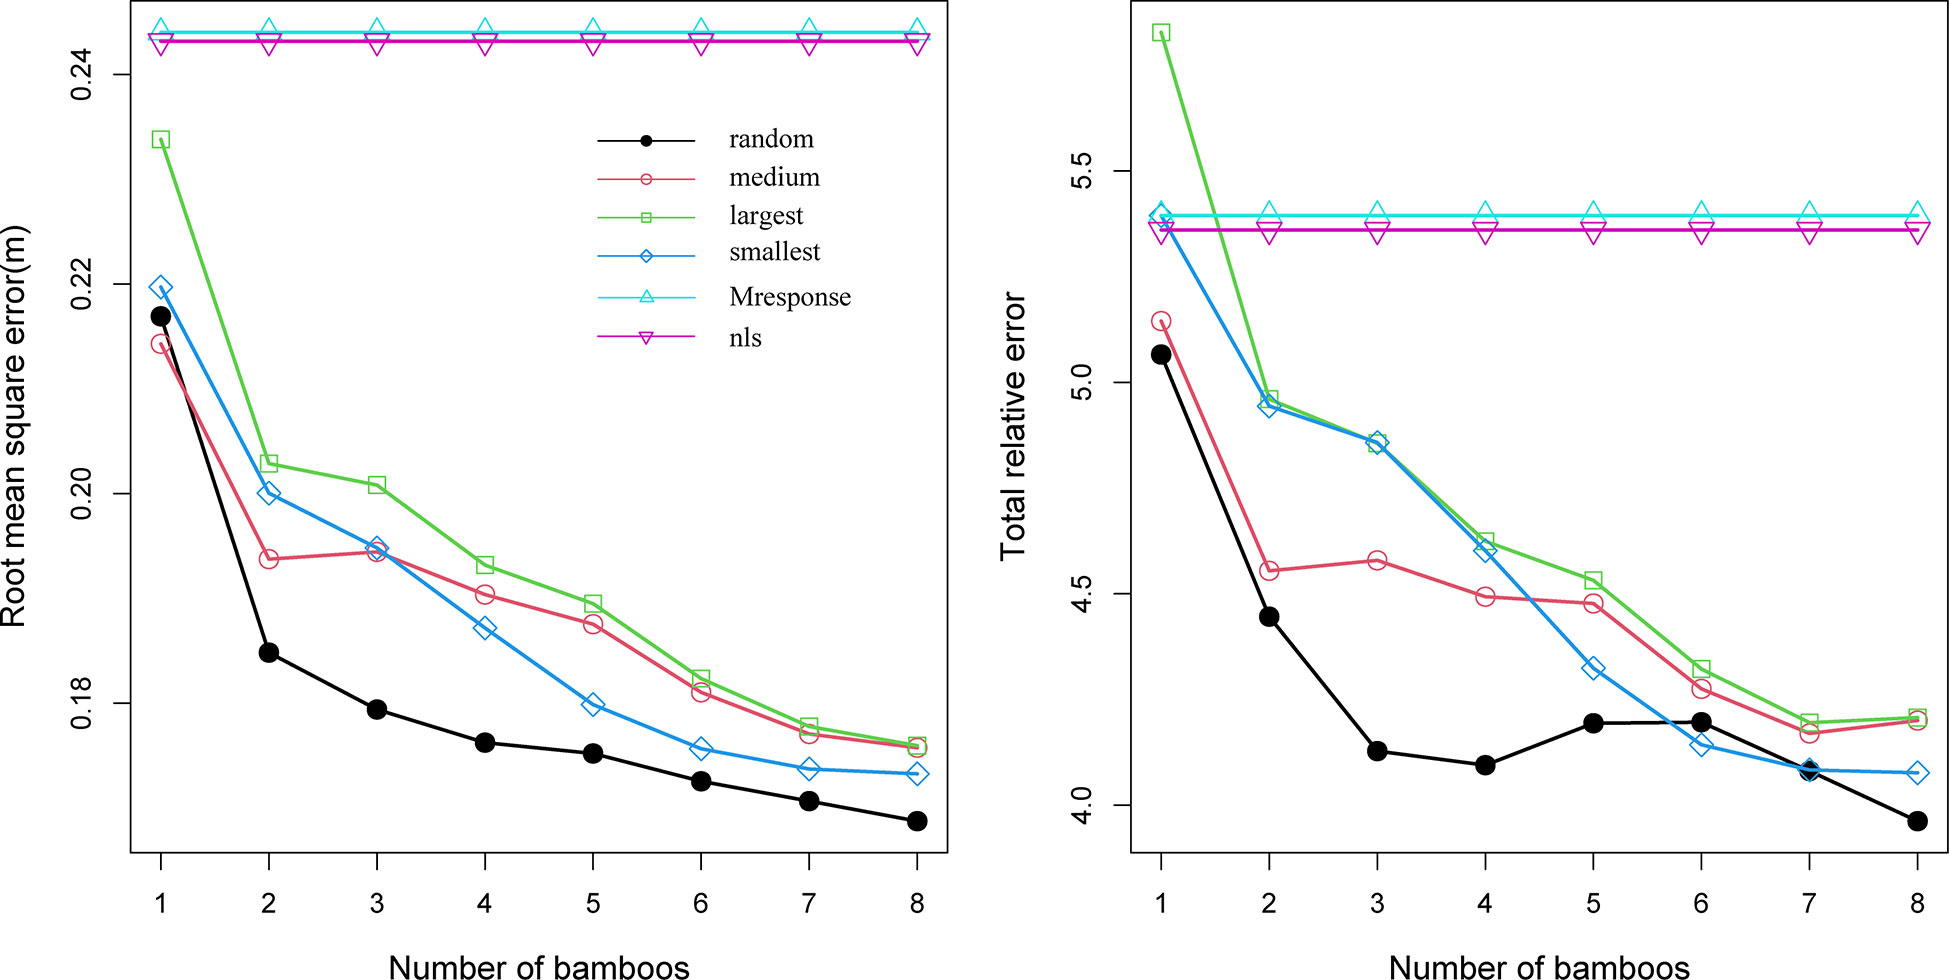
Figure 4 Root mean square error (RMSE) and total relative error (TRE) for the ordinary least squares (OLS) Model 18, Model 19 with the mean response (M response), and Model 18 with four sampling methods and sample sizes utilized within each sample plot, used to estimate the random effects (random: randomly selected DBH, largest: the largest DBH, medium: medium DBH, and smallest: the smallest DBH).
3.4 Model evaluation
Using the LOOCV method, we evaluated the performance of the OLS CW, NLME CW, and M responses of the latter model. The prediction accuracy of the NLME CW model (Eq. 19) was higher than that of the other two model variants (Eq. 18, M-response of Eq. 19) (Table 6), thereby confirming that the block and sample plot level random effects were substantial.

Table 6 Statistical indicators of different forms of CW models using LOOCV methods (OLS-Eq.18; M-response-Eq.19; NLME-Eq.19).
4 Discussion
Research on the CW model has mainly focused on tree species and rarely on bamboo forests (Fu et al., 2017b; Fu and Sun, 2013; Fu et al., 2013; Fu et al., 2017a; Lei et al., 2018). Researchers select an appropriate model through the functional relationship between CW and DBH and then utilize the tree size vitality, site condition, and stand competition factors to develop their model. The factors used in most models reflect the site quality level (dominant height) (Fu and Sun, 2013; Fu et al., 2013; Lei et al., 2018). However, bamboos grow only in the first stage, after which their height does not change (Yen and Lee, 2011; Yen, 2016). Therefore, only using DH to reflect the site quality level is not appropriate. Therefore, in this study we considered the slope, slope direction, and slope location as the site quality levels of bamboo forests and used the mixed effect method to introduce the random effect of the group level to reflect the site quality level of bamboo forests. This method provides reliable technical support for CW calculations in bamboo forests.
Among the eight commonly used CW-DBH models evaluated in this study, the logistic form (i.e., Model 8) was used as the optimal basic model because it is superior to the other models, especially in flexibility. The logistic model is widely used to fit forest growth data, including DBH growth (Fu et al., 2018), survival (Buchman et al., 1983; Xie et al., 2022), mortality (Zhou et al., 2021b; Glover and Hool, 1979; Zhou et al., 2021a), tree CW (Fu and Sun, 2013; Fu et al., 2013; Lei et al., 2018), and HCB (Yang et al., 2020; Pan et al., 2020; Zhou et al., 2022). These examples show that the logistic model is sufficiently flexible in detailing potential tree growth variations, including bamboo CW variations.
Factors that potentially affect the crown should be considered (Davies and Pommerening, 2008; Uzoh and Oliver, 2008; Sönmez, 2009). We therefore evaluated the impact of 12 variables on bamboo CW. However, only HCB, H, MDBH, and DBH significantly affected CW. Thus, these factors included in modeling may significantly improve the model’s accuracy. Studies conducted on tree species have also found a positive correlation between CW and DBH and a negative correlation between CW and HCB (Fu et al., 2013; Sharma et al., 2016; Sharma et al., 2017; Ma et al., 2022). HCB and DBH are closely related to the size of the bamboo crown; thus, they may explain the significance of impacts on CW (Hasenauer and Monserud, 1996; Sharma et al., 2016; Zhou et al., 2022). MDBH describes the degree of bamboo crowding in a forest and explains the effects of competition on CW (Timilsina and Staudhammer, 2013). However, unlike the other studies on tree species (add relevant references here), CW was negatively correlated with H in this study. This may have resulted from the different growth characteristics of bamboo from those of other tree species, i.e., bamboo usually grow only within the first growth stage (Yen and Lee, 2011; Zhou et al., 2022). Bamboos with a smaller size were usually located in the lower layer of the stands with larger growth space and lower competition, which represents conditions most suitable for CW growth. Research has shown that relative spacing influences tree height and CW relationships (Saud et al., 2016; Pan et al., 2020). However, this study excluded this indicator because the stand density of trees will not change within a certain period. For bamboo, the annual number of bamboo shoots leads to changes in stand density, and bamboos are cut approximately 4–6 years after they emerge; thus, this index is not appropriate for use in modelling. Age is an important variable in bamboo forests. Bamboos of different ages have different abilities to compete for resources. Generally, bamboos in the mature or overmature stages are less competitive than those in the immature stages (Tang et al., 2016). In the study area, the bamboos were in the rapid growth stage, and few were larger than 3°, resulting in age having a minimal impact. Therefore, we replaced the age variable with MDBH and random effects in this study.
Various predictor variables affect CW differently. As DBH and HCB increased, CW increased, but it decreased with increasing H (Figure 2). In this study, the fitting effect did not change significantly after other variables were added to the model. Moreover, a model with too many variables and parameters may lead to over-parameterization and non-convergence (Fu et al., 2017b; Fu et al., 2017c; Fu et al., 2017a). In addition, including several stand or tree variables may increase the cost and time of an inventory. Therefore, determining an appropriate number of variables with the high accuracy required by forest managers would be difficult in forest modeling (Calama and Montero, 2004; Ademe et al., 2008). A simple model with a reliable prediction accuracy is therefore a desirable choice for effective forest management (Kiernan et al., 2008). Therefore, we retained only four variables in the final CW model (see Eq. 18), which are easily obtained from forestry databases.
The fitting accuracy of the model significantly improved after including the two level random effects. This is because the random effects parameters accounted for the difference in DBH changes in the different blocks within the bamboo forests and different sample plots within the blocks. The stand density of the studied bamboo forests ranged from 1,200 to 3,750 plants/ha, which largely affects CW variability (Essery et al., 2008). Because the effects of MDBH was assumed to be reacted in that of crowding degree or stand density, we did not consider introducing the number of bamboos per sample plot into the CW model.
To reduce inventory costs, the mixed-effects model estimates the random effects using as few samples as possible (Liu and Cela, 2008; Fu et al., 2017c). A small number of samples may capture the unobserved influence of stand variables on CW. Researchers have discussed the sample size necessary to predict random effects with reasonable accuracy (Fu et al., 2017b; Yang et al., 2020; Zhou et al., 2021a; Ma et al., 2022; Zhou et al., 2022). In this study, we evaluated the impact of four sampling methods on the prediction accuracy of the NLME CW model. Increasing the number of samples resulted in the statistical indicators (RMSE and TRE) showing a downward trend (Figure 4), which is more or less similar to results of studies on tree species (add relevant references here). A reasonably high prediction accuracy was achieved for the NLME CW model using the random effects estimated with only the smallest two bamboos per sample plot. Two bamboo poles were considered the optical number to predict the random effects of the NLME CW model from the perspective of the affordable sampling cost and prediction accuracy of the model. Similar empirical results have been reported in other modeling studies (Zhou et al., 2022).
The data used in this study were acquired from field surveys, and CW was calculated from four azimuth angles; this approach may lead to substantial errors in predicting CW and the crown area (Bragg, 2001; Marshall et al., 2003). These errors can be reduced by considering the geometric mean (Gregoire and Valentine, 1995). Because all the sample plots were distributed across pure bamboo forests, differences in the orientation of the crown diameter of bamboos in the sample plots were ignored. Therefore, the potential errors introduced by the arithmetic mean (CW) may be minimal and insignificant. Currently, remote sensing techniques are widely used in forestry research (García et al., 2010; Fu et al., 2018; Yang et al., 2020). Moreover, the factors influencing CW can also be estimated using remote sensing images, which can be largely supportive in constructing CW models and reducing investigation costs.
5 Conclusion
The nonlinear mixed effect CW model, which was developed using the DBH, HCB, arithmetic MDBH, bamboo height (H), and forest block- and sample plot-level random effects, demonstrated a promising precision level. Even with an increase in the number of samples, the prediction statistics gradually decreased, and the two bamboos with the smallest DBH per sample plot were used to calibrate the nonlinear mixed-effects CW model. This approach may therefore substantially reduce measurement costs and provide an acceptable accuracy. The model established in this study can be applied to bamboo CW predictions in forests similar to those in this study and may provide a basis for bamboo forest management.
Data availability statement
The original contributions presented in the study are included in the article/supplementary material. Further inquiries can be directed to the corresponding author.
Author contributions
XZ, ZL, LL, and FG collected data; XZ, SF, and FG analyzed data; XZ, ZL, LL, RS, and FG wrote manuscript and contributed critically to improve the manuscript, and gave a final approval for publication.
Funding
We would like to thank the Basic Scientific Research Funding of International Center For Bamboo and Rattan (1632022018) for the financial support of this study
Conflict of interest
The authors declare that the research was conducted in the absence of any commercial or financial relationships that could be construed as a potential conflict of interest.
Publisher’s note
All claims expressed in this article are solely those of the authors and do not necessarily represent those of their affiliated organizations, or those of the publisher, the editors and the reviewers. Any product that may be evaluated in this article, or claim that may be made by its manufacturer, is not guaranteed or endorsed by the publisher.
References
Ademe, P., Río, M. D., Cañellas, I. (2008). A mixed nonlinear height-diameter model for pyrenean oak (Quercus pyrenaica willd.). For. Ecol. Manage. 256, 88–98. doi: 10.1016/j.foreco.2008.04.006
Bragg, D. C. (2001). A local basal area adjustment for crown width prediction. Northern J. Appl. Forestry 18 (1), 22–28. doi: 10.1093/njaf/18.1.22
Buchacher, R., Ledermann, T. (2020). Interregional crown width models for individual trees growing in pure and mixed stands in Austria. Forests 11 (1), 114. doi: 10.3390/f11010114
Buchman, R. G., Pederson, S. P., Walters, N. R. (1983). A tree survival model with application to species of the great lakes region. Can. J. For. Res. 13 (4), 601–608. doi: 10.1139/x83-087
Calama, R., Montero, G. (2004). Interregional nonlinear height-diameter model with random coefficients for stone pine in Spain. Can. J. For. Res. 34 (1), 150–163. doi: 10.1139/X03-199
Davidian, M., Giltinan, D. M. (1995). Nonlinear models for repeated measurement data (New York: Chapmanand Hall). doi: 10.1201/9780203745502
Davies, O., Pommerening, A. (2008). ). the contribution of structural indices to the modelling of sitka spruce (Picea sitchensis) and birch (Betula spp.) crowns. For. Ecol. Manage. 256 (1), 68–77. doi: 10.1016/j.foreco.2008.03.052
Essery, R., Bunting, P., Hardy, J., Link, T., Marks, D., Melloh, R., et al. (2008). Radiative transfer modeling of a coniferous canopy characterized by airborne remote sensing. J. Hydrometeorology 9 (2), 228–241. doi: 10.1175/2007JHM870.1
Fang, Z., Bailey, R. L. (2001). Nonlinear mixed-effect modeling for slash pine dominant height growth following intensive silvicultural treatments. For. Sci. 47, 287–300. doi: 10.1046/j.1439-0329.2001.00240.x
FAO (2010). Global forest resources assessment 2010: Main report; FAO forestry paper Vol. 163 (Rome, Italy: FAO).
Fu, L., Liu, Q., Sun, H., Wang, Q., Li, Z., Chen, E., et al. (2018). Development of a system of compatible individual tree diameter and aboveground biomass prediction models using error-In-Variable regression and airborne LiDAR data. Remote Sens. 10 (2), 325. doi: 10.3390/rs10020325
Fu, L., Sharma, R. P., Hao, K., Tang, S. (2017a). A generalized interregional nonlinear mixed-effects crown width model for prince rupprecht larch in northern China. For. Ecol. Manage. 389, 364–373. doi: 10.1016/j.foreco.2016.12.034
Fu, L., Sharma, R. P., Wang, G., Tang, S. (2017b). Modelling a system of non-linear additive crown width models applying seemingly unrelated regression for prince rupprecht larch in northern China. For. Ecol. Manage. 386, 71–80. doi: 10.1016/j.foreco.2016.11.038
Fu, L., Sun, H. (2013). Individual crown diameter prediction for Cunninghamia lanceolata forests based on mixed effects models. Scientia Slilvae Sinicae 49 (08), 65–74. doi: 10.11707/j.1001-7488.20130810
Fu, L., Sun, H., Sharma, R. P., Lei, Y., Zhang, H., Tang, S. (2013). Nonlinear mixed-effects crown width models for individual trees of Chinese fir (Cunninghamia lanceolata) in south-central China. For. Ecol. Manage. 302, 210–220. doi: 10.1016/j.foreco.2013.03.036
Fu, L., Zhang, H., Lu, J., Zang, H., Lou, M., Wang, G. (2015). Multilevel nonlinear mixed-effect crown ratio models for individual trees of Mongolian oak (Quercus mongolica) in northeast China. PloS One 10 (8), e0133294. doi: 10.1371/journal.pone.0133294
Fu, L., Zhang, H., Sharma, R. P., Pang, L., Wang, G. (2017c). A generalized nonlinear mixed-effects height to crown base model for Mongolian oak in northeast China. For. Ecol. Manage. 384, 34–43. doi: 10.1016/j.foreco.2016.09.012
García, M., Riaño, D., Chuvieco, E., Danson, F. M. (2010). Estimating biomass carbon stocks for a Mediterranean forest in central Spain using LiDAR height and intensity data. Remote Sens. Environ. 114, 816–830. doi: 10.1016/j.rse.2009.11.021
Glover, G. R., Hool, J. N. (1979). A basal area ratio predictor of loblolly pine plantation mortality. For. Sci. 25, 275–282. doi: 10.1093/FORESTSCIENCE/25.2.275
Gregoire, T. G., Valentine, H. T. (1995). A sampling strategy to estimate the area and perimeter of irregularly shaped planar regions. For. Sci. 41 (3), 470–476. doi: 10.1016/S0370-2693(00)00954-0
Hasenauer, H., Monserud, R. A. (1996). A crown ratio model for Austrian forests. For. Ecol. Manage. 84, 49–60. doi: 10.1016/0378-1127(96)03768-1
Hetherington, J. C. (1967). Crown diameter: stem diameter relationships in managed stands of sitka spruce. Commonwealth Forestry Rev. 46, 278–281.
Hoffmann, C. W., Usoltsev, V. A. (2002). Tree-crown biomass estimation in forest species of the Ural and of Kazakhstan. For. Ecol. Manage. 158, 59–69. doi: 10.1016/S0378-1127(00)00669-1
Horntvedt, R. (1993). Crown density of spruce trees related to needle biomass. For. Ecol. Manage. 59, 225–235. doi: 10.1016/0378-1127(93)90004-7
Kiernan, D. H., Bevilacqua, E., Nyland, R. D. (2008). Individual-tree diameter growth model for sugar maple trees in uneven-aged northern hardwood stands under selection system. For. Ecol. Manage. 256, 1579–1586. doi: 10.1016/j.foreco.2008.06.015
Larocque, G. R., Marshall, P. L. (1994). Crown development in red pine stands. i. absolute and relative growth measures. Can. J. For. Res. 24 (4), 762–774. doi: 10.1139/x94-101
Lei, Y., Fu, L., Affleck, D., Nelson, A. S., Shen, C., Wang, M., et al. (2018). Additivity of nonlinear tree crown width models: Aggregated and disaggregated model structures using nonlinear simultaneous equations. For. Ecol. Manage. 427, 372–382. doi: 10.1016/j.foreco.2018.06.013
Leites, L. P., Robinson, A. P., Crookston, N. L. (2009). Accuracy and equivalence testing of crown ratio models and assessment of their impact on diameter growth and basal area increment predictions of two variants of the forest vegetation simulator. Can. J. For. Res. 39 (3), 655–665. doi: 10.1139/X08-205
Lei, X., Zhang, Z., Chen, X. (2006). Crown-width prediction models for several tree species including Larix olgensis in northeastern China. J. Beijing Forestry Univ. 28 (6), 75–79. doi: 10.3321/j.issn:1000-1522.2006.06.013
Lindstrom, M. J., Bates, D. M. (1990). Nonlinear mixed effects models for repeated measures data. Biometrics 46 (3), 673–687. doi: 10.1201/9780203745502
Liu, W., Cela, J. (2008). Count data models in SAS. Stat Data Anal., 371–2008. doi: 10.1080/08898489409525374
Ma, A., Miao, Z., Xie, L., Dong, L., Li, F. (2022). Crown width prediction for Larix olgensis plantations in northeast China based on nonlinear mixed-effects model and quantile regression. Trees 36, 1761–1776. doi: 10.1007/s00468-022-02326-9
Marshall, D. D., Johnson, G. P., Hann, D. W. (2003). Crown profile equations for stand-grown western hemlock trees in northwestern Oregon. Can. J. For. Res. 33 (11), 2059–2066. doi: 10.1139/x03-126
Masson-Delmotte, V., Zhai, P., Pirani, A., Connors, S. L., Péan, C., Berger, S., et al. (2021). IPCC 2021: Index. in climate change 2021: The physical science basis. contribution of working group I to the sixth assessment report of the intergovernmental panel on climate change (Cambridge, United Kingdom and New York, NY, USA: Cambridge University Press).
Meng, S.X., Huang, S. (2009). Improved calibration of nonlinear mixed-effects models demonstrated on a height growth function. Forest Science 55, 239–248. doi: 10.1093/forestscience/55.3.238
Monserud, R. A., Sterba, H. (1996). A basal area increment model for individual trees growing in even-and uneven-aged forest stands in Austria. For. Ecol. Manage. 80, 57–80. doi: 10.1016/0378-1127(95)03638-5
Pan, L., Mei, G., Wang, Y., Saeed, S., Chen, L., Cao, Y., et al. (2020). Generalized nonlinear mixed-effect model of ndividual TREE height to crown base for Larix olgensis Henry in northeast China. J. Sustain. Forestry 39 (262), 1–14. doi: 10.1080/10549811.2020.1734026
Paulo, J. A., Faias, S. P., Ventura-Giroux, C., Tomé, M. (2015). Estimation of stand crown cover using a generalized crown diameter model: application for the analysis of Portuguese cork oak stands stocking evolution. iforest - Biogeosciences Forestry 422, 437–444. doi: 10.3832/ifor1624-008
Pinheiro, J. C., Bates, D. M. (2000). Mixed-effects models in s and s-PLUS (New York: Spring Verlag).
Sánchez-González, M., Cañellas, I., Montero, G. (2007). Generalized height- diameter and crown diameter prediction models for cork oak forests in Spain. For. Syst. 16 (1), 76–88. doi: 10.5424/SRF/2007161-00999
Saud, P., Lynch, T. B., Anup, K. C., Guldin, J. M. (2016). Using quadratic mean diameter and relative spacing index to enhance height-diameter and crown ratio models fitted to longitudinal data. Forestry 89 (2), 215–229. doi: 10.1093/forestry/cpw004
Sharma, R. P., Bílek, L., Vacek, Z., Vacek, S. (2017). Modelling crown width-diameter relationship for scots pine in the central Europe. Trees 31, 1875–1889. doi: 10.1007/s00468-017-1593-8
Sharma, R. P., Vacek, Z., Vacek, S. (2016). Individual tree crown width models for Norway spruce and European beech in Czech republic. For. Ecol. Manage. 366, 208–220. doi: 10.1016/j.foreco.2016.01.040
Sönmez, T. (2009). Diameter at breast height-crown diameter prediction models for Picea orientalis. Afr. J. Agric. Res. 4 (3), 215–219. doi: 10.1021/jf803390m
Stephanie, B., Stephen, P. (2011). A forest structure model that determines crown layers and partitions growth and mortality rates for landscape-scale applications of tropical forests. J. Ecol. 100 (2), 508–518. doi: 10.2307/41496099
Tahvanainen, T., Forss, E. (2008). Individual tree models for the crown biomass distribution of scots pine Norway spruce and birch in Finland. For. Ecol. Manage. 255, 455–467. doi: 10.1016/j.foreco.2007.09.035
Tang, X., Fan, S., Qi, L., Guan, F., Du, M., Zhang, H. (2016). Soil respiration and net ecosystem production in relation to intensive management in moso bamboo forests. Catena 137, 219–228. doi: 10.1016/j.catena.2015.09.008
Timilsina, N., Staudhammer, C. L. (2013). Individual tree-based diameter growth model of slash pine in Florida using nonlinear mixed modeling. For. Sci. 59 (1), 27–37. doi: 10.5849/forsci.10-028
Uzoh, F. C., Oliver, W. W. (2008). Individual tree diameter increment model for managed even-aged stands of ponderosa pine throughout the western united states using a multilevel linear mixed effects model. For. Ecol. Manage. 256, 438–445. doi: 10.1016/j.foreco.2008.04.046
West, P. W., Ratkowsky, D. A., Davis, A. W. (1984). Problems of hypothesis testing of regressions with multiple measurements from individual sampling units. For. Ecol. Manage. 7, 207–224. doi: 10.1016/0378-1127(84)90068-9
Xie, L., Chen, X., Zhou, X., Sharma, R. P., Li, J. (2022). Developing tree mortality models using bayesian modeling approach. Forests. 13, 604. doi: 10.3390/f13040604
Yang, Y., Huang, S., Meng, S. X., Guillermo, T., Curtis, L. V. (2009). A multilevel individual tree basal area increment model for aspen in boreal mixedwood stands. Can. J. For. Res. 39 (11), 2203–2214. doi: 10.1139/X09-123
Yang, Z., Liu, Q., Luo, P., Ye, Q., Sharma, R. P., Duan, G., et al. (2020). Nonlinear mixed-effects height to crown base model based on both airborne LiDAR and field datasets for Picea crassifolia kom trees in northwest China. For. Ecol. Manage. 474, 118323. doi: 10.1016/j.foreco.2020.118323
Yen, T. M. (2016). Culm height development, biomass accumulation and carbon storage in an initial growth stage for a fast-growing moso bamboo (Phyllostachy pubescens). Botanical Stud. 57, 10. doi: 10.1186/s40529-016-0126-x
Yen, T. M., Lee, J. S. (2011). Comparing aboveground carbon sequestration between moso bamboo (Phyllostachys heterocycla) and China fir (Cunninghamia lanceolata) forests based on the allometric model. For. Ecol. Manage. 261, 995–1002. doi: 10.1016/j.foreco.2010.12.015
Zarnoch, S. J., Bechtold, W. A., Stoke, K. W. (2004). Using crown condition variables as indicators of forest health. Can. J. For. Res. 34 (5), 1057–1070. doi: 10.1139/x03-277
Zhang, X., Cao, Q. V., Duan, A., Zhang, J. (2017). Modeling tree mortality in relation to climate, initial planting density and competition in Chinese fir plantations using a Bayesian logistic multilevel method. Can. J. For. Res. 47, 2017–0215. doi: 10.1139/cjfr-2017-0215
Zhou, X., Chen, Q., Sharma, R. P., Wang, Y., He, P., Guo, J., et al. (2021a). A climate sensitive mixed-effects diameter class mortality model for prince rupprecht larch (Larix gmelinii var. principis-rupprechtii) in northern China. For. Ecol. Manage. 491 (8), 119091. doi: 10.1016/j.foreco.2021.119091
Zhou, X., Fu, L., Sharma, R. P., He, P., Lei, Y., Guo, J. (2021b). Generalized or general mixed-effect modelling of tree morality of Larix gmelinii subsp principis-rupprechtii in northern China. J. Forestry Res. 32, 2447–2458. doi: 10.1007/S11676-021-01302-2
Keywords: growth function, random effect, variance-stabilizing function, sampling strategy, bamboo forest management
Citation: Zhou X, Li Z, Liu L, Sharma RP, Guan F and Fan S (2023) Constructing two-level nonlinear mixed-effects crown width models for Moso bamboo in China. Front. Plant Sci. 14:1139448. doi: 10.3389/fpls.2023.1139448
Received: 07 January 2023; Accepted: 06 February 2023;
Published: 16 February 2023.
Edited by:
Xiong Zhao He, Massey University, New ZealandReviewed by:
Petras Rupšys, Vytautas Magnus University, LithuaniaFangyuan Bian, China National Bamboo Research Center, China
Chong Li, Zhejiang Agriculture and Forestry University, China
Copyright © 2023 Zhou, Li, Liu, Sharma, Guan and Fan. This is an open-access article distributed under the terms of the Creative Commons Attribution License (CC BY). The use, distribution or reproduction in other forums is permitted, provided the original author(s) and the copyright owner(s) are credited and that the original publication in this journal is cited, in accordance with accepted academic practice. No use, distribution or reproduction is permitted which does not comply with these terms.
*Correspondence: Fengying Guan, guanfy@icbr.ac.cn