 Xiao-Long Yang1,2
 Xiao-Fei Ma3
 Zi-Piao Ye4*
 Long-Sheng Yang1Jun-Bo Shi1
 Xun Wang1Bei-Bei Zhou1Fu-Biao Wang4
 Zi-Fa Deng1*
- 1School of Life Sciences, Nantong University, Nantong, China
- 2State Key Laboratory of Environmental Chemistry and Ecotoxicology, Research Center for Eco-Environmental Sciences, Chinese Academy of Sciences, Beijing, China
- 3Key Laboratory of Ecological Safety and Sustainable Development in Arid Lands, Northwest Institute of Eco-Environment and Resources, Chinese Academy of Sciences, Lanzhou, China
- 4Institute of Biophysics in Maths & Physics College, Jinggangshan University, Ji’an, China
Climate change, characterized by rising atmospheric CO2 levels and temperatures, poses significant challenges to global crop production. Sweet sorghum, a prominent C4 cereal extensively grown in arid areas, emerges as a promising candidate for sustainable bioenergy production. This study investigated the responses of photosynthesis and leaf-scale water use efficiency (WUE) to varying light intensity (I) in sweet sorghum under different temperature and CO2 conditions. Comparative analyses were conducted between the An-I, gs-I, Tr-I, WUEi-I, and WUEinst-I models proposed by Ye et al. and the widely utilized the non-rectangular hyperbolic (NRH) model for fitting light response curves. The Ye's models effectively replicated the light response curves of sweet sorghum, accurately capturing the diminishing intrinsic WUE (WUEi) and instantaneous WUE (WUEinst) trends with increasing I. The fitted maximum values of An, gs, Tr, WUEi, and WUEinst and their saturation light intensities closely matched observations, unlike the NRH model. Despite the NRH model demonstrating high R2 values for An-I, gs-I, and Tr-I modelling, it returned the maximum values significantly deviating from observed values and failed to generate saturation light intensities. It also inadequately represented WUE responses to I, overestimating WUE. Across different leaf temperatures, An, gs, and Tr of sweet sorghum displayed comparable light response patterns. Elevated temperatures increased maximum An, gs, and Tr but consistently declined maximum WUEi and WUEinst. However, WUEinst declined more sharply due to the disproportionate transpiration increase over carbon assimilation. Critically, sweet sorghum An saturated at current atmospheric CO2 levels, with no significant gains under 550 μmol mol−1. Instead, stomatal closure enhanced WUE under elevated CO2 by coordinated gs and Tr reductions rather than improved carbon assimilation. Nonetheless, this response diminished under simultaneously high temperature, suggesting intricate interplay between CO2 and temperature in modulating plant responses. These findings provide valuable insights into photosynthetic dynamics of sweet sorghum, aiding predictions of yield and optimization of cultivation practices. Moreover, our methodology serves as a valuable reference for evaluating leaf photosynthesis and WUE dynamics in diverse plant species.
Introduction
Water plays a crucial role in maintaining the structural integrity and functionality of plants, facilitating nutrient transport, and regulating temperature (Fracasso et al., 2017; Bykova et al., 2019). Specially, it is essential for photosynthesis, providing the electrons necessary to fuel the light-dependent reactions of the process. Due to the growing population, uncontrolled urbanization, and industrialization, atmospheric CO2 concentration has markedly risen from a pre-industrial value of 280 to 414 μmol mol−1 in 2020, and it is projected to exceed 700 μmol mol−1 by the end of 21st century (Asadi and Eshghizadeh, 2021). If the increase in CO2 continues, global mean temperatures are expected to rise by 2.6~4.8°C (Hatfield and Dold, 2019). Consequently, alterations in precipitation patterns have been observed in numerous regions in recent years, leading to the frequent occurrence of extreme events such as recurrent droughts and durative high temperatures. This phenomenon is particularly pronounced in arid and semi-arid areas where water resources are significantly stressed (Grillakis, 2019; Feng et al., 2022). As a consequence, crop production in these regions has been significantly limited by availability of water (Kubien et al., 2003; Prasad et al., 2009; Scafaro et al., 2011; Soltani et al., 2023).
Sweet sorghum [Sorghum bicolor (L.) Moench], a C4 species with high photosynthetic efficiency, ranks as the fifth most cereal crop globally, with the total yield lower than that of wheat, rice, maize, and barley (Loreto et al., 1995; Prasad et al., 2009; Asadi and Eshghizadeh, 2021). Due to its excellent drought tolerance, sweet sorghum is extensively cultivated in arid and semi-arid regions with annual precipitation of only 350~700 mm (Appiah-Nkansah et al., 2019; Asadi and Eshghizadeh, 2021). In 2019, global sorghum production reached 56.7 million tons, with Asia contributing 13%, and cultivation concentrated primarily in India and China (Mundia et al., 2019). Sweet sorghum can be utilized for various purposes, including starchy grains for human food, soluble sugar juice as a feedstock for producing spirits, syrup, and vinegar, and lignocellulosic biomass for manufacturing animal feed, fuel ethanol, and fiber. The crop is generating significant interest in industrial circles as a leading candidate for bioenergy production, given the remarkable accumulation of high sugar content in its stems (9~15% of dry biomass) (Appiah-Nkansah et al., 2019; Asadi and Eshghizadeh, 2021).
Photosynthesis stands as one of the pivotal life processes for plants, serving as the foundation for their growth and development. Crop yield is closely related to leaf photosynthesis (von Caemmerer and Farquhar, 1981; Allen et al., 2011; McAusland et al., 2016). During photosynthesis, leaves inevitably lose water to fix carbon gained when they open their stomata (Farooq et al., 2019). The dynamic changes between carbon flux driven by photosynthesis and water flux dominated by transpiration can be characterized by water-use efficiency (WUE; see Table 1 for the list of abbreviations), also known as intrinsic water use efficiency (WUEi) or instantaneous water use efficiency (WUEinst) at the leaf level (von Caemmerer and Farquhar, 1981; Fracasso et al., 2017). WUEi is closely correlated with leaf photosynthetic capacity and stomatal behavior (von Caemmerer and Farquhar, 1981). It is commonly used to explain photosynthetic characteristics that are independent of evaporative demand (Ye et al., 2020). WUEinst represents plant dry yield per unit of water loss, which can be considered as the WUE of the whole plant. WUE changes immediately within minutes of becoming water deprived. WUE is regarded as a key physiological indicator for assessing crop growth in arid regions, illuminating the link between crop production and water consumption (McAusland et al., 2016; Fracasso et al., 2017; Bykova et al., 2019; Hatfield and Dold, 2019). Currently, research has been undertaken to explore how crops respond to environmental stress based on the functional characterization of WUE (Gago et al., 2014; Xue et al., 2016; Silva et al., 2020), revealing that an elevated CO2 concentration can enhance WUEinst (Wall et al., 2001; Hatfield and Dold, 2019).
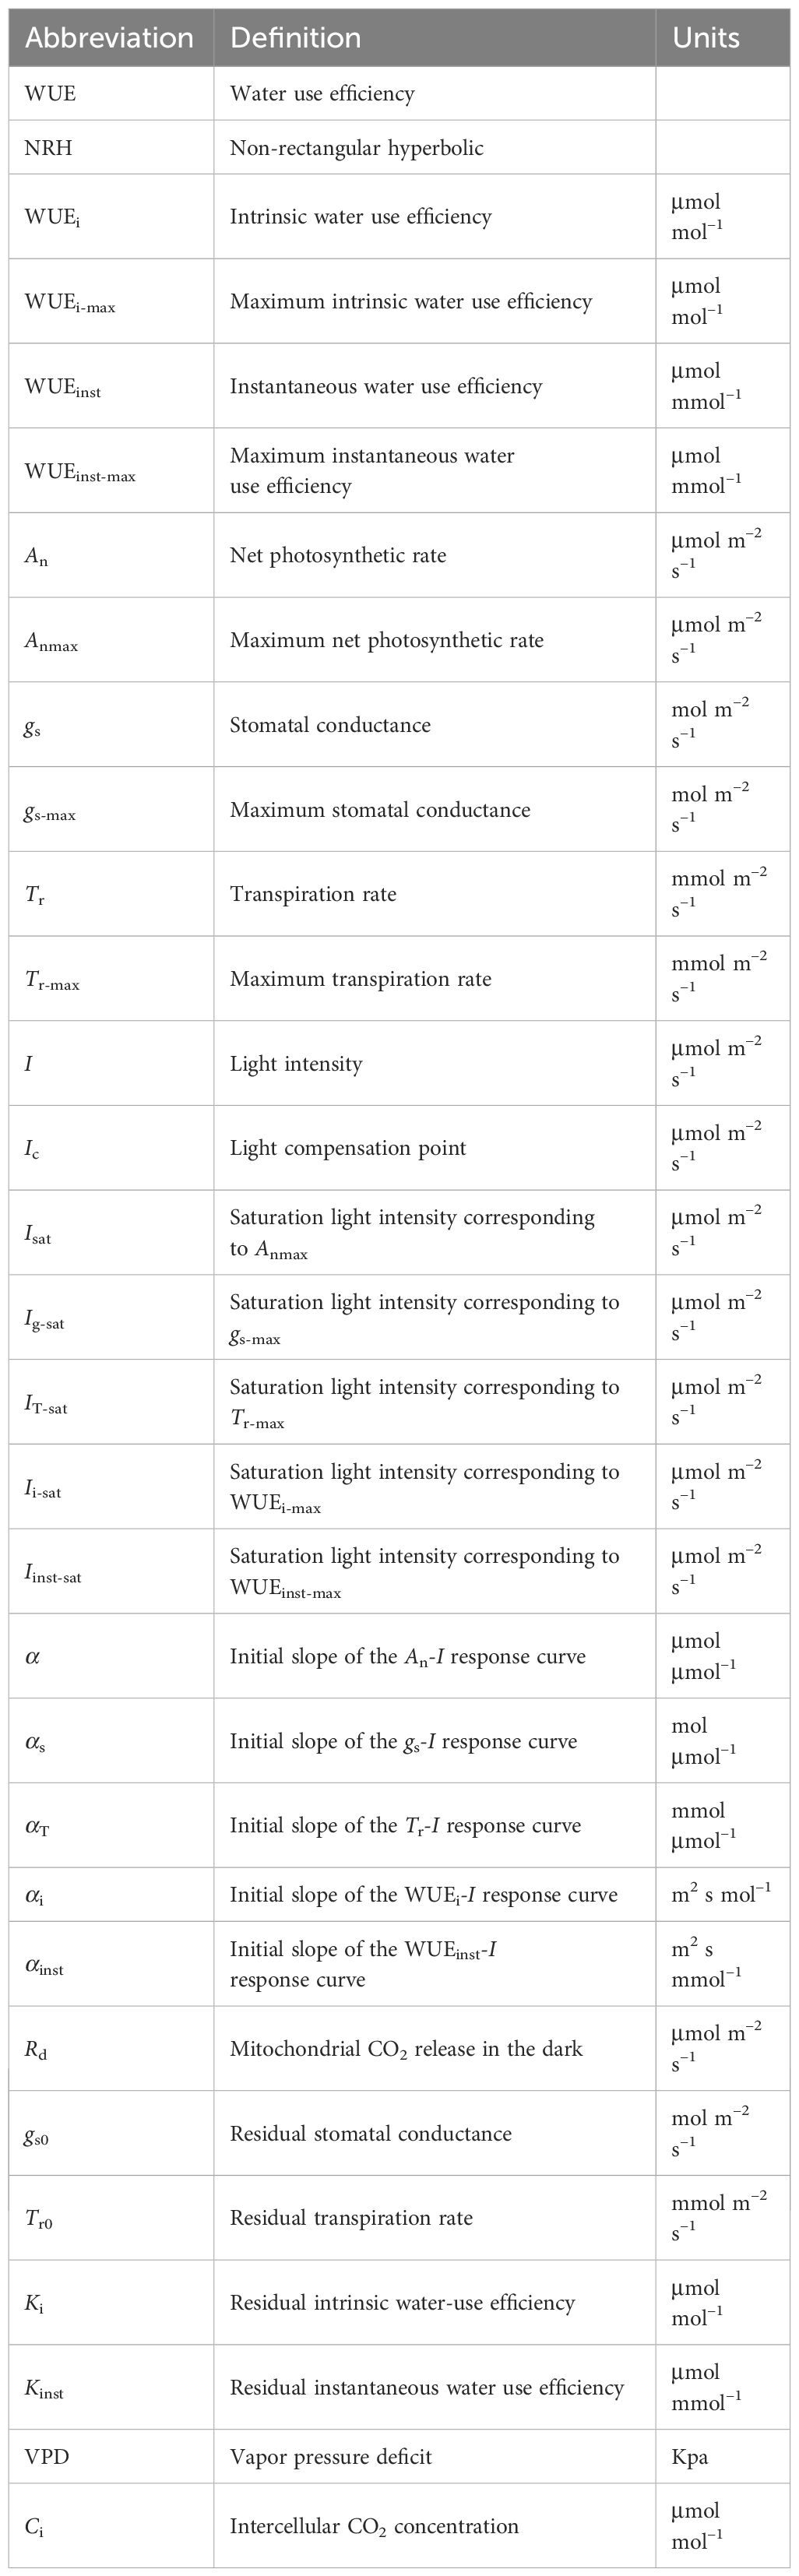
Table 1 Definitions of the abbreviations.
However, the process of photosynthesis in plants is inherently dynamic in natural conditions, with the photosynthetic rate exhibiting rapid responses to diverse environmental factors. The intensity of light incident on a leaf experiences fluctuations due to the movement of the sun, clouds, canopies, or the leaf itself, thereby influencing the photosynthetic rate (Gyimah and Nakao, 2007; McAusland et al., 2016). Plants demonstrate varied capabilities in harnessing light of different strengths, ranging from weak to strong, each with specific light requirements (Yan et al., 2019). Characterizing light response of plant photosynthesis is thus essential for elucidating photosynthetic dynamics, cultivation management, and growth potential in changing environments (von Caemmerer and Farquhar, 1981; Gyimah and Nakao, 2007; Yan et al., 2019; Ye et al., 2020). While studies have explored changes in crop WUE (mainly WUEinst) under water deficit stress and climate change (Wall et al., 2001; Allen et al., 2011; Fracasso et al., 2017; Hatfield and Dold, 2019; Asadi and Eshghizadeh, 2021), limited information exists on how WUEi and WUEinst respond to variations in light intensity and their evolution under concurrent rising CO2 concentration and warming (Hatfield and Dold, 2019).
Accurate characterization of the response curves of net photosynthetic rate (An) and WUE to light intensity (I) is paramount, serving as a prerequisite for determining key photosynthetic parameters including the maximum net photosynthetic rate (Anmax), the maximum intrinsic water use efficiency (WUEi-max), the maximum instantaneous water use efficiency (WUEinst-max), and their corresponding saturation light intensity (i.e., Isat, Ii-sat, Iinst-sat) (von Caemmerer, 2013; Ye et al., 2020; Yin et al., 2021). This process is essential for evaluating the impact of temperature and CO2 concentration on plant WUE and elucidating the relationship between carbon assimilation and water use. Various models have been established to characterize the light response curve of photosynthesis (An-I curve) in plants, such as the rectangular hyperbola (Thornley, 1998), non-rectangular hyperbolic model (hereafter called NRH model) (Thornley, 1976; Farquhar and Wong, 1984), exponential-based functions (Leakey et al., 2006), and the mechanistic model by Ye et al. (2013) (hereafter called Ye's models). While utilized to predict photosynthesis, most lack assessment of the light response of WUEi and WUEinst. Consequently, the NRH model has also been employed to describe WUEi-I and WUEinst-I curves. However, studies fitting the An-I curve have shown the NRH model significantly over/underestimates Anmax and cannot estimates Isat. Recently, we have developed WUEi-I and WUEinst-I models based on a mechanistic photosynthesis model, demonstrating accurate fitting of WUEi-I and WUEi-I curves for Glycine max and Amaranthus hypochondriacus at ambient temperature (Ye et al., 2020). However, their applicability across species and environments remains unknown.
In this study, we examined sweet sorghum leaf gas exchange across light levels under varying temperatures and CO2 concentrations using a portable LI-6800 photosynthesis system. Light response curves of An, stomatal conductance (gs), transpiration rate (Tr), WUEi, and WUEinst were modeled and analyzed. Specifically, we compared the widely used NRH model against the An-I, gs-I, Tr-I, WUEi-I, and WUEinst-I models by Ye et al. (Ye and Yu, 2008; Ye et al., 2013; Ye et al., 2020) for accuracy in representing response curves and deriving key photosynthetic parameters. The primary objectives were threefold: (a) to assess the flexibility of the Ye's models and the NRH model in photosynthesis in sweet sorghum under different CO2 and temperature conditions; (b) to evaluate applicability of the WUEi-I and WUEinst-I models based on the Ye's models and the NRH model to the C4 cereal crop sweet sorghum; (c) to elucidate light response characteristics of photosynthesis and WUE in sweet sorghum leaves under short-term exposure to elevated CO2 and temperature. These founding not only provide methodological insights for evaluating photosynthesis and water use efficiency dynamics in other crops but also contribute to a deeper understanding of the intricate associations among temperature, CO2 and light in modulating sweet sorghum photosynthesis to guide optimal cultivation in a shifting climate.
Materials and methods
Plant material and growth conditions
Sweet sorghum cultivar KF-JT-4 were obtained by the Institute of Modern Physics, Chinese Academic of Sciences. This early maturing cultivar was developed via heavy ion irradiation of the parental line KFJT-CK. Thirty seeds were surface sterilized by soaking in 0.025% carbendazim and germinated in Petri dishes on filter paper at 25°C in darkness until radicle emergence. Each seedling was then transplanted into a 1.86 L volume inverted truncated cone-shaped pots (top diameter 15 cm, bottom diameter 10 cm, height 15 cm) filled with field soil. Plants were grown in a controlled environment growth chamber (120 cm long, 75 cm wide, 200 cm high) (RDN-1000E-4, Ningbo Dongnan Instrument Co. Ltd., China) under conditions of 25°C, approximately 260 μmol photons m−2 s−1 radiation with a 12 h photoperiod, and 70% relative humidity. Plants were routinely watered and fertilized to prevent growth limitation.
After 40 days of cultivation (pre-jointing period), the plants were moved from the growth chamber to a natural laboratory environment to conduct measurements of leaf CO2 gas exchange. Subsequent to the completion of each measurement, the plants were promptly returned to the growth chamber. The experiment involved the selection of five healthy and uniform seedlings for analysis. Growth performance of plants is shown in Supplementary Figure 1. Key growth traits including plant height, stem diameter, and leaf dimensions were measured with a LI-3000C leaf area meter and are provided in Supplementary Table S1.
Gas exchange measurements and experimental setup
Leaf gas exchange measurement was performed using a portable photosynthesis system (LI-6800, Li-Cor Inc., USA) equipped with an integrated fluorometer chamber head (Li-6800-01A, Li-Cor Inc., USA). From the central leaf, the downward second mature and fully expanded leaf was used for measurement. Prior to each measurement, leaf was clamped in the leaf chamber and acclimated at an irradiance intensity of 1800 μmol m−2 s−1 for 30~40 min until a steady-state CO2 exchange was obtained. The system, featuring red and blue light sources, along with an integrated CO2 mixer set to 500 μmol s−1 flow rate, facilitated the light-response measurements of CO2 gas exchange.
Light-response measurements were systematically conducted in a descending order of light intensity levels: 2000, 1800, 1600, 1400, 1200, 1000, 800, 600, 400, 200, 150, 100, 50, 25, and 0 μmol m−2 s−1 at the leaf surface level. A minimum wait time of 2 minutes and a maximum of 3 minutes were set at each intensity level before recording data. The instrument automatically aligned reference and sample chamber conditions to ensure accuracy. Each measurement was replicated three times to enhance data reliability and mitigate potential variations.
The internal settings of the LI-6800 photosynthesis system enabled control of leaf temperature and CO2 concentration during gas exchange measurements. This allowed simulation of different temperature and CO2 treatments to assess short-term photosynthetic responses. Three leaf temperature treatments were imposed: 25, 30, and 35°C at 60-70% relative humidity. CO2 treatments included sub-ambient (250 μmol mol–1), ambient (410 μmol mol–1), and elevated (550 μmol mol–1) levels. Under each condition, total leaf exposure spanned 65-80 minutes, encompassing light acclimation (30-40 min) and light response measurements from 0 to 2000 μmol m−2 s−1 (30-45 min). Measurements occurred between 9:00-11:30 and 14:00-17:00 in April within a ~60 m2 laboratory under natural air circulation. This experimental design examined dynamic changes in sweet sorghum photosynthesis under short-term warming and elevated CO2 to elucidate plant responses to varying environmental conditions.
Analytical models and calculation
The dependence of An on I in Ye's models (Ye et al., 2013) is expressed as follows:
where An is the net photosynthetic rate, α is the initial slope of the An-I response curve, β and γ are the two parameters reflecting light limitation and light saturation, respectively, and Rd is the dark respiration rate.
The saturation light intensity (Isat) corresponding to Anmax can be calculated by the following equations:
and
The gs-I model established by Ye and Yu (2008) was given as follows:
where αs is the initial slope of the gs-I response curve, βs and γs are the two coefficients independent of I. gs0 is the residual stomatal conductance when I = 0.
The saturation light intensity (Ig-sat) corresponding to the maximum stomatal conductance (gs-max) can be found by the following equations:
and
WUEi can be calculated by the ratio of An to gs (An/gs) in μmol mol−1. The WUEi-I model established by Ye et al. (2020) was given as follows:
where αi denotes the initial slope of WUEi-I response curve, βi and γi are the two coefficients that are independent of I, and Ki is the residual WUEi.
The saturated light intensity (Ii-sat) corresponding to the maximum WUEi (WUEi-max) can be calculated by the following equations:
and
WUEinst is expressed as the ratio between An and Tr (An/Tr) in μmol mmol−1. The WUEinst-I model established by Ye et al. (2020) was given as follows:
where αinst denotes the initial slope of WUEinst-I response curve, βinst and γinst are the two coefficients that are independent of I, and Kinst is the residual WUEinst.
The saturation light intensity (Iinst-sat) corresponding to the maximum WUEinst (WUEinst-max) can be calculated by the following equations:
and
The dependence of An on I in NRH model (Thornley, 1976; Farquhar and Wong, 1984) is expressed as follows:
where An is the net photosynthetic rate at light intensity I, Anmax is the maximum net photosynthetic rate, α is the initial slope of An-I response curve, θ is the convexity of curve, and Rd is the dark respiration rate. The NRH model has also been used to characterize the responses of gs, Tr, WUEi, and WUEinst to I (Ye et al., 2020).
Statistical analysis
The data of An-I, gs-I, Tr-I, WUEi-I, and WUEint-I were fitted by non-linear regression using the Levenberg-Marquardt algorithm in SPSS version 24.0 and the Photosynthesis Model Simulation Software (PMSS, http://photosynthetic.sinaapp.com). Goodness of fit was evaluated by the coefficient of determination (R2). Student’s t-tests assessed differences in parameter values between the photosynthetic models and between fitted and observed values. The effects of temperature and CO2 on photosynthetic parameters were analyzed by one-way ANOVA with Duncan’s post-hoc test. Data were expressed as group mean ± standard errors (n = 3). Statistical significance was accepted at p<0.05.
Results
Performance of models in reproducing light response curves and quantifying photosynthetic traits
Both the Ye's models (Equations 1, 4) and the NRH model (Equation 13) successfully reproduced the An-I, gs-I, and Tr-I curves of sweet sorghum under varying temperatures (Figures 1A-I). The NRH model showed slightly higher R2 values in comparison to the Ye's models. However, NRH model predictions for Anmax values significantly exceeded observed values (Supplementary Table 2) (p<0.05). Additionally, gs-max and Tr-max values exhibited disparities with the measured values, either overestimated or underestimated. Focusing on the curves depicting the relationship between WUEi or WUEinst and I, the Ye's WUE models (Equations 7, 10) outperformed the NRH model across all temperature treatments by accurately captured the decline in WUEi and WUEinst as I increased under high light intensity, a trend not reflected by the NRH model (Figures 1J-O). WUEi-max and WUEinst-max values from the Ye's WUE models closely matched observed values, with no statistically significant differences (p>0.05) (Supplementary Table 2). In addition, saturation light intensities (Isat, Ig-sat, IT-sat, Ii-sat and Iinst-sat) corresponding to Anmax, gs-max, Tr-max, WUEi-max and WUEinst-max were directly obtained from the Ye's models fitting but not from the NRH model fitting (Table 2). WUEi-max and WUEinst-max values from the NRH model were significantly overestimated compared to observed values across all temperature conditions (p<0.05) (Supplementary Table 2).
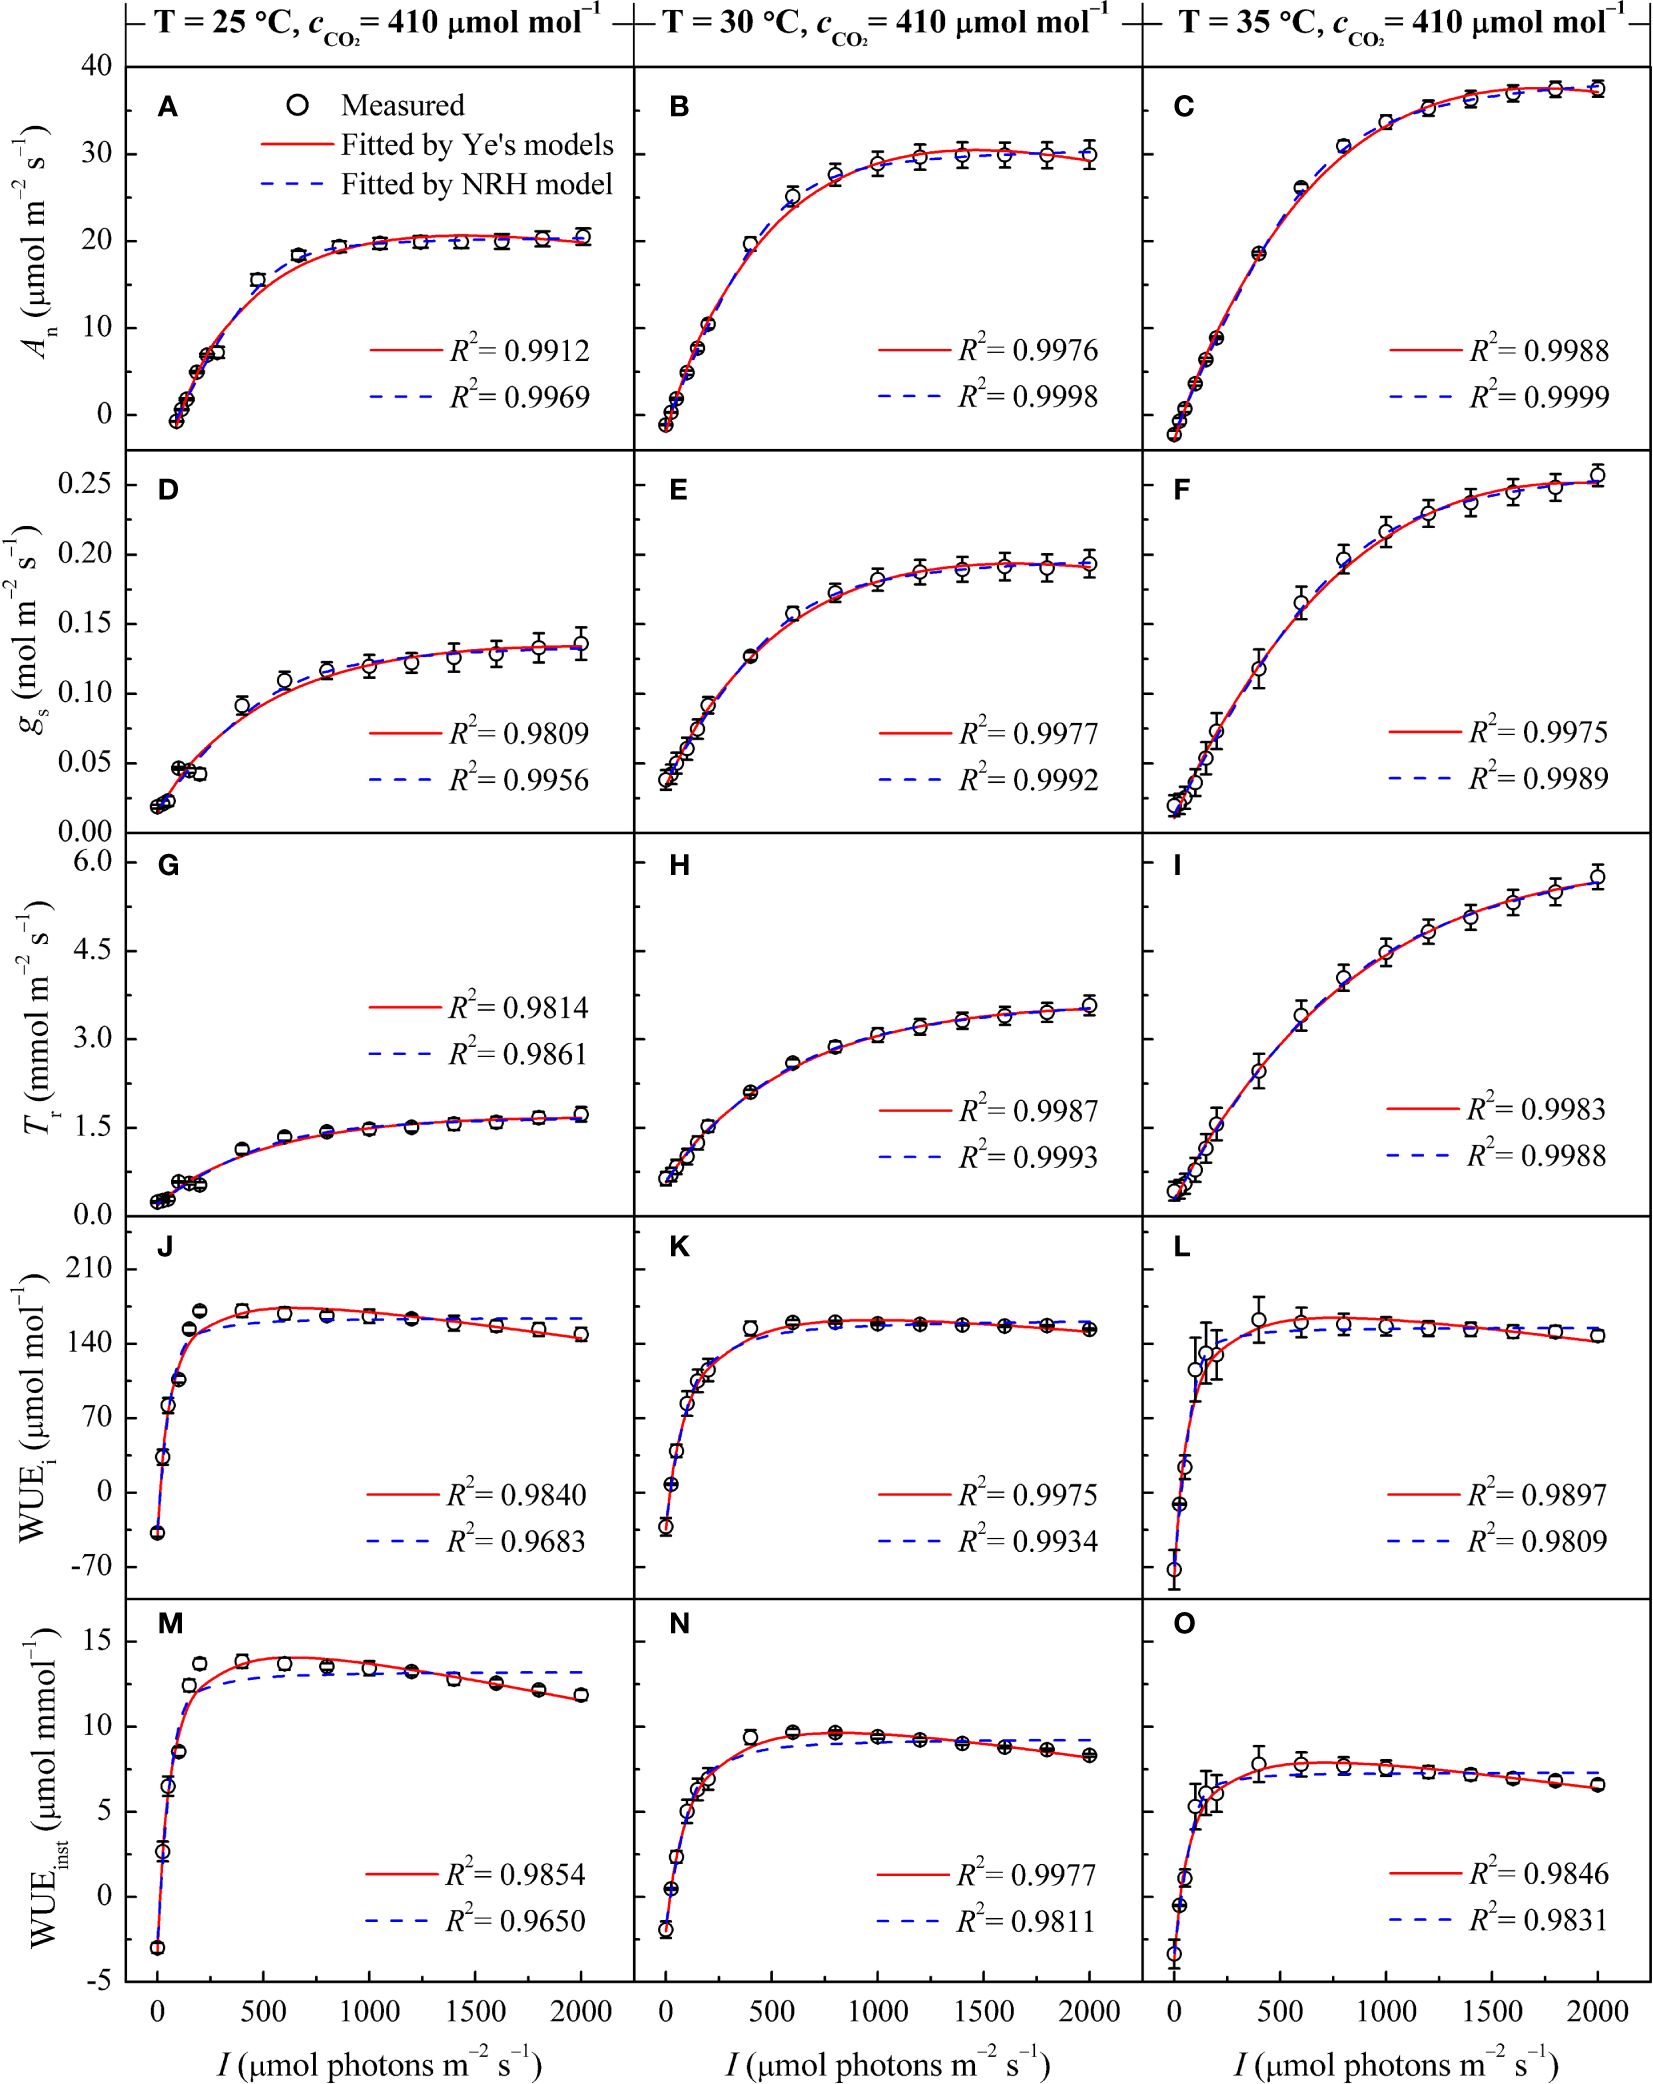
Figure 1 Changes in gas exchange parameters of sweet sorghum leaves across varied air temperatures (25, 30, and 35°C) under atmospheric CO2 level (410 μmol mol−1), alongside comparison of light response curves fitted by the Ye's models and the NRH model. (A-C) present the net photosynthetic rate (An); (D-F) stomatal conductance (gs); (G-I) Transpiration rate (Tr); (J-L) intrinsic water-use efficiency (WUEi); and (M-O) instantaneous water-use efficiency (WUEinst).
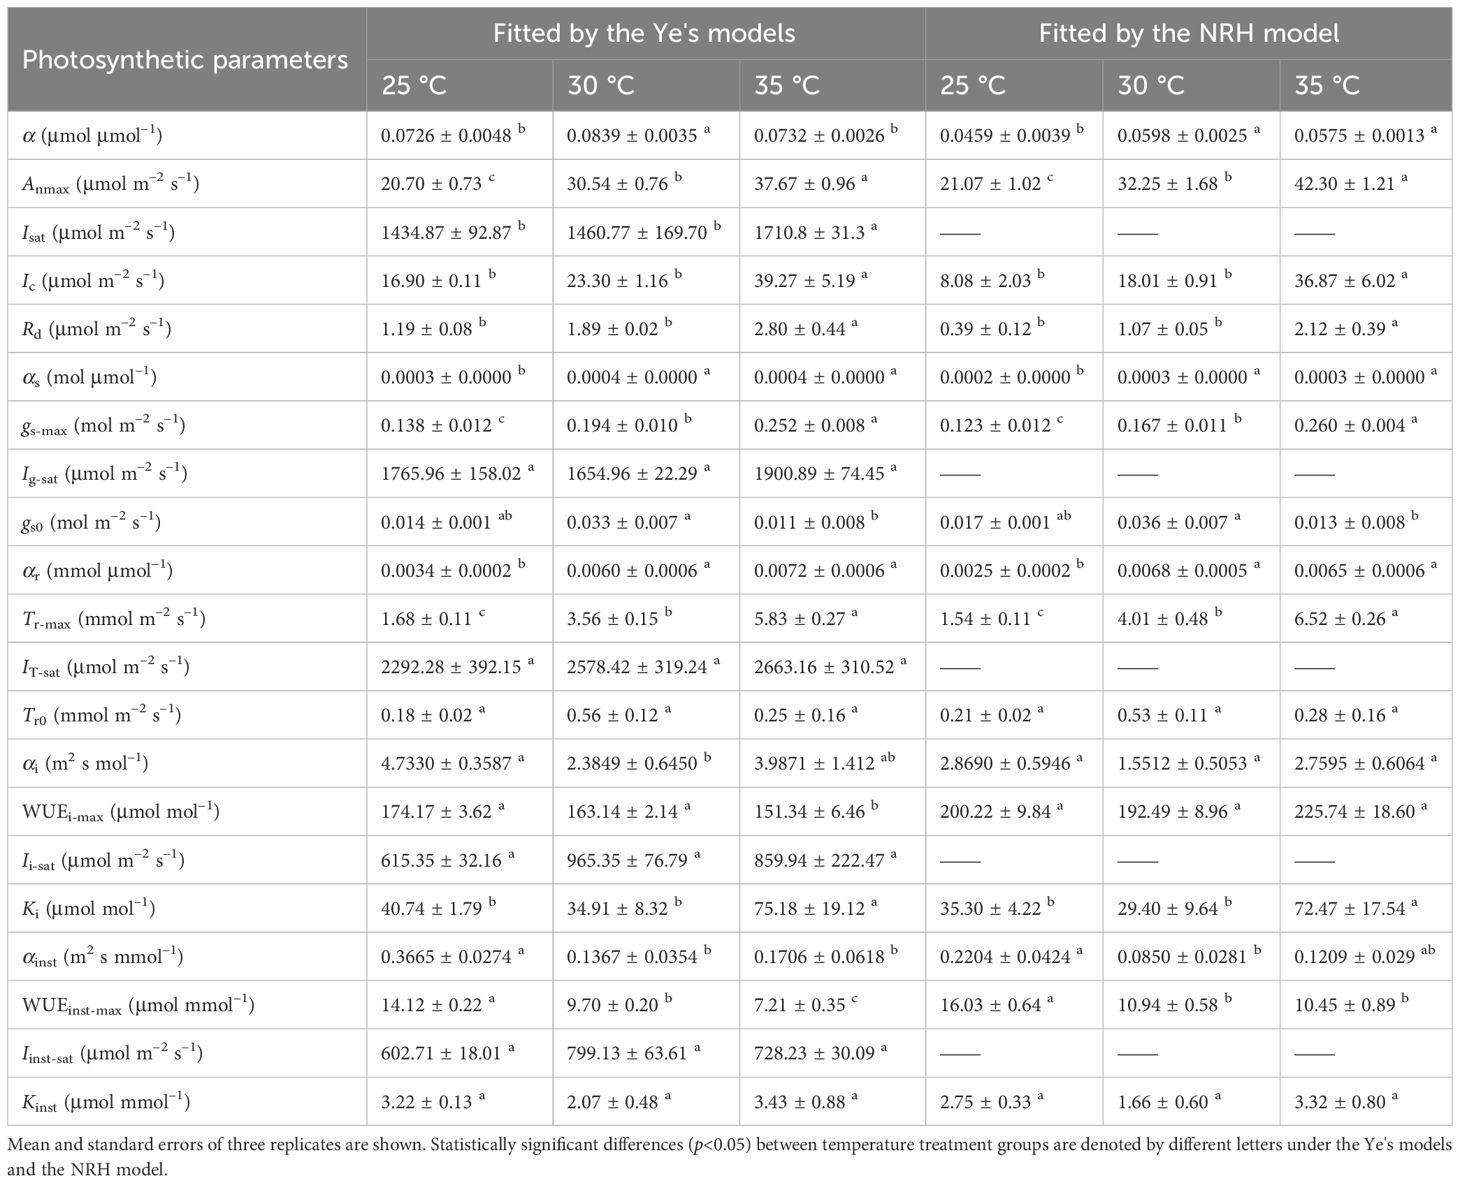
Table 2 Comparison analysis of photosynthetic parameters in sweet sorghum under varied temperature conditions at 410 μmol mol−1 CO2 based on fitting values from light response curves using different photosynthetic models.
Similar to its performance under varying temperatures, the NRH model was employed to fit the An-I curves under different CO2 concentrations, yielding Anmax values that exceeded their observed counterparts (Supplementary Table 3). While successfully reproducing the gs-I and Tr-I curves (Figures 2D-I), the NRH model struggled to accurately predict gs-max and Tr-max, consequently failing to determine corresponding saturation light intensities (Table 3). In contrast, the Ye's models performed exceptionally well in fitting these curves. When used to fit the WUEi-I and WUEinst-I curves under different CO2 concentrations, Ye's WUE models consistently demonstrated outstanding performance, with R2 exceeding 0.995 (Figures 2J-O). The fitted WUEi-max and WUEinst-max values showed no significant differences from their respective measured values (p>0.05) (Supplementary Table 3). Nevertheless, the NRH model inadequately captured changes in the responses of WUEi and WUEinst to I, particularly evident in a low fitting coefficient for WUEinst-I (Figures 2J-O). Consequently, the fitted WUEi-max and WUEinst-max values exceeded their measured counterparts by more than 20% (Supplementary Table 3).
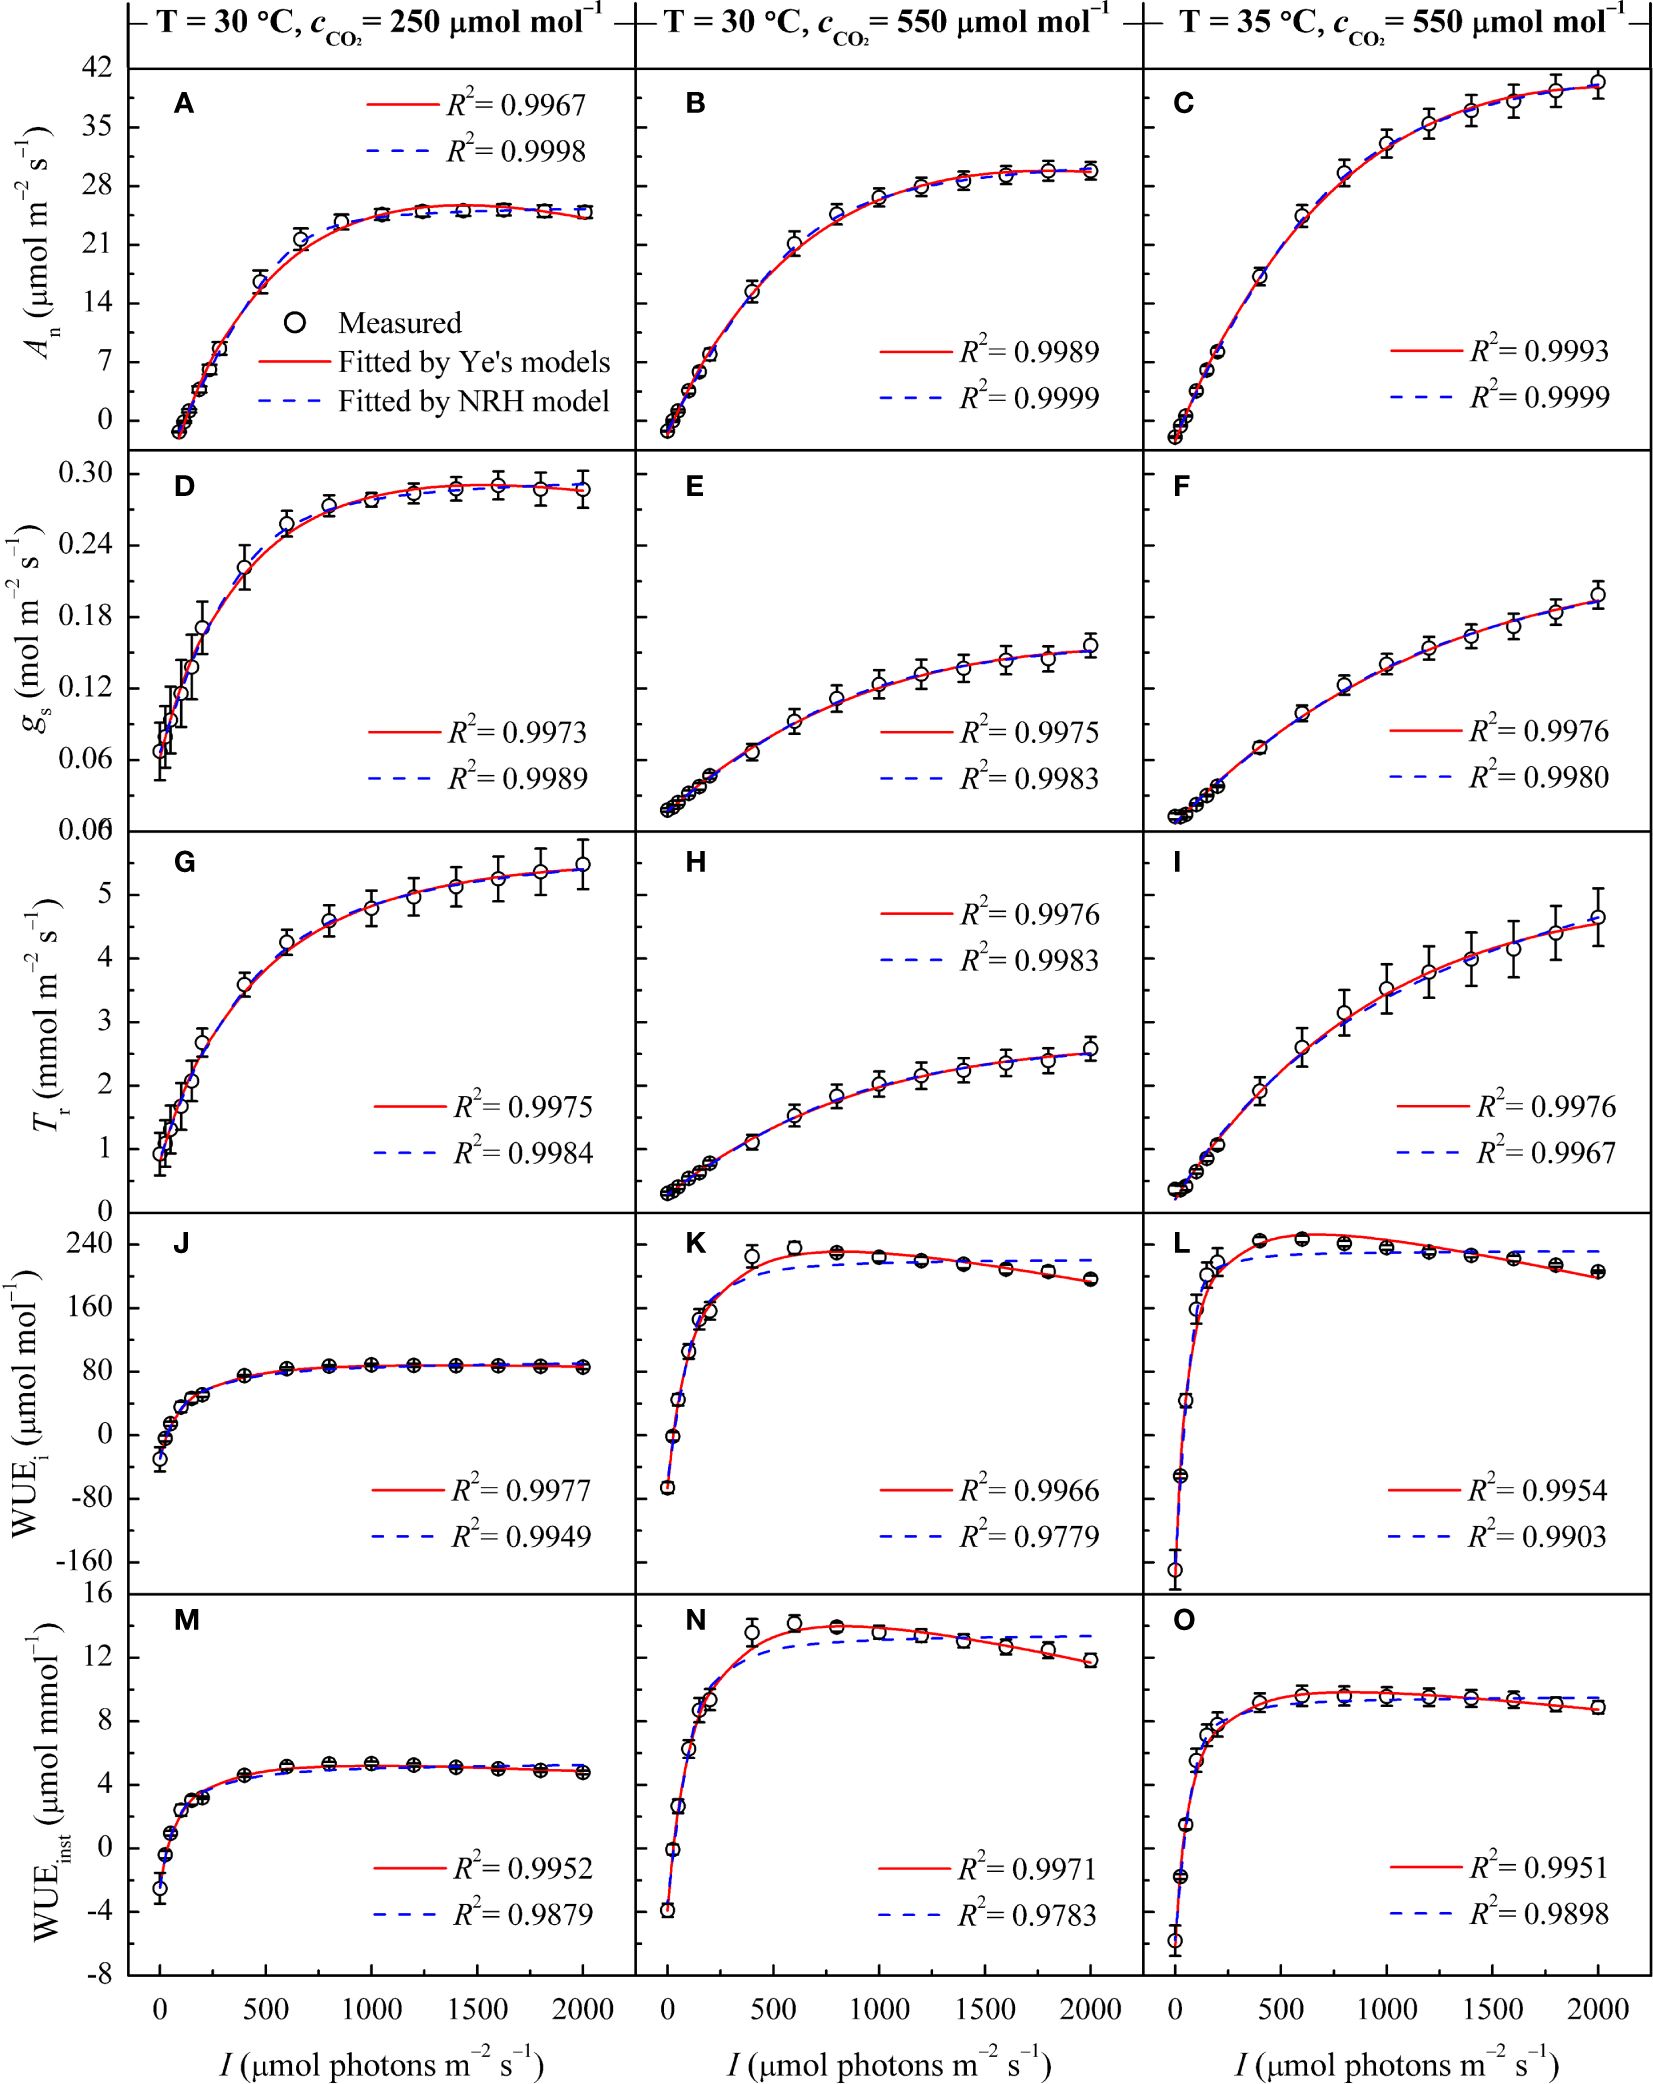
Figure 2 Changes in gas exchange parameters of sweet sorghum leaves across varied CO2 concentrations, as well as comparison of light response curves fitted by the Ye's models and the NRH model. Figures (A, B), (D, E), (G, H), (J, K) and (M, N) present changes in An, gs, Tr, WUEi, and WUEinst at 30°C under CO2 concentrations of 250 and 550 μmol mol−1, respectively. Figures (C, F, I, L) and (O) show the changes in An, gs, Tr, WUEi, and WUEinst at 35°C under a CO2 concentrations of 550 μmol mol−1.
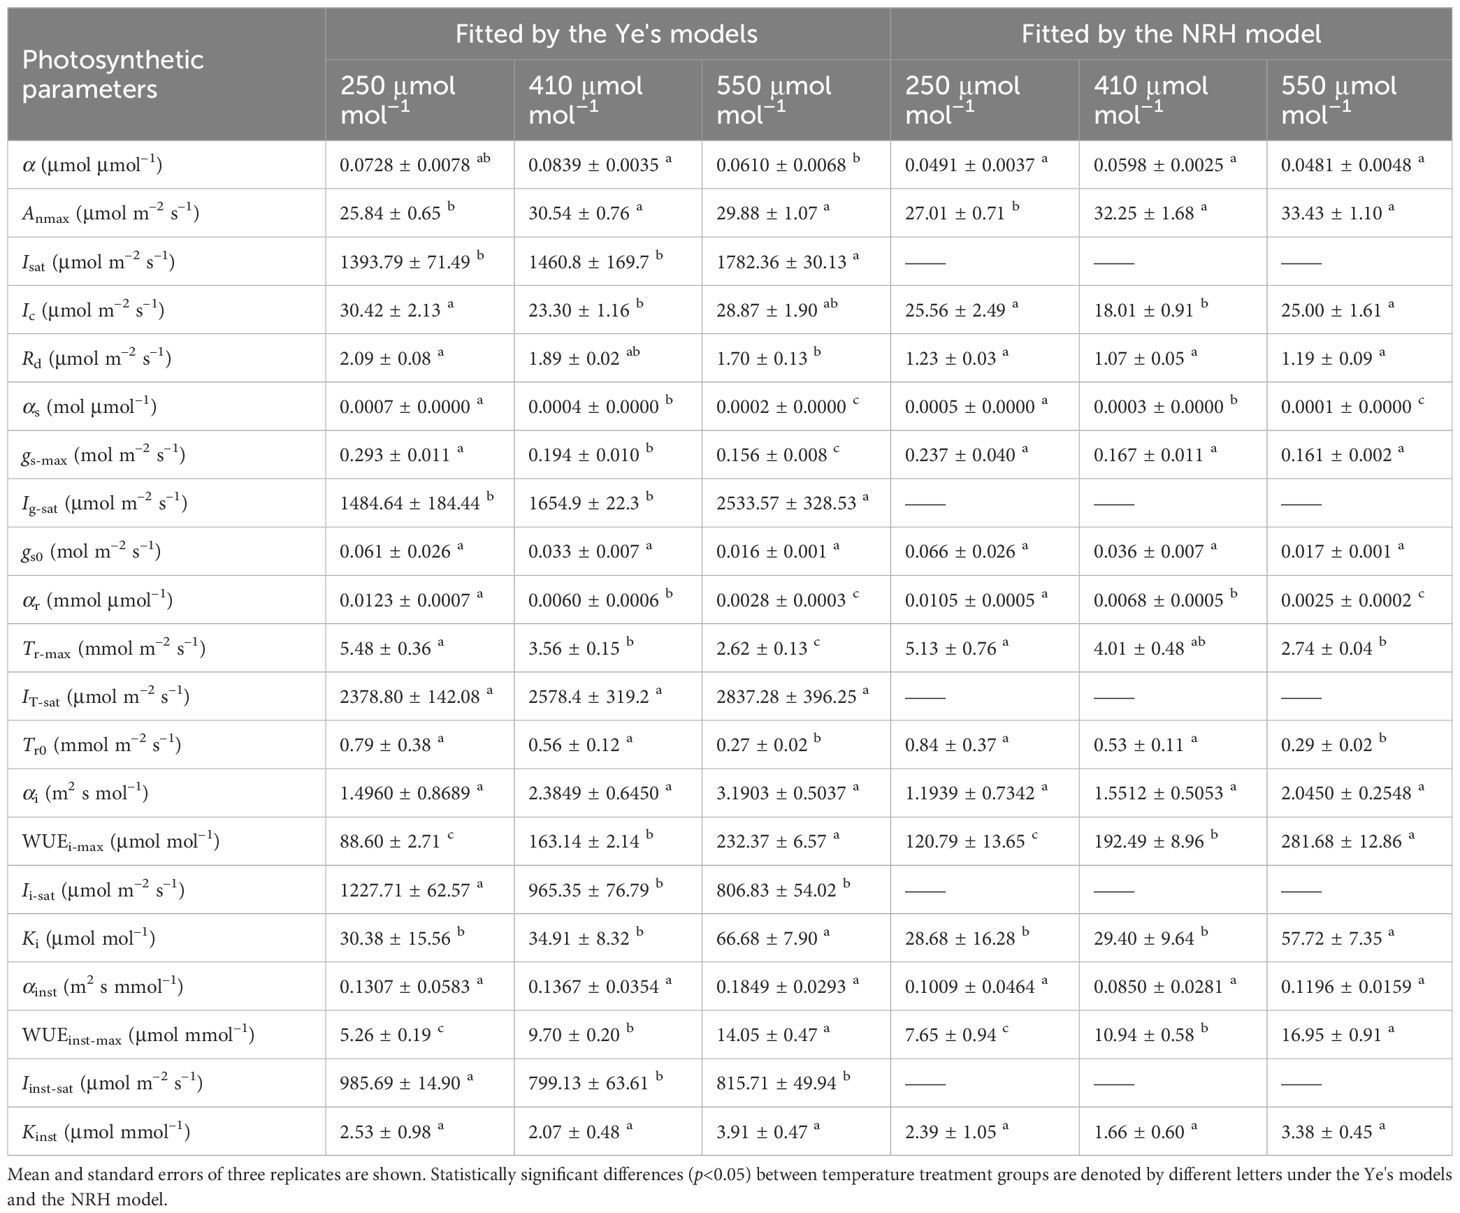
Table 3 Comparison analysis of photosynthetic parameters in sweet sorghum under varied CO2 levels at 30°C based on fitting values from light response curves using different photosynthetic models.
Light response curves of An, gs, Tr, WUEi and WUEinst in sweet sorghum under varied leaf temperatures
In Figures 1A-I, the responses of An, gs, and Tr to varying I under different leaf temperatures exhibited comparable patterns. Below 800 μmol m−2 s−1, An, gs, and Tr increased rapidly with increasing I until reaching their respective peaks (Anmax, gs-max, and Tr-max) at the specific saturation light intensities (Isat, Ig-sat, and IT-sat). Notably, at high light intensity levels (I >1400 μmol m−2 s−1), a decrease in An with increasing I was not observed, indicating the absence of photoinhibition. Figures 1J-O illustrates the variations in WUEi and WUEinst in response to I at different temperatures. Both WUEi and WUEinst showed almost linear increases within the 200 μmol m−2 s−1 range, indicating improving WUE with increasing I. In other words, the plant became more efficient in utilizing water for photosynthesis relative to the amount of light it received. However, upon reaching the WUEi-max and WUEinst-max at corresponding Ii-sat and Iinst-sat, gradual decreases were observed (Table 2), suggesting that additional light did not proportionally increase photosynthesis but potentially led to increased water loss without a corresponding increase in carbon gain. It should be noted that Tr for sweet sorghum under varying CO2 and temperature conditions did not reach saturation within the values of I applied for the Tr-I curve and hence values for IT-sat (and Tr-max) are an extrapolation.
The photosynthetic processes in sweet sorghum leaves were significantly influenced by temperature (one-way and two-way ANOVA p<0.05) (Tables 2, 4). At an ambient CO2 level (410 μmol mol−1), elevating temperature led to significant increases in Anmax, gs-max, and Tr-max (p<0.05). This rise in temperature also corresponded with amplified values in Isat, Ic, and Rd. However, both WUEi-max and WUEinst-max consistently declined with increasing temperature, with WUEinst-max displaying the most pronounced decrease and significant differences across temperature levels (p<0.05). For instance, increasing the temperature from 25°C to 30°C caused increase of 47.54%, 40.58%, and 111.91% in Anmax, gs-max, and Tr-max, respectively (p<0.05). No significant changes were observed in Isat and Ig-sat, while IT-sat exhibited a non-significant increase (p>0.05). WUEi-max only decreased by 6.33% without significant differences, whereas WUEinst-max significantly decreased by 31.30% (Table 2). Further increasing the temperature from 30°C to 35°C, despite the moderated enhancements in Anmax, gs-max, and Tr-max (increases of 23.34%, 29.90%, and 63.76%, respectively), the reduction in WUEi-max expanded to 7.23%, and WUEinst-max declined by 25.67%. Higher temperature raised the saturation light intensities corresponding to WUEi-max and WUEinst-max (Table 2). However, at an elevated CO2 level (550 μmol mol−1), rising temperature from 30°C to 35°C significantly increased WUEi-max, while expanding the decline of WUEinst-max to 29.47% due to a substantial 88.55% increase in Tr-max (Supplementary Table 4).
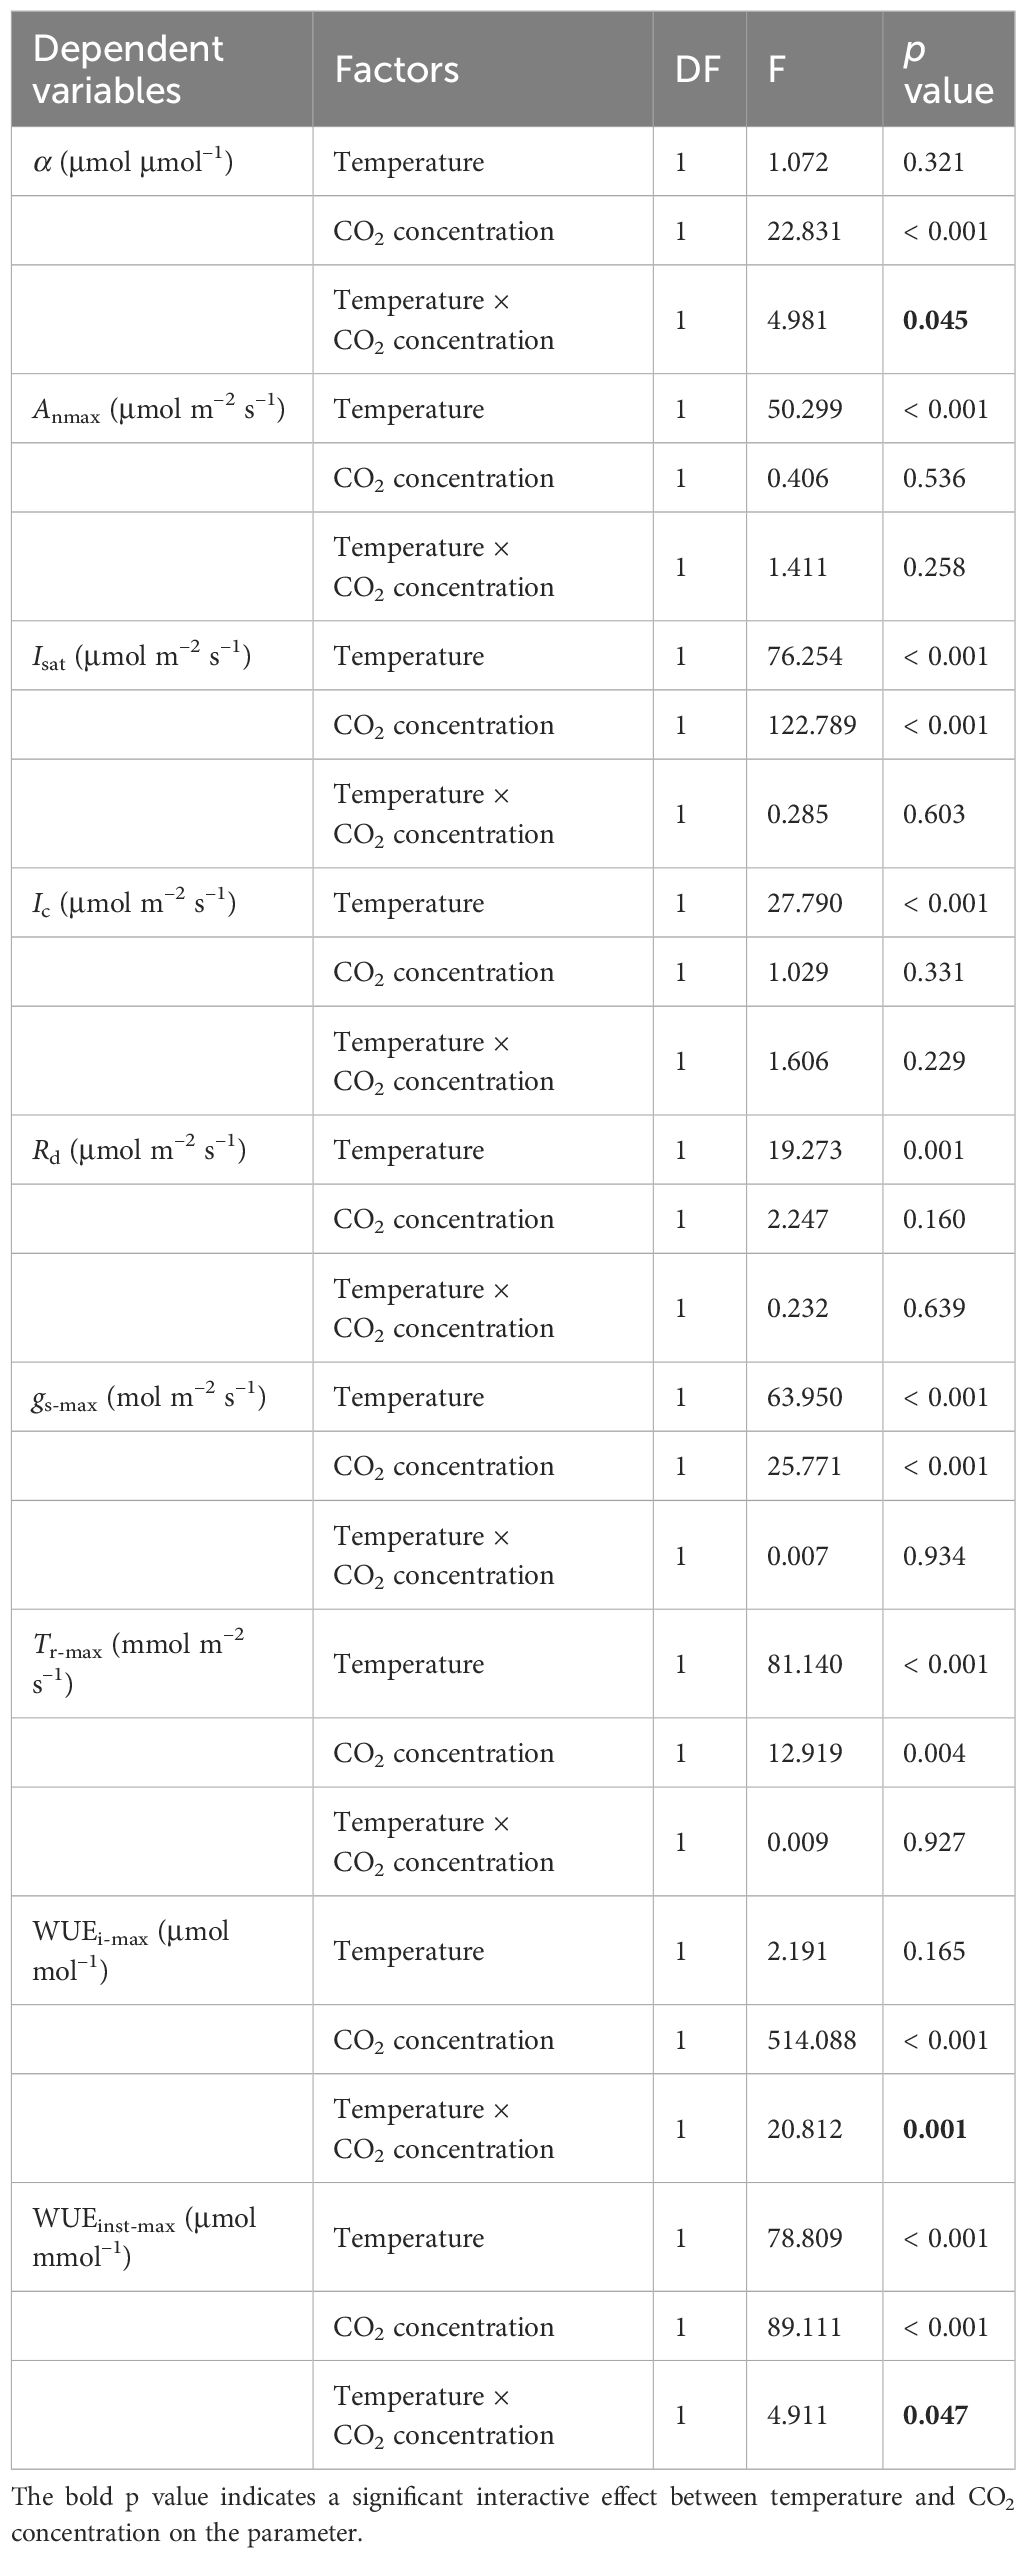
Table 4 Summary of two-way ANOVA analysis between the effects of temperature and CO2 concentration on key photosynthetic parameters of sweet sorghum.
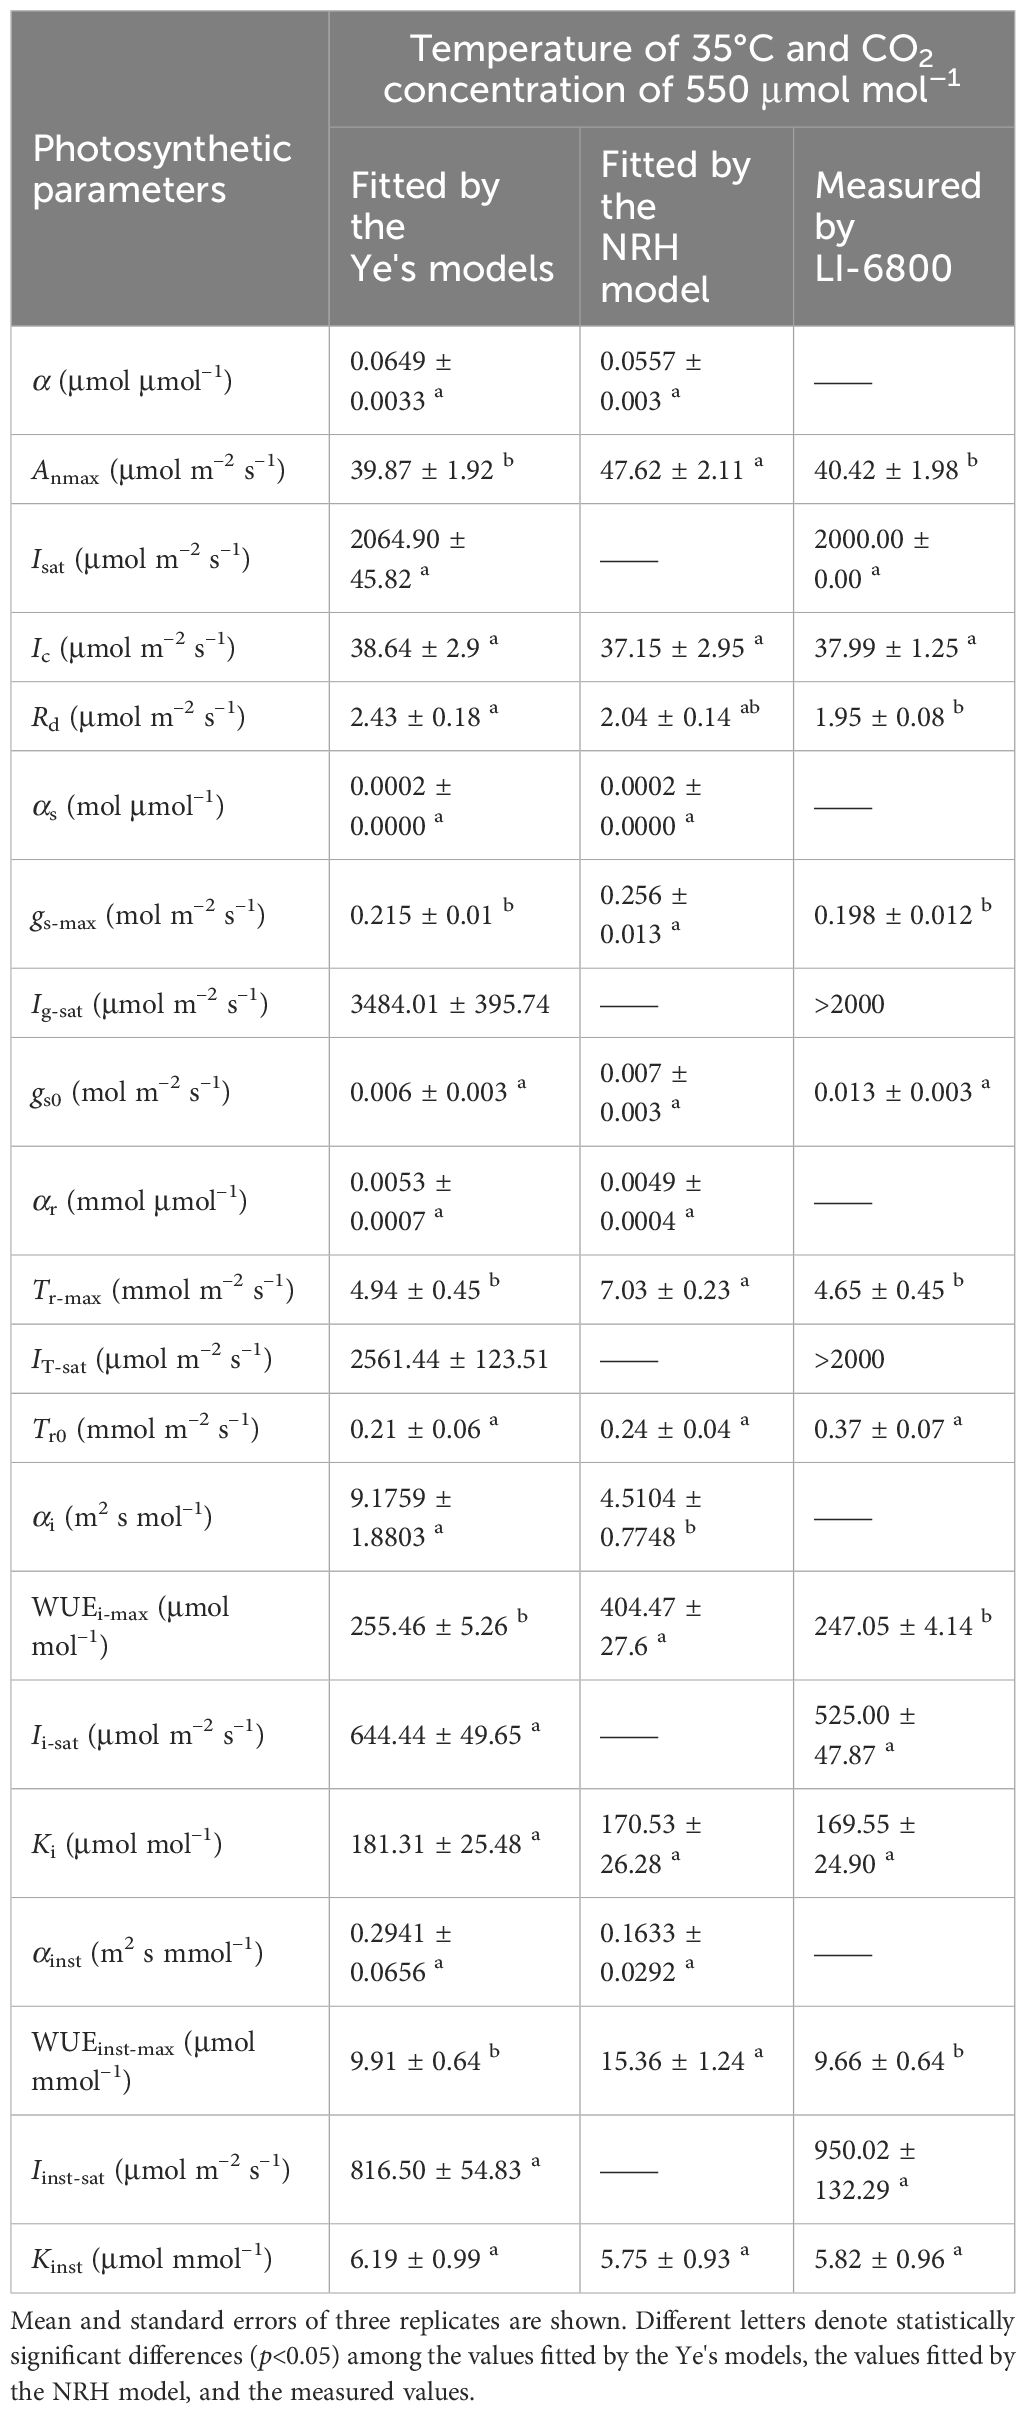
Table 5 Comparison of results fitted by the Ye's models and the NRH model with measured data in sweet sorghum under elevated CO2 concentration (410 μmol mol−1) and high temperature (35°C) in combination.
Light response curves of An, gs, Tr, WUEi and WUEinst in sweet sorghum under varied air CO2 concentrations
In Figures 2A-D, under sub-ambient CO2 concentration, An and gs exhibited consistent response trends to I, rapidly increasing and reaching An-max and gs-max at corresponding Isat and Ig-sat. With increasing CO2 concentration, the responses of gs and Tr to I gradually shifted from a single-peaked pattern to an approximately linear increase (Figures 2D-I). Under elevated CO2, An reached saturation within the measured light intensity range, whereas gs and Tr increased nearly linearly with I, especially at 35°C (Figures 2F, I). Across varying CO2 concentrations, the patterns in WUEi-I and WUEinst-I curves displayed distinct divisions into light-limited, light-saturated, and light-inhibited segments (Figures 2J-O). At high light intensity (I>1000 μmol m−2 s−1) under elevated CO2, both WUEi and WUEinst showed a significant reduction.
At a specific temperature (30°C), increasing CO2 concentration from 250 to 410 μmol mol−1 resulted in increased Anmax and α for sweet sorghum, while decreasing Ic and Rd (Table 3). Isat corresponding to Anmax remained unchanged. However, further increasing the concentration to 550 μmol mol−1 did not cause a continual increase in Anmax; instead, it raised both Isat and Ic. Elevated CO2 significantly weakened photosynthesis under light-limited conditions, as evidenced by reductions in α, αg, and αT (Table 3). For gs and Tr, their values decreased as CO2 levels rose, and their response curves to light became less steep (Figures 2D-I), leading to a significant decrease in gs-max and Tr-max (p<0.05). Consequently, there was a substantial increase in both WUEi-max and WUEinst-max with elevated CO2 (p<0.05). Specifically, upon elevating CO2 concentration from 410 to 550 μmol mol−1, gs-max decreased by 19.59%, Tr-max by 26.40%, while WUEi-max increased by 42.44% and WUEinst-max by 44.85% (Table 5).
At a high temperature of 35°C, elevated CO2 concentration positively impacted photosynthesis in sweet sorghum, resulting in a 5.8% increase in Anmax (Table 5, Supplementary Table 4). Similar decreases occurred in gs-max and Tr-max, but the plants’ dependence on light increased, as evidenced by Isat, Ig-sat and IT-sat, all exceeding 2000 μmol photons m–2 s–1. Notably, WUEi-max showed significant improvement, reaching 255.46 ± 5.26 μmol mol–1, significantly higher than all other treatment groups (one-way and two-way ANOVA p<0.05) (Tables 4, 5). However, the increase in WUEinst-max was significantly lower compared to the increase observed under elevated CO2 at 30°C, reaching only 37.45% (Supplementary Table 4).
Interactive effect of temperature and CO2 concentration on key photosynthetic parameters
The interactive effect of temperature and CO2 concentration on key photosynthetic parameters was assessed in sweet sorghum using a two-way analysis of variance (ANOVA) (Table 4). Temperature provoked highly significant main effects (p<0.001) on Anmax, Isat, Ic, Rd, gs-max, Tr-max, and WUEinst-max, suggesting increasing the temperature from 30°C to 35°C profoundly impacted these traits independently of CO2 concentration. Meanwhile, elevated CO2 concentration induced highly significant main effect (p<0.001) on Isat, gs-max, Tr-max, and WUEi-max, regardless of temperature. Statistically significant interaction effects between temperature and CO2 were observed for the intrinsic quantum yield (α) at p<0.05, as well as for WUEi-max, and WUEinst-max. Quantum yield represents the photon requirement for assimilating one CO2 molecule during photosynthesis. This suggests that the impact of temperature differed across CO2 levels in determining the ability of sweet sorghum to acquire and use water.
DISCUSSION
Applicability of Ye's models to NRH model
In this study, we employed a methodological approach that involved a comparative analysis of models against observed data. This facilitated a systematic assessment and differentiation of the Ye's models and the NRH model concerning their abilities to replicate the An-I, gs-I, Tr-I, WUEi-I, and WUEinst-I curves of sweet sorghum. We also focused on quantifying the key traits defining these curves. Remarkably, the Ye's models excelled not only in capturing the diminishing trends in photosynthetic parameters (e.g. An, WUEi, WUEinst) with increased light intensity, but also in accurately determining critical photosynthetic traits across diverse temperatures and CO2 conditions. These findings align with previous research applying the Ye's models to Cyanobacteria (Yang et al., 2022; Yang et al., 2023), Chlorophyta, Bacillariophyta (Yang et al., 2020), and other plants (Xu et al., 2012; Atsushi et al., 2017; Martínez-García et al., 2017; Liu et al., 2018; Ye et al., 2020), demonstrating its broad utility.
Since its establishment by Thornley in 1976, the NRH model has been extensively utilized to study the response of plant photosynthesis to light, elucidating changes in plant growth and physiology across diverse environments (Yu et al., 2004; Ye and Yu, 2008; dos Santos Junior et al., 2012; Xu et al., 2012; Domingues et al., 2014; Wassenaar et al., 2022; Wu et al., 2023). However, upon taking the first derivative of the mathematical expression characterizing the relationship between the variables An and I, as defined by Equation 13 in the NRH model, an analytical solution was not obtained. This implies that the NRH model follows an asymptotic function for An rather than a closed-form solution. Consequently, the NRH model does not produce analytical solutions for the maximum An and the specific saturation light intensity for Anmax. Anmax may be numerically estimated from the NRH model through nonlinear least squares calculations (Ye et al., 2021). When parameters such as An, gs, Tr, WUEi, and WUEinst of plants reach saturation or decrease with increasing I under high light intensities, the maximum values obtained by fitting their light response curves using the NRH model would inevitably deviate significantly from their observed values. This discrepancy explains why the Anmax, gs-max, Tr-max, WUEi-max, and WUEinst-max derived from the NRH model fitting for sweet sorghum in this study significantly differed from the measured data. These findings are consistent with previous reports of similar discrepancies (dos Santos Junior et al., 2012; Xu et al., 2012; Atsushi et al., 2017; Martínez-García et al., 2017; Liu et al., 2018).
Photoinhibition is the well-documented, light-induced decrease in photosynthetic rate in plants that occurs upon exposure to excess irradiance exceeding their utilization capacity (Anderson et al., 2021). Similarly, in the present study, both the WUEi-I and WUEinst-I curves of sweet sorghum exhibited declining trends under high light intensities, consistent with our previous findings in Glycine max and Amaranthus hypochondriacus (Ye et al., 2020). This reduction in plant WUE under high irradiance appears to be common across species. Thus, light response models that do not effectively capture decreases in photosynthetic parameters under high light conditions are likely to fail in elucidate plant responses across varying irradiance environments and determine actual physiological states (Egea et al., 2011). In contrast, by incorporating light inhibition effect (β) and a light saturation parameter (γ), the Ye's model (Equations 1, 7, 10 ) provided excellent fits to the An-I, WUEi-max-I, and WUEinst-max-I curves of plants, irrespective of temperature or CO2 concentration (Ye et al., 2013; Ye et al., 2020).
Effect of elevated temperature on dynamic photosynthesis and water use efficiency in sweet Sorghum leaves
Plants facing environmental stress commonly exhibit reduced leaf photosynthesis (Hatfield and Dold, 2019). However, our study revealed sweet sorghum exhibited robust photosynthesis and a lack of photoinhibition at high temperatures up to 35°C, aligning with literature suggesting greater photosynthetic thermotolerance in sorghum species (Loreto et al., 1995; Prasad et al., 2021; Sales et al., 2021). Specifically, previous evidence indicates that optimal temperatures exceeding 35°C sustain the enzymatic rates of key C4 cycle enzymes like pyruvate orthophosphate dikinase and phosphoenolpyruvate carboxylase in sorghum (Loreto et al., 1995; Sales et al., 2021), thereby preserving carbon assimilation even at high temperatures. Through concentrating CO2 at the site of Rubisco, C4 plants effectively suppress photorespiration while simultaneously minimizing transpiration. This twin benefit confers advantages to C4 species over C3 plants in hot, arid climates (Sales et al., 2021). Therefore, the thermotolerant photosynthesis exhibited by sweet sorghum likely facilitates the ecological success of C4 cereals including sorghum across tropical and subtropical agroecosystems prone to heat stress. Further examination of genotypic variation in thermal acclimation processes governing photosynthesis may inform climate-resilient crop development.
gs has been considered one of the most vital indicators of a plant’s response to environmental fluctuations, yet its reaction to temperature has been relatively understudied (Urban et al., 2017). Some earlier studies have suggested divergent responses of gs to increasing temperatures, including an increase (Mott and Peak, 2010; Urban et al., 2017), no significant change, or even stomatal closure. Our present results are consistent with previous research in Tradescantia pallida (Mott and Peak, 2010), Pinus taeda, and Populus deltoides x nigra (Urban et al., 2017). As temperatures increased, gs of sweet sorghum gradually increased, enhancing the exchange of CO2 and H2O and elevating the CO2 uptake. In early research, gs and An were commonly presumed to share a stable, linear relationship, with gs and An exhibiting synergistic increases or decreases in response to varying environmental conditions. The patterns of gs and An in sweet sorghum leaves showed some parallels when responding to light. However, because gs is more thermally sensitive, a slight decline in WUEi was observed when leaf temperatures increased from 30°C to 35°C. Typically, increased temperature coupled with heightened vapor pressure deficit (VPD) results in increased Tr, followed by cell shrinkage and stomatal closure (Urban et al., 2017; Sales et al., 2021). Interestingly in this study, even when the VPD of sweet sorghum leaves rose to 2.2 kPa at 35°C, the intercellular CO2 concentration (Ci) remained relatively stable, implying stomata did not close. Instead, VPD, gs, and An increased concurrently (Supplementary Figure 2, Figures 1A-F). This aligns with observations in Oryza and Flaveria bidentis under elevated temperatures (Kubien et al., 2003; Scafaro et al., 2011), contrasting the behavior of the C4 Model Setaria viridis (Anderson et al., 2021). The differential stomatal responses to warming may be attributable to variances in plant functional type or evolutionary origin (Bykova et al., 2019). Therefore, the findings indicate photosynthesis in sweet sorghum was not suppressed by elevated temperatures; rather, it was stimulated by widening of stomatal openings to enhance CO2 influx, expediting assimilation rates.
The variation in WUEinst of sweet sorghum became more noticeable with increasing temperature. Notably, WUEinst substantially decreased relative to WUEi, primarily due to the disproportionate increase in transpiration compared to photosynthesis under elevated temperatures. For example, from 30°C to 35°C, Tr-max increased 2.73 times compared to Anmax and 2.02 times versus gs-max. WUEi indicates a long-term water use balance between assimilation and conductance, independent of vapor pressure deficit (von Caemmerer and Farquhar, 1981; Gyimah and Nakao, 2007; Ye et al., 2020). In this study, sweet sorghum exhibited a minor decrease in WUEi with elevated temperatures, highlighting adaptation via prioritizing growth and survival over short-term heat stress. In contrast, WUEinst experienced a significant decrease. As WUEinst represents plant yield per water loss, aligning with whole-plant WUE (Wall et al., 2001). Its substantial reduction indicates a trade-off of water to ensure survival under high temperatures. This could be seen as a physiological mechanism employed by sweet sorghum for leaf cooling under short-term heat stress, as adopted in other species (Scafaro et al., 2011; Anderson et al., 2021). Collectively, these results reveal that sweet sorghum adjustments to maintain photosynthesis, transpiration and respiration could outweigh slower WUE adaptations, especially diminishing dynamic WUEinst.
Effect of elevated CO2 concentration on dynamic photosynthesis and water use efficiency in sweet sorghum leaves
Raising CO2 levels from 250 to 410 μmol mol–1 enhanced photosynthesis in sweet sorghum at moderate temperatures, consistent with observations in many plants (Gago et al., 2014; Kimball, 2016). The heightened substrate availability drives this initial photosynthetic response. However, further elevating CO2 concentration to 550 μmol mol–1 did not lead to a consistent and proportional increase in photosynthesis. In concordance with previous research indicating reduced sorghum yield under elevated CO2 concentrations (Kimball, 2016; Asadi and Eshghizadeh, 2021), this suggests that sweet sorghum’s photosynthetic system cannot fully capitalize on CO2 levels beyond a saturation threshold. Instead, alternative factors such as light availability, may become limiting beyond this point. Despite lacking statistical significance, elevated CO2 concentration did improve photosynthesis at 35°C. Two-way ANOVA analysis from Table 4 also indicated CO2 level impacts on sweet sorghum’s light use efficiency and WUE (including both intrinsic and instantaneous aspects) vary across temperatures, highlighting complex interplay between temperature and CO2 in photosynthetic responses. Previous research emphasized that the magnitude of An at elevated temperatures is primarily determined by the electron transfer capacity, suggesting that sweet sorghum photosynthesis has been constrained by irradiance and temperature under current atmospheric CO2 (Loreto et al., 1995; McAusland et al., 2016; Sales et al., 2021).
The CO2 rise induced partial stomatal closure, reducing gs and Tr, consequently improving WUE, a widely observed response (Conley et al., 2001; Allen et al., 2011). The reduction in gs under high CO2 levels is recognized as an adaptive response across various plant species (Farooq et al., 2019). Higher atmospheric CO2 led to elevated Ci in leaves, increasing stomatal sensitivity and prompting adjustments to maintain Ci below ambient levels (Urban et al., 2017; Feng et al., 2023). Contrary to previous studies attributing heightened WUEi to simultaneous increases in An and decreases in Tr under elevated CO2 (Conley et al., 2001; Ye et al., 2020), improvements here arose primarily from reductions in gs and Tr, rather than an increase in An. Furthermore, CO2-induced reductions in gs and Tr diminished at 35°C, suggesting that this stomatal response weakens with increasing leaf temperature. This interaction emphasizes the complex CO2-temperature interplay in shaping plant responses. Despite the substantial increase in WUEi to 255.46 ± 5.26 μmol mol–1 under the combined influence of elevated CO2 and temperature implies the adaptive capacity of sweet sorghum to shifting environments, the precise mechanisms remain unclear and require further investigation. Optimizing WUE likely involves intricate signaling and physiological adjustments (Hatfield and Dold, 2019).
While providing unique insights into immediate photosynthetic responses, our short-term exposures are constrained in comparison to long-term open-top chamber (OTC) and free-air CO2 enrichment (FACE) studies. Prolonged OTC and FACE exposures over weeks or months facilitate a thorough characterization of gradual acclimation processes, revealing cumulative impacts on physiology, metabolism, tissue structure, gene/protein expression, yield, and overall plant adaptation. Looking ahead, it is imperative to conduct systematic and long-term investigations to gain a more nuanced understanding of sweet sorghum’s adaptability to climate change scenarios and its potential under predicted climatic conditions. These future studies should meticulously explore morphological, physiological, and biochemical differences within the plant, encompassing variations in responses among roots, stems, and leaves. Additionally, our use of indoor-cultivated seedlings differs from field-grown plants. While growth chambers allow precise regulation of conditions like temperature, humidity, and lighting to reduce variability and stressors, indoor cultivation may heighten sensitivity to environmental shifts. Transferring seedlings from controlled growth chamber to the lab with open gas circulation for gas exchange measurements may induce physiological changes due to altered growth conditions. Despite efforts to minimize variation, the transition between environments could result in transient responses that would not occur in plants already acclimated to field settings.
Conclusion
Our study further validates the superiority of the photosynthesis models proposed by Ye et al. for simulating the light response curves of An, gs, Tr, WUEi, and WUEinst. Particularly, when employed to fit the WUEi-I and WUEinst-I curves, the models uniquely capture the decline in both WUEi and WUEinst with increasing I under high light intensity. Across all experimental conditions, it returns the values for Anmax, gs-max, Tr-max, WUEi-max, and WUEinst-max closely matching measured data. In contrast, the NRH model inadequately reproduces the WUEi-I and WUEinst-I curves and severely overestimates Anmax, WUEi-max, and WUEinst-max relative to measurements. It also fails to determine the corresponding saturation light intensities for these traits. In addition, sweet sorghum exhibits remarkable heat tolerance up to 35°C, achieving higher An through stimulated gs. However, disproportionate increase in Tr lead to a sharp decline in WUEinst. Increasing CO2 concentration from sub-ambient to ambient levels has a significant positive effect on photosynthesis in sweet sorghum, but no consistent and proportional increase is observed at 550 μmol mol−1. Elevated CO2 causes partial stomatal closure in sweet sorghum leaves, markedly reducing gs and Tr, thereby improving WUEi and WUEinst. Nevertheless, the effect of CO2-induced stomatal closure in reducing transpiration progressively diminishes at high temperature owing to stomatal opening. Elucidating the physiological mechanisms governing plant responses to combined environmental factors will enable identifying adaptive traits to accelerate resilient crop development amidst intensifying environments.
Data availability statement
The original contributions presented in the study are included in the article/Supplementary Material. Further inquiries can be directed to the corresponding authors.
Author contributions
X-LY: Conceptualization, Data curation, Formal Analysis, Investigation, Writing – original draft. X-FM: Writing – review and editing, Resources, Supervision, Software. Z-PY: Funding acquisition, Methodology, Writing – review and editing, Software. L-SY: Writing – review and editing, Investigation. J-BS: Writing – review and editing, Investigation. XW: Writing – review and editing, Investigation. B-BZ: Writing – review and editing, Visualization. F-BW: Writing – review and editing. Z-FD: Funding acquisition, Supervision, Writing – review and editing, Project administration.
Funding
The author(s) declare financial support was received for the research, authorship, and/or publication of this article. This research was supported by the Natural Science Foundation of China (Grant No. 31960054 and 32260063) and the China Postdoctoral Science Foundation (Grant No. 2023M733681).
Conflict of interest
The authors declare that the research was conducted in the absence of any commercial or financial relationships that could be construed as a potential conflict of interest.
Publisher’s note
All claims expressed in this article are solely those of the authors and do not necessarily represent those of their affiliated organizations, or those of the publisher, the editors and the reviewers. Any product that may be evaluated in this article, or claim that may be made by its manufacturer, is not guaranteed or endorsed by the publisher.
Supplementary material
The Supplementary Material for this article can be found online at: https://www.frontiersin.org/articles/10.3389/fpls.2024.1291630/full#supplementary-material
References
Allen, L. H., Kakani, V. G., Vu, J. C. V., Boote, K. J. (2011). Elevated CO2 increases water use efficiency by sustaining photosynthesis of water-limited maize and sorghum. J. Plant Physiol. 168, 1909–1918. doi: 10.1016/j.jplph.2011.05.005
Anderson, C., Mattoon, E., Zhang, N., Becker, E., Mchargue, W., Yang, J., et al. (2021). High light and temperature reduce photosynthetic efficiency through different mechanisms in the C4 model Setaria viridis. Commun. Biol. 4, 1092. doi: 10.1038/s42003-021-02576-2
Appiah-Nkansah, N. B., Li, J., Rooney, W., Wang, D. (2019). A review of sweet sorghum as a viable renewable bioenergy crop and its techno-economic analysis. Renew. Energ. 143, 1121–1132. doi: 10.1016/j.renene.2019.05.066
Asadi, M., Eshghizadeh, H. R. (2021). Response of sorghum genotypes to water deficit stress under different CO2 and nitrogen levels. Plant Physiol. Bioch. 158, 255–264. doi: 10.1016/j.plaphy.2020.11.010
Atsushi, S., Tatsuya, K., Shigeto, T., Masashi, Y. (2017). Effect of temperature on photosynthesis characteristics in the passion fruits ‘Summer Queen’ and ‘Ruby Star’. Horticult. J. 86, 194–199. doi: 10.2503/hortj.OKD-023
Bykova, O., Chuine, I., Morin, X. (2019). Highlighting the importance of water availability in reproductive processes to understand climate change impacts on plant biodiversity. Perspect. Plant Ecol. 37, 20–25. doi: 10.1016/j.ppees.2019.01.003
Conley, M. M., Kimball, B. A., Brooks, T. J., Pinter, P. J., Jr., Hunsaker, D. J., Wall, G. W., et al. (2001). CO2 enrichment increases water-use efficiency in sorghum. New Phytol. 151, 407–412. doi: 10.1046/j.1469-8137.2001.00184.x
Domingues, T. F., Martinelli, L. A., Ehleringer, J. R. (2014). Seasonal patterns of leaf-level photosynthetic gas exchange in an eastern Amazonian rain forest. Plant Ecol. Divers. 7, 189–203. doi: 10.1080/17550874.2012.748849
dos Santos Junior, U. M., de Carvalho Gonçalves, J. F., Fearnside, P. M. (2012). Measuring the impact of flooding on Amazonian trees: photosynthetic response models for ten species flooded by hydroelectric dams. Trees 27, 193–210. doi: 10.1007/s00468-012-0788-2
Egea, G., Verhoef, A., Vidale, P. L. (2011). Towards an improved and more flexible representation of water stress in coupled photosynthesis–stomatal conductance models. Agr. For. Meteorol. 151, 1370–1384. doi: 10.1016/j.agrformet.2011.05.019
Farooq, M., Hussain, M., Ul-Allah, S., Siddique, K. H. M. (2019). Physiological and agronomic approaches for improving water-use efficiency in crop plants. Agric. Water Manage. 219, 95–108. doi: 10.1016/j.agwat.2019.04.010
Farquhar, G. D., Wong, S. C. (1984). An empirical model of stomatal conductance. Aust. J. Plant Physiol. 11, 191–210. doi: 10.1071/PP9840191
Feng, S., Hao, Z., Zhang, X., Wu, L., Zhang, Y., Hao, F. (2022). Climate change impacts on concurrences of hydrological droughts and high temperature extremes in a semi-arid river basin of China. J. Arid Environ. 202, 104768. doi: 10.1016/j.jaridenv.2022.104768
Feng, X., Liu, R., Li, C., Zhang, H., Slot, M. (2023). Contrasting responses of two C4 desert shrubs to drought but consistent decoupling of photosynthesis and stomatal conductance at high temperature. Environ. Exp. Bot. 209, 105295. doi: 10.1016/j.envexpbot.2023.105295
Fracasso, A., Magnanini, E., Marocco, A., Amaducci, S. (2017). Real-time determination of photosynthesis, transpiration, water-use efficiency and gene expression of two Sorghum bicolor (Moench) genotypes subjected to dry-down. Front. Plant Sci. 8. doi: 10.3389/fpls.2017.00932
Gago, J., Douthe, C., Florez-Sarasa, I., Escalona, J. M., Galmes, J., Fernie, A. R., et al. (2014). Opportunities for improving leaf water use efficiency under climate change conditions. Plant Sci. 226, 108–119. doi: 10.1016/j.plantsci.2014.04.007
Grillakis, M. G. (2019). Increase in severe and extreme soil moisture droughts for Europe under climate change. Sci. Total Environ. 660, 1245–1255. doi: 10.1016/j.scitotenv.2019.01.001
Gyimah, R., Nakao, T. (2007). Early growth and photosynthetic responses to light in seedlings of three tropical species differing in successional strategies. New Forest. 33, 217–236. doi: 10.1007/s11056-006-9028-1
Hatfield, J. L., Dold, C. (2019). Water-use efficiency: Advances and challenges in a changing climate. Front. Plant Sci. 10, 103. doi: 10.3389/fpls.2019.00103
Kimball, B. A. (2016). Crop responses to elevated CO2 and interactions with H2O, N, and temperature. Curr. Opin. Plant Biol. 31, 36–43. doi: 10.1016/j.pbi.2016.03.006
Kubien, D. S., Caemmerer, S. V., Furbank, R. T., Sage, R. F. (2003). C4 photosynthesis at low temperature. A study using transgenic plants with reduced amounts of Rubisco. Plant Physiol. 132, 1577–1585. doi: 10.1104/pp.103.021246
Leakey, A. D. B., Uribelarrea, M., Ainsworth, E. A., Naidu, S. L., Long, S. P. (2006). Photosynthesis, productivity, and yield of maize are not affected by open-air elevation of CO2 concentration in the absence of drought. Plant Physiol. 140, 779–790. doi: 10.1104/pp.105.073957
Liu, S., Liu, W., Shi, X., Li, S., Hu, T., Song, L., et al. (2018). Dry-hot stress significantly reduced the nitrogenase activity of epiphytic cyanolichen. Sci. Total Environ., 619–620, 630–637. doi: 10.1016/j.scitotenv.2017.11.179
Loreto, F., Tricoli, D., Marco, G. D. (1995). On the relationship between electron transport rate and photosynthesis in leaves of the C4 plant Sorghum bicolor exposed to water stress, temperature changes and carbon metabolism inhibition. Aust. J. Plant Physiol. 22, 885–892. doi: 10.1071/PP9950885
Martínez-García, E., Rubio, E., García-Morote, F. A., Andrés-Abellán, M., Miettinen, H., López-Serrano, F. R. (2017). Net ecosystem production in a Spanish black pine forest after a low burn-severity fire: Significance of different modelling approaches for estimating gross primary production. Agr. For. Meteorol. 246, 178–193. doi: 10.1016/j.agrformet.2017.06.017
McAusland, L., Vialet-Chabrand, S., Davey, P., Baker, N. R., Brendel, O., Lawson, T. (2016). Effects of kinetics of light-induced stomatal responses on photosynthesis and water-use efficiency. New Phytol. 211, 1209–1220. doi: 10.1111/nph.14000
Mott, K. A., Peak, D. (2010). Stomatal responses to humidity and temperature in darkness. Plant Cell Environ. 33, 1084–1090. doi: 10.1111/j.1365-3040.2010.02129.x
Mundia, C. W., Secchi, S., Akamani, K., Wang, G. (2019). A regional comparison of factors affecting global sorghum production: The case of north America, Asia and Africa’s Sahel. Sustainability 11, 2135. doi: 10.3390/su11072135
Prasad, V. B. R., Govindaraj, M., Djanaguiraman, M., Djalovic, I., Shailani, A., Rawat, N., et al. (2021). Drought and high temperature stress in sorghum: physiological, genetic, and molecular insights and breeding approaches. Int. J. Mol. Sci. 22, 9826. doi: 10.3390/ijms22189826
Prasad, P. V. V., Vu, J. C. V., Boote, K. J., Allen, L. H. (2009). Enhancement in leaf photosynthesis and upregulation of Rubisco in the C4 sorghum plant at elevated growth carbon dioxide and temperature occur at early stages of leaf ontogeny. Funct. Plant Biol. 36, 761–769. doi: 10.1071/FP09043
Sales, C. R. G., Wang, Y., Evers, J. B., Kromdijk, J. (2021). Improving C4 photosynthesis to increase productivity under optimal and suboptimal conditions. J. Exp. Bot. 72, 5942–5960. doi: 10.1093/jxb/erab327
Scafaro, A. P., Von Caemmerer, S., Evans, J. R., Atwell, B. J. (2011). Temperature response of mesophyll conductance in cultivated and wild Oryza species with contrasting mesophyll cell wall thickness. Plant Cell Environ. 34, 1999–2008. doi: 10.1111/j.1365-3040.2011.02398.x
Silva, R. G. D., Alves, R. C., Zingaretti, S. M. (2020). Increased [CO2] causes changes in physiological and genetic responses in C4 crops: A brief review. Plants 9, 1567. doi: 10.3390/plants9111567
Soltani, S., Mosavi, S. H., Saghaian, S. H., Azhdari, S., Alamdarlo, H. N., Khalilian, S. (2023). Climate change and energy use efficiency in arid and semiarid agricultural areas: A case study of Hamadan-Bahar plain in Iran. Energy 268, 126553. doi: 10.1016/j.energy.2022.126553
Thornley, J. H. M. (1976). Mathematical Models in Plant Physiology (London, UK: Academic Press), 86–110.
Thornley, J. H. M. (1998). Dynamic model of leaf photosynthesis with acclimation to light and nitrogen. Ann. Bot-London. 81, 421–430. doi: 10.1006/anbo.1997.0575
Urban, J., Ingwers, M. W., McGuire, M. A., Teskey, R. O. (2017). Increase in leaf temperature opens stomata and decouples net photosynthesis from stomatal conductance in Pinus taeda and Populus deltoides × nigra. J. Exp. Bot. 68, 1757–1767. doi: 10.1093/jxb/erx052
von Caemmerer, S. (2013). Steady-state models of photosynthesis. Plant Cell Environ. 36, 1617–1630. doi: 10.1111/pce.12098
von Caemmerer, S., Farquhar, G. D. (1981). Some relationships between the biochemistry of photosynthesis and the gas exchange of leaves. Planta 153, 376–387. doi: 10.1007/BF00384257
Wall, G. W., Brooks, T. J., Adam, N. R., Cousins, A. B., Kimball, B. A., Pinter, P. J., Jr., et al. (2001). Elevated atmospheric CO2 improved sorghum plant water status by ameliorating the adverse effects of drought. New Phytol. 152, 231–248. doi: 10.1046/j.0028-646X.2001.00260.x
Wassenaar, M. L. J., van Ieperen, W., Driever, S. M. (2022). Low red to far-red ratio increases resistance to CO2 diffusion and reduces photosynthetic efficiency in low light grown tomato plants. Environ. Exp. Bot. 200, 104918. doi: 10.1016/j.envexpbot.2022.104918
Wu, C., Chen, D., Xia, G., Sun, X., Zhang, S. (2023). Response characteristics of photosynthetic productivity of the canopy spatial distribution pattern of Larix kaempferi. Forests 14, 1171. doi: 10.3390/f14061171
Xu, Z., Yin, H., Xiong, P., Wan, C., Liu, Q. (2012). Short-term responses of Picea asperata seedlings of different ages grown in two contrasting forest ecosystems to experimental warming. Environ. Exp. Bot. 77, 1–11. doi: 10.1016/j.envexpbot.2011.10.011
Xue, W., Nay-Htoon, B., Lindner, S., Dubbert, M., Otieno, D., Ko, J., et al. (2016). Soil water availability and capacity of nitrogen accumulation influence variations of intrinsic water use efficiency in rice. J. Plant Physiol. 193, 26–36. doi: 10.1016/j.jplph.2016.02.003
Yan, Z., He, D., Niu, G., Zhai, H. (2019). Evaluation of growth and quality of hydroponic lettuce at harvest as affected by the light intensity, photoperiod and light quality at seedling stage. Sci. Hortic-Amsterdam 248, 138–144. doi: 10.1016/j.scienta.2019.01.002
Yang, X., Bi, Y., Ma, X., Dong, W., Wang, X., Wang, S. (2022). Transcriptomic analysis dissects the regulatory strategy of toxic cyanobacterium Microcystis aeruginosa under differential nitrogen forms. J. Hazard. Mater. 428, 128276. doi: 10.1016/j.jhazmat.2022.128276
Yang, X. L., Dong, W., Liu, L. H., Bi, Y. H., Xu, W. Y., Wang, X. (2023). Uncovering the differential growth of Microcystis aeruginosa cultivated under nitrate and ammonium from a photophysiological perspective. ACS ES&T Water 3, 1161–1171. doi: 10.1021/acsestwater.2c00624
Yang, X. L., Liu, L. H., Yin, Z. K., Wang, X. Y., Wang, S. B., Ye, Z. P. (2020). Quantifying photosynthetic performance of phytoplankton based on photosynthesis–irradiance response models. Environ. Sci. Eur. 32, 24. doi: 10.1186/s12302-020-00306-9
Ye, Z. P., Duan, S. H., Chen, X. M., Duan, H. L., Gao, C. P., Kang, H. J., et al. (2021). Quantifying light response of photosynthesis: Addressing the long-standing limitations of non-rectangular hyperbolic model. Photosynthetica 59, 185–191. doi: 10.32615/ps.2021.009
Ye, Z. P., Ling, Y., Yu, Q., Duan, H. L., Kang, H. J., Huang, G. M., et al. (2020). Quantifying light response of leaf-scale water-use efficiency and its interrelationships with photosynthesis and stomatal conductance in C3 and C4 species. Front. Plant Sci. 11. doi: 10.3389/fpls.2020.00374
Ye, Z. P., Suggett, J. D., Robakowski, P., Kang, H. J. (2013). A mechanistic model for the photosynthesis-light response based on the photosynthetic electron transport of photosystem II in C3 and C4 species. New Phytol. 199, 110–120. doi: 10.1111/nph.12242
Ye, Z. P., Yu, Q. (2008). A coupled model of stomatal conductance and photosynthesis for winter wheat. Photosynthetica 46, 637–640. doi: 10.1007/s11099-008-0110-0
Yin, X., Busch, F. A., Struik, P. C., Sharkey, T. D. (2021). Evolution of a biochemical model of steady-state photosynthesis. Plant Cell Environ. 44, 1–27. doi: 10.1111/pce.14070
Keywords: sweet sorghum, leaf gas exchange, photosynthetic light response, intrinsic water use efficiency, instantaneous water use efficiency, model, temperature, CO2 concentration
Citation: Yang X-L, Ma X-F, Ye Z-P, Yang L-S, Shi J-B, Wang X, Zhou B-B, Wang F-B and Deng Z-F (2024) Simulating short-term light responses of photosynthesis and water use efficiency in sweet sorghum under varying temperature and CO2 conditions. Front. Plant Sci. 15:1291630. doi: 10.3389/fpls.2024.1291630
Received: 09 September 2023; Accepted: 23 February 2024;
Published: 28 March 2024.
Edited by:
Michael Moustakas, Aristotle University of Thessaloniki, GreeceReviewed by:
Emerson Alves da Silva, Instituto de Pesquisas Ambientais, BrazilYansheng Li, Chinese Academy of Sciences (CAS), China
Copyright © 2024 Yang, Ma, Ye, Yang, Shi, Wang, Zhou, Wang and Deng. This is an open-access article distributed under the terms of the Creative Commons Attribution License (CC BY). The use, distribution or reproduction in other forums is permitted, provided the original author(s) and the copyright owner(s) are credited and that the original publication in this journal is cited, in accordance with accepted academic practice. No use, distribution or reproduction is permitted which does not comply with these terms.
*Correspondence: Zi-Piao Ye, yezp@jgsu.edu.cn; Zi-Fa Deng, dzf@ntu.edu.cn