 Anastasia Apodiakou
 Saleh Alseekh
 Rainer Hoefgen
 Sarah J. Whitcomb
- 1Department of Molecular Physiology, Max-Planck-Institute of Molecular Plant Physiology, Potsdam, Germany
- 2Cereal Crops Research Unit, United States Department of Agriculture - Agricultural Research Service, Madison, WI, United States
The transcription factor Sulfur Limitation 1 (SLIM1) belongs to the plant-specific Ethylene Insenstive3-Like transcription factor family and is known to coordinate gene expression in response to sulfur deficiency. However, the roles of SLIM1 in nutrient-sufficient conditions have not been characterized. Employing constitutive SLIM1 overexpression (35S::SLIM1) and CRISPR/Cas9 mutant plants (slim1-cr), we identified several distinct phenotypes in nutrient-sufficient conditions in Arabidopsis thaliana. Overexpression of SLIM1 results in plants with approximately twofold greater rosette area throughout vegetative development. 35S::SLIM1 plants also bolt earlier and exhibit earlier downregulation of photosynthesis-associated genes and earlier upregulation of senescence-associated genes than Col-0 and slim1-cr plants. This suggests that overexpression of SLIM1 accelerates development in A. thaliana. Genome-wide differential gene expression analysis relative to Col-0 at three time points with slim1-cr and two 35S::SLIM1 lines allowed us to identify 1,731 genes regulated directly or indirectly by SLIM1 in vivo.
1 Introduction
Plant growth is a complex process that is affected not only by genetics but also by biotic or abiotic stresses such as light, water, temperature, and nutrient availability that have an impact on hormones, cell elongation and cell division, senescence, and nutrient remobilization (Chen et al., 2017). Plant breeders seek to develop crops with increased leaf area (e.g., cassava and wheat), higher biomass (e.g., forage crops), higher yield (food crops), and early maturity (Li et al., 2017). Increasing leaf area is an important consideration in plant breeding, due to its significant impact on plant productivity. Plants with increased leaf area show improved weed suppression due to shading (Huber et al., 2021), demonstrate higher photosynthetic efficiency and CO2 assimilation (Faralli and Lawson, 2020), and enhanced yield (Weraduwage et al., 2015). Early maturity is a very important trait because it can help farmers avoid biotic or abiotic stress periods that tend to intensify later in the growing season, it can allow additional crop rotations per year (Mallikarjuna et al., 2019), and it can expand the productive growing region for certain crops into higher latitudes and areas with shorter growing seasons (Izawa, 2007; Wang et al., 2018).
Significant interest has surrounded transcription factors (TF) related to plant growth. For example, higher levels of the rice TF IDEAL PLANT ARCHITECTURE 1 (IPA1) decrease unproductive tillers, increase grain yield, and improve plant immunity (Wang et al., 2018). In Arabidopsis, the TFs WRKY46, WRKY54, and WRKY70 are involved in brassinosteroid-regulated growth and drought response in Arabidopsis (Chen et al., 2017). The TF bZIP30 affects the expression of genes involved in cell wall biosynthesis, cell elongation, and meristem activity in Arabidopsis (Lozano-Sotomayor et al., 2016). These examples illustrate that various TF families have been shown to affect plant growth and development through the regulation of distinct groups of genes.
During plant development, one important process for seed production is senescence. During leaf senescence, cells undergo numerous changes in cellular metabolism, such as transitioning from being a nutrient sink into being a nutrient source (Ay et al., 2009; Thomas, 2013; Heyneke et al., 2019). At this developmental stage, reproductive tissues are developing rapidly and have high nutrient needs (Fan et al., 2009), which are primarily met by remobilization of nutrients like nitrogen (N) from source organs such as leaves (Diaz et al., 2008; Thomas, 2013). Among the earliest and strongest changes in leaves during developmental senescence are chloroplast breakdown (Masclaux, 2000; Tamary et al., 2019) and decreased expression of genes involved in photosynthesis (Guo et al., 2004; Gregersen et al., 2013; Thomas, 2013). These genes are called photosynthesis-associated genes (PAGs), and their expression is negatively correlated with expression of senescence-associated genes (SAGs) (Buchanan-Wollaston et al., 2005; Lichtenthaler, 2012). SAGs are upregulated in senescing leaves (Ay et al., 2009). They are involved in processes such as degradation of chlorophyll, proteins, amino acids, nucleic acids, and autophagy (Guo et al., 2004; Lichtenthaler, 2012; Wu et al., 2012; Avila-Ospina et al., 2014). Some SAGs are ATP-Binding Cassette (ABC) transporters that facilitate nutrient transport (Wu et al., 2012). Anthocyanins tend to accumulate during leaf senescence, playing an important role in photo-protection, increasing the plant’s ability to remobilize nutrients, and protection from oxidative stress during leaf senescence (Hoch et al., 2001; Diaz et al., 2006; Liu et al., 2018).
The ETHYLENE-INSENSITIVE (EIN) family of TFs has been associated with senescence and specifically with chlorophyll degradation. ETHYLENE-INSENSITIVE2 (EIN2) controls leaf senescence through the regulation of ETHYLENE-INSENSITIVE3 (EIN3), which is induced during leaf senescence (Kim et al., 2014). Via yeast 1 hybrid and chromatin immunoprecipitation-qPCR, it was shown that EIN3 binds to the promoters of two key regulators of leaf senescence, the TFs NAC DOMAIN CONTAINING PROTEIN 6 (NAC6) and ACTIVATED BY AP3/PI (NAP), and activates their transcription. EIN3 also negatively regulates miR164, a negative regulator of NAC6. These data suggest that EIN3 positively regulates leaf senescence by activating NAC6 and NAP (Kim et al., 2014). The ein3eil1 (ETHYLENE-INSENSITIVE3-LIKE 1/EIL1) double mutant exhibits delayed senescence (Li et al., 2013). This raises the question whether other members of the ETHYLENE-INSENSITIVE family could be involved in senescence.
Sulfur Limitation 1 (SLIM1), an ETHYLENE INSENSITIVE 3-LIKE (EIL) family TF, is well established as a key regulatory factor involved in transcriptional responses to sulfur deficiency (−S) (Maruyama-Nakashita et al., 2006; Wawrzyńska and Sirko, 2014; Dietzen et al., 2020; Piotrowska et al., 2022; Rakpenthai et al., 2022; Apodiakou and Hoefgen, 2023). Although critical for −S responses, transcript levels of SLIM1 are not strongly altered under –S (Maruyama-Nakashita et al., 2006; Dietzen et al., 2020; Rakpenthai et al., 2022). It has been proposed that the function of SLIM1 may be regulated by condition-dependent protein–protein interactions (PPIs) and/or post-translational modifications (Wawrzyńska and Sirko, 2014). The role of SLIM1 in sulfur-sufficient conditions is unclear. Here, we generated 35S::SLIM1 overexpression lines and show that increased expression of AtSLIM1 results in earlier bolting, earlier senescence, and increased rosette area relative to Col-0 and slim1-cr.
2 Materials and methods
2.1 Plant material
slim1-cr seeds were obtained from Agnieska Sirko and Anna Wawrzynska at the Institute of Biochemistry and Biophysics, Polish Academy of Sciences. Wawrzynska and colleagues used CRISPR/Cas9 to delete 1,123 bp from the AT1G73730 locus, including the previously characterized DNA binding domains of SLIM1 (Wawrzyńska and Sirko, 2016; Wawrzyńska et al., 2022) To create the 35S::SLIM1 construct, the Gateway cloning system was used (Karimi et al., 2002). The SLIM1 coding sequence was initially cloned into the pDONOR221 vector using BP clonase (Invitrogen), and then the coding sequence of SLIM1 was integrated into the pH7WG2 vector using LR clonase. The final vectors, from different colonies, were sequenced using prom35S F primer and SLIM1 R (Methods S1), and finally, the resulting positive binary plasmid was introduced into Agrobacterium tumefaciens (GV3101), and Arabidopsis thaliana Col-0 was transformed via the floral dipping method (Clough and Bent, 1998). Transgenic seeds (T1) were selected on Murashige and Skoog (MS) media containing 30 mg/L hygromycin and transferred to soil. Via TaqMan assay (Ingham et al., 2001) with an oligonucleotide hygromycin probe, the number of inserts was identified, and only seedlings with a single insert were kept for further experimental purposes. GIGANTEA (GI) (AT1G22770) was used as a single copy gene reference (Duarte et al., 2010). For the generation of empty vector (EV) transformed Col-0, the empty gateway PH7WG2 vector was used, following the steps mentioned above. In the experiments described in this research, 35S::SLIM1 plants were from the T2 generation carrying the 35S::SLIM1 construct. The oligonucleotide primer sequences and probes that were used for the 35S::SLIM1 construct design and verification and the conditions used for the SLIM1 q-PCR are provided in Supplementary Methods S1.
2.2 Plant cultivation
A. thaliana seeds were sterilized using chlorine gas prepared by combining 100 mL of NaClO and 5 mL of HCl. The seeds were then sown on MS sterile agar medium supplemented with 1% sucrose (w/v) and were stratified at 4°C for 48 h before the plates were placed in controlled-environment chambers (CLF Plant Climatic). For the growth of 35S::SLIM1, the MS agar plates were supplemented with 30 mg/L hygromycin, since the experiment was performed with T2 generation plants. The seeds germinated under a 16-h photoperiod with 100 µmol photons m–2 s−1 irradiance. The temperature inside the chambers was maintained at 21°C during the day and 19°C at night. Ten days after transfer into growth chambers [12 days after sowing (DAS)], the seedlings were transplanted into soil-filled round pots with a diameter of 6 cm. These pots were placed in a phytotron with controlled conditions: a photoperiod of 16 h with an irradiance of 120 µmol photons m–2 s−1, a temperature of 20°C during the day and 16°C at night, and a humidity level of 60%–75%. To minimize the potential effects of uneven lighting, the positions of the pots were regularly rearranged within the phytotron. For the molecular and metabolic experiments, T2 homozygous plants were used. TaqMan assays (Ingham et al., 2001) with oligonucleotide probes for the hygromycin gene and GI as a single copy gene were performed before 30 DAS, in order to identify homozygous plants. The stalk and the reproductive tissue were excluded from the tissue sampled, which was the rosette. The time between the stalk elimination and the rosette harvesting was approximately 4 min. The rosette samples were collected and immediately frozen in liquid nitrogen. For all time points, only rosette tissue was harvested. The samples were homogenized while frozen using a Retschmill MM400.
2.3 Determination of rosette area
T2 heterozygous and homozygous plants were subjected into determination of their leaf area. Photographs were taken from above once a week using a professional camera. The distance between the pots and the camera was kept consistent. Total rosette area was determined from the photos using the image analytic software, ImageJ (National Institute of Health, USA). At 44 DAS, when the stalk had visibly emerged, the stalks were carefully cut to eliminate any interference with the rosette leaf area photos.
2.4 Leaf microscopy
2.4.1 Leaf cross-sections
Transverse strips were cut out from the middle of medium-sized leaves and then cut into smaller pieces (3–4 mm in length). The small leaf pieces were subjected to 1-h vacuum in solution A [45% ethanol, 5% glacial acetic acid, and 5% formaldehyde (37%)]. Next, samples were dehydrated by incubation in 50% ethanol for 15 min, 70% ethanol for 30 min, 80% ethanol for 1 h, and finally 90% ethanol for 1 h. Samples were left overnight at 4°C in a solution of 0.1% Eosin Y in 90% ethanol. The last dehydration step was four washes with 100% ethanol, 1 h each. Next, the samples were kept for 2 h at room temperature in solution B (equal parts 100% ethanol and Technovit 7100), then mixed well in solution B supplemented with Hardener II (15:1) for 1 min in separate tubes, and then kept at room temperature overnight to polymerize. Five-micrometer sections were prepared using Leica Rotary Microtome RM2265, placed on glass slides, and dried for 2 h at 42°C. The sections were stained with 0.05% of Toluidine blue in water and dried on a heating plate at 42°C for 10 min. The final stained sections were studied by epi-fluorescence with an Olympus BX51 microscope.
2.4.2 Epithelial cells
Leaf samples for performing the epithelial cell imaging were cut out from the middle of medium-sized Arabidopsis rosette leaves of 30 and 37 DAS. The samples were treated for 1 h with 12.5% acetic acid in ethanol, then washed with 100% ethanol for 1 min, and then washed with 50% ethanol for 1 min. Multiple ddH2O washing steps were performed to remove ethanol from the tissue. The washed leaf tissue samples were imbibed in KOH 1 M solution where they were kept until the next day for imaging. The leaf tissue samples were studied by epi-fluorescence with an Olympus BX51 microscope. The epidermis was analyzed at 20× magnification.
2.5 RNA-seq
RNA-seq was performed by BGI genomics (https://www.bgi.com/global). Total RNA was extracted from approximately 100 mg of rosette tissue using the SIGMA Spectrum Plant total RNA KIT (1003037777) according to the manufacturer’s instructions with on-column DNase treatment. Following the sample preparation instructions from BGI, RNA concentration, quality, and purity were determined using a Bioanalyzer Agilent 2100. All the samples had a RIN value between 6.50 and 8.50. BGI prepared the libraries and performed the sequencing. The ribosomal RNA pool was depleted by polyA enrichment. Finally, the strand-specific libraries were sequenced with DNBseq platform (paired-end 150-bp reads with a coverage of 40 M reads per library). Clean reads were generated from raw reads by removing adaptor sequences, contamination, and low-quality reads. Specifically, SOAPnuke software was used with the following parameters: -n 0.01 -l 20 -q 0.4 –adaMR 0.25 –ada_trim –polyX 50 – minReadLen 150 (Chen et al., 2018). The quality of clean reads was confirmed using FastQC v0.12.1 prior to downstream analysis. The clean reads were aligned to the Arabidopsis genome (NCBI assembly TAIR10) using CLC genomics v23.0.4 (Keohavong and Grant, 2004) with default settings. The genome annotations are based on Araport11. Read counts per gene were normalized to account for differences in sequencing depth and RNA composition among samples using the median of ratios method in the DESeq2 v1.40.2 R package (Love et al., 2014). Differential expression analysis was performed with DESeq2 using Wald tests with Empirical Bayes-based adaptive shrinkage of exaggerated log2FoldChanges using the ashr v2.2-54 R package (Stephens et al., 2022) and p-value adjustment using the IHW v1.28.0 R package (Ignatiadis et al., 2016; Ignatiadis and Huber, 2021), which implements independent hypothesis weighting. To annotate genes with Gene Ontology terms and KEGG pathways, BiomaRt v2.56.1 (Durinck et al., 2005, 2009) and KEGGREST v1.40.0 R (Tenenbaum and Maintainer, 2023) packages were used to access (June 2023) the EnsemblPlants (https://plants.ensembl.org) and Kyoto Encyclopedia of Genes and Genomes (https://www.kegg.jp) databases, respectively. Over-representation analysis was performed with the clusterProfiler v4.0 (T. Wu et al., 2021) R package. Data visualizations were prepared with ggplot2 v3.4.2 (Wickham, 2016), UpSetR v1.4.0 (Conway et al., 2017; Gehlenborg, 2019), ComplexHeatmap v2.16.0 (Gu et al., 2016), and circlize v0.4.15 (Gu et al., 2014) R packages.
2.6 In silico analysis of cis-regulatory elements and motifs
Patmatch (https://www.arabidopsis.org/cgi-bin/patmatch/nph-patmatch.pl) (Yan et al., 2005) was used to determine the presence of cis-regulatory elements and motifs of interest in the promoters of putative SLIM1-target genes, such as the genes bound by SLIM1 in DAP-seq, the class 1 SLIM1-regulated gene set, and the 12 genes that were both bound by SLIM1 in DAP-seq and met the class 1 criteria in our dataset (Supplementary Table S4). We used default settings with the exception of the search window, which was −1,000 bp upstream of the transcription start site.
2.7 Chlorophyll and anthocyanin quantification
Homogenized tissue (20 mg) was dissolved in 300 μL of ice-cold 95% (v/v) ethanol, briefly vortexed, and kept on ice until all the samples were processed. To remove debris, the samples were centrifuged at 14,000 × g for 5 min. The supernatant was carefully transferred to a new tube, which was then placed on ice and covered with foil to prevent chlorophyll degradation. For absorbance determination, 100 μL of the supernatant was brought to 200 μL with 95% (v/v) ethanol and put in a flat-bottom 96-well plate. Absorbance measurements were taken at wavelengths of 664.1 nm, 648.6 nm, 470 nm, and 750 nm (blank). Chl a and Chl b concentrations were calculated using the following formulas (Lichtenthaler and Buschmann, 2001), and calculated concentrations were normalized to the fresh weight (FW) of the extracted sample.
Chl a (μg/mL) = 13.36×A664.1 – 5.19×A648.6
Chl b (μg/mL) = 27.43×A648.6 – 8.12×A664.1
For anthocyanin content measurements, 90 μL of the chlorophyll-containing supernatant was mixed with 10 μL of 1 M HCl, and the absorbance was measured at 520 nm and 750 nm (blank) (Lee et al., 2008). Absolute absorbance was normalized to the FW of the extracted sample.
2.8 Metabolite and ion determination
Metabolites were extracted as previously described by Lisec et al. (2006) with few modifications (Guo, 2018). Briefly, 25 mg of homogenized tissue was mixed with ice-cold CHCl3/CH3OH (3:7, v/v) buffer supplemented with Isovitexin and 13C6-sorbitol for internal standards. The samples were placed at −20°C for 2 h and vortexed briefly every 30 min. Ice-cold water was added, and samples were vortexed until the two phases were dispersed. Samples were centrifuged at 14,000 × g for 10 min at 4°C. The upper, polar phase was transferred to a new tube and desired volumes were further aliquoted for LC-MS (200 μL) and ion chromatography. The non-polar phase was also transferred to a new tube. The polar phase aliquots, non-polar phase, and insoluble material were evaporated using a centrifugal vacuum dryer at 30°C for 5 h. LC-MS was performed essentially as previously described (Perez de Souza et al., 2019, 2021). For ion content determination, the evaporated polar phase was dissolved in high-purity H2O and analyzed by Dionex ICS-3000 system using a KOH gradient (6–55 mM, 0.25 mL/min flow rate) for anion analysis with 17 min duration of the gradient. For cation analysis, methanesulfonic acid gradient (60–100 mM, 0.3 mL/min flow rate) was used with 20 min duration of gradient. The final ion concentration in the samples was calculated based on the known concentration of the following standards: CaCl2, NaCl, KH2PO4, (NH4)2SO4, MgCl2, MgSO4, and KNO3. The standards had a concentration range between 2 and 200 μM.
2.9 Thiol extraction and derivatization
Extraction was performed as previously described (Watanabe et al., 2008; Guo, 2018). Briefly, 25 mg of homogenized tissue was mixed with 0.1 M HCl, and samples underwent a second round of homogenization using a Retschmill to achieve optimal cell lysis. For the reduction step with 1.58 M N-ethylmorpholine, the extract was supplemented with 25 μM N-acetyl-Cys, as the internal standard. The reaction was allowed to react with 25 mM phosphine for 20 min at 37°C. For the labeling step, the reduced sample was allowed to react with 30 mM monobromobimane (mBrB) for 20 min at 37°C in the dark. The labeling reaction was terminated by the addition of acetic acid, and the resulting solution was then subjected to HPLC analysis. HPLC was performed as previously described (Watanabe et al., 2008).
3 Results
3.1 Plants overexpressing SLIM1 transcription factor have larger rosettes during the vegetative growth phase
T2 35S::SLIM1 seeds from seven independent lines were germinated on agar medium, and hygromycin-resistant seedlings were transferred to soil. SLIM1 expression at 30, 37, and 44 DAS was assessed by qPCR (Methods S1). AtSLIM1 transcript levels were significantly higher in the 35S::SLIM1 lines than in Col-0, EV (empty vector control), and slim1-cr (Figure 1A). In the slim1-cr line, the slim1 locus has a 1,123-bp deletion including the regions coding for the DNA binding domains, but the 3’-portion of the locus remains intact. However, transcripts from the remaining portion of the locus in slim1-cr were found to be reduced to approximately 20% of the level in Col-0, indicating that slim1-cr is likely a loss of function line (Wawrzyńska et al., 2022).
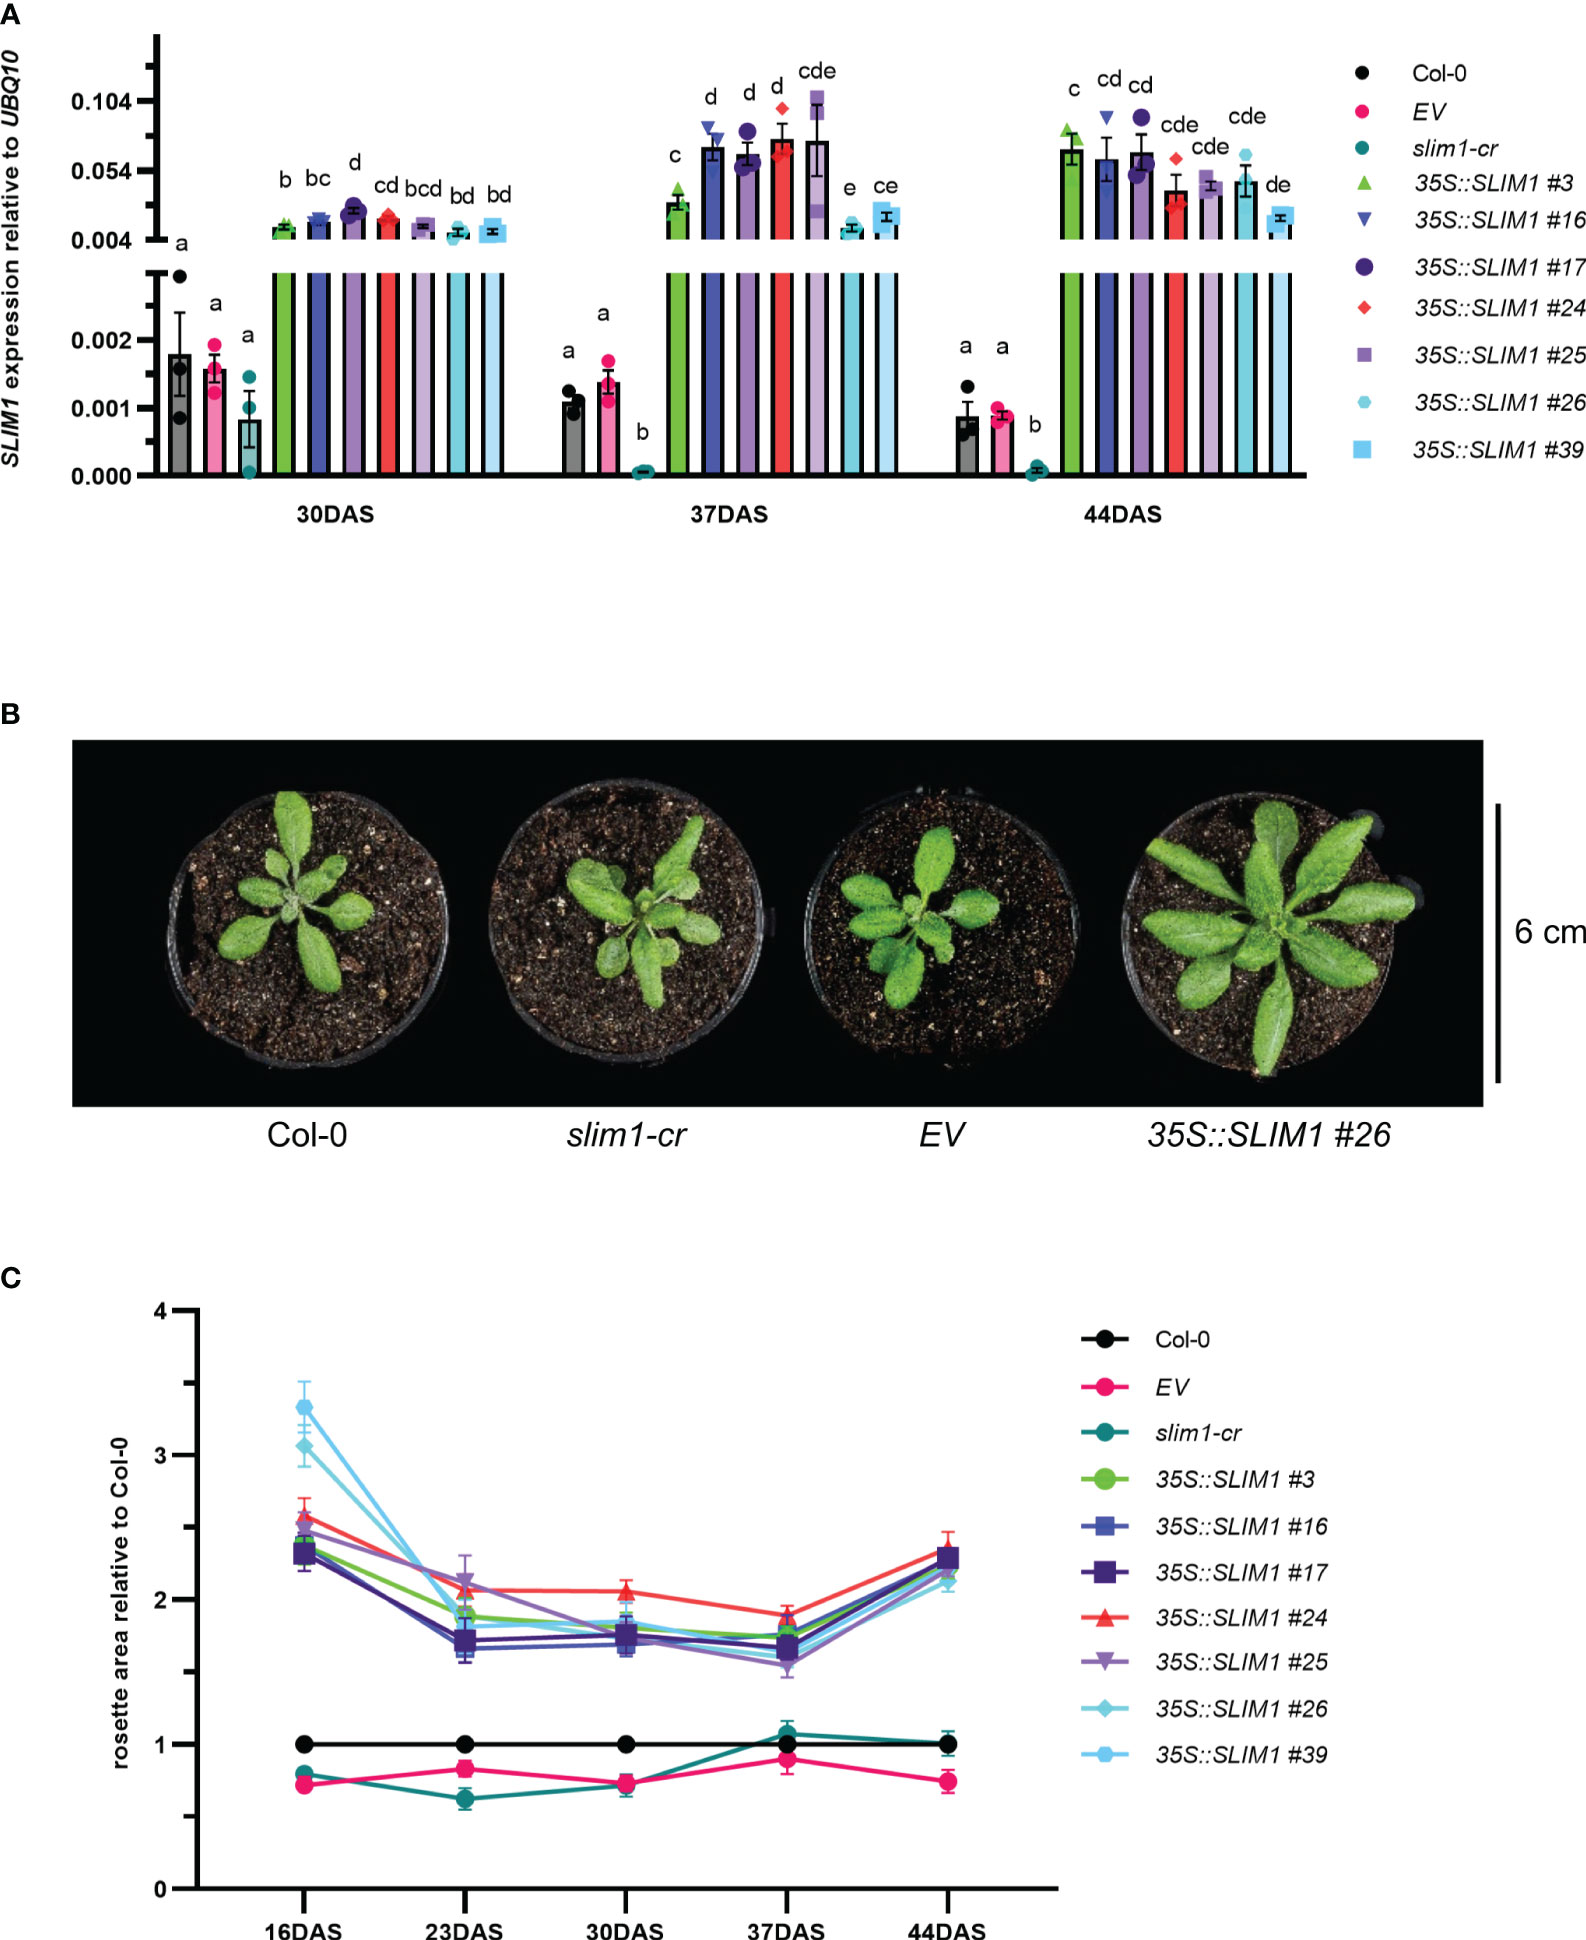
Figure 1 Effect of SLIM1 overexpression on growth. (A) SLIM1 transcript level relative to UBQ10 determined by qPCR. Bar height corresponds to mean of three biological replicates, and error bars represent the standard error of the mean (SEM). Statistical significance was assessed using t-tests within each time point; p-values were adjusted by the Benjamini–Yekutieli method. Compact letter display (CLD) identifies lines that are statistically different (adjusted p ≤ 0.05) from each other at each time point. (B) Photo of representative rosettes at 30 DAS. (C) Rosette area relative to Col-0 at each time point. Points represent the mean of 10–20 biological replicates, and error bars show the SEM. See Supplementary Table S1 for t-test results.
It was readily apparent by visual inspection that 35S::SLIM1 plants have larger rosettes (Figure 1B, Supplementary Figure S1), and quantification of rosette area in the seven independent 35S::SLIM1 lines showed consistently 1.5- to 3-fold larger rosettes than in controls throughout the vegetative growth phase (Figure 1C). Furthermore, from 16 DAS to 37 DAS, rosette biomass was consistently two- to sixfold greater in the seven 35S::SLIM1 lines (Supplementary Figure S2A). Mesophyll cells account for most of the cellular biomass in Arabidopsis leaves, so we investigated whether the number or size of mesophyll cells differed among the genotypes. Histological cross-sections from Arabidopsis mature leaves at 35 DAS were treated with Toluidine blue to stain cell walls and were visualized by epi-fluorescence (Supplementary Figure S2B). The number of mesophyll cells per unit area was not altered in 35S::SLIM1 or slim1-cr relative to Col-0 (Supplementary Figure S2C). Given the larger rosette phenotype in 35S::SLIM1, the distribution of epithelial cell sizes in each genotype at 30 and 37 DAS was determined (Supplementary Figures S2D, E). The size of epithelial cells was not significantly different in 35S::SLIM1 or slim1-cr relative to Col-0 and EV at either time point (Supplementary Figure S2E).
3.2 Plants overexpressing SLIM1 accumulate anthocyanins and the flavonoid pathway is induced
When extending the growth phase to 51 DAS, plants overexpressing SLIM1 display a purple/pink pigmented phenotype (Figure 2A). Anthocyanins are known to contribute to purple/pink tissue appearance, and so anthocyanin content was measured in the rosettes. Total anthocyanin content increased significantly in 35S::SLIM1 plants between 44 DAS and 51 DAS (Figure 2B), which is consistent with the timing of the purple pigmented phenotype in the leaves of 35S::SLIM1 at 51 DAS (Figure 2A). Since anthocyanins are one subgroup of flavonoids (Tohge et al., 2017; Liu et al., 2018), we determined flavonoid contents. Similar to the anthocyanin profile, at late time points, plants overexpressing SLIM1 displayed an accumulation of various flavonoids, such as quercetins and kaempferols, compared to Col-0 and slim1-cr (Figure 2C). The differential accumulation of flavonoids is evident at 44 DAS, and the relative accumulation was even greater at 51 DAS.
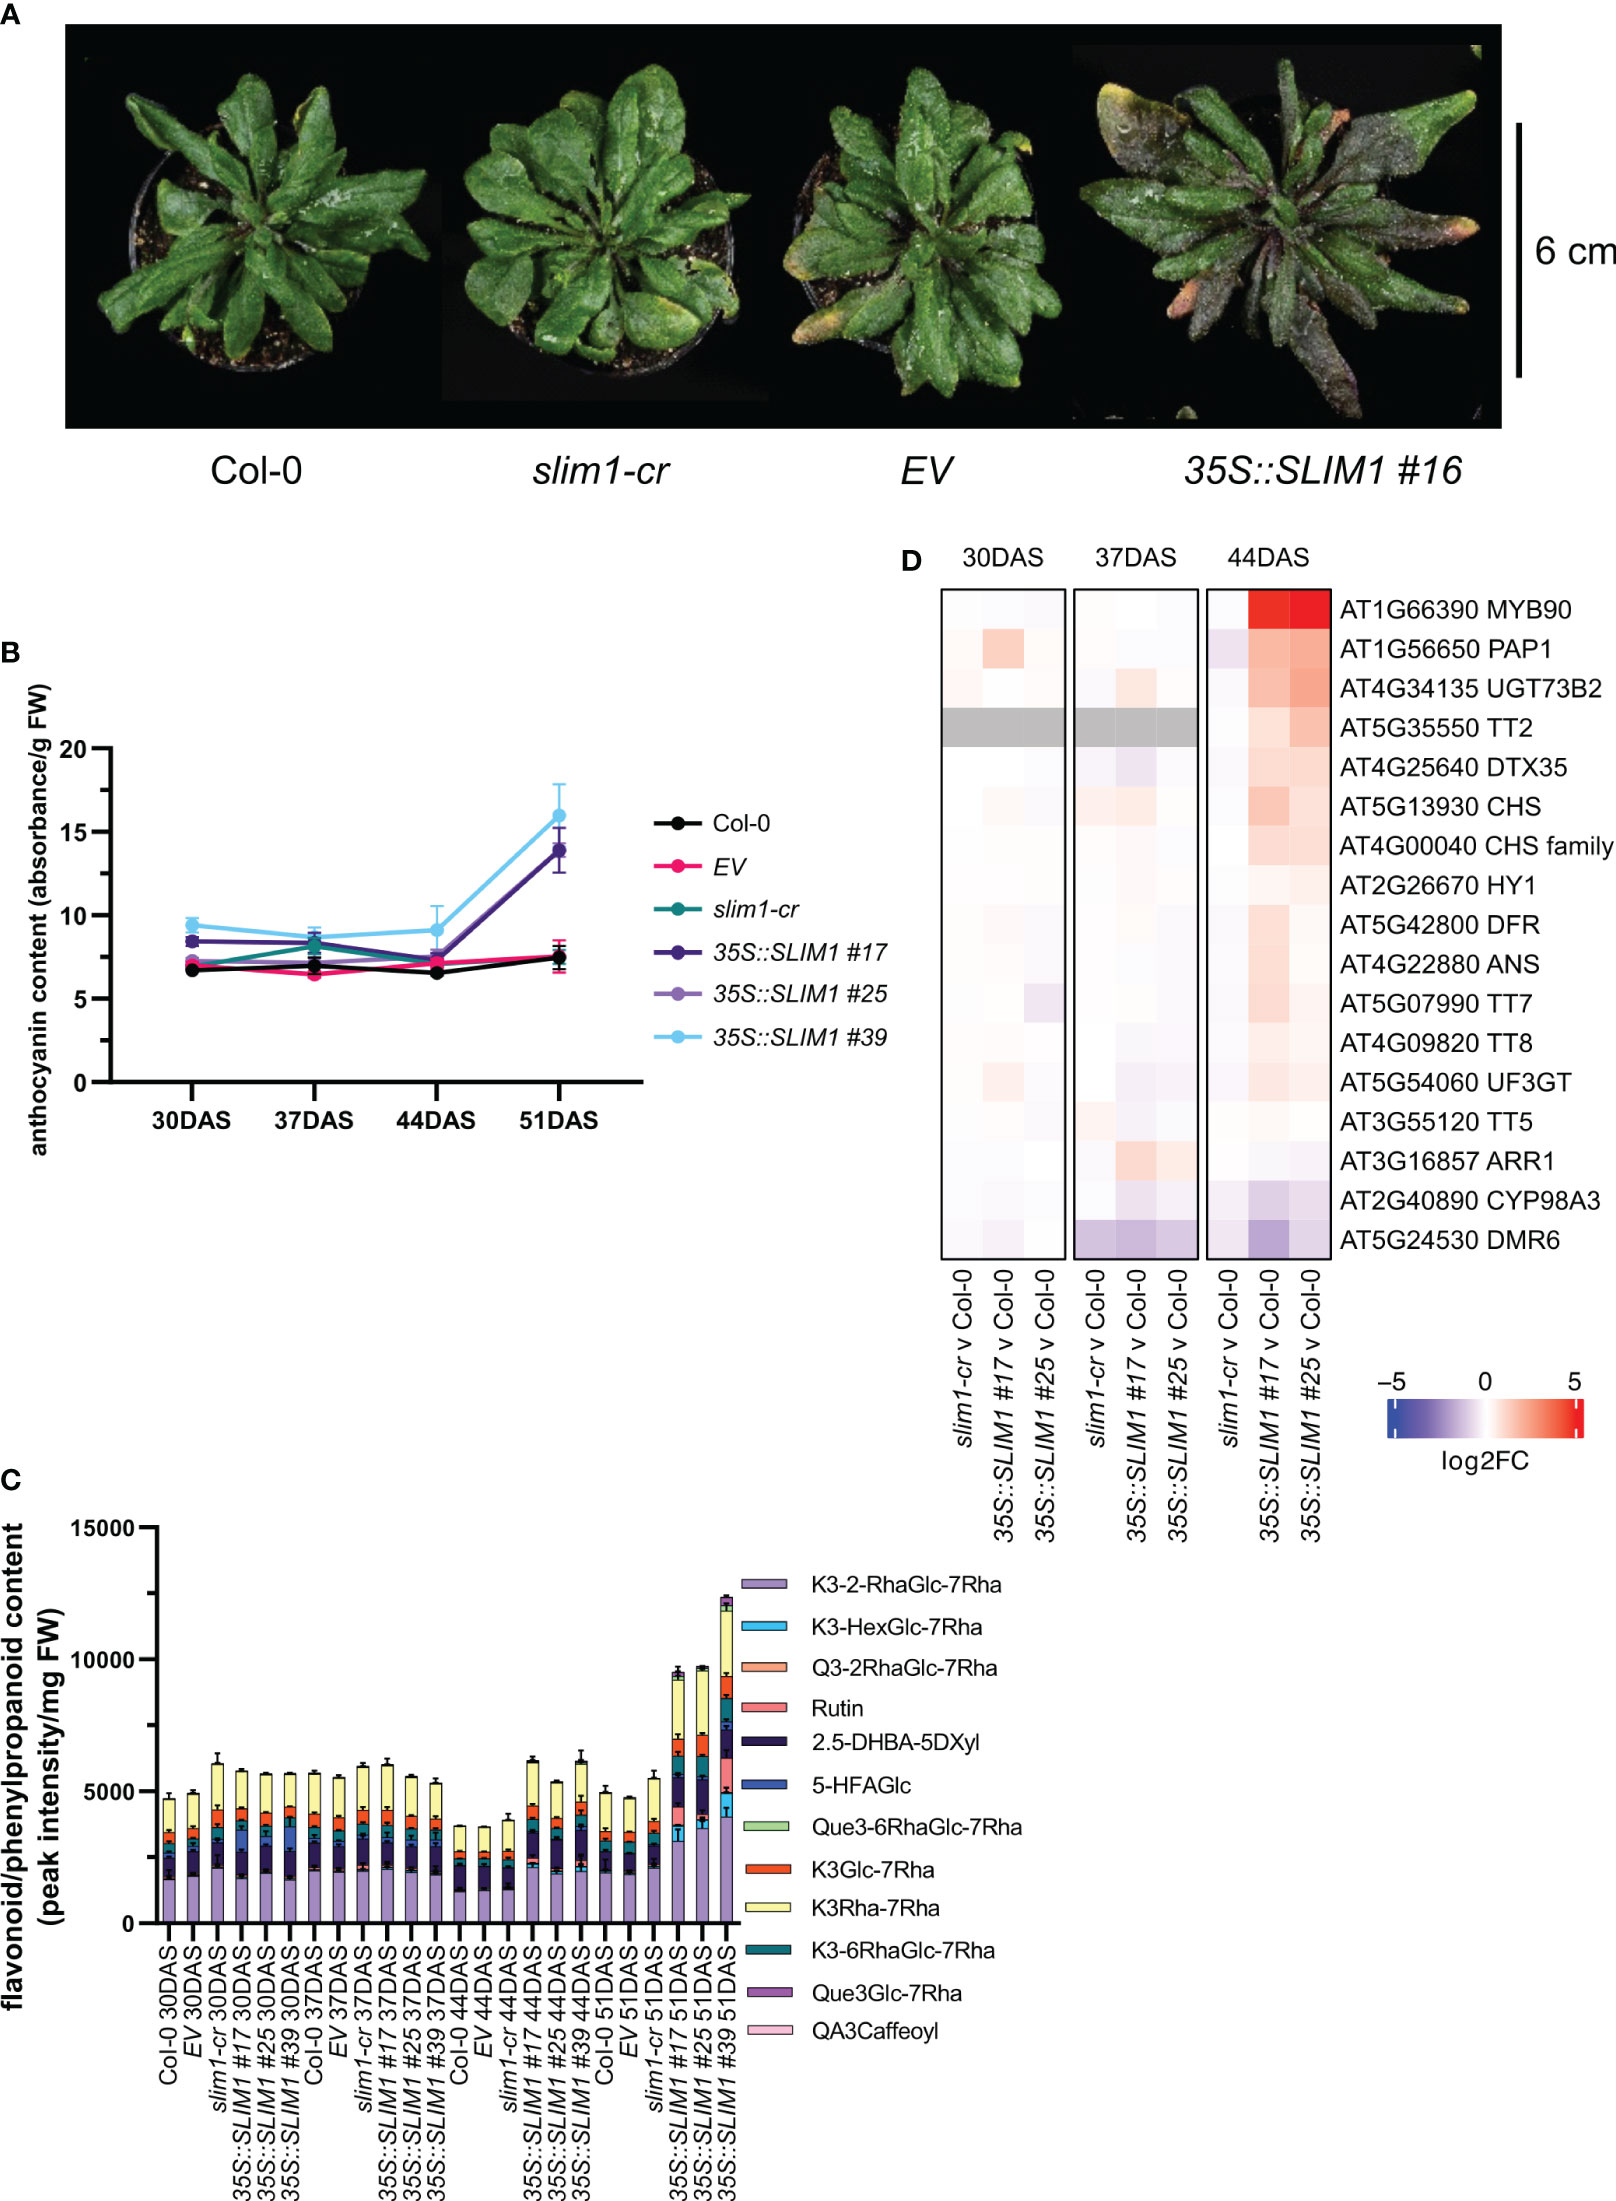
Figure 2 Late effect of SLIM1 overexpression on anthocyanin content. (A) Photo of representative rosettes at 51 DAS. (B) Anthocyanin content normalized to fresh weight (FW). Points represent the mean of three biological replicates, and error bars show the SEM. See Supplementary Table S1 for t-test results. (C) Sample FW normalized content of flavonoid and phenylpropanoid compounds identified by LC-MS. The simplified codes for flavonoids correspond to the following compounds: kaempferol-3-O-(2”-O-rhamnosyl)glucoside-7-O-rhamnoside: K3-2-RhaGlc-7Rha; kaempferol-3-O-(-O-hexosyl)glucoside-7-O-rhamnoside: K3-HexGlc-7Rha; keampferol-3-O-rhamnoside-7-O-rhamnoside: K3Rha-7Rha; quercetin-3-O-(2”-O-rhamnosyl)glucoside-7-O-rhamnoside: Q3-2RhaGlc-7Rha; Rutin: Rutin; 2,5-dihydroxybenzoic acid 5-O-D-xyloside: 2.5-DHBA-5DXyl; 5-hydroxyferulic acid glucoside: 5-HFAGlc; kaempferol-3-O-6-O-(rhamnosyl)glucoside-7-O-rhamnoside: K3-6RhaGlc-7Rha; kaempferol-3-O-glucoside-7-O-rhamnoside: K3Glc-7Rha; quercetin-3-O-6-O-(rhamnosyl)glucoside-7-O-rhamnoside: Que3-6RhaGlc-7Rha; quercetin-3-O-glucoside-7-O-rhamnoside: Que3Glc-7Rha; quinic acid, 3-caffeoyl: QA3Caffeoyl. Bar height of each compound corresponds to the mean of three biological replicates, and error bars show the SEM. See Supplementary Table S1 for t-test results. (D) Heatmap representation of gene expression differences determined by RNA-seq. Genes shown include MYB75 and MYB90 and those genes annotated to gene ontology terms related to anthocyanin and flavonoid pathways (GO:0009813 and GO:0031537) that are expressed in rosette tissue based on published literature and information in TAIR database. Color corresponds to log2 of the fold change (log2FC) relative to Col-0 at each time point determined from three biological replicates. Wald test results for genes shown can be found in Supplementary Table S1.
To investigate the gene expression changes that may underlie the differential accumulation of flavonoids including anthocyanins late in development, we performed transcriptome profiling by RNA-seq on two independent 35S::SLIM1 lines, slim1-cr, EV and Col-0. In these data, we analyzed the expression of genes annotated to GO terms related to flavonoid/anthocyanin pathways (GO:0009813 and GO:0031537) and TFs PAP1/MYB75 (AT1G56650) and PAP2/MYB90 (AT1G66390) known to regulate genes in the flavonoid/anthocyanin pathway (Borevitz et al., 2000; Tohge et al., 2005; Zuluaga et al., 2008). At 30 and 37 DAS, expression of these genes in the SLIM1 mutants was similar to Col-0. However, at 44 DAS, transcripts of the TFs PAP1/MYB75 and PAP2/MYB90 were found to be approximately 4-fold and 32-fold higher in 35S::SLIM1 lines than in Col-0 (Figure 2D). Genes coding for enzymes such as UGT73B2 (AT4G34135) and CHS (AT5G13930), are two- to fourfold induced in both 35S::SLIM1 lines relative to Col-0 (Figure 2D). Furthermore, the TF TT2 (AT5G35550) that regulates proanthocyanidin synthesis (Y. Liu et al., 2015; Zhu et al., 2015) was found to be upregulated in 35S::SLIM1 at 44 DAS (Figure 2D).
3.3 Overexpression of SLIM1 TF promotes developmental senescence
All genotypes started to visibly bolt at the 10-leaf stage, but the mean bolting day of 35S::SLIM1 plants was 29 DAS, while for Col-0, EV, and slim1-cr, it was 33 DAS (Figure 3A). Earlier bolting together in 35S::SLIM1 plants with accumulation of flavonoids and chlorosis at the leaf tips, which is typical for onset of senescence (Watanabe et al., 2013), observed at 51 DAS in the 35S::SLIM1 genotype (Figures 2A–C), indicates a faster development that may lead to earlier senescence in 35S::SLIM1 compared to Col-0, EV, and slim1-cr. To assess this hypothesis, at 37 and 44 DAS, the expression of genes known to be differentially regulated during senescence, such as SAGs and PAGs, were analyzed. Various SAGs were strongly upregulated in 35S::SLIM1 compared to the controls (Figure 3B, Supplementary Table S1). Genes such as SAG12 (AT5G45890) and SAG18 (AT1G71190) (Balazadeh et al., 2008; Gao et al., 2016; Hsu et al., 2022), NAC6 (AT5G39610) and NAP (AT1G69490) (Li et al., 2013; Kim et al., 2014), and autophagy genes including APG8A/ATG8A (AT4G21980), ATG8B (AT4G04620) and ATG8H (AT3G06420) (Li et al., 2012; Sakuraba et al., 2014) are upregulated in 35S::SLIM1. Genes involved in chlorophyll degradation such as NYC1 (AT4G13250) and PPH (AT5G13800) (Li et al., 2012) were found to be induced in 35S::SLIM1 and either downregulated or unaltered in slim1-cr (Figure 3B).
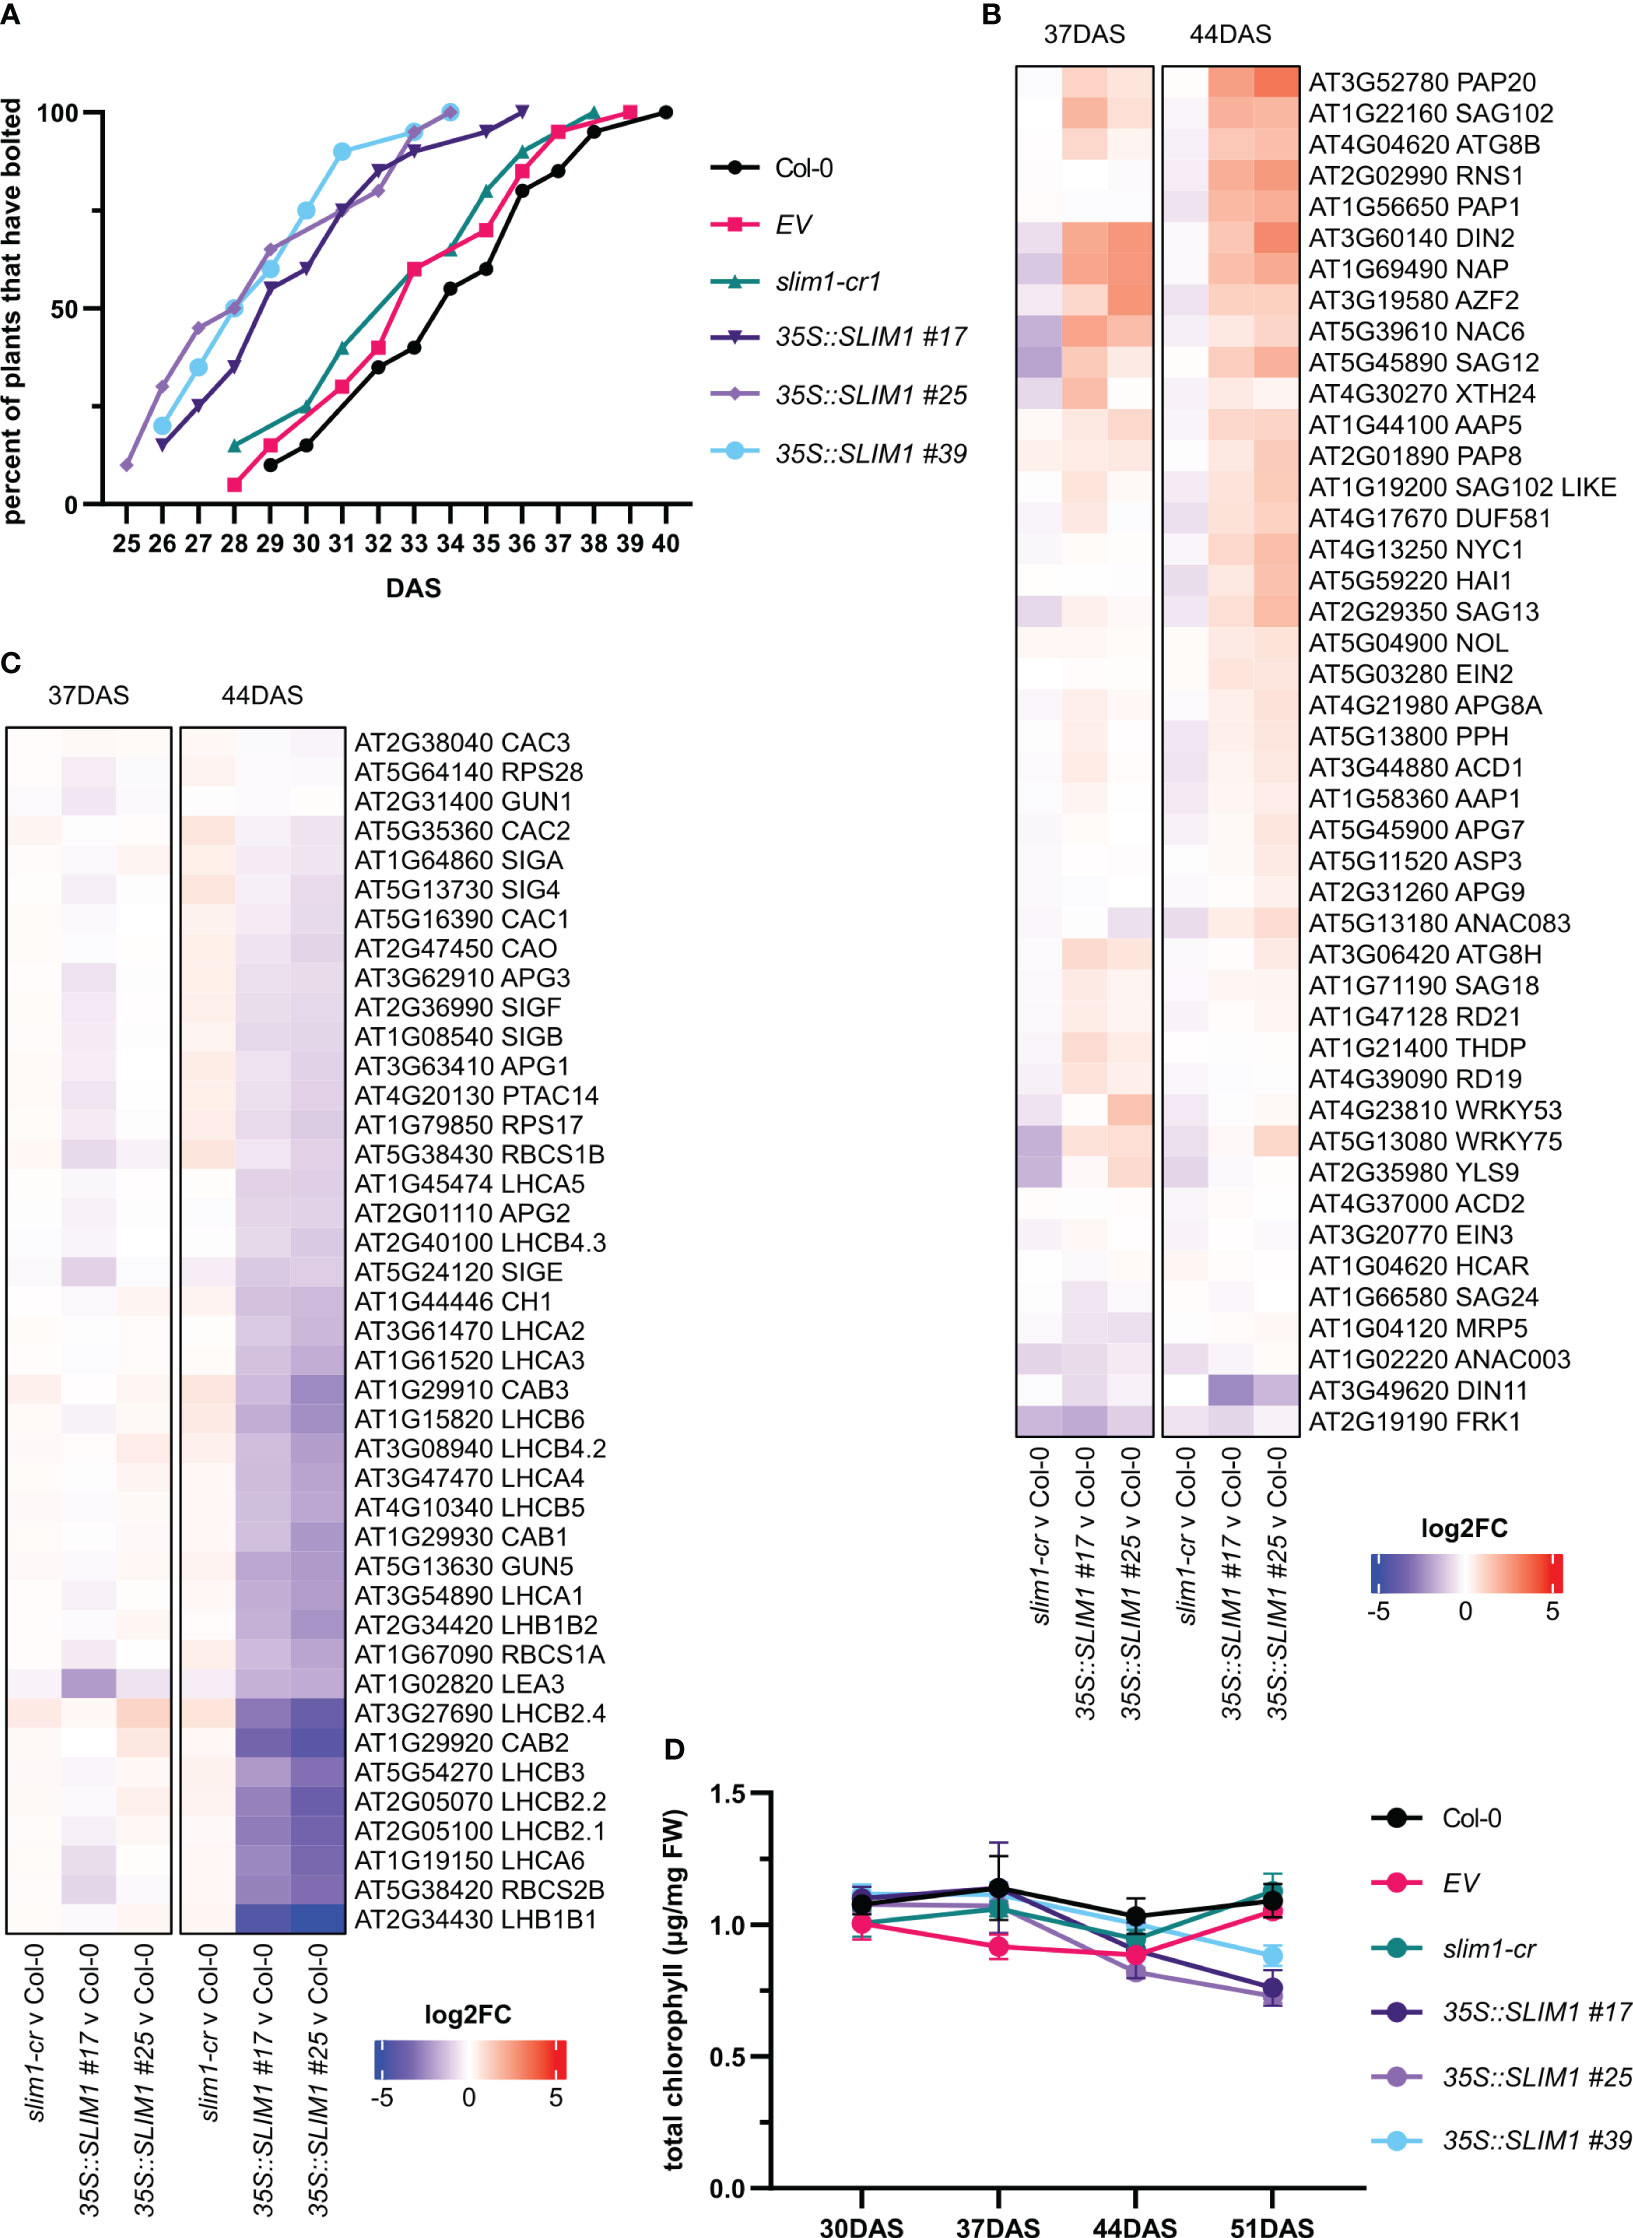
Figure 3 Development is accelerated in 35S::SLIM1 lines. (A) Cumulative percent of plants that have visibly bolted among 20 plants of each line as a function of DAS. Plants were considered to have bolted from the first day that the shoot apical meristem was visible. See Supplementary Table S1 for t-test results. (B) Heatmap representation of gene expression differences determined by RNA-seq. Genes shown are SAGs collected from published literature (Balazadeh et al., 2008; Li et al., 2012; Kim et al., 2014; Sakuraba et al., 2014; Gao et al., 2016; Hsu et al., 2022). (C) Heatmap representation of gene expression differences determined by RNA-seq. Genes shown are PAGs collected from published literature (Sawchuk et al., 2008; Horie et al., 2009; Gao et al., 2012; Motohashi et al., 2012; Yu et al., 2017; Liang et al., 2019). (B, C) Heatmap color corresponds to log2 of the fold change (log2FC) relative to Col-0 at each time point determined from three biological replicates. Wald test results for genes shown can be found in Supplementary Table S1. (D) Total chlorophyll content normalized to sample FW. Points represent the mean of three biological replicates, and error bars show the SEM. See Supplementary Table S1 for t-test results.
In contrast, most PAGs are at least twofold downregulated in both 35S::SLIM1 lines relative to Col-0 at 44 DAS (Figure 3C, Table 1, Supplementary Table S1). LHC family (Sawchuk et al., 2008; Horie et al., 2009) and CAC genes that code for chloroplast localized proteins (Yu et al., 2017) are downregulated in 35S::SLIM1. LEA3 (AT1G02820), which enhances photosynthetic efficiency by reducing ROS (Liang et al., 2019) and APG genes, whose mutants result in albino plants (Motohashi et al., 2012) and are downregulated in 35S::SLIM1 (Figure 3C). Another important PAG gene is PTAC14 (AT4G20130), which regulates chloroplast development (Gao et al., 2012), and is also downregulated in 35S::SLIM1. Since PAGs are involved in photosynthesis and in chlorophyll biosynthesis, we measured the chlorophyll content in the plants. Total chlorophyll content (Figure 3D) decreases steadily between 37 and 51 DAS in 35S::SLIM1 lines, while in Col-0, EV, and slim1-cr, total chlorophyll content remains similar to earlier time points (Figure 3D).
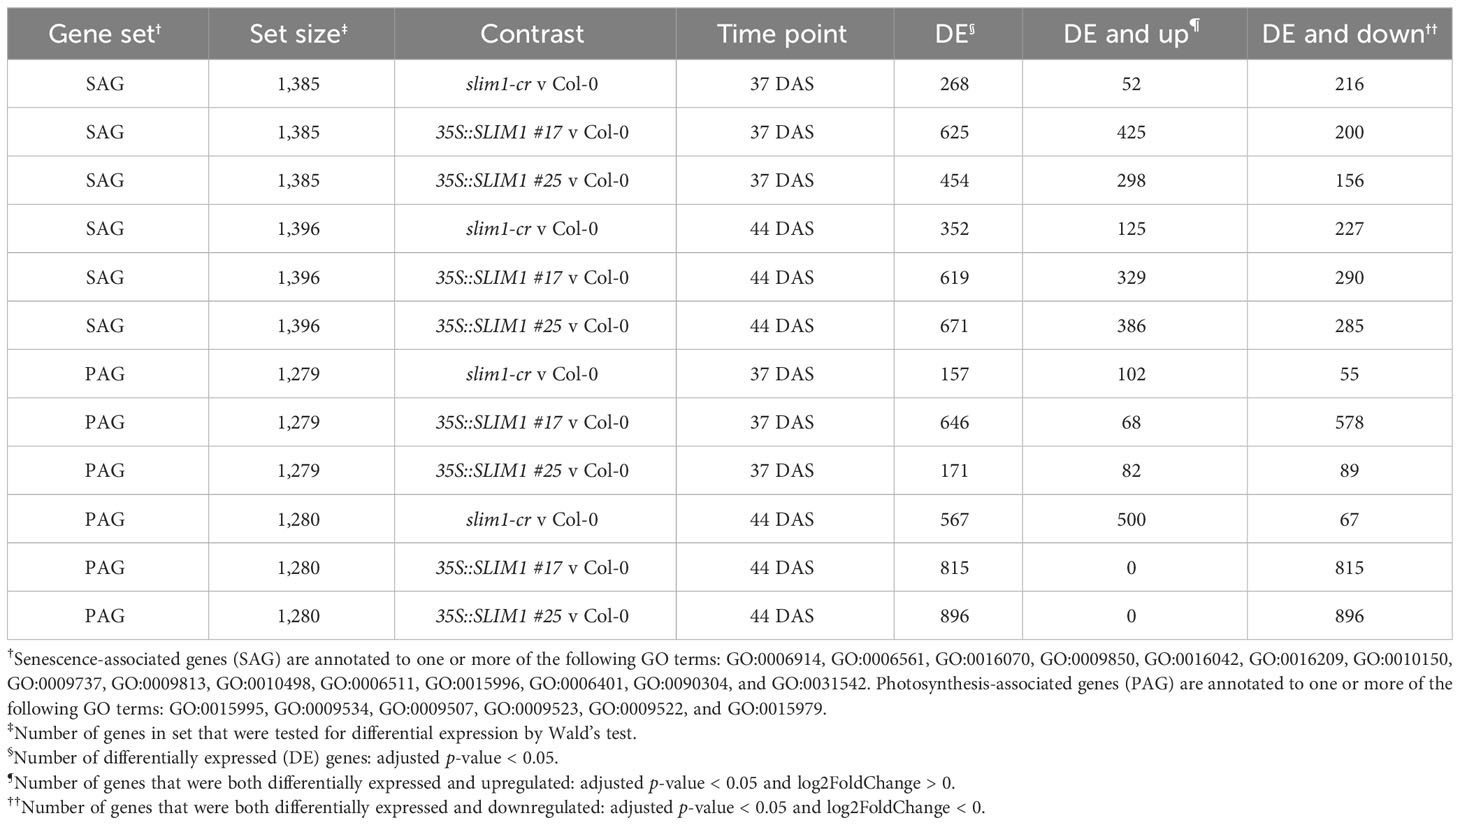
Table 1 Differential expression summary table for SAG and PAG gene sets.
Since nitrogen remobilization is tightly linked to senescence in Arabidopsis (Heyneke et al., 2017, 2019; Masclaux-Daubresse et al., 2010), rosette nitrate (NO3−) levels were determined. NO3− contents are lower in the 35S::SLIM1 lines from as early as 30 DAS, and the plants undergo further NO3− reduction as they age (Figure 4A). In contrast, over the same time course, very little change in NO3− was observed in Col-0, EV, and slim1-cr. Nitrate transmembrane transport genes were checked for differential expression. The nitrate transporter NRT2;5 (AT1G12940) known to be induced under low NO3− and under N-starvation conditions (Liu et al., 2020), is highly overexpressed in 35S::SLIM1 (Figure 4B) at 44 DAS. At this time point, NO3− content in 35S::SLIM1 is only 5% of the levels at 30 DAS. Additionally, NRT1;5 (AT1G32450), an important long-distance root-to-shoot transporter (Chen et al., 2021), and NRT1;7 (AT1G69870), a source-to-sink transporter (Fan et al., 2009), are induced in 35S::SLIM1 at 44 DAS relative to Col-0 (Figure 4B). The chloride channel CLC-A (AT5G40890) has a main role in the control of the NO3− status in Arabidopsis and is repressed under NO3−-deficient conditions (Geelen et al., 2000). CLC-A expression is strongly downregulated in 35S::SLIM1 at 44 DAS, a time point at which the NO3− content is particularly low in these lines (Figures 4A, B). Moreover, six NO3−-responding TFs, NIN-like RWP-RK domain-containing proteins (NLP) (Luo et al., 2021), are upregulated in the 35S::SLIM1 lines compared to Col-0 and slim1-cr at 44 DAS (Figure 4B).
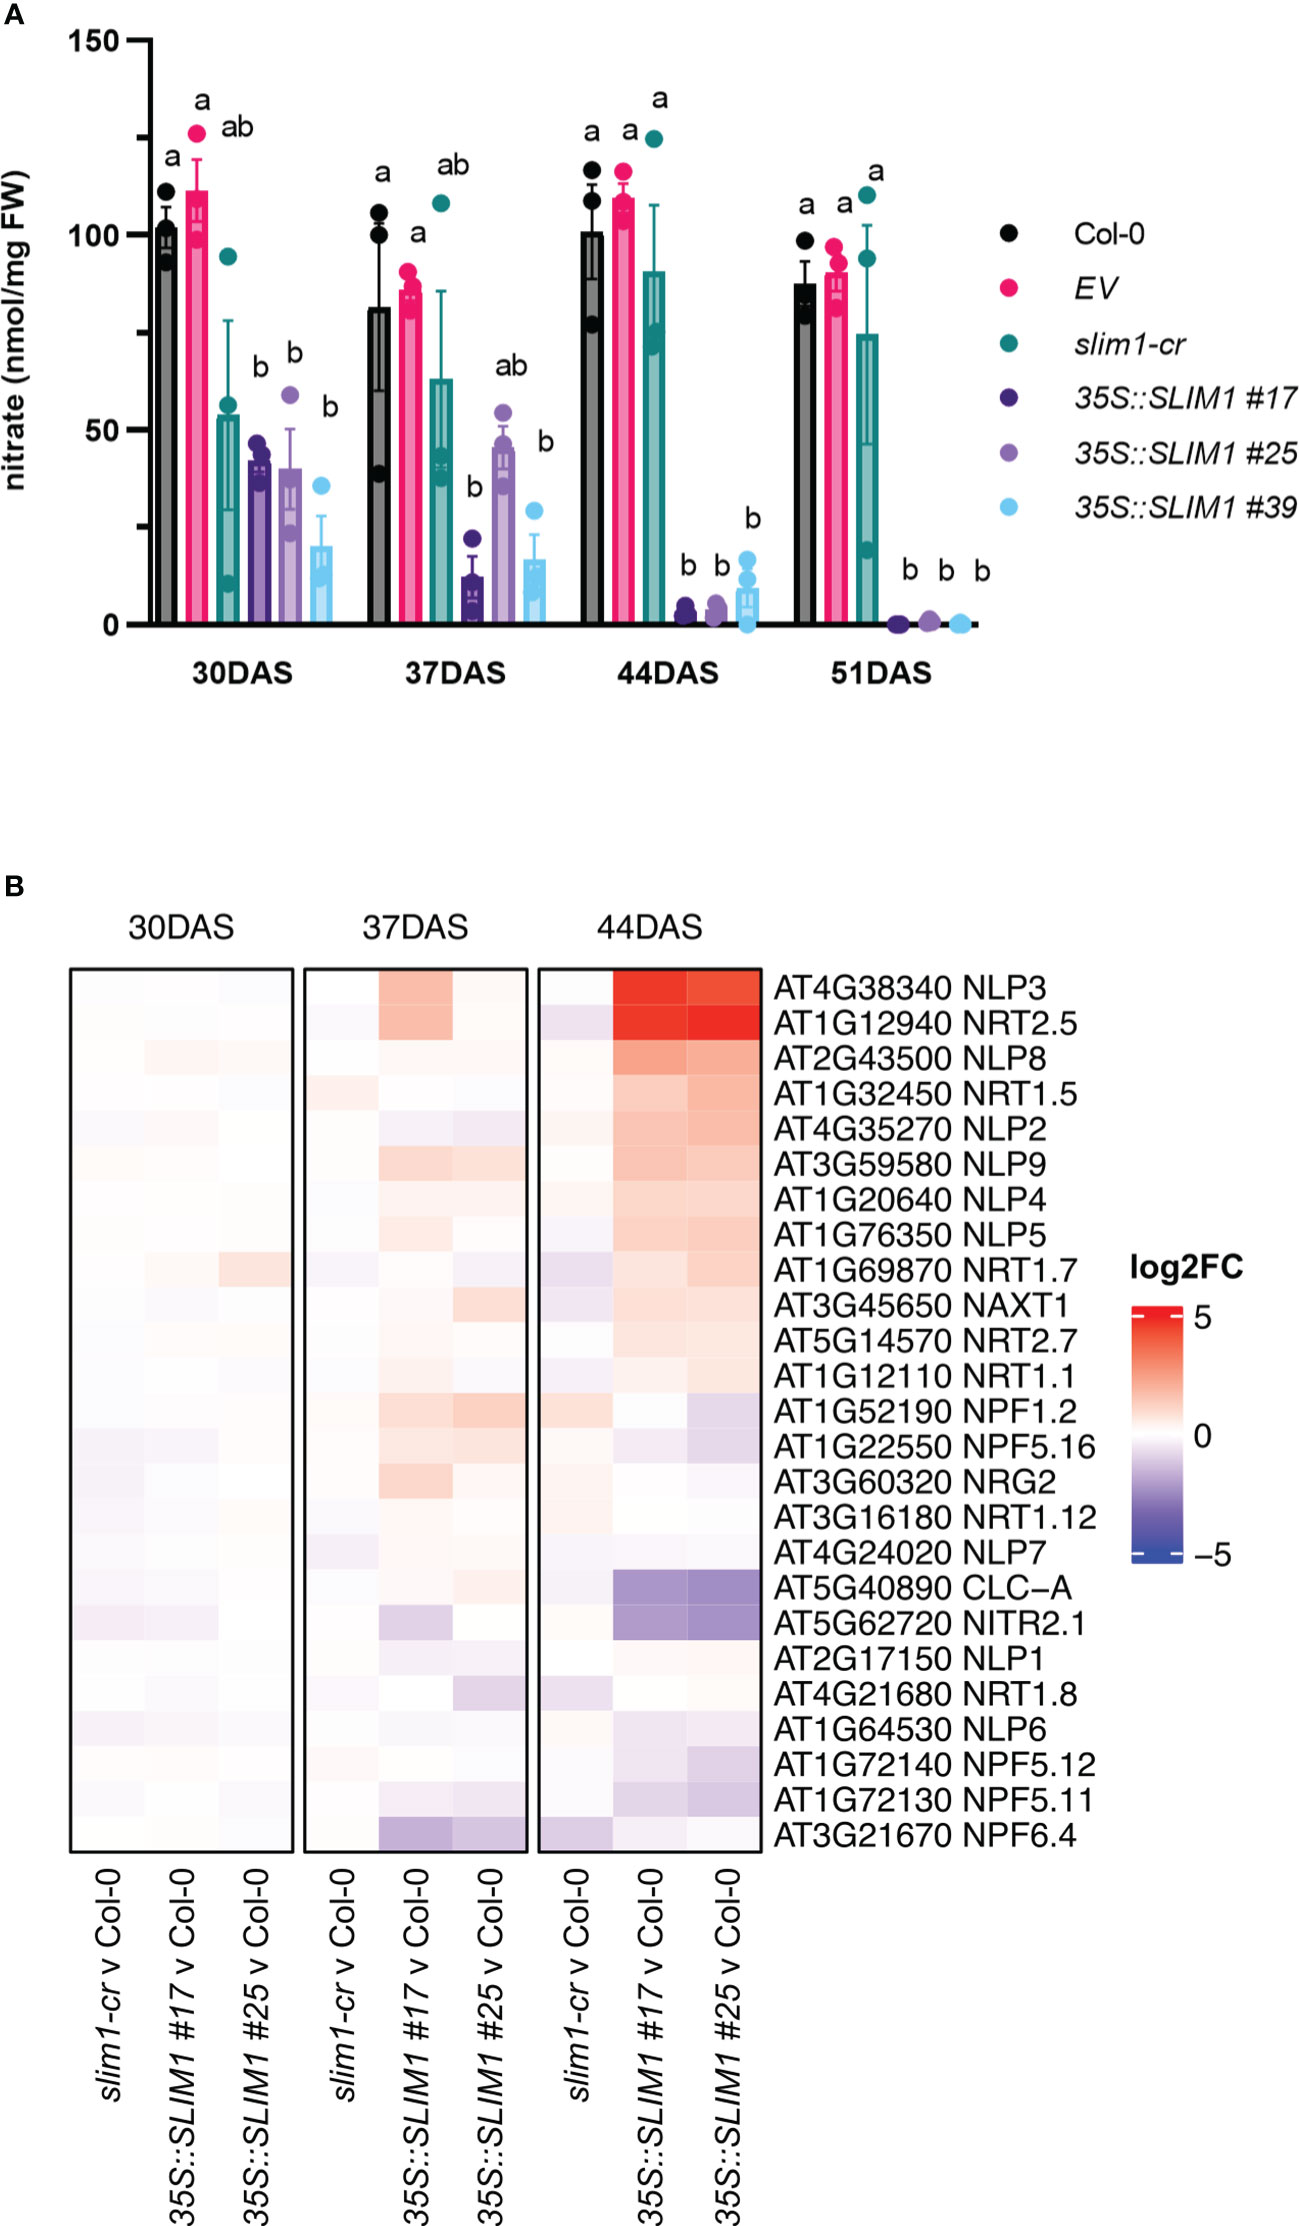
Figure 4 Rosette nitrate content is reduced in 35S::SLIM1 lines. (A) Rosette nitrate content normalized to sample FW. Bar height corresponds to mean of three biological replicates, and error bars represent the standard error of the mean (SEM). Statistical significance was assessed using t-tests within each time point; p-values were adjusted by the Benjamini–Yekutieli method. Compact letter display (CLD) identifies lines that are statistically different (adjusted p ≤ 0.05) from each other at each time point. (B) Heatmap representation of gene expression differences determined by RNA-seq. Genes shown include genes annotated to GO term nitrate transmembrane transport (GO: 0015706). Heatmap color corresponds to log2 of the fold change (log2FC) relative to Col-0 at each time point determined from three biological replicates. Wald test results for genes shown can be found in Supplementary Table S1.
3.4 Effects of SLIM1 expression on transcriptome in adult developmental stages
Given the multiple developmental phenotypes we observed in the 35S::SLIM1 lines, we wanted to assess the impact of SLIM1 expression on the transcriptome more generally (Supplementary Data Sheet S3). Using an adjusted p-value cutoff < 0.05, 9,228 and 10,198 genes were found to be differentially expressed (DE) at 44 DAS in 35S::SLIM1 #17 and #25, respectively, compared to Col-0, while 5,002 genes are DE in slim1-cr compared to Col-0 at 44 DAS (Supplementary Figure S3). At both 37 DAS and 44 DAS, the number of differentially expressed genes (DEG) is approximately two- to threefold higher in 35S::SLIM1 lines than in slim1-cr. Additionally, the number of DEGs in the EV line are far fewer than in the SLIM1 mutants (91 in EV and an average of 2,292 in the 35S::SLIM1 lines at the same time point), which implies that the transcriptional effect of the vector itself on 35S::SLIM1 plants is not significant.
Among the DEGs at each time point, we wanted to identify those genes with the strongest transcriptome evidence of being regulated by SLIM1, either directly or indirectly. For this purpose, we defined a set of so-called class 1 SLIM1-regulated genes. Class 1 genes at each time point are characterized as being DE in 35S::SLIM1 #17, 35S::SLIM1 #25, and slim1-cr and as having consistent behavior in both 35S::SLIM1 and opposite behavior in slim1-cr. Class 1 SLIM1 positively regulated genes (35S::SLIM1 UP & slim1-cr DOWN) are DE and upregulated (log2FC > 0) in both 35S::SLIM1 lines, and in slim1-cr, they are DE and downregulated (log2FC < 0). Similarly, Class 1 SLIM1 negatively regulated genes (35S::SLIM1 DOWN & slim1-cr UP) are DE and downregulated in both 35S::SLIM1 lines, and in the slim1-cr line, they are DE and upregulated (Supplementary Table S2).
Based on these criteria, a total of 1,731 genes were identified as class 1 SLIM1-regulated genes. At 37 DAS, 478 class 1 genes were identified, 452 35S::SLIM1 UP & slim1-cr DOWN and 26 35S::SLIM1 DOWN & slim1-cr UP (Figure 5). At 44 DAS, 1,275 class 1 genes were identified, 492 35S::SLIM1 UP & slim1-cr DOWN and 783 35S::SLIM1 DOWN & slim1-cr UP. Among the 1,731 class 1 genes, 23 met the criteria at both 37 and 44 DAS, and all 23 had expression behavior consistent with their being positively regulated by SLIM1 (Figure 5).
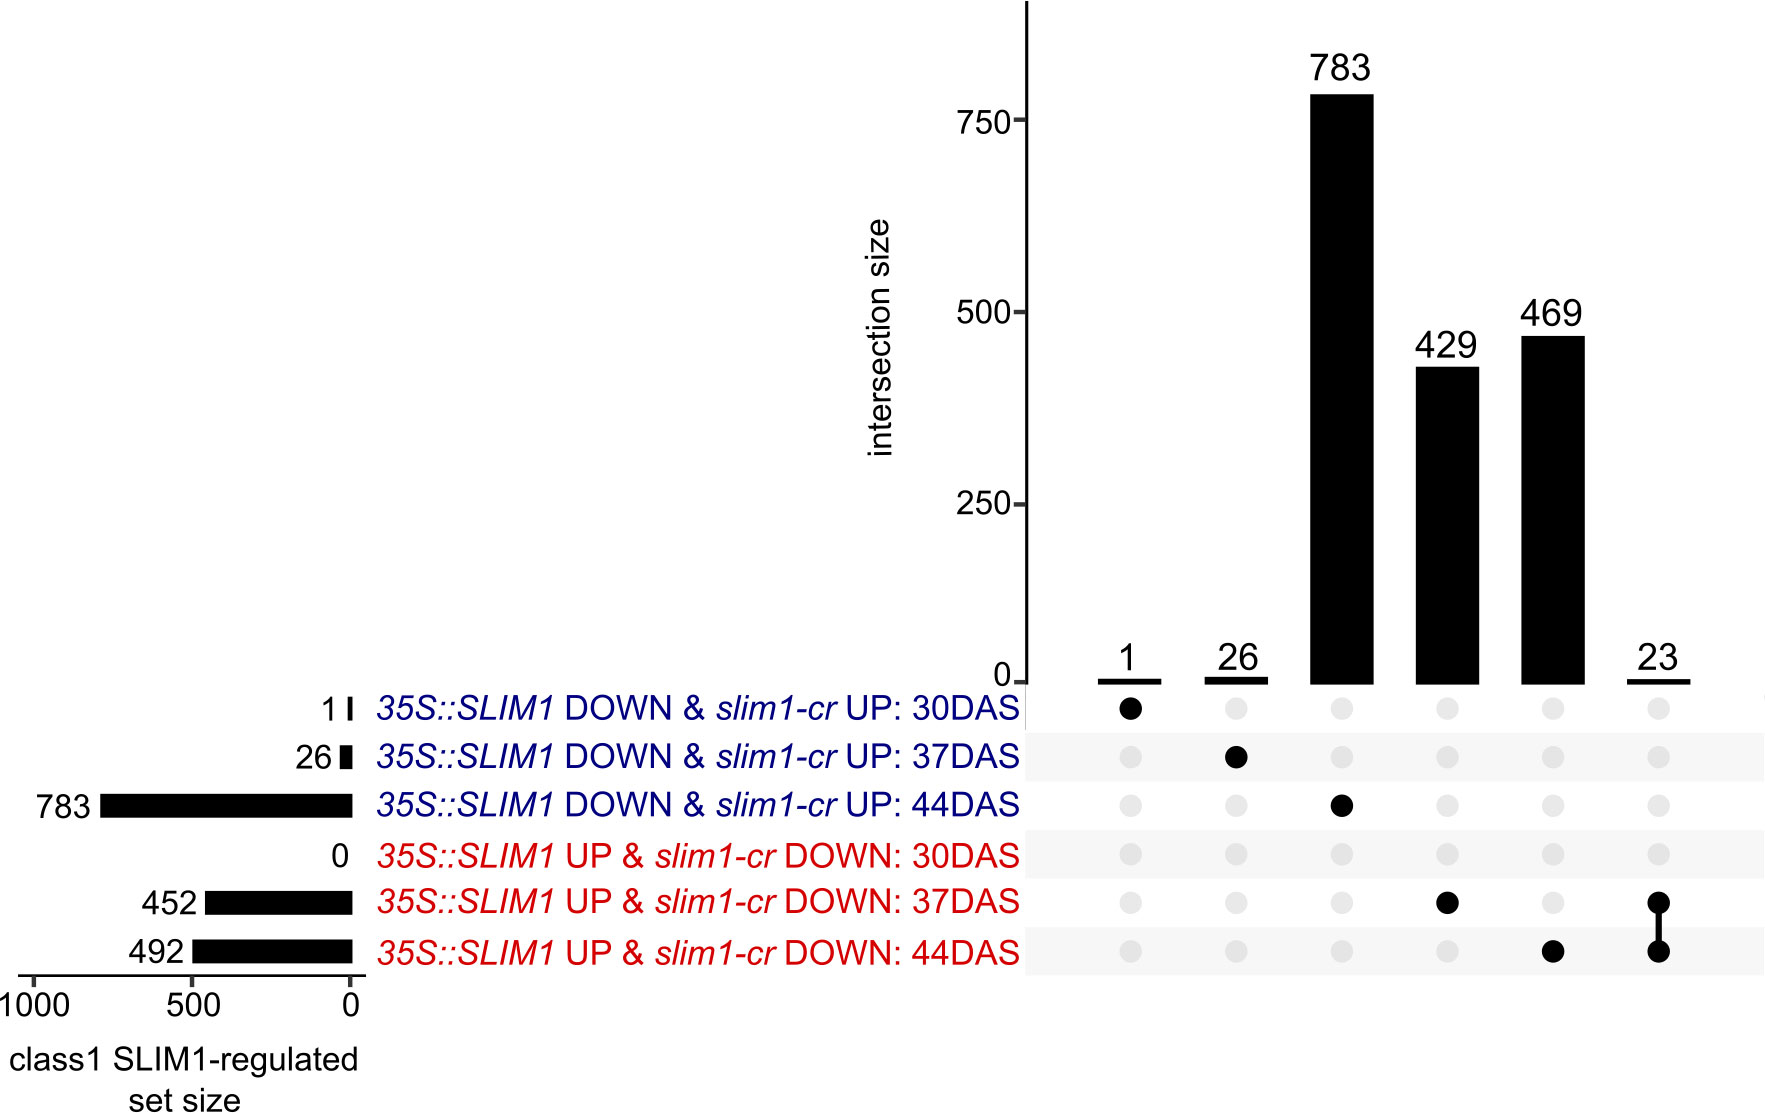
Figure 5 Class 1 SLIM1-regulated gene set intersection analysis. UpSet plot of class 1 SLIM1-regulated genes at each time point. Class 1 genes are defined as being either upregulated (padj < 0.05 and log2FC > 0) in both 35S::SLIM1 lines and downregulated (padj < 0.05 and log2FC < 0) in slim1-cr, 35S::SLIM1 UP & slim1-cr DOWN), or downregulated (padj < 0.05 and log2FC < 0) in both 35S::SLIM1OX lines and upregulated (padj < 0.05 and log2FC > 0) in slim1-cr, (35S::SLIM1 DOWN & slim1-cr UP). Wald test results for class 1 genes shown can be found in Supplementary Table S1. Genes in each set and intersection can be found in Supplementary Table S2.
In order to identify processes and functions that may be transcriptionally affected by SLIM1, we tested for over-representation of Gene Ontology (GO) terms and KEGG pathways in three sets of class 1 genes at 37 DAS and 44 DAS: class 1 genes that are positively regulated by SLIM1, class 1 genes that are negatively regulated by SLIM1, and all class 1 genes regardless of the response direction to SLIM1 (Figure 6). As expected, based on the expression of PAGs (Figure 3C), terms such as GO:0015979 photosynthesis, GO:0015995 chlorophyll biosynthetic process, GO:0016168 chlorophyll binding, GO:0009658 chloroplast organization, GO:0016851 magnesium chelatase activity, and GO:0006782 protoporphyrinogen IX biosynthetic process are over-represented in the set of 35S::SLIM1 DOWN & slim1-cr UP class 1 genes at DAS44 (Figure 6). These transcriptional changes may contribute to the lower chlorophyll content in 35S::SLIM1 at 51 DAS (Figure 2A). A highly over-represented GO term in our class 1 gene list is GO:0016851, magnesium chelatase (Figure 6). Magnesium chelatase inserts a Mg2+ into photoporphyrin IX, which is the first step of chlorophyll biosynthesis (Rissler et al., 2002). This GO term consists of five genes, and four of those genes are 35S::SLIM1 DOWN & slim1-cr UP class 1 genes at 44 DAS (Supplementary Tables S2, S3). Another GO term with a very high ratio of class 1 genes is GO:0000311, plastid large ribosomal subunit (Figure 6). Four of five genes annotated to this GO term are class 1 SLIM1 negatively regulated at 44 DAS (Supplementary Tables S2, S3). Among the GO terms that are over-represented in class 1 genes that are positively regulated by SLIM1 are GO:0005618 cell wall and GO:1900057 positive regulation of leaf senescence (Figure 6). This supports a role for SLIM1 in regulating the timing of developmental senescence (Figures 2, 3), and possibly the greater rosette area in 35S::SLIM1 (Figure 1C). Notably, no sulfur-related GO terms or KEGG pathways are over-represented in the list of class 1 SLIM1-regulated genes from analysis of plants grown on sufficient sulfur conditions (Figure 6).
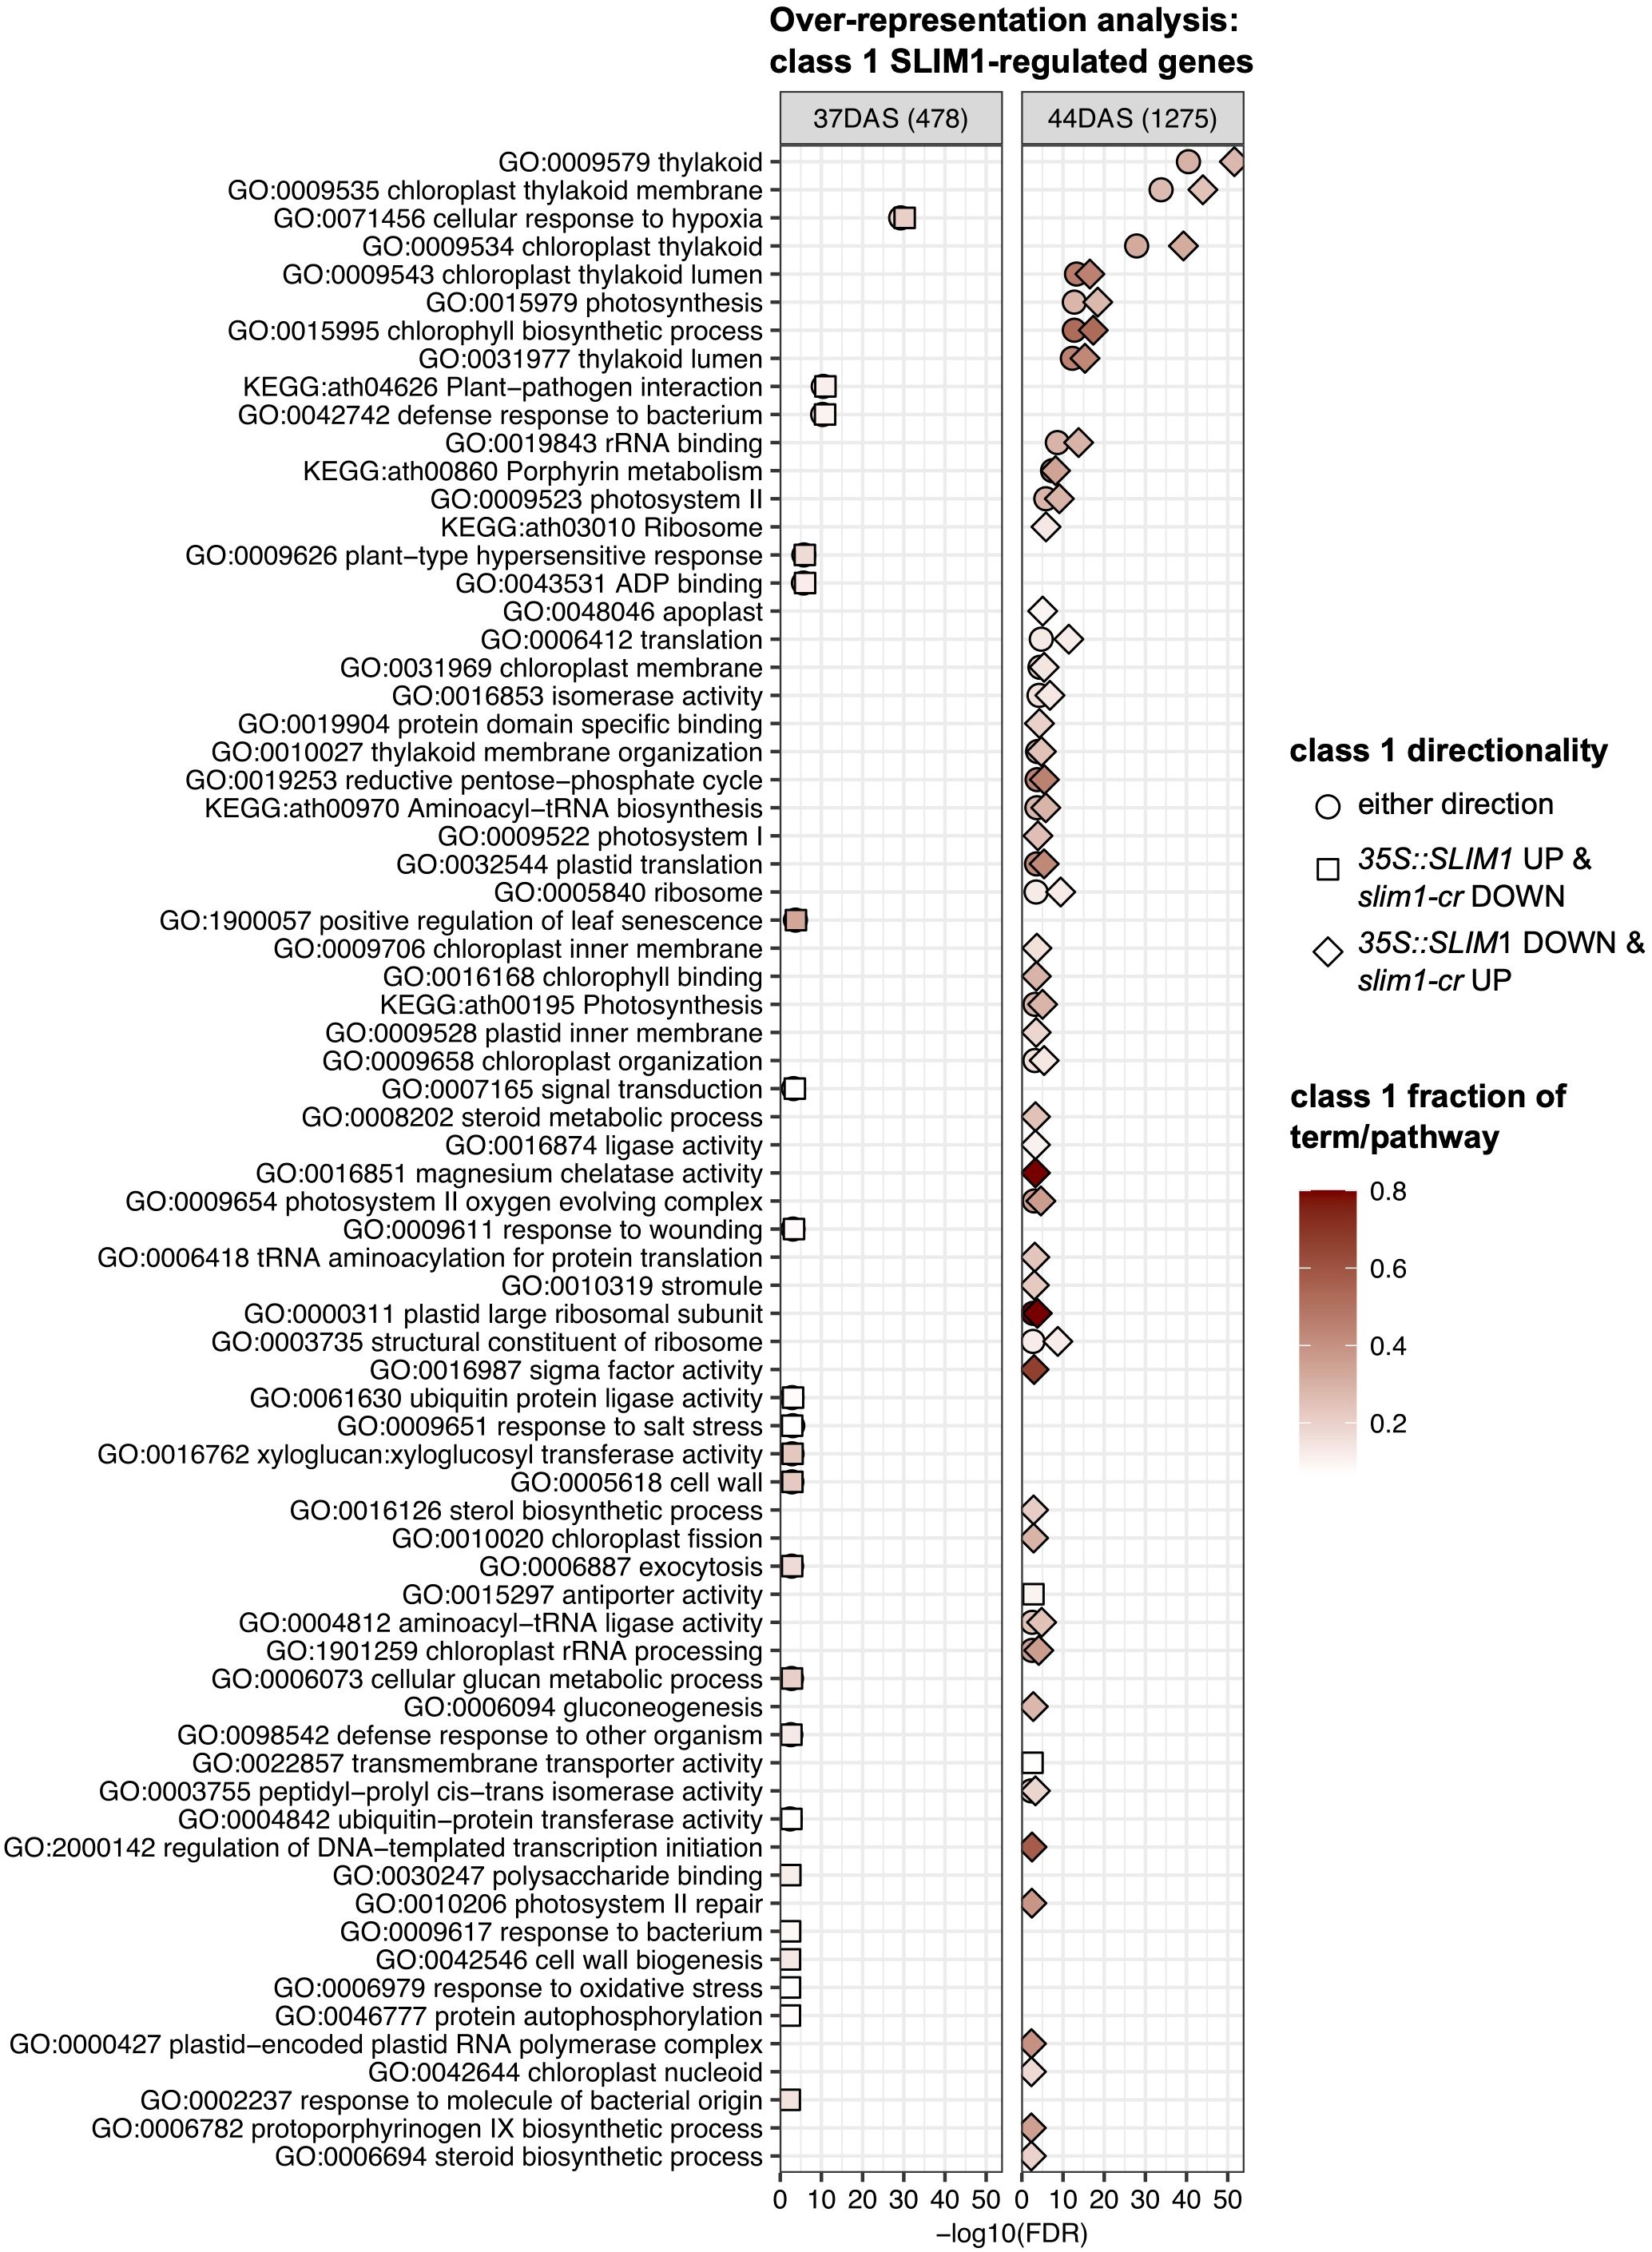
Figure 6 Over-representation analysis of GO terms and KEGG pathways. Over-representation analysis of GO terms and KEGG pathways annotated to class 1 genes was performed by Fisher’s exact test. In total, six sets of class 1 genes were tested: three directionality classes 35S::SLIM1 UP & slim1-cr DOWN (square), 35S::SLIM1 DOWN & slim1-cr UP (diamond), either directionality (circle) at two time points (37 DAS and 44 DAS). The gene universe was composed of the 20,899 genes with RNA-seq Wald test results in this study. GO terms and KEGG pathways with <5 or >500 genes in the gene universe were excluded from Fisher’s exact testing. All terms and pathways with Fisher’s exact FDR < 0.005 from at least one of the six class 1 gene sets are visualized. Fill color corresponds to the fraction of genes in a given GO term or KEGG pathway that are also class 1 SLIM1-regulated. The number of class 1 genes (either directionality) at each time point is shown in parentheses. Fisher’s exact text results for terms and pathways shown can be found in Supplementary Table S3.
3.5 Cis-regulatory sequences of the class 1 gene promoters
In this study, we identified 12 class 1 genes whose promoters were found by DNA affinity purification sequencing (DAP-seq) to be bound by SLIM1 protein (O’Malley et al., 2016) (Table 2). With Plant Regulomics (Ran et al., 2020), we searched for sequence motifs common to the promoters of those 12 genes (Supplementary Table S4). Using a p ≤ 0.05 cutoff, we identified the motif MNB1A (AAAGC), a C2H2 zinc finger binding site (Table 2). Additionally, the promoters of these 12 genes all contain SURE elements, a recently identified SLIM1 binding site (Rakpenthai et al., 2022), and 7 of the 12 have TEBS elements (Table 2). Searching for more class 1 genes whose promoters contain known SLIM1 binding motifs, SURE or TEBS, we identified seven additional genes (Table 2).
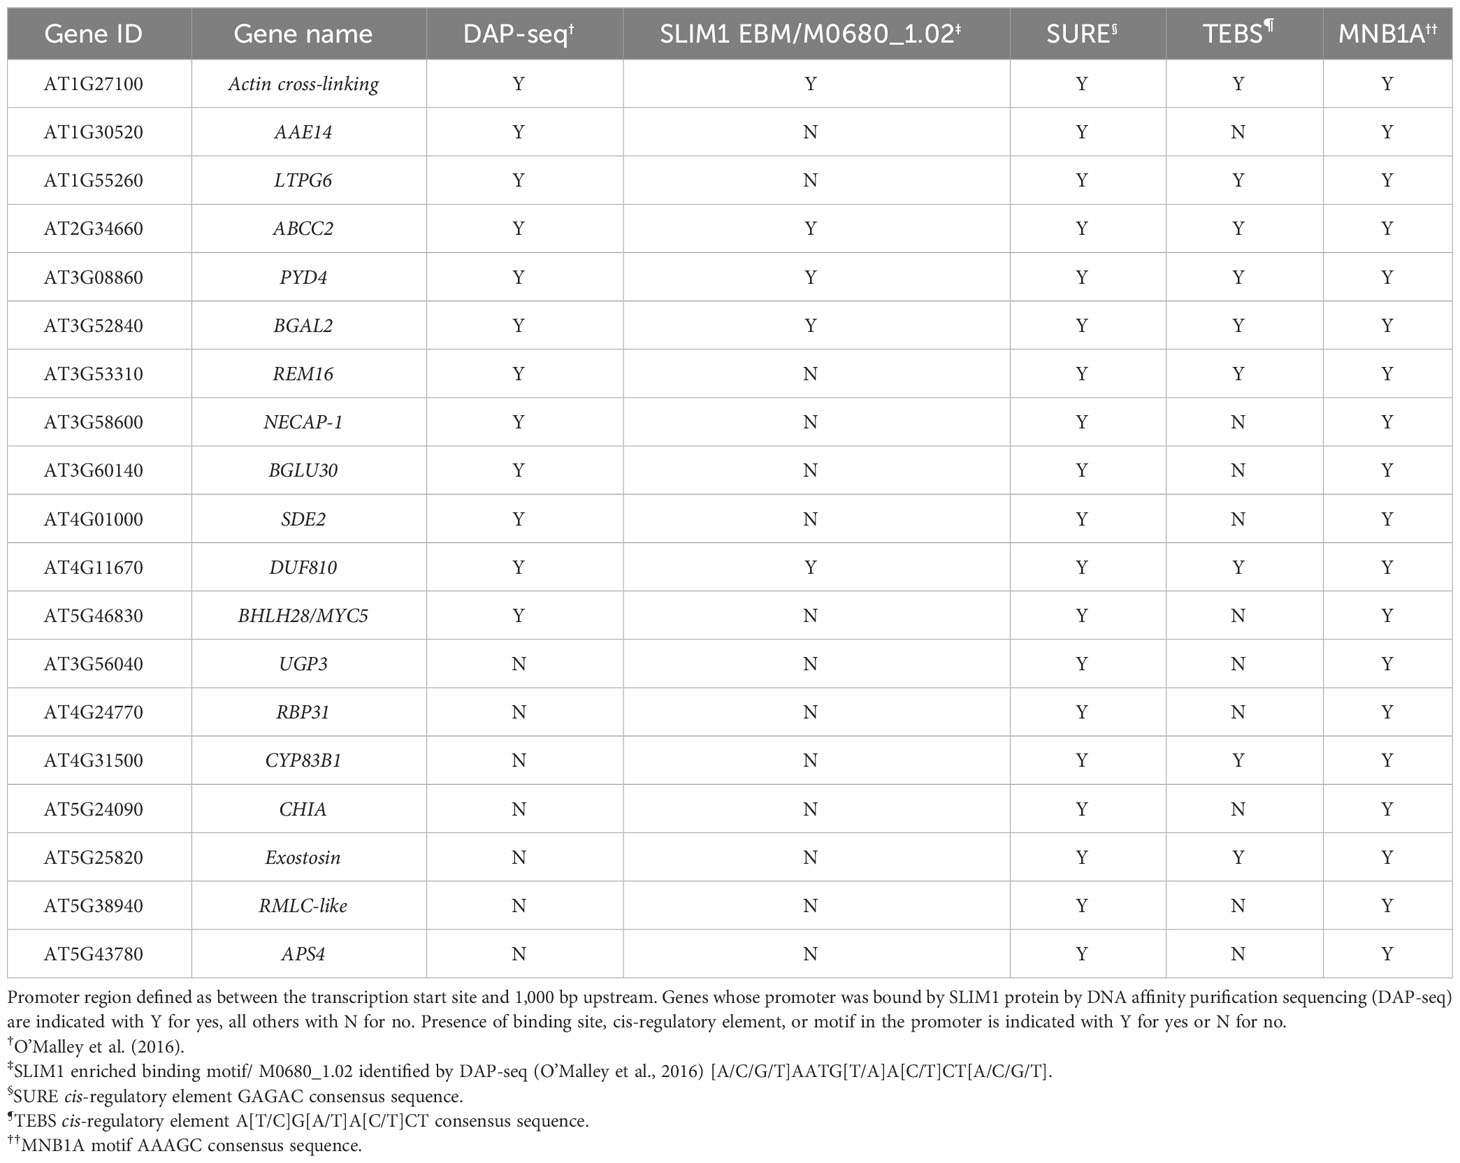
Table 2 Cis-regulatory element analysis of promoters of 19 selected class 1 SLIM1-regulated genes.
These 19 genes have the strongest evidence of being directly regulated by SLIM1 in our experimental system. Here, we briefly describe the proteins encoded by the genes in Table 2. Two of the 19 genes code for proteins associated with anthocyanin metabolism. ABCC2 (AT2G34660) is a transporter of acetylated anthocyanins across the vacuolar membrane (Behrens et al., 2019), and SDE2 (AT4G01000) is a ubiquitin-like superfamily protein that has been shown to indirectly regulate anthocyanin biosynthesis (Xie et al., 2017). Two genes encode proteins involved in electron transport in photosystem I. AAE14 (AT1G30520) is an enzyme in the biosynthetic pathway for phylloquinone, an essential photosystem I electron carrier (Kim et al., 2008). RBP31 (AT4G24770) is an RNA-binding protein involved in chloroplastic RNA editing (Okuzaki et al., 2021), especially RNAs encoding subunits of the NDH complex, which mediates photosystem I cyclic electron transport (Lenzen et al., 2020). Four genes encoding sulfur metabolism-related proteins are in the set of 19. These are APS4 (AT5G43780), UGP3 (AT3G56040), CYP83B1 (AT4G31500), and BGLU30 (AT3G60140). APS4 is a sulfate adenyltransferase that activates sulfate for reduction to sulfide or for sulfonation (Hatzfeld et al., 2000). UGP3 is a UDP-glucose pyrophosphorylase and is required for synthesis of sulfoquinovosyldiacylglycerol lipids, which are components of chloroplast membranes (Okazaki et al., 2009). CYP83B1 catalyzes an intermediate step in the biosynthesis of indolic glucosinolates (Goto et al., 2023), and BGLU30 is a beta-glucosidase involved in glucosinolate catabolism. BGAL2 (AT3G52840) encodes an apoplast-localized beta-galactosidase. Although BGAL2 functions are not well characterized, expression of other BGAL family proteins are associated with cell wall expansion and cell wall remodeling in a variety of tissues (Chandrasekar and Van Der Hoorn, 2016). Genes known to be involved in abiotic and biotic stress responses were also identified. These include PYD4 (AT3G08860), LTPG6 (AT1G55260), and CHIA (AT5G24090). PYD4 encodes a beta-alanine aminotransferase that performs the final enzymatic step in the synthesis of beta-alanine from propanoate (Parthasarathy et al., 2019). Beta-alanine accumulates in plants exposed to many biotic and abiotic stresses. LTPG6 is an apoplast-localized, non-specific lipid transport protein that has been shown to affect penetration of the epidermal cell wall by some fungi (Fahlberg et al., 2019). CHIA catalyzes bacterial cell wall peptidoglycan breakdown in order to trigger plant immunity responses (Liu et al., 2014). The list of genes in Table 2 also includes two transcription factors: REM16 (AT3G53310) and bHLH28/MYC5 (AT5G46830), which are involved in regulation of photoperiodism and flowering (GO:2000028) and diverse jasmonate-mediated processes (Song et al., 2017), respectively. Little is known functionally about several of these 19 putative SLIM1-target genes beyond what we can infer from their protein family membership. RMLC-like (AT5G38940) is a member of the functionally diverse protein superfamily, Cupins (Dunwell, 1998), which includes seed storage proteins and germins. AT5G25820 encodes an exostosin family protein and is thereby predicted to have glycosyltransferase activity (GO:0016757). Functional annotations for NECAP-1 (AT3G58600) include clathrin vesicle coat (GO:0030125) and vesicle-mediated transport (GO:0016192) and are inferred based on phylogeny. Among these genes in Table 2, two code for proteins with domains of unknown function (DUF). AT1G27100 protein contains two DUF569 domains and AT4G11670 protein contains a DUF810 domain.
We performed promoter analysis of class 1 genes to explore whether particular GO terms or KEGG pathways are in general being regulated directly or indirectly by SLIM1. Initially, we performed promoter analysis for the genes annotated to GO terms with a minimum 0.66 fraction of class 1 genes (Figure 6), which were GO:0016851 magnesium chelatase activity (four of five genes are class 1) and GO:0000311 plastid large ribosomal subunit (four of six genes are class 1). None of the eight genes that are annotated to these terms contain SURE and TEBS elements, or SLIM1 binding sites in their promoters. None of the eight genes annotated to those GO terms were identified by DAP-seq to be bound by SLIM1 (O’Malley et al., 2016). This indicates that SLIM1 may have an indirect regulatory effect on the genes of these GO terms. At 37 DAS, terms over-represented in class 1 genes that are not linked to the observed phenotypes such as senescence, development, and growth include KEGG:ath04626 plant–pathogen interaction, GO:0009611 response to wounding, GO:0009651 response to salt stress, GO:0098542 defense response to other organism, GO:0009617 response to bacterium, and GO:0006979 response to oxidative stress. Promoter analysis of the 149 genes annotated to the six GO terms mentioned above revealed that one promoter has the SLIM1 enriched binding motif (O’Malley et al., 2016) and two promoters contain SURE elements [DIN2 (AT3G60140) and CHIA (AT5G24090)]. Since 35S::SLIM1 lines develop and senescence faster, we performed promoter analysis for the genes belonging to GO:1900057 positive regulation of leaf senescence. None of the 18 genes annotated to this term contain known SLIM1 binding sites in their promoters. Taken together, the promoter analysis suggests that most of the genes in the selected over-represented GO terms and KEGG pathways are unlikely to be regulated directly by SLIM1 binding to their promoters.
4 Discussion
SLIM1 is an ethylene insensitive 3-like (EIL) family TF that plays an important role in the transcriptional response to −S (Maruyama-Nakashita et al., 2006; Wawrzyńska and Sirko, 2014; Rakpenthai et al., 2022; Apodiakou and Hoefgen, 2023), to arsenic (Jobe et al., 2021), and to cadmium (Yamaguchi et al., 2020) in A. thaliana. However, SLIM1 has not been well studied in the context of sufficient nutrient/unstressed conditions. We grew A. thaliana Col-0, EV, slim1-cr, and multiple T2 generation 35S::SLIM1 lines in soil under long-day conditions and monitored their growth for 7 weeks (to 51 DAS). We found that the plants overexpressing SLIM1 have 1.5- to 3-fold greater rosette area across a wide developmental window (Figure 1C). Additionally, late in development 35S::SLIM1 leaves have chlorotic tips, a sign of senescence onset (Watanabe et al., 2013), have darker and purplish pigmentation, and are more curled compared to the control lines (Figure 2A). Pigments such as anthocyanins and chlorophylls were found to be altered in 35S::SLIM1 rosettes compared to the controls at this late time point (Figures 2B, 3D). Degradation of chlorophyll (Hörtensteiner, 2006; Gao et al., 2016), decline of photosynthesis (Masclaux-Daubresse et al., 2010; Lichtenthaler, 2012; Tamary et al., 2019), and accumulation of anthocyanins (Hoch et al., 2001; Diaz et al., 2006; Liu et al., 2018) are hallmarks of the early stages of leaf senescence, suggesting that 35S::SLIM1 lines enter senescence earlier than controls. It has been shown via yeast 1 hybrid that SLIM1 binds to the promoter of PAP1/MYB75 and as a result promotes anthocyanin accumulation under –S, while anthocyanin content in slim1-cr is similar under S-deficient and S-sufficient conditions (Wawrzyńska et al., 2022). These data, in combination with the transcripts of PAP1/MYB75 in 35S::SLIM1 (Figure 2D) and the anthocyanin and flavonoid accumulation in 35S::SLIM1 (Figures 2B, C), suggest that while SLIM1 may not be necessary for normal anthocyanin accumulation during senescence or S-deficient conditions, higher levels of SLIM1 promote anthocyanin production by directly regulating PAP1/MYB75. Moreover, the earlier bolting in 35S::SLIM1 is an indication that 35S::SLIM1 plants transition earlier into the reproductive phase, demonstrating accelerated development. The transition from the vegetative to the reproductive phase is tightly linked to senescence (Balazadeh et al., 2008; Hinckley and Brusslan, 2020).
35S::SLIM1 plants have greatly increased rosette area throughout the vegetative growth phase (Figures 1B, C). Epidermis images revealed that the size (surface area) of epithelial cells was unaltered in 35S::SLIM1 genotypes compared to controls (Supplementary Figures S2D, E), indicating that the larger rosette area in 35S::SLIM1 plants is not due to the increased epithelial cell size. Leaf growth is affected by a sequence of linked processes, such as cell proliferation, meristemoid division, and cell expansion (Gonzalez et al., 2012). Differential regulation of cell proliferation during leaf growth can affect final leaf size. Genes involved in cell proliferation were analyzed for differential expression in our RNA-seq dataset (Supplementary Figure S2F, Supplementary Table S1). While a substantial number of cell proliferation genes were found to be differentially expressed in 35S::SLIM1, overall, the differences relative to Col-0 were concentrated at the later time points (37 and 44 DAS), and therefore cannot explain the consistently larger leaves in 35S::SLIM1 lines from at least 16 DAS (Figure 1C). In Arabidopsis, the extent of cell division of the leaf primordium founder cells can also affect the final leaf size through differences in cell number (Vercruysse et al., 2021). It may be that an important cause of larger rosettes in 35S::SLIM1 plants can be traced back to differences in these primordium founder cells.
SLIM1 is a key regulator of sulfur deficiency responses, and sulfur metabolism directly impacts redox regulation, which may contribute to the plant development and leaf area phenotypes observed in the 35S::SLIM1 lines (Figures 1–3). Therefore, we assessed whether 35S::SLIM1 plants have altered sulfur metabolism in the sufficient sulfur conditions used in our study. Over-representation analysis of class 1 SLIM1-regulated genes did not identify any GO terms or KEGG pathways related to sulfur metabolism (Figure 6), suggesting that sulfur metabolism is not broadly regulated on the transcriptional level by SLIM1 under our sulfur-sufficient experimental conditions. This is similar to the recent finding that the majority of genes involved in sulfur metabolism/assimilation are not differentially expressed in eil3/slim1 mutant under sulfur-sufficient conditions (Dietzen et al., 2020). Moreover, the sulfate content in 35S::SLIM1 plants was very similar to Col-0 and EV at all time points tested (Supplementary Figure 4A). Cysteine levels tended to be higher in 35S::SLIM1 lines than Col-0, but were only consistently statistically different at 30 DAS (Supplementary Figure 4B). Glutathione is an important S-containing redox buffering compound (Joshi et al., 2019), and it is thought to play an important role in regulating plant development (Rouhier et al., 2015). Like cystine, glutathione tended to be higher in 35S::SLIM1 plants but is only consistently and clearly accumulated at 30 DAS. However, at this time point, glutathione was elevated in both slim1-cr and 35S::SLIM1 plants (Supplementary Figure 4B), so it is unlikely to be a major contributor to the early bolting phenotype observed in the 35S::SLIM1 lines (Figure 3A) or directly related to the consistently greater size of 35S::SLIM1 plants across our 4-week time course (Figure 1B). Another major pool of organic sulfur in Arabidopsis is glucosinolates. 35S::SLIM1 lines did not exhibit consistently altered glucosinolate levels relative to controls (Supplementary Figure 4D), and at 30 DAS and 37 DAS, glucosinolate levels were similar in slim1-cr and 35S::SLIM1 lines. Transcripts of the majority of sulfate assimilation pathway, sulfate transporters, and OAS-cluster genes are regulated similarly in slim1-cr and 35S::SLIM1 lines (Supplementary Figure 4E). Taken together, these data suggest that overexpression of SLIM1 TF in our sulfur-sufficient growth conditions does not strongly affect sulfur metabolism.
SLIM1 has been shown to regulate genes involved in ROS/redox signaling functional categories under S-sufficient conditions (Dietzen et al., 2020), and redox regulation plays a role in plant growth and developmental transitions. Therefore, we analyzed the expression pattern of 56 genes annotated as (cellular) response to ROS (GO:0000302 and GO:0034614), response to redox state (GO:0051775), and antioxidant activity (GO:0016209) at the three time points in our RNA-seq experiment (Supplementary Figure 4F). At 30 DAS, when approximately 60% of 35S::SLIM1 plants but less than 25% of slim1-cr and control plants have visibly bolted (Figure 3A), only one gene in the ROS/redox related set, COR78 (AT5G52310), appears to be regulated by SLIM1. By 37 DAS, 35S::SLIM1 plants show some transcriptional signs of having entered developmental senescence (Figure 3B), and five genes (AT4G17490, AT3G01420, AT1G19020, AT4G02380, and AT4G18880) show differential expression patterns consistent with positive regulation by SLIM1. Among these five, SDA1 (AT1G19020) was also found to be differentially expressed under sulfur-sufficient conditions in eil3 (Dietzen et al., 2020). Several ERF transcription factors have been previously shown to be differentially regulated in eil3 under S-sufficient conditions, but not the specific ERF found in our RNA-seq experiment, ATERF6. By 44 DAS, 35S::SLIM1 plants show some visible signs of senescence and many expression changes in PAGs and SAGs (Figures 3B, C). Among the ROS/redox-related genes, more show clear expression patterns consistent with SLIM1 regulation at 44 DAS than at earlier time points. This may be due to the strong link between ROS and plant aging/senescence (Pole et al., 2016).
Given the purple/pink pigmented phenotype (Figure 2A) and earlier bolting time (Figure 3A) in 35S::SLIM1 lines, we suspected that 35S::SLIM1 plants may develop faster and enter developmental senescence earlier. The first physiological processes affected during senescence are chloroplast function (Masclaux, 2000) and photosynthesis (Guo et al., 2004; Gregersen et al., 2013; Thomas, 2013). PAGs (Hye et al., 2004; Hörtensteiner, 2006; Gao et al., 2012; Motohashi et al., 2012; Thomas, 2013; Liang et al., 2019), known to be downregulated during leaf senescence, are downregulated in 35S::SLIM1 compared to Col-0 (Figure 3C), and to a lesser extent induced in slim1-cr. PAGs downregulation is consistent with the decline in the total chlorophyll content between 37 DAS and 44 DAS (Figure 3D). GO terms related to photosynthesis, chlorophyll, and chloroplast are overrepresented in class 1 genes negatively regulated by SLIM1 (Figure 6) at 44 DAS. Expression of PAGs is known to be negatively correlated with expression of SAGs (Buchanan-Wollaston et al., 2005; Lichtenthaler, 2012). SAGs (Hye et al., 2004; Li et al., 2012; Wu et al., 2012; Sakuraba et al., 2014; Hsu et al., 2022) and/or autophagy genes (Sakuraba et al., 2014) are known to accumulate during leaf senescence. SAGs are induced in 35S::SLIM1 (Figure 3B), indicating that 35S::SLIM1 has entered developmental senescence earlier than the other genotypes.
The characteristic phenotype with the purple/pink pigmentation observed in 35S::SLIM1 plants (Figure 2A) directed our interest to identify genes that are most likely regulated directly by SLIM1 (Table 2). ABCC2 (AT2G34660) is a class 1 gene at 44 DAS, which is positively regulated by SLIM1 and is a SLIM1&DAP-seq target (O’Malley et al., 2016). ABCC2 is an ABC transporter, specifically an anthocyanin transporter, and is involved in the vacuolar transport of acylated anthocyanins at the vegetative stage (Behrens et al., 2019; Dean et al., 2022). Anthocyanins, after they are synthesized in the cytoplasm, are modified (methylated, glycosylated, or acylated), and are sequestered in vacuoles where the environment is acidic. As a result, oxidation of the anthocyanins is prevented and they are stabilized to function as pigments (Dean et al., 2022). ABCC2 induction in 35S::SLIM1 suggests increased flux of anthocyanins from the cytoplasm into the vacuole where they are stabilized. Furthermore, EIN3 transcripts have been shown to accumulate during leaf senescence and constitutive overexpression of EIN3 accelerates leaf senescence, while leaf senescence is delayed in ein3 mutants (Li et al., 2013; Kim et al., 2014). EIN3 positively regulates leaf senescence through NAC6 and NAP activation (Kim et al., 2014). NAC6 and NAP were also upregulated in the 35S::SLIM1 lines, but EIN3 is not induced relative to Col-0 (Figure 3B). Therefore, the early senescence phenotype in 35S::SLIM1 is not mediated by EIN3 induction. EIN3 can form a heterodimer with SLIM1, which inhibits SLIM1 binding to DNA (Wawrzyńska and Sirko, 2016) but the levels of SLIM1 protein in the 35S::SLIM1 lines may be high enough that sufficient SLIM1 remains unbound to EIN3 and is thereby free to bind gene promoters. Therefore, SLIM1 can now positively regulate, directly or indirectly, NAC6 and NAP1.
NO3− content in 35S::SLIM1 is lower than in the controls in the early time points, and it decreases more than the controls do as the plants age (Figure 4A). Transporters such as NRT1;5, a long-distance root-to-shoot transporter (Chen et al., 2021), and NRT1;7, a source-to-sink transporter (Fan et al., 2009) and a class 1 SLIM1-regulated gene, are upregulated in 35S::SLIM1 at 44 DAS. Taken together, these data are preliminary indications that NO3− may be undergoing remobilization to the sink organs earlier than in Col-0 due to senescence. Additionally, NRT2;5, which is induced under N-starvation conditions, is 26-fold upregulated in 35S::SLIM1 (Figure 4B) at a time point when NO3− content in the 35S::SLIM1 rosette is extremely low (Figure 4A). Also at 44DAS, six of the nine NLP TFs in Arabidopsis, which are considered key TFs in NO3− sensing and the NO3− signaling pathway (Krapp, 2015; Mu and Luo, 2019), are induced in both 35S::SLIM1 lines compared to the control lines (Figure 4B). NLPs are induced when the plants grow under chronic NO3− starvation (Krapp, 2015; Luo et al., 2021). The NLP expression data (Figure 4B) are consistent with the low NO3− content detected in 35S::SLIM1 (Figure 4A).
In addition to genome-wide in vitro SLIM1 binding data (DAP-seq), multiple studies have identified motif sequences that are involved in SLIM1-mediated gene regulation under −S (Wawrzyńska and Sirko, 2016; Rakpenthai et al., 2022), including the SURE, TEBS, and UPE-box. Recently, it has been shown that SURE cis-regulatory element(s) are important for SLIM1 binding to the promoters of SDIs in vitro (Rakpenthai et al., 2022) and are important for induction of –S responsive genes that repress glucosinolate biosynthesis in Arabidopsis (Aarabi et al., 2016). Notably, all 12 of the genes with class 1 differential expression behavior here in unstressed conditions that were also identified as SLIM1 binding targets by DAP-seq have SURE element(s) in their promoter. In total, 19 class 1 genes were found to contain SURE element(s) and/or TEBS in their promoter sequences (Table 2). Taken together, these data indicate that SLIM1 binding to a gene promoter is unlikely to depend on a single particular cis-regulatory element or motif. Furthermore, SLIM1 binding to promoters might also depend on PPI with other trans-acting transcriptional regulators and with chromatin at potential target genes. PPI and the post-translational modifications that influence them are often tissue-, development-, and condition-dependent. For instance, SLIM1 DNA binding is inhibited by heterodimer formation with EIN3 (Wawrzyńska and Sirko, 2016). In Col-0, EIN3 is induced during senescence (Li et al., 2013; Kim et al., 2014), while SLIM1 expression remains stable (Van Der Graaff et al., 2006). Perhaps EIN3:SLIM1 complex formation reduces SLIM1 binding to PAG promoters, thereby slowing down senescence. Twenty PAGs (Figure 3C) are class 1 genes and five PAGs, LHCA2, LHCA3, LHCA4, SIGF, and PTAC14, contain SLIM1 enriched binding motifs (from DAP-seq). For the complete motif analysis from Plant Regulomics, please see Supplementary Table S4.
5 Conclusions
In this study, we show that overexpression of SLIM1 in Arabidopsis results in plants with larger rosettes and earlier maturity. Shorter time to maturity is an important trait to farmers because it reduces exposure to various environmental stresses, such as heat and drought at the end of the growing season. Moreover, faster crop maturation can allow farmers to plant additional crops in the same field in the same growing season. Increased leaf area may benefit farmers as well by increasing photosynthetic efficiency and suppressing weeds without the use of additional herbicides. We look forward to future studies that will test whether overexpression of SLIM1 paralogs in crop species results in the same beneficial phenotypes that we observe here in Arabidopsis.
It is not possible with the available data to determine precisely how many of the 1,731 class 1 genes identified in this study are directly regulated by SLIM1 via promoter binding in vivo. However, the fact that only 7 class 1 genes contain SURE elements in their promoter and 307 contain the DAP-seq SLIM1 enriched binding motif suggests that the expression of most class 1 genes is regulated by SLIM1 indirectly in our system. Direct modulation of expression by overexpressed SLIM1 triggers further gene expression responses in a pleiotropic manner; it eventually affects many genes and hence steers a variety of physiological responses. Post-translational modifications and PPI are likely important for SLIM1 function. For future research, attention should be paid to identify new SLIM1 protein interaction partners and post-translational modifications on SLIM1 protein that contribute to the growing list of gene regulatory functions of SLIM1.
Data availability statement
The RNA-seq data discussed in this publication have been deposited in NCBI’s Gene Expression Omnibus (Edgar et al., 2002) and are accessible through GEO Series accession number GSE243846 (https://www.ncbi.nlm.nih.gov/geo/query/acc.cgi?acc=GSE243846). These data include the clean read FASTQ files for each sample, the raw read count per gene table (Supplementary Data Sheet S1), and the normalized read count per gene table (Supplementary Data Sheet S2).
Author contributions
AA: Formal analysis, Investigation, Project administration, Validation, Writing – original draft, Writing – review & editing. SA: Investigation, Writing – review & editing. RH: Conceptualization, Funding acquisition, Project administration, Supervision, Writing – review & editing. SW: Data curation, Formal analysis, Supervision, Visualization, Writing – review & editing.
Funding
The author(s) declare financial support was received for the research, authorship, and/or publication of this article. AA was funded by the Deutsche Forschungsgemeinschaft (DFG), HO1916/13–1.
Acknowledgments
The authors would like to especially thank Franziska Brueckner for performing ion chromatography and helping with processing the huge number of samples. We would also like to thank Anja Froehlich for preparing the histological cross-sections, the samples for the epithelial cell experiment, and taking the respective pictures in the microscope. Many thanks to Arun Sampathkumar for mentoring AA regarding the microscope handling and Supplementary Figure S2 preparation. AA would like to thank Orianne Montulet for daily lunch meetings and discussions. AA thanks Dusan Denic for his daily presence and support even from far away.
Conflict of interest
The authors declare that the research was conducted in the absence of any commercial or financial relationships that could be construed as a potential conflict of interest.
Publisher’s note
All claims expressed in this article are solely those of the authors and do not necessarily represent those of their affiliated organizations, or those of the publisher, the editors and the reviewers. Any product that may be evaluated in this article, or claim that may be made by its manufacturer, is not guaranteed or endorsed by the publisher.
Supplementary material
The Supplementary Material for this article can be found online at: https://www.frontiersin.org/articles/10.3389/fpls.2024.1327152/full#supplementary-material
References
Aarabi, F., Kusajima, M., Tohge, T., Konishi, T., Gigolashvili, T., Takamune, M., et al. (2016). Sulfur deficiency-induced repressor proteins optimize glucosinolate biosynthesis in plants. Sci. Adv. 2, 1–18. doi: 10.1126/sciadv.1601087
Apodiakou, A., Hoefgen, R. (2023). New insights into the regulation of plant metabolism by O-acetylserine: sulfate and beyond. J. Exp. Bot. 74, 3361–3378. doi: 10.1093/jxb/erad124
Avila-Ospina, L., Moison, M., Yoshimoto, K., Masclaux-Daubresse, C. (2014). Autophagy, plant senescence, and nutrient recycling. J. Exp. Bot. 65, 3799–3811. doi: 10.1093/jxb/eru039
Ay, N., Irmler, K., Fischer, A., Uhlemann, R., Reuter, G., Humbeck, K. (2009). Epigenetic programming via histone methylation at WRKY53 controls leaf senescence in Arabidopsis thaliana. Plant J. 58, 333–346. doi: 10.1111/j.0960-7412.2009.03782.x
Balazadeh, S., Parlitz, S., Mueller-Roeber, B., Meyer, R. C. (2008). Natural developmental variations in leaf and plant senescence in Arabidopsis thaliana. Plant Biol. 10, 136–147. doi: 10.1111/j.1438-8677.2008.00108.x
Behrens, C. E., Smith, K. E., Iancu, C. V., Choe, J.-y., Dean, J. V. (2019). Transport of anthocyanins and other flavonoids by the Arabidopsis ATP-binding cassette transporter atABCC2. Sci. Rep. 9, 1–15. doi: 10.1038/s41598-018-37504-8
Borevitz, J. O., Xia, Y., Blount, J., Dixon, R. A., Lamb, C. (2000). Activation tagging identifies a conserved MYB regulator of phenylpropanoid biosynthesis. Plant Cell 12, 2383–2393. doi: 10.1105/tpc.12.12.2383
Buchanan-Wollaston, V., Page, T., Harrison, E., Breeze, E., Lim, P. O., Nam, H. G., et al. (2005). Comparative transcriptome analysis reveals significant differences in gene expression and signalling pathways between developmental and dark/starvation-induced senescence in Arabidopsis. Plant J. 42, 567–585. doi: 10.1111/j.1365-313X.2005.02399.x
Chandrasekar, B., Van Der Hoorn, R. A. L. (2016). Beta galactosidases in Arabidopsis and tomato - A mini review. Biochem. Soc. Trans. 44, 150–158. doi: 10.1042/BST20150217
Chen, H., Zhang, Q., Wang, X., Zhang, J., Ismail, A. M., Zhang, Z. (2021). Nitrogen form-mediated ethylene signal regulates root-to-shoot K+ translocation via NRT1.5. Plant Cell Environ. 44, 3576–3588. doi: 10.1111/pce.14182
Chen, J., Nolan, T. M., Ye, H., Zhang, M., Tong, H., Xin, P., et al. (2017). Arabidopsis WRKY46, WRKY54, and WRKY70 transcription factors are involved in brassinosteroid-regulated plant growth and drought responses. Plant Cell 29, 1425–1439. doi: 10.1105/tpc.17.00364
Chen, Y., Chen, Y., Shi, C., Huang, Z., Zhang, Y., Li, S., et al. (2018). SOAPnuke: A MapReduce acceleration-supported software for integrated quality control and preprocessing of high-throughput sequencing data. GigaScience 7, 1–6. doi: 10.1093/gigascience/gix120
Clough, S. J., Bent, A. F. (1998). Floral dip: a simplified method forAgrobacterium-mediated transformation ofArabidopsis thaliana. Plant J. 16, 735–743. doi: 10.1046/j.1365-313x.1998.00343.x
Conway, J. R., Lex, A., Gehlenborg, N. (2017). UpSetR: An R package for the visualization of intersecting sets and their properties. Bioinformatics 33, 2938–2940. doi: 10.1093/bioinformatics/btx364
Dean, J. V., Willis, M., Shaban, L. (2022). Transport of acylated anthocyanins by the Arabidopsis ATP-binding cassette transporters AtABCC1, AtABCC2, and AtABCC14. Physiologia Plantarum 174, 1–13. doi: 10.1111/ppl.13780
Diaz, C., Lemaître, T., Christ, A., Azzopardi, M., Kato, Y., Sato, F., et al. (2008). Nitrogen recycling and remobilization are differentially controlled by leaf senescence and development stage in Arabidopsis under low nitrogen nutrition. Plant Physiol. 147, 1437–1449. doi: 10.1104/pp.108.119040
Diaz, C., Saliba-Colombani, V., Loudet, O., Belluomo, P., Moreau, L., Daniel-Vedele, F., et al. (2006). Leaf yellowing and anthocyanin accumulation are two genetically independent strategies in response to nitrogen limitation in Arabidopsis thaliana. Plant Cell Physiol. 47, 74–83. doi: 10.1093/pcp/pci225
Dietzen, C., Koprivova, A., Whitcomb, S. J., Langen, G., Jobe, T. O., Hoefgen, R., et al. (2020). The transcription factor EIL1 participates in the regulation of sulfur-deficiency response. Plant Physiol. 184, 2120–2136. doi: 10.1104/pp.20.01192
Duarte, J. M., Wall, P. K., Edger, P. P., Landherr, L. L., Ma, H., Pires, P. K., et al. (2010). Identification of shared single copy nuclear genes in Arabidopsis, Populus, Vitis and Oryzaand their phylogenetic utility across various taxonomic levels. BMC Evolutionary Biol. 10, 61. doi: 10.1186/1471-2148-10-61
Dunwell, J. M. (1998). Cupins: A new superfamily of functionally diverse proteins that include germins and plant storage proteins. Biotechnol. Genet. Eng. Rev. 15, 1–32. doi: 10.1080/02648725.1998.10647950
Durinck, S., Moreau, Y., Kasprzyk, A., Davis, S., De Moor, B., Brazma, A., et al. (2005). BioMart and Bioconductor: A powerful link between biological databases and microarray data analysis. Bioinformatics 21, 3439–3440. doi: 10.1093/bioinformatics/bti525
Durinck, S., Spellman, P. T., Birney, E., Huber, W. (2009). Mapping identifiers for the integration of genomic datasets with the R/ Bioconductor package biomaRt. Nat. Protoc. 4, 1184–1191. doi: 10.1038/nprot.2009.97
Edgar, R., Domrachev, M., Lash, A. E. (2002). Gene Expression Omnibus: NCBI gene expression and hybridization array data repository. Nucleic Acids Res. 30, 207–210. doi: 10.1093/nar/30.1.207
Fahlberg, P., Buhot, N., Johansson, O. N., Andersson, M. X. (2019). Involvement of lipid transfer proteins in resistance against a non-host powdery mildew in Arabidopsis thaliana. Mol. Plant Pathol. 20, 69–77. doi: 10.1111/mpp.12740
Fan, S. C., Lin, C. S., Hsu, P. K., Lin, S. H., Tsay, Y. F. (2009). The Arabidopsis nitrate transporter NRT1.7, expressed in phloem, is responsible for source-to-sink remobilization of nitrate. Plant Cell 21, 2750–2761. doi: 10.1105/tpc.109.067603
Faralli, M., Lawson, T. (2020). Natural genetic variation in photosynthesis: an untapped resource to increase crop yield potential? Plant J. 101, 518–528. doi: 10.1111/tpj.14568
Gao, S., Gao, J., Zhu, X., Song, Y., Li, Z., Ren, G., et al. (2016). ABF2, ABF3, and ABF4 promote ABA-mediated chlorophyll degradation and leaf senescence by transcriptional activation of chlorophyll catabolic genes and senescence-associated genes in Arabidopsis. Mol. Plant 9, 1272–1285. doi: 10.1016/j.molp.2016.06.006
Gao, Z. P., Chen, G. X., Yang, Z. N. (2012). Regulatory role of Arabidopsis pTAC14 in chloroplast development and plastid gene expression. Plant Signaling Behav. 7, 1354–1356. doi: 10.4161/psb.21618
Geelen, D., Lurin, C., Bouchez, D., Frachisse, J. M., Lelièvre, F., Courtial, B., et al. (2000). Disruption of putative anion channel gene AtCLC-a in Arabidopsis suggests a role in the regulation of nitrate content. Plant J. 21, 259–267. doi: 10.1046/j.1365-313x.2000.00680.x
Gehlenborg, N. (2019) UpSetR: A More Scalable Alternative to Venn and Euler Diagrams for Visualizing Intersecting Sets. Available online at: https://cran.r-project.org/package=UpSetR.
Gonzalez, N., Vanhaeren, H., Inzé, D. (2012). Leaf size control: Complex coordination of cell division and expansion. Trends Plant Sci. 17, 332–340. doi: 10.1016/j.tplants.2012.02.003
Goto, C., Ikegami, A., Goh, T., Maruyama, K., Kasahara, H., Takebayashi, Y., et al. (2023). Genetic interaction between Arabidopsis SUR2/CYP83B1 and GNOM indicates the importance of stabilizing local auxin accumulation in lateral root initiation. Plant Cell Physiol. 64, 1178–1188. doi: 10.1093/pcp/pcad084
Gregersen, P. L., Culetic, A., Boschian, L., Krupinska, K. (2013). Plant senescence and crop productivity. Plant Mol. Biol. 82, 603–622. doi: 10.1007/s11103-013-0013-8
Gu, Z., Eils, R., Schlesner, M. (2016). Complex heatmaps reveal patterns and correlations in multidimensional genomic data. Bioinformatics 32, 2847–2849. doi: 10.1093/bioinformatics/btw313
Gu, Z., Gu, L., Eils, R., Schlesner, M., Brors, B. (2014). Circlize implements and enhances circular visualization in R. Bioinformatics 30, 2811–2812. doi: 10.1093/bioinformatics/btu393
Guo, Y. (2018). Plant Senescence Vol. 1744. Ed. Guo, Y. (Springer Nature, Springer Science+Bussiness Media, Methods in Molecular Biology, Humana Press, New York, USA: Springer New York). doi: 10.1007/978-1-4939-7672-0
Guo, Y., Cai, Z., Gan, S. (2004). Transcriptome of Arabidopsis leaf senescence. Plant Cell Environ. 27, 521–549. doi: 10.1111/j.1365-3040.2003.01158.x
Hatzfeld, Y., Lee, S., Lee, M., Leustek, T., Saito, K. (2000). Functional characterization of a gene encoding a fourth ATP sulfurylase isoform from Arabidopsis thaliana. Gene 248, 51–58. doi: 10.1016/S0378-1119(00)00132-3
Heyneke, E., Watanabe, M., Erban, A., Duan, G., Buchner, P., Walther, D., et al. (2017). Characterization of the wheat leaf metabolome during grain filling and under varied N-supply. Front. Plant Sci. 8. doi: 10.3389/fpls.2017.02048
Heyneke, E., Watanabe, M., Erban, A., Duan, G., Buchner, P., Walther, D., et al. (2019). Effect of senescence phenotypes and nitrate availability on wheat leaf metabolome during grain filling. Agronomy 9, 1–24. doi: 10.3390/agronomy9060305
Hinckley, W. E., Brusslan, J. A. (2020). Gene expression changes occurring at bolting time are associated with leaf senescence in Arabidopsis. Plant Direct 4, 1–17. doi: 10.1002/pld3.279
Hoch, W. A., Zeldin, E. L., McCown, B. H. (2001). Physiological significance of anthocyanins during autumnal leaf senescence. Tree Physiol. 21, 1–8. doi: 10.1093/treephys/21.1.1
Horie, Y., Ito, H., Kusaba, M., Tanaka, R., Tanaka, A. (2009). Participation of chlorophyll b reductase in the initial step of the degradation of light-harvesting chlorophyll a/b-protein complexes in Arabidopsis. J. Biol. Chem. 284, 17449–17456. doi: 10.1074/jbc.M109.008912
Hörtensteiner, S. (2006). Chlorophyll degradation during senescence. Annu. Rev. Plant Biol. 57, 55–77. doi: 10.1146/annurev.arplant.57.032905.105212
Hsu, C. Y., Chou, M. L., Wei, W. C., Chung, Y. C., Loo, X. Y., Lin, L. F. (2022). Chloroplast Protein Tic55 Involved in Dark-Induced Senescence through AtbHLH/AtWRKY-ANAC003 Controlling Pathway of Arabidopsis thaliana. Genes 13, 1–23. doi: 10.3390/genes13020308
Huber, M., Magdalena M., J., Snoek, B. L., van Veen, H., Toulotte, J., Kumar, V., et al. (2021). Towards increased shading potential: a combined phenotypic and genetic analysis of rice shoot architecture. BioRxiv, 445664. doi: 10.1002/ppp3.10419. May, 2021.05.25.
Hye, R. W., Jin, H. K., Hong, G. N., Pyung, O. L. (2004). The delayed leaf senescence mutants of Arabidopsis, ore1, ore3, and ore9 are tolerant to oxidative stress. Plant Cell Physiol. 45, 923–932. doi: 10.1093/pcp/pch110
Ignatiadis, N., Huber, W. (2021). Covariate powered cross-weighted multiple testing. J. R. Stat. Society Ser. B: Stat. Method. 83, 720–751. doi: 10.1111/rssb.12411
Ignatiadis, N., Klaus, B., Zaugg, J. B., Huber, W. (2016). Data-driven hypothesis weighting increases detection power in genome-scale multiple testing. Nat. Methods 13, 577–580. doi: 10.1038/nmeth.3885
Ingham, D. J., Beer, S., Money, S., Hansen, G. (2001). Quantitative real-time PCR assay for determining transgene copy number in transformed plants. BioTechniques 31, 132–140. doi: 10.2144/01311rr04
Izawa, T. (2007). Adaptation of flowering-time by natural and artificial selection in Arabidopsis and rice. J. Exp. Bot. 58, 3091–3097. doi: 10.1093/jxb/erm159
Jobe, T. O., Yu, Q., Hauser, F., Xie, Q., Meng, Y., Maassen, T., et al. (2021). The SLIM1 transcription factor is required for arsenic resistance in Arabidopsis thaliana. FEBS Lett. 595, 1696–1707. doi: 10.1002/1873-3468.14096
Joshi, N. C., Meyer, A. J., Bangash, S. A. K., Zheng, Z., Leustek, T. (2019). Arabidopsis γ-glutamylcyclotransferase affects glutathione content and root system architecture during sulfur starvation. New Phytol. 221, 1387–1397. doi: 10.1111/nph.15466
Karimi, M., Inzé, D., Depicker, A. (2002). GATEWAY vectors for Agrobacterium-mediated plant.pdf. Trends Plant Sci. 7, 193–195. doi: 10.1016/S1360-1385(02)02251-3
Keohavong, P., Grant, S. G. (2004). “Molecular toxicology protocols,” in Molecular Toxicology Protocols. (New York, USA: Springer Protocols, Methods in Molecular Biology, Humana Press, Springer Science+Business Media, LLC) .doi: 10.1385/1592598404
Kim, H. J., Hong, S. H., Kim, Y. W., Lee, I. H., Jun, J. H., Phee, B. K., et al. (2014). Gene regulatory cascade of senescence-associated NAC transcription factors activated by ETHYLENE-INSENSITIVE2-mediated leaf senescence signalling in Arabidopsis. J. Exp. Bot. 65, 4023–4036. doi: 10.1093/jxb/eru112
Kim, H. U., Oostende, C., Basset, G. J. C., Browse, J. (2008). The AAE14 gene encodes the Arabidopsis o -succinylbenzoyl-CoA ligase that is essential for phylloquinone synthesis and photosystem-I function. Plant J. 54, 272–283. doi: 10.1111/j.1365-313X.2008.03416.x
Krapp, A. (2015). Plant nitrogen assimilation and its regulation: A complex puzzle with missing pieces. Curr. Opin. Plant Biol. 25, 115–122. doi: 10.1016/j.pbi.2015.05.010
Lee, J., Rennaker, C., Wrolstad, R. E. (2008). Correlation of two anthocyanin quantification methods: HPLC and spectrophotometric methods. Food Chem. 110, 782–786. doi: 10.1016/j.foodchem.2008.03.010
Lenzen, B., Rühle, T., Lehniger, M. K., Okuzaki, A., Labs, M., Muino, J. M., et al. (2020). The chloroplast rna binding protein cp31a has a preference for mrnas encoding the subunits of the chloroplast nad(P)h dehydrogenase complex and is required for their accumulation. Int. J. Mol. Sci. 21, 1–14. doi: 10.3390/ijms21165633
Li, H., Hu, B., Chu, C. (2017). Nitrogen use efficiency in crops: Lessons from Arabidopsis and rice. J. Exp. Bot. 68, 2477–2488. doi: 10.1093/jxb/erx101
Li, Z., Peng, J., Wen, X., Guo, H. (2012). Gene network analysis and functional studies of senescence-associated genes reveal novel regulators of Arabidopsis leaf senescence. J. Integr. Plant Biol. 54, 526–539. doi: 10.1111/j.1744-7909.2012.01136.x
Li, Z., Peng, J., Wen, X., Guo, H. (2013). ETHYLENE-INSENSITIVE3 is a senescence-associated gene that accelerates age-dependent leaf senescence by directly repressing miR164 transcription in Arabidopsis. Plant Cell 25, 3311–3328. doi: 10.1105/tpc.113.113340
Liang, Y., Kang, K., Gan, L., Ning, S., Xiong, J., Song, S., et al. (2019). Drought-responsive genes, late embryogenesis abundant group3 (LEA3) and vicinal oxygen chelate, function in lipid accumulation in Brassica napus and Arabidopsis mainly via enhancing photosynthetic efficiency and reducing ROS. Plant Biotechnol. J. 17, 2123–2142. doi: 10.1111/pbi.13127
Lichtenthaler, H. K. (2012). Biosynthesis, Localization and Concentration of Carotenoids in Plants and Algae.s. (Springer Dordrecht Heidelberg London New York: Springer, Springer Science+Business Media). doi: 10.1104/pp.19.01279
Lichtenthaler, H. K., Buschmann, C. (2001). Chlorophylls and carotenoids: measurement and characterization by UV-VIS spectroscopy. Curr. Protoc. Food Analytical Chem. 1, F4.3.1–F4.3.8. doi: 10.1002/0471142913.faf0403s01
Lisec, J., Schauer, N., Kopka, J., Willmitzer, L., Fernie, A. R. (2006). Gas chromatography mass spectrometry-based metabolite profiling in plants. Nat. Protoc. 1, 387–396. doi: 10.1038/nprot.2006.59
Liu, R., Jia, T., Cui, B., Song, J. (2020). The expression patterns and putative function of nitrate transporter 2.5 in plants. Plant Signaling Behav. 15, 1–10. doi: 10.1080/15592324.2020.1815980
Liu, X., Grabherr, H. M., Willmann, R., Kolb, D., Brunner, F., Bertsche, U., et al. (2014). Host-induced bacterial cell wall decomposition mediates pattern-triggered immunity in Arabidopsis. ELife 3, 1–24. doi: 10.7554/eLife.01990
Liu, Y., Shi, Z., Maximova, S. N., Payne, M. J., Guiltinan, M. J. (2015). Tc-MYBPA is an Arabidopsis TT2-like transcription factor and functions in the regulation of proanthocyanidin synthesis in Theobroma cacao. BMC Plant Biol. 15, 1–16. doi: 10.1186/s12870-015-0529-y
Liu, Y., Tikunov, Y., Schouten, R. E., Marcelis, L. F. M., Visser, R. G. F., Bovy, A. (2018). Anthocyanin biosynthesis and degradation mechanisms in Solanaceous vegetables: A review. Front. Chem. 6. doi: 10.3389/fchem.2018.00052
Love, M. I., Huber, W., Anders, S. (2014). Moderated estimation of fold change and dispersion for RNA-seq data with DESeq2. Genome Biol. 15, 1–21. doi: 10.1186/s13059-014-0550-8
Lozano-Sotomayor, P., Chávez Montes, R. A., Silvestre-Vañó, M., Herrera-Ubaldo, H., Greco, R., Pablo-Villa, J., et al. (2016). Altered expression of the bZIP transcription factor DRINK ME affects growth and reproductive development in Arabidopsis thaliana. Plant J. 88, 437–451. doi: 10.1111/tpj.13264
Luo, J., Havé, M., Clément, G., Tellier, F., Balliau, T., Launay-Avon, A., et al. (2021). Integrating multiple omics to identify common and specific molecular changes occurring in Arabidopsis under chronic nitrate and sulfate limitations. J. Exp. Bot. 71, 6471–6490. doi: 10.1093/jxb/eraa337
Mallikarjuna, B. P., Viswanatha, K. P., Samineni, S., Gaur, P. M. (2019). Association of flowering time with phenological and productivity traits in chickpea. Euphytica 215, 1–8. doi: 10.1007/s10681-019-2397-2
Maruyama-Nakashita, A., Nakamura, Y., Tohge, T., Saito, K., Takahashi, H. (2006). Arabidopsis SLIM1 is a central transcriptional regulator of plant sulfur response and metabolism. Plant Cell 18, 3235–3251. doi: 10.1105/tpc.106.046458
Masclaux, C. (2000). Characterization of the sink source transition in tobacco. Planta, 510–518. doi: 10.1007/s004250000310
Masclaux-Daubresse, C., Daniel-Vedele, F., Dechorgnat, J., Chardon, F., Gaufichon, L., Suzuki, A. (2010). Nitrogen uptake, assimilation and remobilization in plants: Challenges for sustainable and productive agriculture. Ann. Bot. 105, 1141–1157. doi: 10.1093/aob/mcq028
Motohashi, R., Rödiger, A., Agne, B., Baerenfaller, K., Baginsky, S. (2012). Common and specific protein accumulation patterns in different albino/pale-green mutants reveals regulon organization at the proteome level. Plant Physiol. 160, 2189–2201. doi: 10.1104/pp.112.204032
Mu, X., Luo, J. (2019). Evolutionary analyses of NIN-like proteins in plants and their roles in nitrate signaling. Cell. Mol. Life Sci. 76, 3753–3764. doi: 10.1007/s00018-019-03164-8
Okazaki, Y., Shimojima, M., Sawada, Y., Toyooka, K., Narisawa, T., Mochida, K., et al. (2009). A chloroplastic UDP-Glucose pyrophosphorylase from Arabidopsis is the committed enzyme for the first step of sulfolipid biosynthesis. Plant Cell 21, 892–909. doi: 10.1105/tpc.108.063925
Okuzaki, A., Rühle, T., Leister, D., Schmitz-Linneweber, C. (2021). The acidic domain of the chloroplast RNA-binding protein CP31A supports cold tolerance in Arabidopsis thaliana. J. Exp. Bot. 72, 4904–4914. doi: 10.1093/jxb/erab165
O’Malley, R. C., Huang, S.s. C., Song, L., Lewsey, M. G., Bartlett, A., Nery, J. R., et al. (2016). Erratum: cistrome and epicistrome features shape the regulatory DNA landscape (Cell, (2016) 165(5) (1280–1292)). Cell 166, 1598. doi: 10.1016/j.cell.2016.08.063
Parthasarathy, A., Adams, L. E., Savka, F. C., Hudson, A. O. (2019). The Arabidopsis thaliana gene annotated by the locus tag At3g08860 encodes alanine aminotransferase. Plant Direct 3, 1–10. doi: 10.1002/pld3.171
Perez de Souza, L., Alseekh, S., Naake, T., Fernie, A. (2019). Mass spectrometry-based untargeted plant metabolomics. Curr. Protoc. Plant Biol. 4, e20100. doi: 10.1002/cppb.20100
Perez de Souza, L., Alseekh, S., Scossa, F., Fernie, A. R. (2021). Ultra-high-performance liquid chromatography high-resolution mass spectrometry variants for metabolomics research. Nat. Methods 18, 733–746. doi: 10.1038/s41592-021-01116-4
Piotrowska, J., Jodoi, Y., Trang, N. H., Wawrzynska, A., Takahashi, H., Sirko, A., et al. (2022). The C-terminal region of SLIM1 transcription factor is required for sulfur deficiency response. Plants 11, 1–11. doi: 10.3390/plants11192595
Pole, A., Dimri, M., P. Dimri, G. (2016). Oxidative stress, cellular senescence and ageing. AIMS Mol. Sci. 3, 300–324. doi: 10.3934/molsci.2016.3.300
Rakpenthai, A., Apodiakou, A., Whitcomb, S. J., Hoefgen, R. (2022). In silico analysis of cis -elements and identification of transcription factors putatively involved in the regulation of the OAS cluster genes SDI1 and SDI2. Plant J. 110, 1286–1304. doi: 10.1111/tpj.15735
Ran, X., Zhao, F., Wang, Y., Liu, J., Zhuang, Y., Ye, L., et al. (2020). Plant Regulomics: a data-driven interface for retrieving upstream regulators from plant multi-omics data. Plant J. 101, 237–248. doi: 10.1111/tpj.14526
Rissler, H. M., Collakova, E., DellaPenna, D., Whelan, J., Pogson, B. J. (2002). Chrophyll biosynthesis. Expression of a second Chl I gene of magnesium chelatase in Arabidopsis supports only limited chlorophyll synthesis. Plant Physiol. 128, 770–779. doi: 10.1104/pp.010625
Rouhier, N., Cerveau, D., Couturier, J., Reichheld, J. P., Rey, P. (2015). Involvement of thiol-based mechanisms in plant development. Biochim. Biophys. Acta - Gen. Subj. 1850, 1479–1496. doi: 10.1016/j.bbagen.2015.01.023
Sakuraba, Y., Lee, S. H., Kim, Y. S., Park, O. K., Hörtensteiner, S., Paek, N. C. (2014). Delayed degradation of chlorophylls and photosynthetic proteins in Arabidopsis autophagy mutants during stress-induced leaf yellowing. J. Exp. Bot. 65, 3915–3925. doi: 10.1093/jxb/eru008
Sawchuk, M. G., Donner, T. J., Head, P., Scarpella, E. (2008). Unique and overlapping expression patterns among members of photosynthesis-associated nuclear gene families in Arabidopsis. Plant Physiol. 148, 1908–1924. doi: 10.1104/pp.108.126946
Song, S., Huang, H., Wang, J., Liu, B., Qi, T., Xie, D. (2017). MYC5 is involved in jasmonate-regulated plant growth, leaf senescence and defense responses. Plant Cell Physiol. 58, 1752–1763. doi: 10.1093/pcp/pcx112
Stephens, M., Carbonetto, P., Gerard, D., Lu, M., Sun, L., Willwerscheid, J., et al. (2022) ashr: Methods for Adaptive Shrinkage, using Empirical Bayes. Available online at: https://cran.r-project.org/package=ashr.
Tamary, E., Nevo, R., Naveh, L., Levin-Zaidman, S., Kiss, V., Savidor, A., et al. (2019). Chlorophyll catabolism precedes changes in chloroplast structure and proteome during leaf senescence. Plant Direct 3, 1–18. doi: 10.1002/pld3.127
Tenenbaum, D., Maintainer, B. P. (2023). KEGGREST: Client-side REST access to the Kyoto Encyclopedia of Genes and Genomes (KEGG). (Biocunductor). doi: 10.18129/B9.bioc.KEGGREST
Thomas, H. (2013). Senescence, ageing and death of the whole plant. New Phytol. 197, 696–711. doi: 10.1111/nph.12047
Tohge, T., De Souza, L. P., Fernie, A. R. (2017). Current understanding of the pathways of flavonoid biosynthesis in model and crop plants. J. Exp. Bot. 68, 4013–4028. doi: 10.1093/jxb/erx177
Tohge, T., Nishiyama, Y., Hirai, M. Y., Yano, M., Nakajima, J. I., Awazuhara, M., et al. (2005). Functional genomics by integrated analysis of metabolome and transcriptome of Arabidopsis plants over-expressing an MYB transcription factor. Plant J. 42, 218–235. doi: 10.1111/j.1365-313X.2005.02371.x
Van Der Graaff, E., Schwacke, R., Schneider, A., Desimone, M., Flügge, U. I., Kunze, R. (2006). Transcription analysis of arabidopsis membrane transporters and hormone pathways during developmental and induced leaf senescence. Plant Physiol. 141, 776–792. doi: 10.1104/pp.106.079293
Vercruysse, J., Baekelandt, A., Gonzalez, N., Inzé, D. (2021). Molecular networks regulating cell division during Arabidopsis leaf growth. J. Exp. Bot. 71, 2365–2378. doi: 10.1093/jxb/erz522
Wang, J., Zhou, L., Shi, H., Chern, M., Yu, H., Yi, H., et al. (2018). A single transcription factor promotes both yield and immunity in rice. Science 361, 1026–1028. doi: 10.1126/science.aat7675
Wang, W., Hu, B., Yuan, D., Liu, Y., Che, R., Hu, Y., et al. (2018). Expression of the nitrate transporter gene OsNRT1.1A/ OsNPF6.3 confers high yield and early maturation in rice. Plant Cell 30, 638–651. doi: 10.1105/tpc.17.00809
Watanabe, M., Mochida, K., Kato, T., Tabata, S., Yoshimoto, N., Noji, M., et al. (2008). Comparative genomics and reverse genetics analysis reveal indispensable functions of the serine acetyltransferase gene family in Arabidopsis. Plant Cell. 20, 2484–2496. doi: 10.1105/tpc.108.060335
Watanabe, M., Balazadeh, S., Tohge, T., Erban, A., Giavalisco, P., Kopka, J., et al. (2013). Comprehensive dissection of spatiotemporal metabolic shifts in primary, secondary, and lipid metabolism during developmental senescence in Arabidopsis. Plant Physiol. 162, 1290–1310. doi: 10.1104/pp.113.217380
Wawrzyńska, A., Sirko, A. (2014). To control and to be controlled: understanding the Arabidopsis SLIM1 function in sulfur deficiency through comprehensive investigation of the EIL protein family. Front. Plant Sci. 5. doi: 10.3389/fpls.2014.00575
Wawrzyńska, A., Sirko, A. (2016). EIN3 interferes with the sulfur deficiency signaling in Arabidopsis thaliana through direct interaction with the SLIM1 transcription factor. Plant Sci. 253, 50–57. doi: 10.1016/j.plantsci.2016.09.002
Wawrzyńska, A., Piotrowska, J., Apodiakou, A., Brückner, F., Hoefgen, R., Sirko, A. (2022). The SLIM1 transcription factor affects sugar signaling during sulfur deficiency in Arabidopsis. J. Exp. Bot. 73, 7362–7379. doi: 10.1093/jxb/erac371
Weraduwage, S. M., Chen, J., Anozie, F. C., Morales, A., Weise, S. E., Sharkey, T. D. (2015). The relationship between leaf area growth and biomass accumulation in Arabidopsis thaliana. Front. Plant Sci. 6. doi: 10.3389/fpls.2015.00167
Wickham, H. (2016). “ggplot2: Elegant Graphics for Data Analysis,” in Media (Springer Nature, Springer International Publishing AG Switzerland: Springer-Verlag New York), 35. Available at: http://link.springer.com/10.1007/978-0-387-98141-3. doi: 10.1007/978-3-319-24277-4
Wu, T., Hu, E., Xu, S., Chen, M., Guo, P., Dai, Z., et al. (2021). clusterProfiler 4.0: A universal enrichment tool for interpreting omics data. Innovation 2, 100141. doi: 10.1016/j.xinn.2021.100141
Wu, X. Y., Kuai, B. K., Jia, J. Z., Jing, H. C. (2012). Regulation of leaf senescence and crop genetic improvement. J. Integr. Plant Biol. 54, 936–952. doi: 10.1111/jipb.12005
Xie, Y., Zhao, Y., Tan, H., Chen, Q., Huang, J. (2017). An ubiquitin-like protein SDE2 negatively affects sucrose-induced anthocyanin biosynthesis in Arabidopsis. Sci. Bull. 62, 1585–1592. doi: 10.1016/j.scib.2017.11.014
Yamaguchi, C., Khamsalath, S., Takimoto, Y., Suyama, A., Mori, Y., Ohkama-Ohtsu, N., et al. (2020). SLIM1 transcription factor promotes sulfate uptake and distribution to shoot, along with phytochelatin accumulation, under cadmium stress in arabidopsis Thaliana. Plants 9, 1–16. doi: 10.3390/plants9020163
Yan, T., Yoo, D., Berardini, T. Z., Mueller, L. A., Weems, D. C., Weng, S., et al. (2005). PatMatch: A program for finding patterns in peptide and nucleotide sequences. Nucleic Acids Res. 33, 262–266. doi: 10.1093/nar/gki368
Yu, Q., Lutz, K. A., Maliga, P. (2017). Efficient plastid transformation in Arabidopsis. Plant Physiol. 175, 186–193. doi: 10.1104/pp.17.00857
Zhu, Z., Wang, H., Wang, Y., Guan, S., Wang, F., Tang, J., et al. (2015). Characterization of the cis elements in the proximal promoter regions of the anthocyanin pathway genes reveals a common regulatory logic that governs pathway regulation. J. Exp. Bot. 66, 3775–3789. doi: 10.1093/jxb/erv173
Keywords: Sulfur Limitation 1 (SLIM1), AT1G73730, transcription factor, leaf-size, senescence-associated genes, photosynthesis-associated genes, Arabidopsis thaliana, nitrate
Citation: Apodiakou A, Alseekh S, Hoefgen R and Whitcomb SJ (2024) Overexpression of SLIM1 transcription factor accelerates vegetative development in Arabidopsis thaliana. Front. Plant Sci. 15:1327152. doi: 10.3389/fpls.2024.1327152
Received: 24 October 2023; Accepted: 01 March 2024;
Published: 20 March 2024.
Edited by:
Juan José Ripoll, University of California, San Diego, United StatesReviewed by:
Mingyuan Zhu, Duke University, United StatesPrabu Gnanasekaran, Washington State University, United States
Cristina Navarro, Spanish National Research Council (CSIC), Spain
Copyright © 2024 Apodiakou, Alseekh, Hoefgen and Whitcomb. This is an open-access article distributed under the terms of the Creative Commons Attribution License (CC BY). The use, distribution or reproduction in other forums is permitted, provided the original author(s) and the copyright owner(s) are credited and that the original publication in this journal is cited, in accordance with accepted academic practice. No use, distribution or reproduction is permitted which does not comply with these terms.
*Correspondence: Sarah J. Whitcomb, sarah.whitcomb@usda.gov