 Jingyao Ping
 Jing Hao1
 Ting Wang
 Yingjuan Su
- 1School of Life Sciences, Sun Yat-Sen University, Guangzhou, China
- 2College of Life Sciences, South China Agricultural University, Guangzhou, China
- 3Research Institute of Sun Yat-Sen University, Shenzhen, China
The Annonaceae stands as the most species rich family in the Magnoliales, a basal group of angiosperms. Widely distributed in tropical and subtropical regions, it holds significant ecological and economic value. The plastid genome (plastome) is often employed in studies related to plant phylogenetics, comparative genomics, evolutionary biology, and genetic engineering. Nonetheless, research progress on plastid genomics in the Annonaceae has been relatively slow. In this study, we analyzed the structure and repetitive sequence features of plastomes from 28 Annonaceae species. Among them, Mitrephora tomentosa and Desmos chinensis were newly sequenced, with sizes of 160,157 bp and 192,167 bp, and GC contents of 38.3% and 38.4%, respectively. The plastome size in the Annonaceae ranged from 158,837 bp to 202,703 bp, with inverted repeat (IR) region sizes ranging from 64,621 bp to 25,861 bp. Species exhibiting expansion in the IR region showed an increase in plastome size and gene number, frequent boundary changes, different expansion modes (bidirectional or unidirectional), and an increase in repetitive sequences. Specifically, a large number of dispersed repetitive sequences lead to an increase in the size of the LSC region in Goniothalamus tamirensis. Phylogenetic analysis revealed Annonoideae and Malmeoideae as monophyletic groups and sister clades, with Cananga odorata outside of them, followed by Anaxagorea javanica. This research uncovers the structural variation characteristics of plastomes in the Annonaceae, providing valuable information for understanding the phylogeny and plastome evolution of Annonaceae.
1 Introduction
Plastids are organelles responsible for photosynthesis in plants and some protists, possessing their own independent genome known as the plastid genome (plastome). They consist of three parts: the large single-copy (LSC) region, the small single-copy (SSC) region, and the inverted repeat (IR) region (Mower and Vickrey, 2018). In recent years, plastomes have been increasingly utilized in phylogenetic evolution studies. Compared to the nuclear genome, plastomes have a smaller genome size, larger copy number, and are easier to obtain. The development of sequencing technologies has greatly facilitated research in plastid genomics, making it easier to obtain complete plastomes and providing more information (Tonti-Filippini et al., 2017). It has been observed that plastome evolution is often accompanied by gene loss or pseudogenization (Chaw et al., 2018), inversion of sequence fragments (Chaw et al., 2018), or expansion and contraction of IR regions (Zhu et al., 2016; Mower and Vickrey, 2018). By comparing features such as genome size, gene content, boundary shift, and structural rearrangement, new insights can be gained for phylogenetic studies and provide rich information for understanding the evolution process of plastomes (Lian et al., 2022). Therefore, studying plastomes is of great significance for revealing phylogenetic relationships between species, conserving and utilizing germplasm resources, as well as improving varieties.
Annonaceae is the largest pantropical family of trees and lianas in the early-divergent order Magnoliales among angiosperms, consisting of 107 genera and approximately 2,300 species. It is divided into four subfamilies: Anaxagoreoideae, Ambavioideae, Malmeoideae, and Annonoideae. Among them, Annonoideae is further divided into 6 tribes: Uvarieae, Monodoreae, Guatterieae, Duguetieae, Bocageeae, Annoneae, and Xylopieae. Malmeoideae is divided into 8 tribes: Dendrokingstonieae, Fenerivieae, Maasieae, Malmeeae, Miliuseae, Monocarpieae, Piptostigmateae, and Phoenicantheae (Chatrou et al., 2012; Guo et al., 2017). The family is widely distributed in tropical and subtropical regions and serves as a significant component of lowland tropical rainforest ecosystems (Punyasena et al., 2008). Moreover, it represents an important source of high-quality fruits, timber, aromatic essential oils, and valuable medicinal materials, possessing both ecological and economic value. In China, the Annonaceae is represented by 24 genera and 120 species, of which 41 species and one variety are endemic to China. It primarily grows in regions south of the Yangtze River (Li and Gilbert, 2011). Additionally, two species are listed as key protected wild plants at the national level (https://www.iplant.cn/rep/protlist). The functional value of Annonaceae varies among genera and species, and a systematic classification study of this family serves as the foundation for functional development. However, the remarkable diversity of Annonaceae has also posed great challenges and controversies in its phylogenetic research. For example, there are controversies regarding the relationships within certain branches and genera, including the Meiogyne-Fitzalania Clade (Thomas et al., 2012), Desmopsis-Stenanona Clade (Ortiz-Rodriguez et al., 2018), Friesodielsia (Saunders et al., 2020), and Polyalthia (Chaowasku et al., 2018; Xue et al., 2021), among others. The development of sequencing technology has greatly advanced research in platid genomics. Recently, Gan et al. (2022) published the plastome of Miliusa glochidioides Hand.-Mazz. Ping et al. (2023) published the plastome of the Trivalvaria costata (J. D. Hooker and Thomson) I. M. Turner and discovered variations in the IR region among different species of the Annonaceae.
In order to understand and supplement the plastome characteristics of additional Annonaceae species, we have sequenced Mitrephora tomentosa Hook. f. & Thomson and Desmos chinensis Lour. These two species represent the first within their respective genera to have their plastomes sequenced. Mitrephora tomentosa is a deciduous tree with bark that is black to deep gray-black in color and emits a slightly sweet fragrance. This species is distributed in Guangdong, Hainan, and southern Yunnan in China, as well as in Southeast Asia. Its wood is hard and is often utilized for constructing vehicles and buildings. In addition, it is a popular ornamental plant in tropical areas. Desmos chinensis is an erect or climbing shrub found predominantly in Guangdong, Guangxi, Yunnan, and Guizhou in China. Its roots and leaves have medicinal properties, and the stem bark fiber can be used as a substitute for cotton and as a raw material for papermaking (Li and Gilbert, 2011). Furthermore, in this study, we additionally selected 26 publicly available plastomes of Annonaceae from the NCBI database (https://www.ncbi.nlm.nih.gov) for the following analyses: 1) Construction of a phylogenetic tree based on concatenated datasets of conserved protein-coding genes. 2) Structural comparisons, including border shifts and variations in the IR regions. 3) Distribution patterns of repetitive sequences.
2 Materials and methods
2.1 Sampling and sequencing
The fresh leaves of Mitrephora tomentosa and Desmos chinensis were collected from the South China Botanical Garden, Chinese Academy of Sciences (coordinates: E113°36.9’, N23°18.1’, and E113°36.4’, N23°18.5’), and stored at -80°C. The total DNA was extracted using the E.Z.N. A.® Plant DNA kit (OMEGA, USA), and the DNA was fragmented using a Covaris M220 instrument. After purification, TruSeq™ RNA sample Prep Kit was used to construct the sequencing library. Paired-end sequencing was performed on the Illumina NovaSeq6000 platform with a read length of 150 bp. The raw data were filtered using Cutadapt v1.16 software (Martin, 2011), followed by assembly using GetOrganelle V1.7.7.0 software (Jin et al., 2020) with the seed set as gi|12394|emb|V00171.1| Zea mays chloroplast gene for the large subunit of RUBP (ribulose bisphosphate carboxylase), and the database utilized was embplant_pt. The genome was annotated using PGA (Qu et al., 2019) and Geseq (https://chlorobox.mpimp-golm.mpg.de/geseq.html) web-based programs (Tillich et al., 2017), and the sequence was deposited in the NCBI database (https://www.ncbi.nlm.nih.gov), accession numbers: OQ682535 and OQ687053. The plastome map was drawn online using OGDRAW software (https://chlorobox.mpimp-golm.mpg.de/OGDraw.html) (Greiner et al., 2019).
2.2 Sequence data and construction of phylogenetic trees
We downloaded 26 additional plastome sequences from the Annonaceae and two species from the Magnoliaceae (as outgroups) from the NCBI database (https://www.ncbi.nlm.nih.gov). The plastome annotation was corrected using the online website GeSeq. In addition to two newly sequenced species, a total of 28 species from the Annonaceae, covering 21 genera, were selected for analysis. Shared protein-coding genes (PCGs) were extracted by importing the sequences into Geneious Prime 2022.0.1 (Kearse et al., 2012), and a concatenated dataset was constructed after alignment. We utilized MEGA X software (Kumar et al., 2018) to predict the best model (GTR+G+I) and construct neighbor-joining (NJ) trees with 1000 bootstrap replications. Additionally, we constructed maximum-parsimony (MP), maximum-likelihood (ML), and Bayesian-inference (BI) trees using PAUP 4.0 software (Swofford, 2002), RaxML 8.0.20 software (Stamatakis, 2014) with GTRGAMMAI model and 1000 bootstrap replicates, and Mrbayes v3.2.0 software (Huelsenbeck and Ronquist, 2001) with 1,000,000 generations (Nst = 6, rates = invgamma), respectively.
2.3 Structural and repeat sequence analysis
The global alignment of plastomes was conducted using the Mauve module in Geneious prime 2022.0.1. We extracted each sequence (with the IRa region removed) and aligned them to have the same starting position (trnH-GUG), while maintaining consistent transcriptional orientation at the starting position. Due to the arbitrary orientation of the SSC region in several species, we manually adjusted the SSC region to place ndhF at the end of the sequence. The gene information on the boundaries of the junction sites of the plastome was visualized using IRscope (https://irscope.shinyapps.io/irapp/) (Amiryousefi et al., 2018). The gene information within the inverted repeat regions was re-annotated and manually aligned.
The MISA (Microsatellite Identification Tool) (Beier et al., 2017) online website was used to predict simple sequence repeats (SSRs) (https://webblast.ipk-gatersleben.de/misa/), with minimal iterations of ten repeat motifs for mononucleotides, six for dinucleotide repeats, and five for tri-, tetra-, penta- and hexa-nucleotides. When the distance between two SSRs was less than 100 bp, they were considered as compound SSRs. Tandem repeat sequences (TRSs) were identified using the online software Tandem Repeats Finder v4.09 (TRF) (http://tandem.bu.edu/trf/trf.html) (Benson, 1999). Default parameters were used in the advanced module, with match, mismatch, and gap parameters set to 2, 7, and 7, respectively. The minimum alignment score was set to 50, the maximum period size was set to 500, and the maximum tandem repeat array size (in bp, millions) was set to 2. The online tool REPuter (http://bibiserv.techfak.uni-bielefeld.de/reputer) (Kurtz and Schleiermacher, 1999) was used to search for dispersed repeat sequences (DRSs) of forward (F) and palindromic (P) in plastomes. The parameters were set as follows: a Hamming distance of 3, a maximum of 500 computed repeats, and a minimal repeat size of 60. There are more DRSs observed in A. atemoya, with a maximum of 600 computational repetitions being set. The statistical analysis of the parameters was performed using IBM SPSS v22.0.
3 Results
3.1 Structural features of plastomes
The two newly sequenced species, Mitrephora tomentosa and Desmos chinensis, belong to Malmeoideae and Annonoideae, respectively. The plastome size for Mitrephora tomentosa is 160,157 bp, with a GC content of 38.3%, while for Desmos chinensis, it is 192,167 bp with a GC content of 38.4%. In Mitrephora tomentosa, LSC, SSC, and IR regions have sizes of 88,749 bp (37.6%), 19,452 bp (34.2%), and 25,978 bp (43.3%), respectively, and the whole plastome contains 84 PCGs, 37 tRNA genes, and 8 rRNA genes. Among them, there are 5 PCGs, 7 tRNAs, and 4 rRNA with duplicate copies (Figure 1A, Supplementary Table S1). In Desmos chinensis, the LSC, SSC, and IR regions have sizes of 83,995 bp (37.3%), 3,638 bp (28.5%), and 52,267 bp (39.5%), respectively, and the whole plastome encodes 105 PCGs, 38 tRNA genes, and 8 rRNA genes. Among them, there are 26 PCGs, 8 tRNAs, and 4 rRNA with duplicate copies (Figure 1B, Supplementary Table S1).
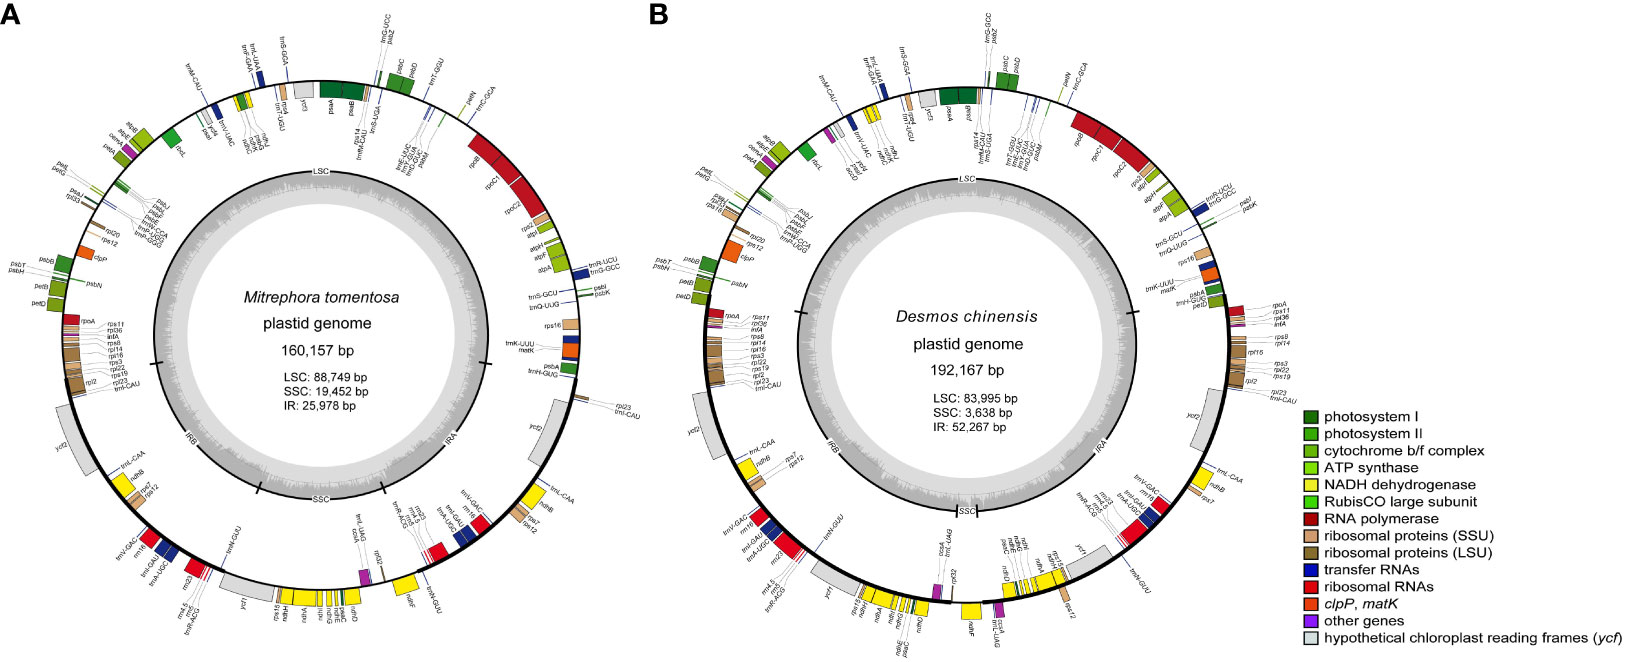
Figure 1 The plastome map of the newly sequenced species. (A) Mitrephora tomentosa. (B) Desmos chinensis. Different colored blocks on the genome represent different genes.
The selected 28 plastomes in the Annonaceae had a size range of 158,837 bp (Stelechocarpus burahol (Blume) Hook. f. & Thomson) to 202,703 bp (Annona atemoya Mabb.), with a GC content range of 38.4% (Desmos chinensis) to 39.9% (Annona reticulata L. and Annona montana Macf.). The size ranges of LSC, SSC, and IR were 69,649 bp (Annona squamosa L.) to 90,803 bp (Artabotrys hexapetalus (Linn. f.) Bhandari), 2,948 bp (Rollinia mucosa (Jacq.) Baill.) to 20,310 bp (Cananga odorata (Lamk.) Hook. f. & Thomson), and 64,621 bp (Annona reticulata) to 25,861 bp (Alphonsea hainanensis Merr. et Chun), respectively. In addition, the GC content of the LSC (37.3% ~ 38.3%) and SSC (28.5% ~ 35.1%) regions in all species is lower than that of the IR region (39.5% ~ 43.5%). The number of encoded genes ranged from 165 to 129, with PCGs and tRNA genes ranging from 117 to 84 and 40 to 37, respectively, and all species contained eight rRNA genes (Table 1). Among them, there are 5 to 37 PCGs and 7 to 10 tRNAs with duplicate copies (Supplementary Table S1). At the subfamily level, there is a significant difference in the size distribution of the plastomes among four taxa groups (independent samples Kruskal-Wallis test, p < 0.05). In pairwise comparisons, Malmeoideae showed significant differences with Annonoideae (Supplementary Table S2).
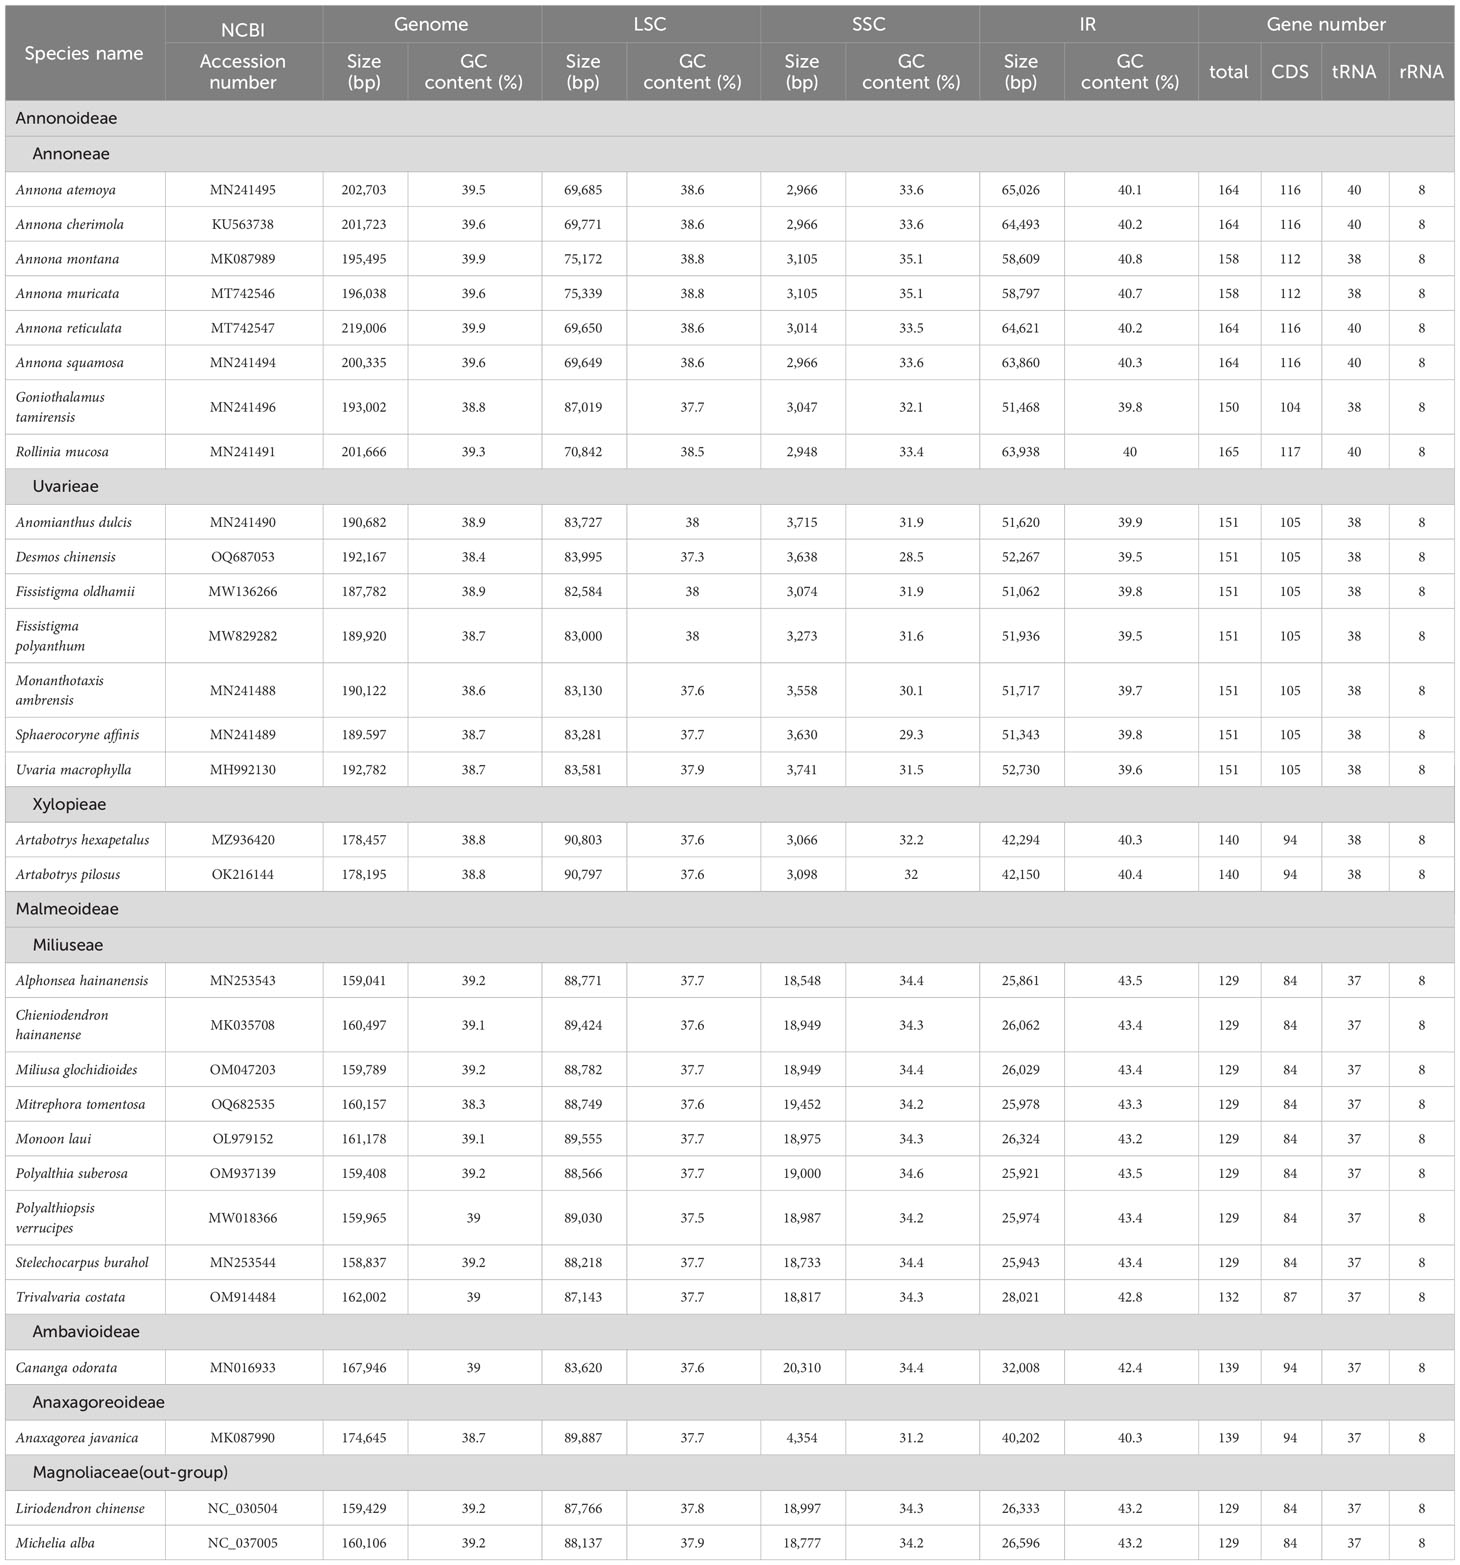
Table 1 Plastid genome information of sampled species.
3.2 Phylogenetic relationship of Annonaceae
Using Michelia alba DC. and Liriodendron chinense (Hemsl.) Sargent. as outgroups, four phylogenetic trees were constructed based on 75 shared PCGs (60,256 bases) and four methods. The results indicate that, except for the Malmeoideae clade in the NJ tree showing a paraphyletic branch, the topologies of the other three trees are completely consistent (Figure 2). Annonoideae and Malmeoideae as monophyletic groups and sister clades, with Cananga odorata (Ambavioideae) outside of them, followed by Anaxagorea javanica Blume (Anaxagoreoideae). Within the subfamily of Annonoideae, the Xylopieae (Artabotrys hexapetalus + Artabotrys pilosus) are sister to the Annoneae + Uvarieae. The BI tree showed very high branch support, with only two branches having a posterior probability of less than 1. The ML tree had relatively lower branch support, mainly within the Malmeoideae.
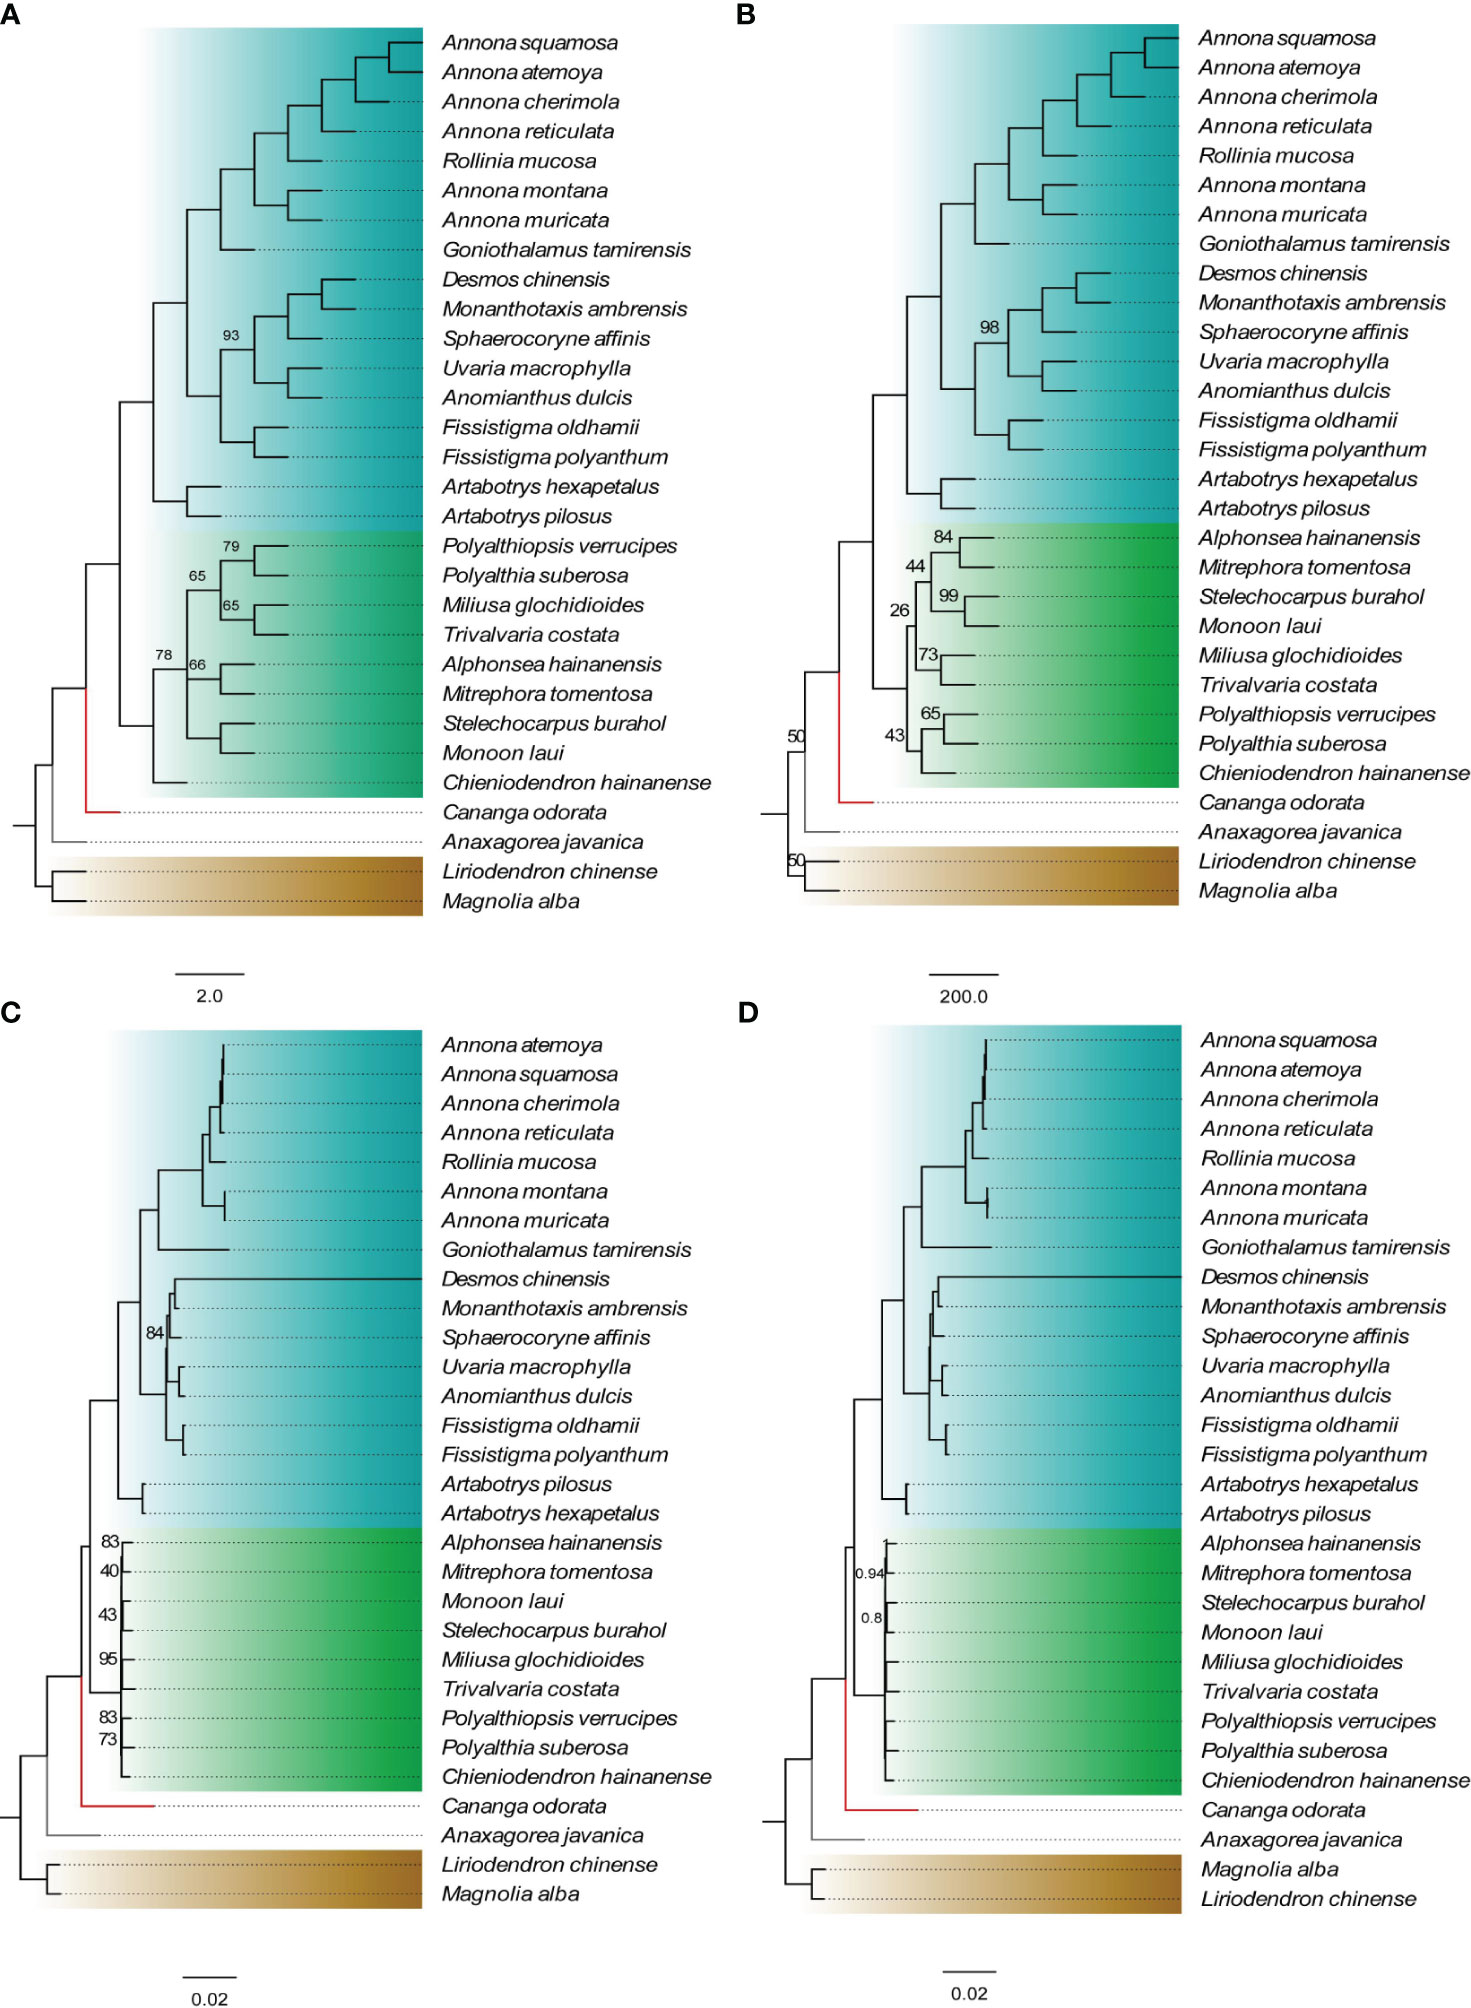
Figure 2 Phylogenetic relationships of Annonaceae based on concatenated data sets of shared protein-coding genes. (A) NJ tree. (B) MP tree. (C) ML tree. (D) BI tree. The numbers on branches indicate support values for the respective branches, while the remaining branches have support values of 100 (for A–C) or 1 (for D). The different colors in the figure represent four subfamilies: blue for Annonoideae, green for Malmeoideae, red branch for Ambavioideae, and gray branch for Anaxagoreoideae.
3.3 Structural rearrangement and boundary shift of plastomes
The Mauve alignment showed that there are 7 collinear blocks in Annonoideae. In comparison to other species, an inversion occurred between trnV-GAC and ndhB (about 5.9 kb) in Goniothalamus tamirensis Pierre ex Finet & Gagnep., while another inversion was identified in the trnI-CAU-ycf2-trnL-CAA (about 9 kb) region in Annona montana and Annona muricata L. In Malmeoideae, there are 5 collinear blocks, and the entire IR region of Chieniodendron hainanense (Merr.) Tsiang et P. T. Li is reversed compared to other species. There are 7 collinear blocks among representative species from the four subfamilies (Figure 3C). In Cananga odorata, the psbJ ~ 5’-rps12 (about 6 kb) fragment underwent inversion, while the ycf4 ~ atpE (8.5 kb) fragment underwent inversion in Anaxagorea javanica.
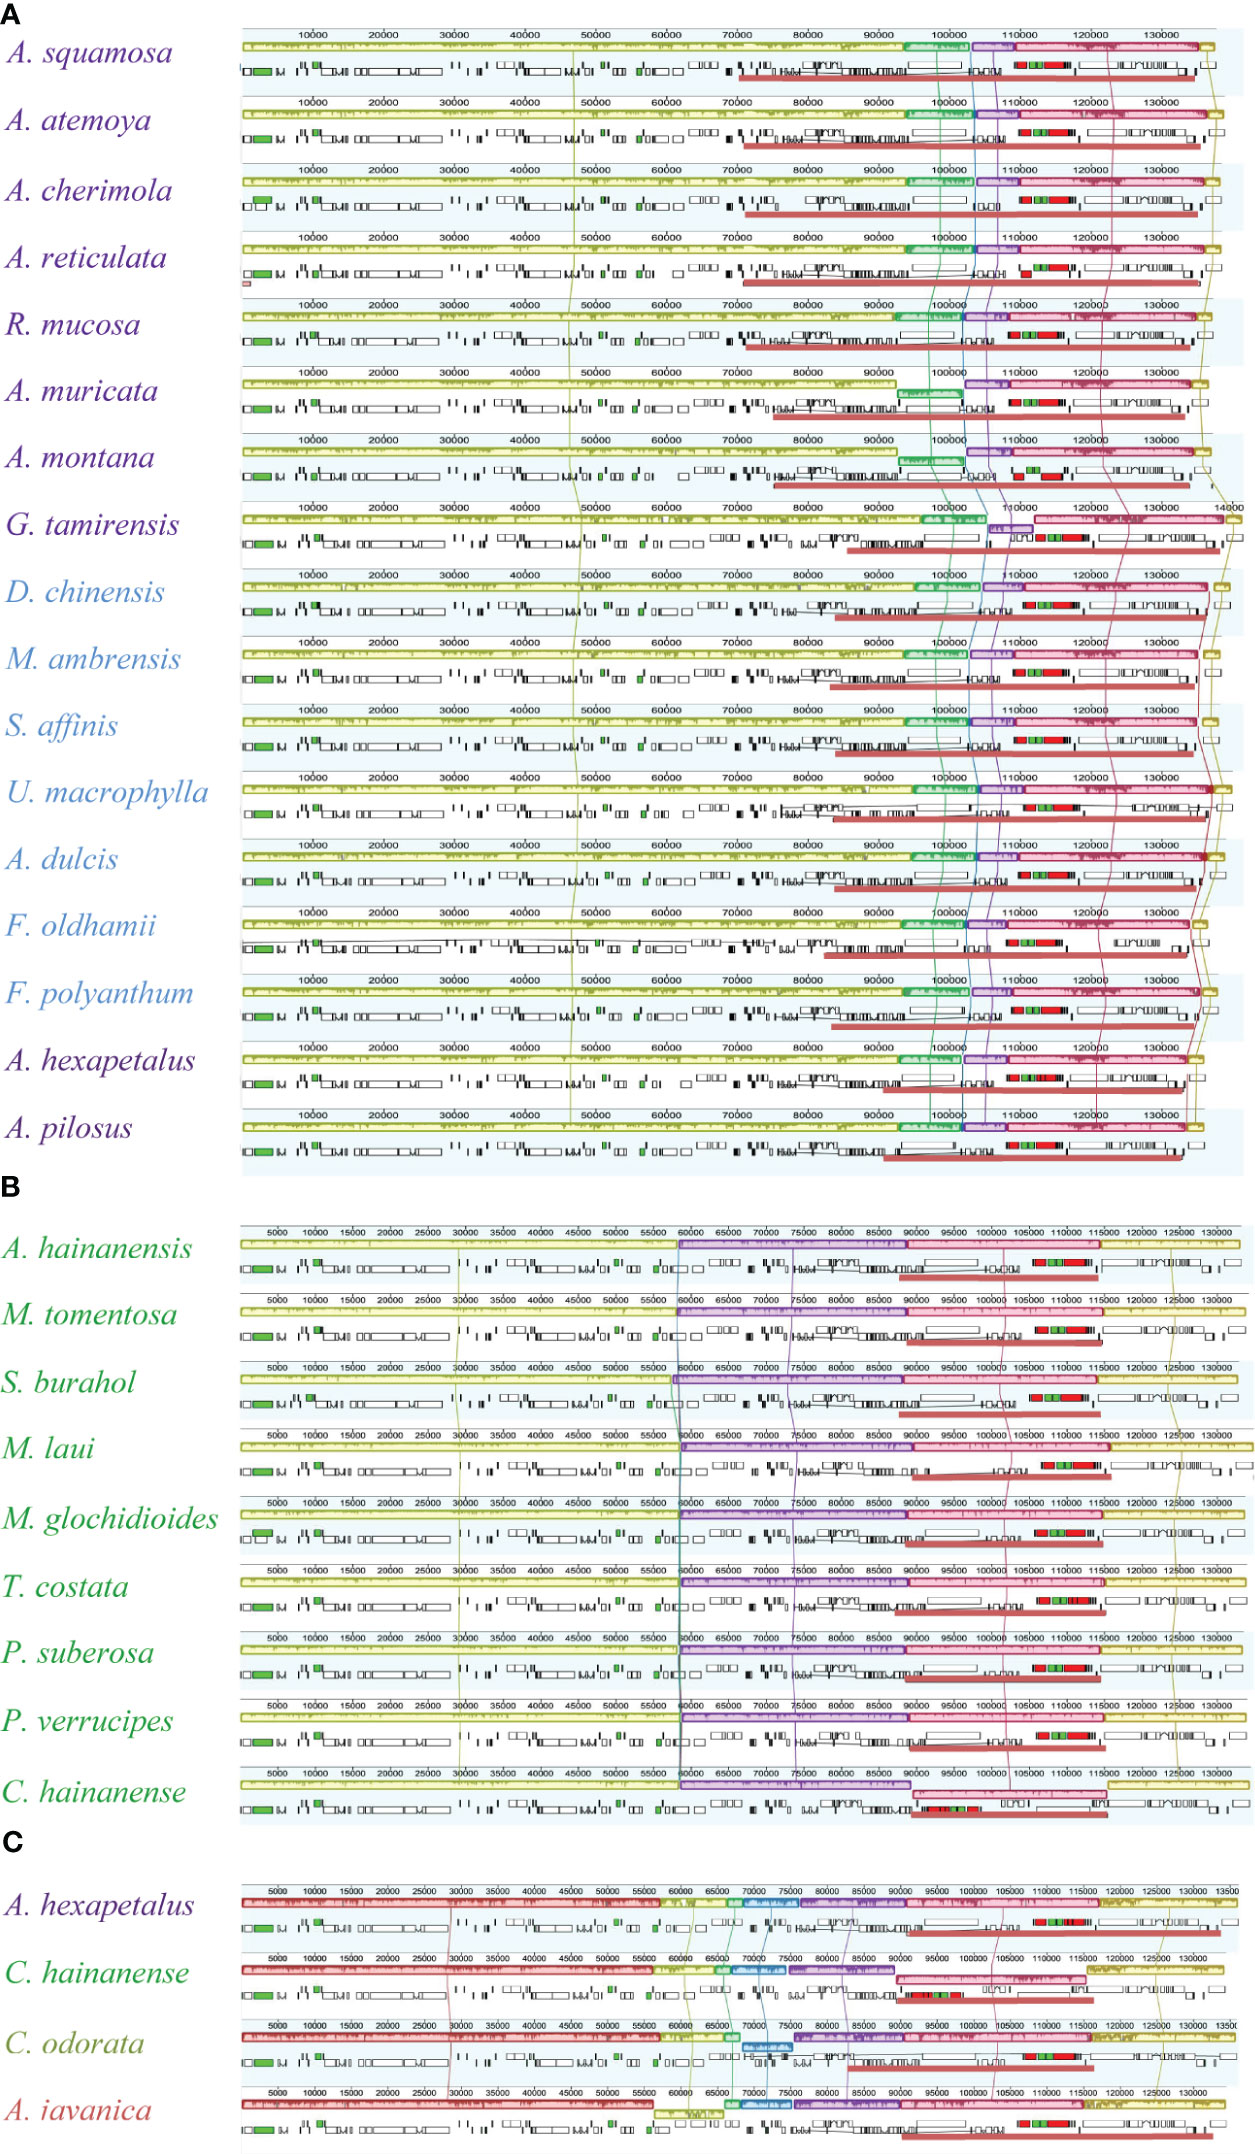
Figure 3 Global alignment of plastomes. (A) Alignment of Annonoideae species. (B) Alignment of Malmeoideae species. (C) Alignment among the four subfamilies.
The genes located at the boundaries between the IR and SC regions vary with the changes (expansion) of the IR region (Figure 4). In the Annonoideae, the IR region has expanded to include all genes typically found within the SSC except rpl32 and ndhF. In Annona squamosa, Annona atemoya, Annona cherimola Mill., Rollinia mucosa, Uvaria macrophylla Roxb., Anomianthus dulcis (Dunal) J. Sinclair, and Fissistigma polyanthum (Hook. f. et Thoms.) Merr., a partial sequence of ndhF is located in the IR region. In Desmos chinensis, Monanthotaxis ambrensis (Cavaco & Keraudren) Verdc., Sphaerocoryne affinis (Boerl.) Ridl., and Fissistigma oldhamii (Hemsl.) Merr., a partial sequence of rpl32 is located in the IR region. In Malmeoideae, the genes adjacent to the boundary between the SSC and IR regions are ndhF and ycf1, with consistent orientation, and trnH is located at the LSC/IRa boundary. Except for Chieniodendron hainanense and Mitrephora tomentosa, the ycf1 of other species all spans the IRb/SSC boundary. The gene types at the boundary between the IR region and the SSC region in Chieniodendron hainanense is opposite to those in other Malmeoideae species (except Trivalvaria costata). In Trivalvaria costata, rps16 spans the LSC/IRb boundary. In Cananga odorata (Ambavioideae), the LSC/IRb boundary is the same as in Goniothalamus tamirensis, where a partial sequence of the petD is located at the IR region. The neighboring genes at the boundary between the SSC and IR regions are the same as in Malmeoideae, which are ndhF and ycf1. However, ycf1 is entirely located at the SSC region. In Anaxagorea javanica (Anaxagoreoideae), rps19 and ndhF span the LSC/IRb boundary and SSC/IRa boundary, respectively. trnL and ccsA are located at the SSC/IRa boundary and IR/SSC boundary, respectively.
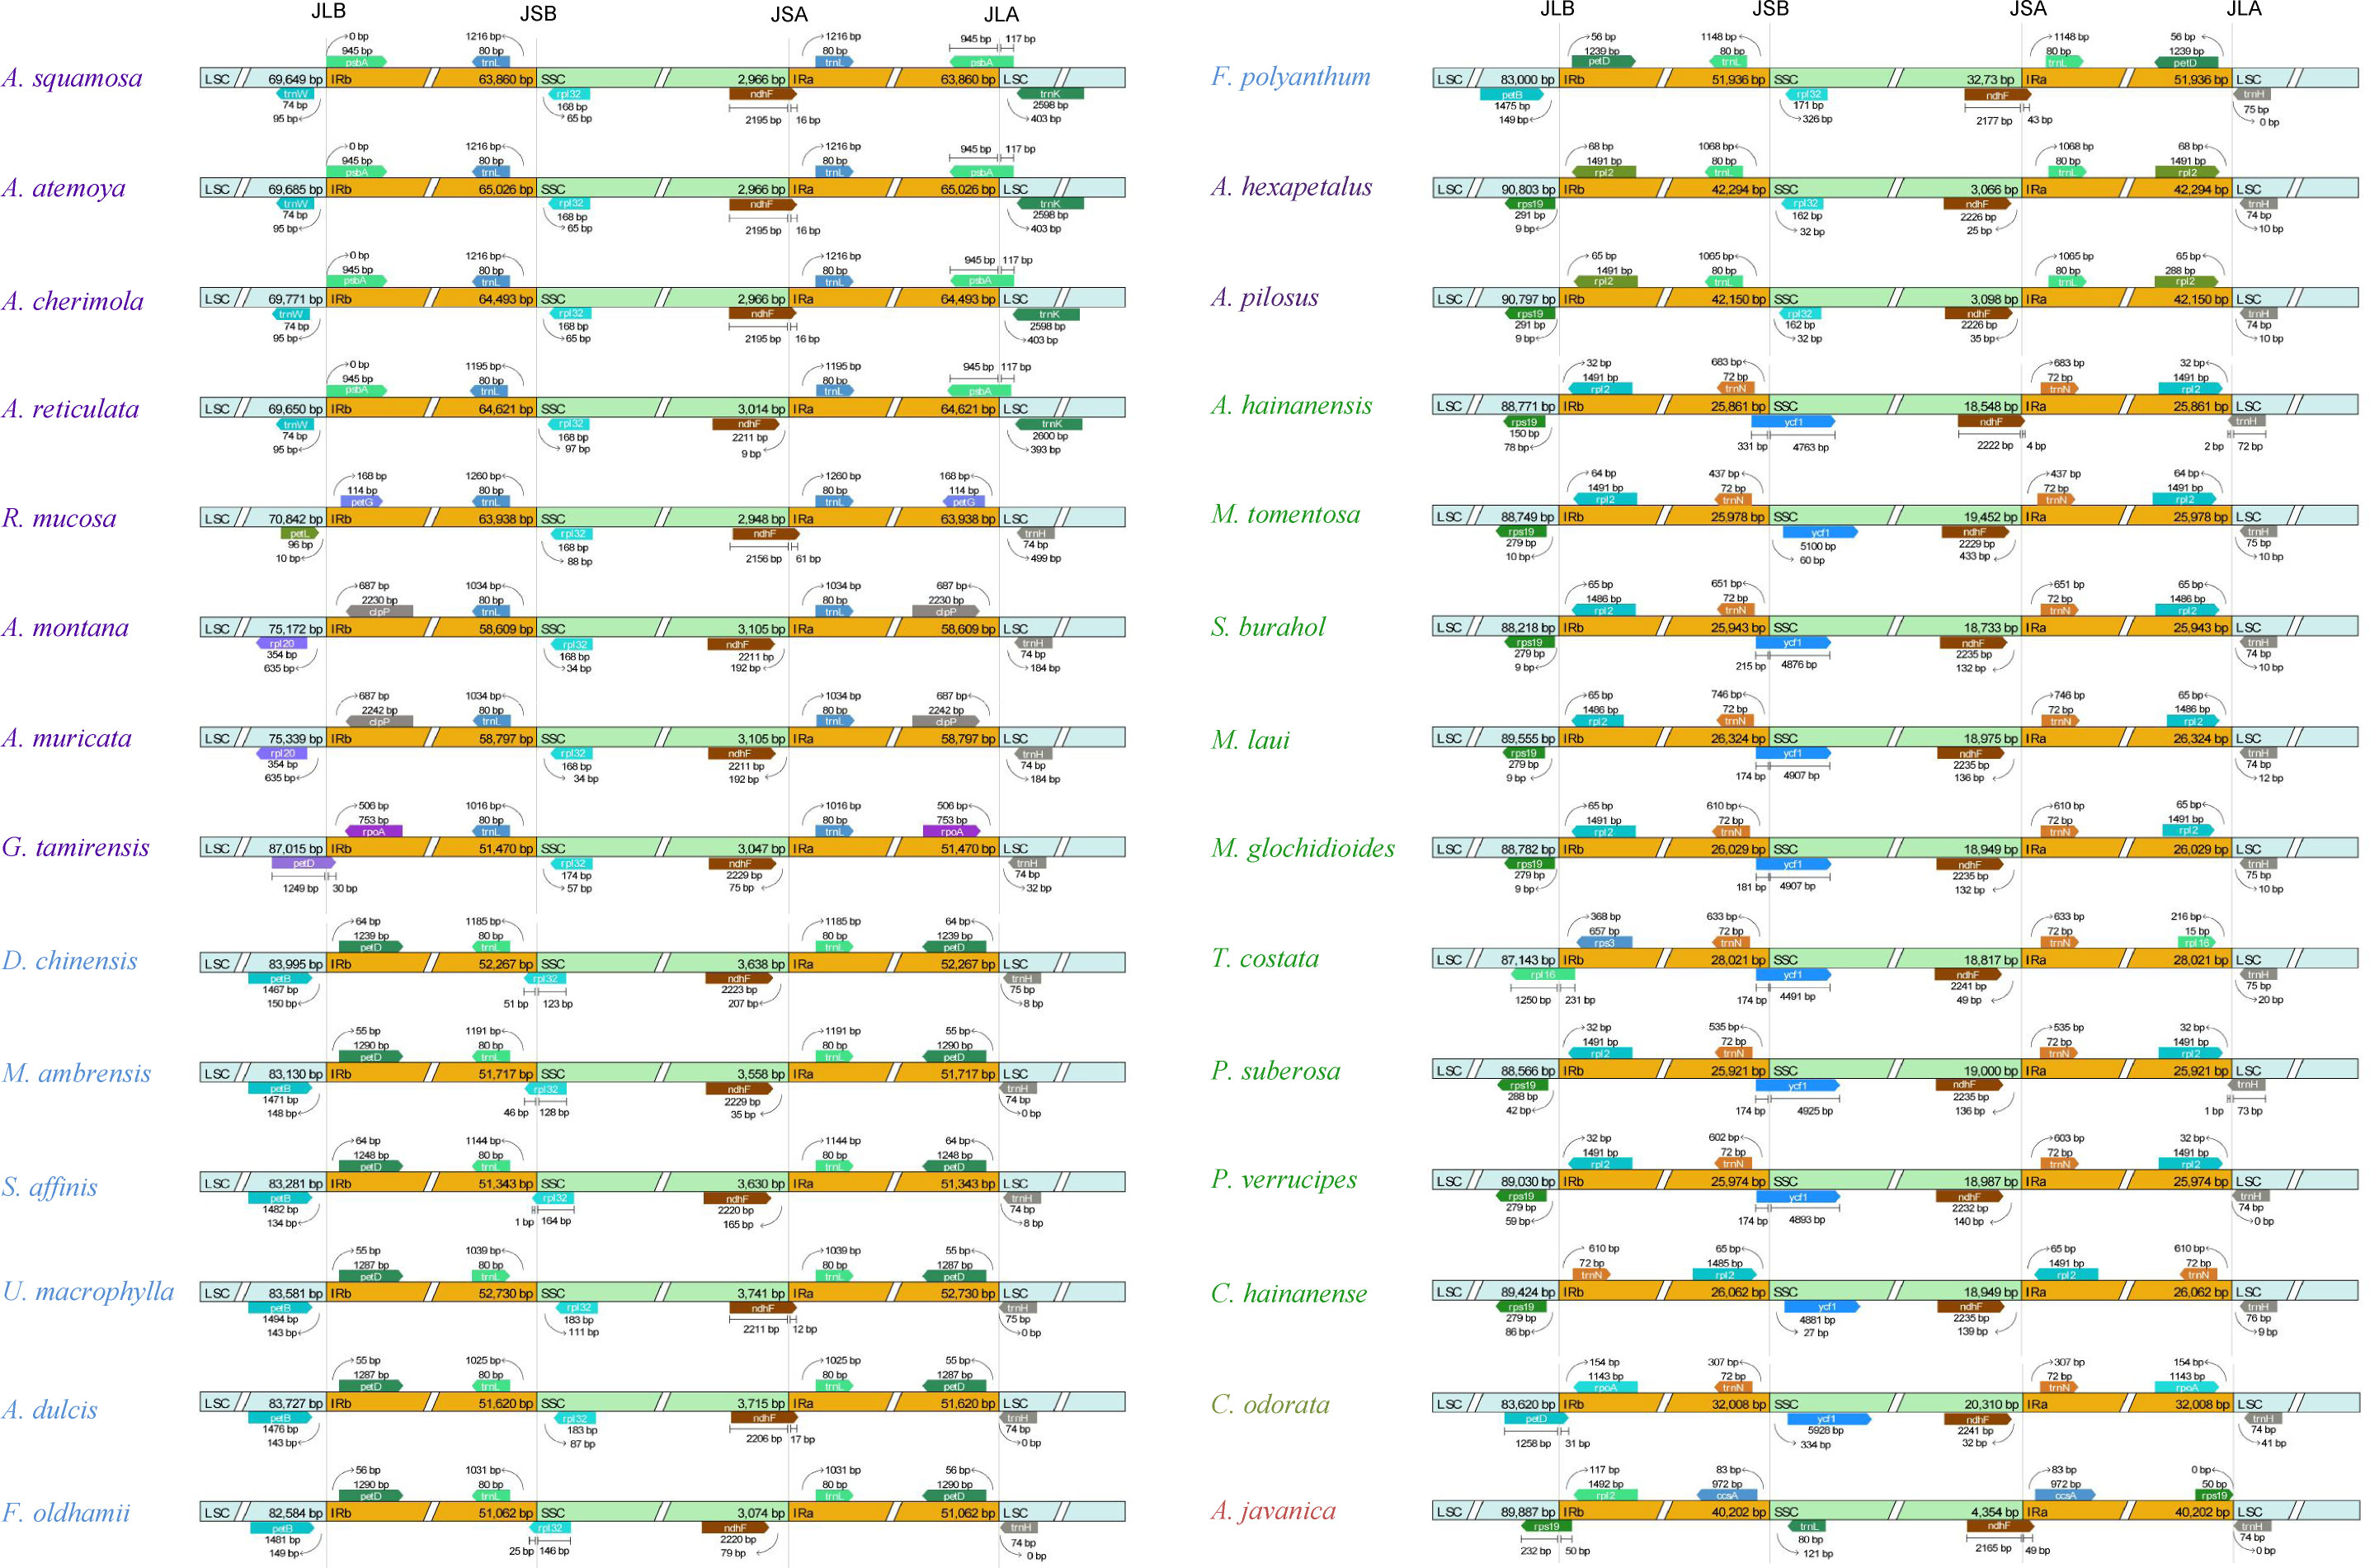
Figure 4 Comparison of the border positions of LSC, SSC, and IR regions among the plastomes of Annonaceae species.
3.4 Different expansion patterns of IR regions
Compared to the outgroups, 20 species within the Annonaceae displayed varying degrees of expansion in their IR regions. These species include Annonoideae, Trivalvaria costata, Cananga odorata, and Anaxagorea javanica. Within the Annonoideae, the expansion of the IR region was bidirectional, occurring in both the LSC and SSC regions, except for Artabotrys. The IR region incorporated a significant portion of the SSC region, approximately 15 kb, which included 10 PCGs: ycf1, rps15, ndhH, ndhA, ndhI, ndhG, ndhE, psaC, ndhD, and ccsA. The extent of IR expansion into the LSC region varied among different species. In Annona atemoya, Annona squamosa, Annona cherimola, and Annona reticulata, 23 (or 22) PCGs are located at the IR region, totaling about 20 kb. For Annona muricata and Annona montana, 18 PCGs entered the IR region, totaling about 13 kb. The LSC regions of Goniothalamus tamirensis and Uvarieae each had 11 PCGs entering the IR region, totaling about 5 kb. In the Annonoideae, only sequences containing the ndhF and rpl32 were retained in the SSC region, totaling about 3 kb. In contrast, the expansion of the IR region was unidirectional in these five species. Artabotrys and Anaxagorea javanica incorporated the majority of sequences from the SSC region, totaling approximately 15 kb. In Trivalvaria costata and Cananga odorata, the IR region expanded into the LSC region by approximately 2 kb and 5 kb, respectively (Table 1, Figure 5; Supplementary Table S1).
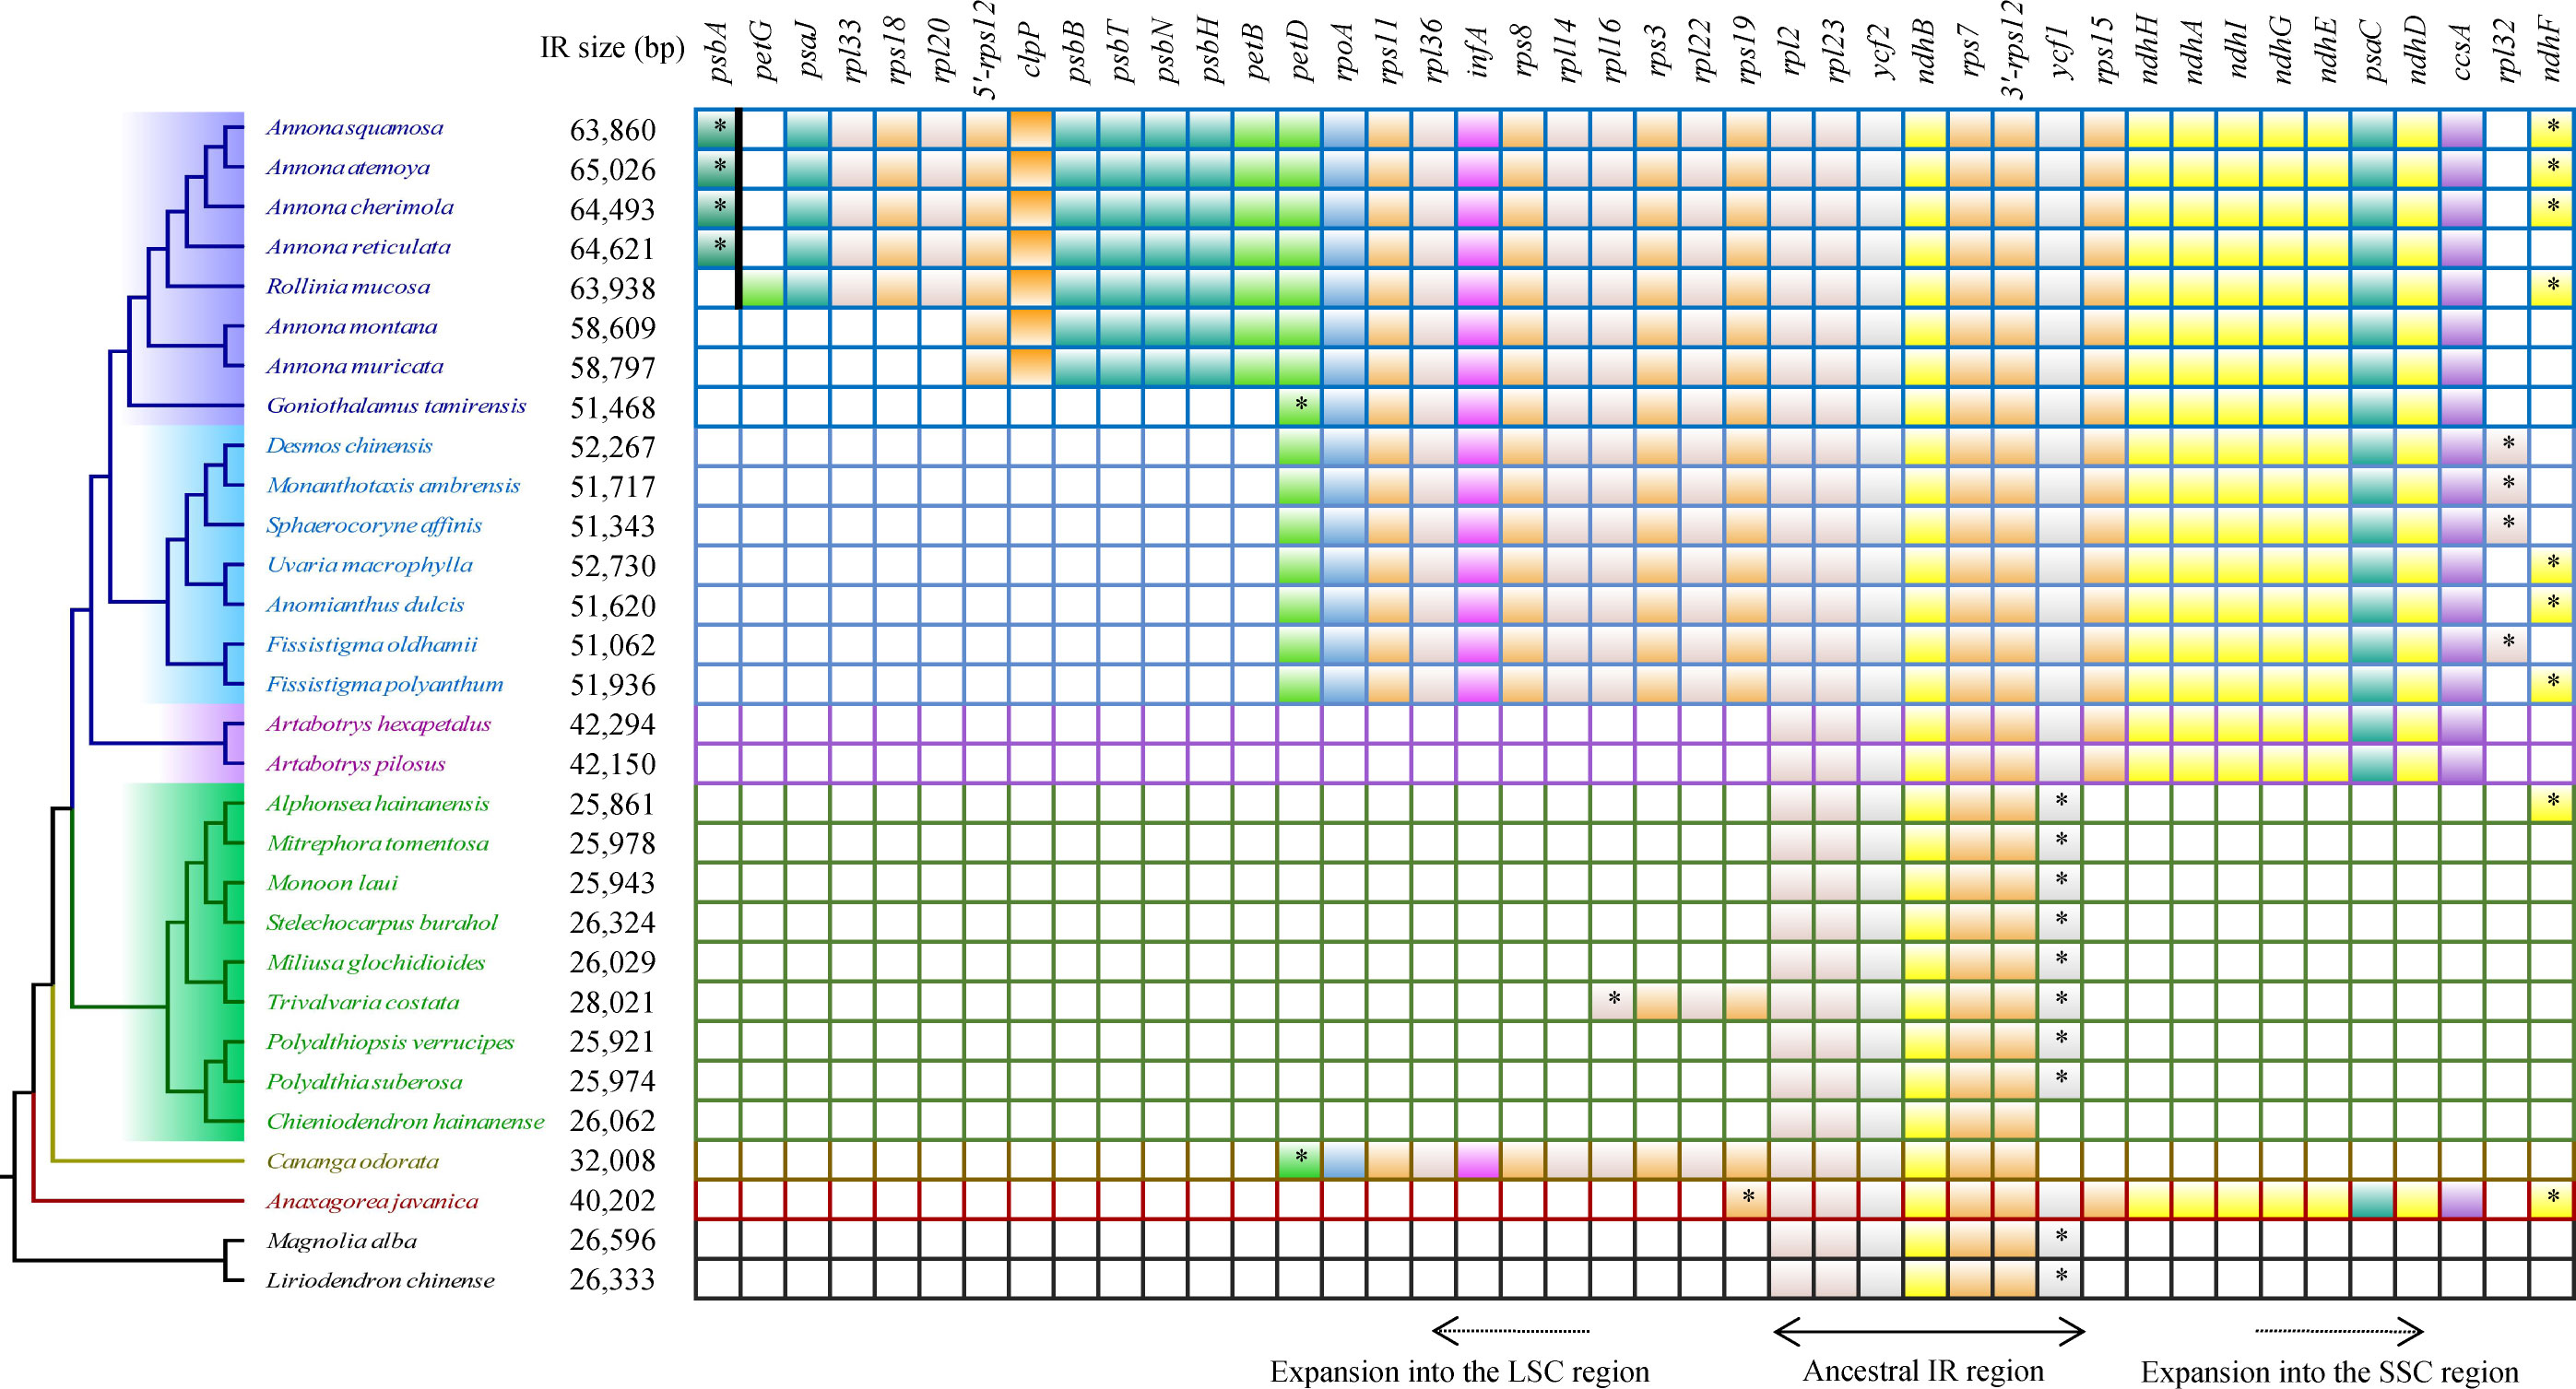
Figure 5 Protein-coding genes that enter the IR region in different species. The “*” represents the part of the gene that enters the IR region. The psbA and petG are separated by a bold black line to indicate that they are not adjacent.
For the number and types of tRNA genes located in the IR region of each species (Supplementary Table S1), seven tRNA genes (trnI-CAU, trnL-CAA, trnV-GAC, trnI-GAU, trnA-UGC, trnR-ACG, and trnN-GUU) are present in all sampled species. trnL-UAG is found in Annonoideae; trnP-UGG and trnH-GUG exist in Annona squamosa, Annona atemoya, Annona cherimola, and Annona reticulata; trnP-UGG and trnW-CCA are present in Rollinia mucosa.
3.5 The distribution patern of SSRs in the plastome
In the sample species of Annonaceae, a total of 1350 SSRs were detected, including 6 nucleotide types and 19 motif types. Anaxagorea javanica had the fewest SSRs with 21, while Cananga odorata had the most with 77 (Figure 6A). The number of mononucleotide SSRs was the highest with 1207 (89.4%), and tetranucleotide SSRs were the least, only found in four species and accounting for 0.5% (Supplementary Table S3). A/T was the dominant mononucleotide SSR motif, accounting for 97.6%. The hexanucleotide SSR motif was the most diverse, with six different types (Supplementary Table S4). Each species had mononucleotide SSRs as its main type, accounting for 100% (Polyalthia suberosa) to 55.6% (G. tamirensis). Rank-sum test results show that there are significant differences in the distribution of SSRs among different taxa, including at the subfamily level (Figure 6B), tribe level (Figure 6C), and between IR expansion and regular sequences (Figure 6D). The paired comparison results (Supplementary Table S5) indicate significant differences between Ambavioideae and Anaxagoreoideae (P = 0.02), Annonoideae and Malmeoideae (P = 0.001), as well as Miliuseae and Annoneae (P = 0.01).
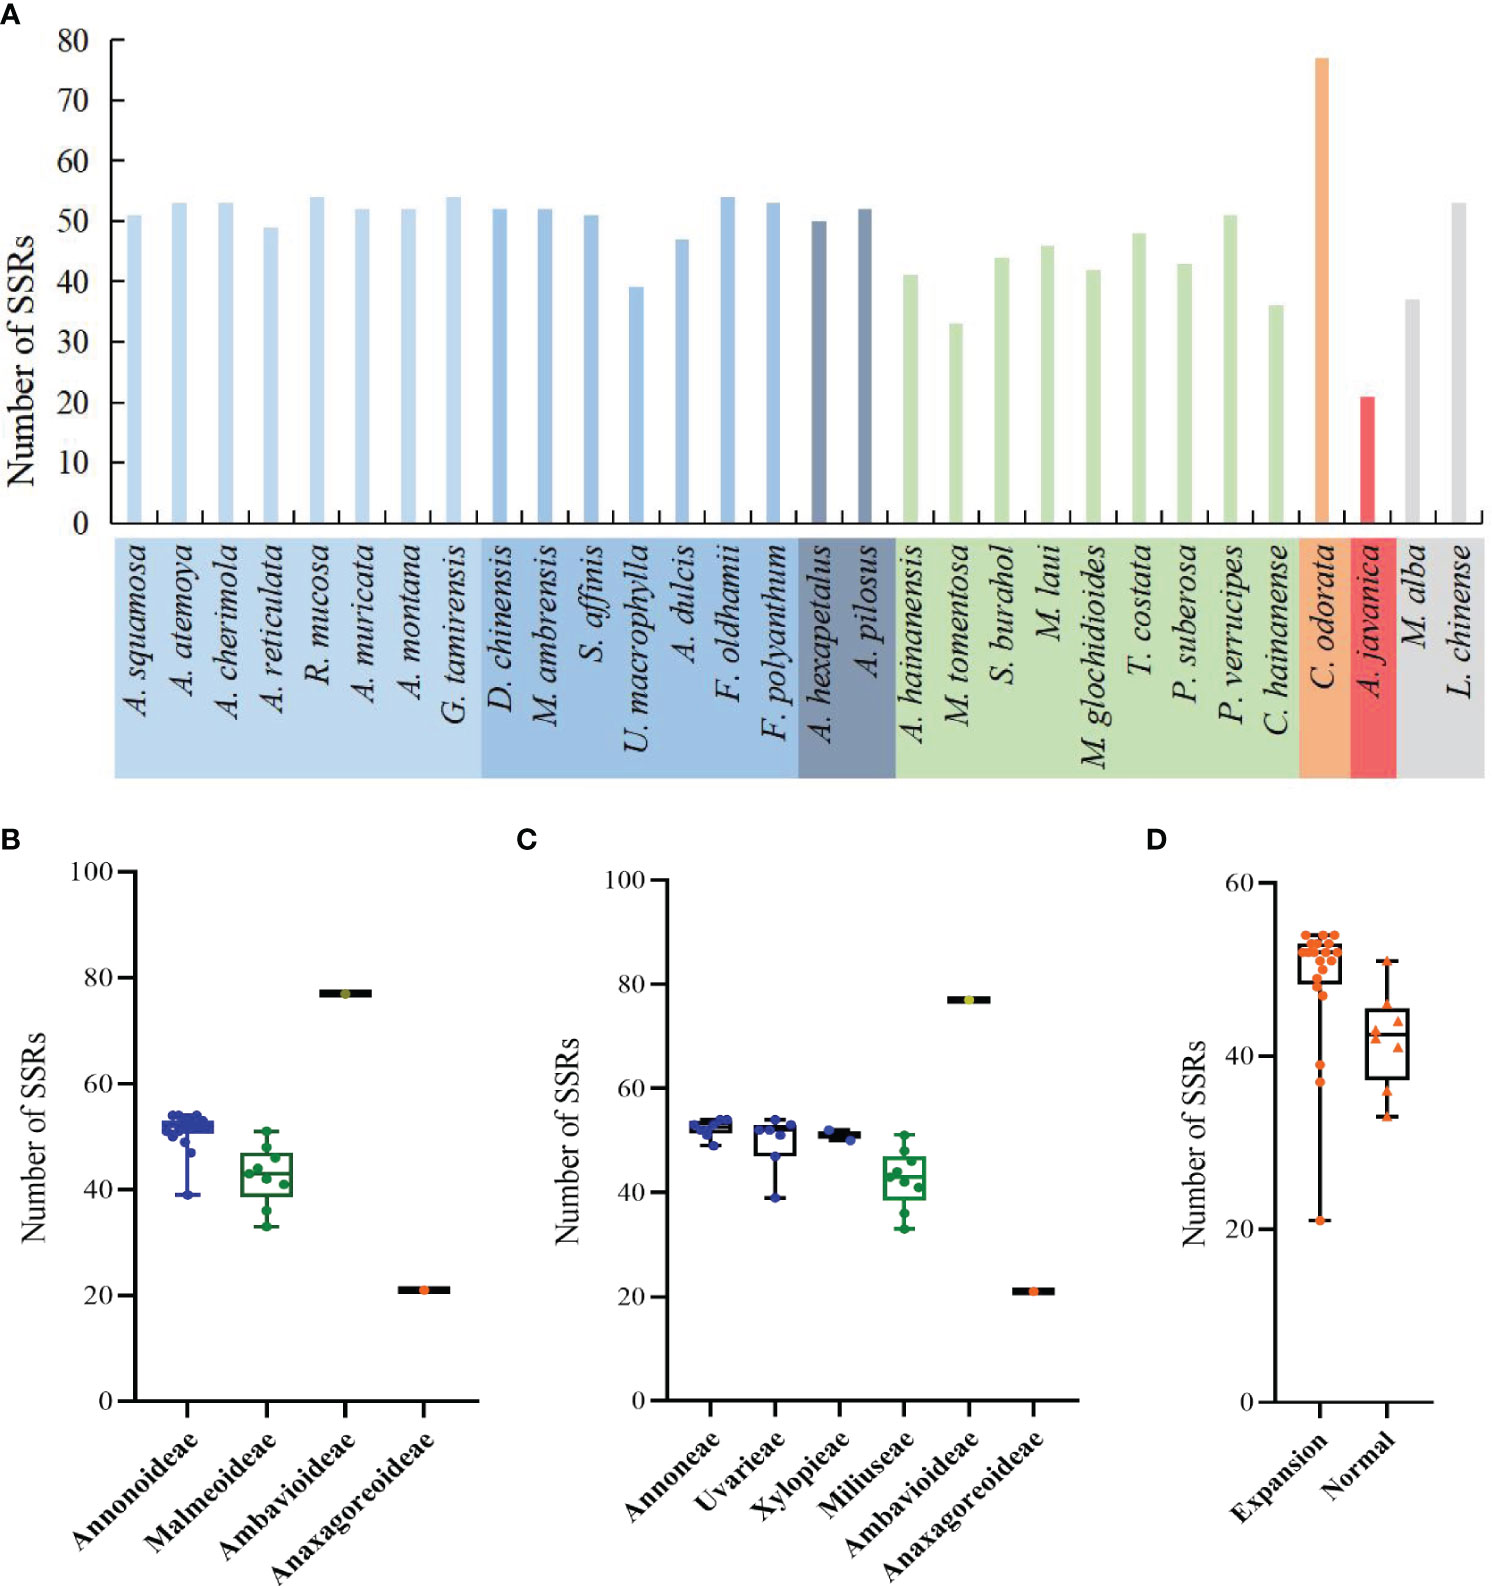
Figure 6 Distribution of SSRs in the plastomes of the Annonaceae. (A) Number per species. (B) Distribution among the four subfamilies. (C) Distribution among the six tribes. (D) Distribution between species with IR expansion and other species.
The number of SSRs distributed in the LSC, SSC, and IR regions varied among species. In species without IR expansion, the majority of SSRs were located in the LSC region (88% to 74%). In species with IR expansion, there was a significant increase in SSRs in the IR region, some of which exceeded those in the LSC region, and the number of SSRs located in the SSC region was the least (0 to 5) (Figure 7A).
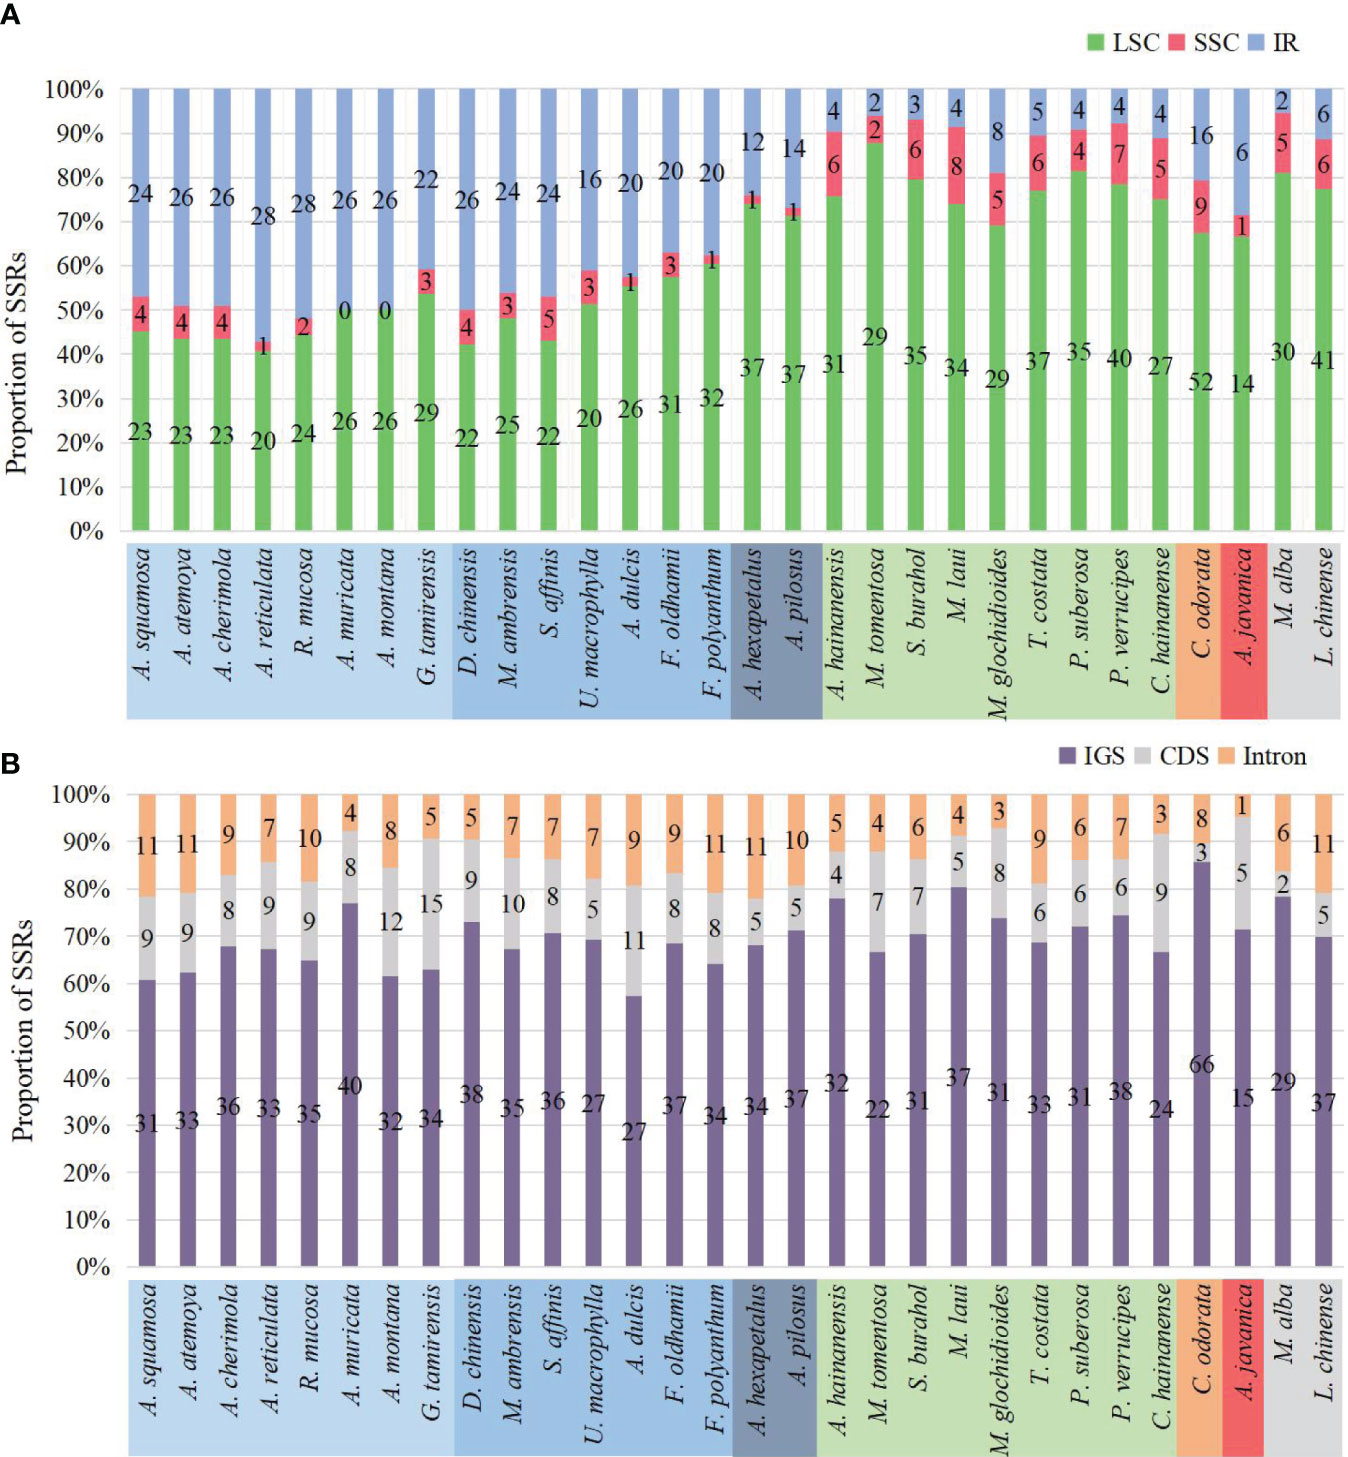
Figure 7 Distribution of SSRs on the plastome. (A) Distribution of SSRs in LSC, SSC, and IR. In species where IR has not expanded, SSRs are mainly located in LSC. In species where IR has expanded, the number of SSRs located in the IR region increases. (B) Distribution of SSRs in IGS, CDS, and introns. The SSRs of all species are mainly located in the IGS region.
The number of SSRs distributed in different sequence types also varied. Across all species, they were mainly located in the intergenic spacer (IGS) region, ranging from 15 in Anaxagorea javanica to 66 in Cananga odorata, accounting for 57.4% in Annona dulcis to 85.7% in Cananga odorata. Compared to the IGS region, there were fewer SSRs located in coding sequence (CDS) and introns (Figure 7B). The genes in the coding sequences where SSRs were detected included: rpoA, rpoB, rpoC2, rpl20, rps18, rps19, ycf1, ycf2, clpP, accD, infA, and psbF. The genes containing SSRs in introns include: atpF, clpP, trnG-UCC, rpl16, rps16, ndhA, ycf3, trnK-UUU, trnV-UAC, and trnL-UAA (Supplementary Table S4).
3.6 The distribution of tandem repeat sequences and dispersed repeat sequences in the plastome
The study detected a total of 2144 TRSs, with the fewest located in the SSC region, followed by the LSC region (Supplementary Table S6). The range of TRSs in the Annonaceae varies from 22 (Alphonsea hainanensis) to 186 (Desmos chinensis) (Figure 8A). Among the subfamilies, Annonoideae has the highest number of TRSs, ranging from 64 to 186, and is mainly located in the IR region. Malmeoideae has fewer TRSs, with a range of 22 to 53 (Figure 8B). At the tribal level, the Uvarieae species have a relatively higher number of TRSs, ranging from 88 to 186 (Figure 8C). The pairwise comparison results indicate significant differences between Annonoideae and Uvarieae, as well as significant differences between Miliuseae and both Annoneae and Uvarieae (Supplementary Table S5). A higher number of TRSs was detected in species with expanded IR regions (Figure 8D), and the rank-sum test results revealed significant differences in the quantity of TRSs between species with expanded IR regions and other species.
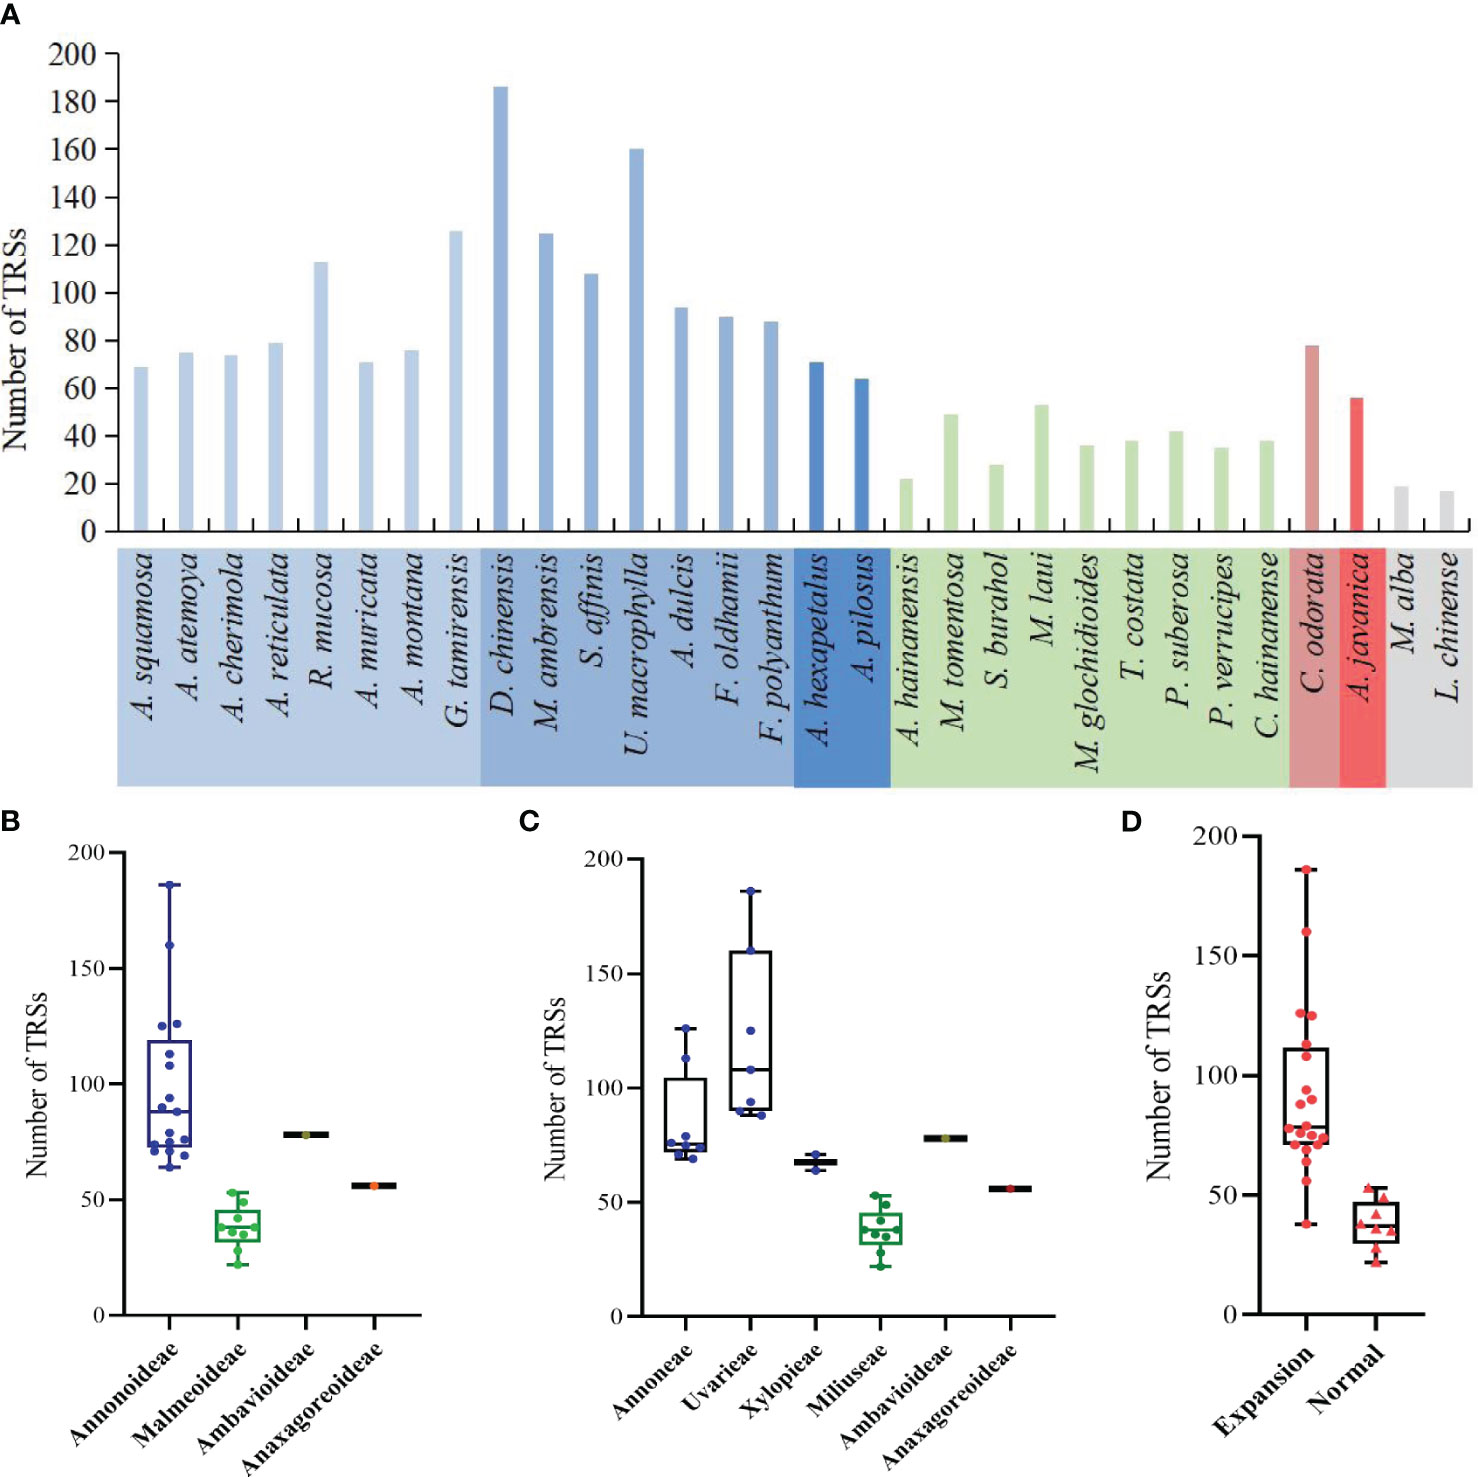
Figure 8 Distribution of the number of tandem repeat sequences in species. (A) Number per species. (B) Distribution among the four subfamilies. (C) Distribution among the six tribes. (D) Distribution between species with IR expansion and other species. Rank-sum test results show significant differences between different subfamilies in (B), between different tribes in (C), and between species with IR expansion and other species in (D).
The study detected both forward DRSs (F-DRSs) and palindromic DRSs (P-DRSs), totaling 3,528 in the Annonaceae (Supplementary Table S7). Annona atemoya was found to have 278 F-DRSs and 283 P-DRSs. Only 2 F-DRSs were detected in Alphonsea hainanensis (Figure 9A). At the subfamily level, in Annonoideae, except for Annona squamosa, Sphaerocoryne, and Artabotrys, the number of DRSs in the remaining species ranges from 79 to 500 (Figure 9B). At the tribal level, Annoneae has the highest number, ranging from 102 to 561, followed by Uvarieae (Figure 9C). Most species with expanded IR regions contain a higher number of DRSs (Figure 9D). Rank-sum test results show that there are significant differences among different taxa, including at the subfamily level, tribe level, and between IR expansion and regular. The pairwise comparison results (Supplementary Table S5) indicate significant differences between Annonoideae and Malmeoideae (P = 0.003), Annoneae and Xylopieae (P = 0), and as well as Miliuseae and Uvarieae (P = 0).
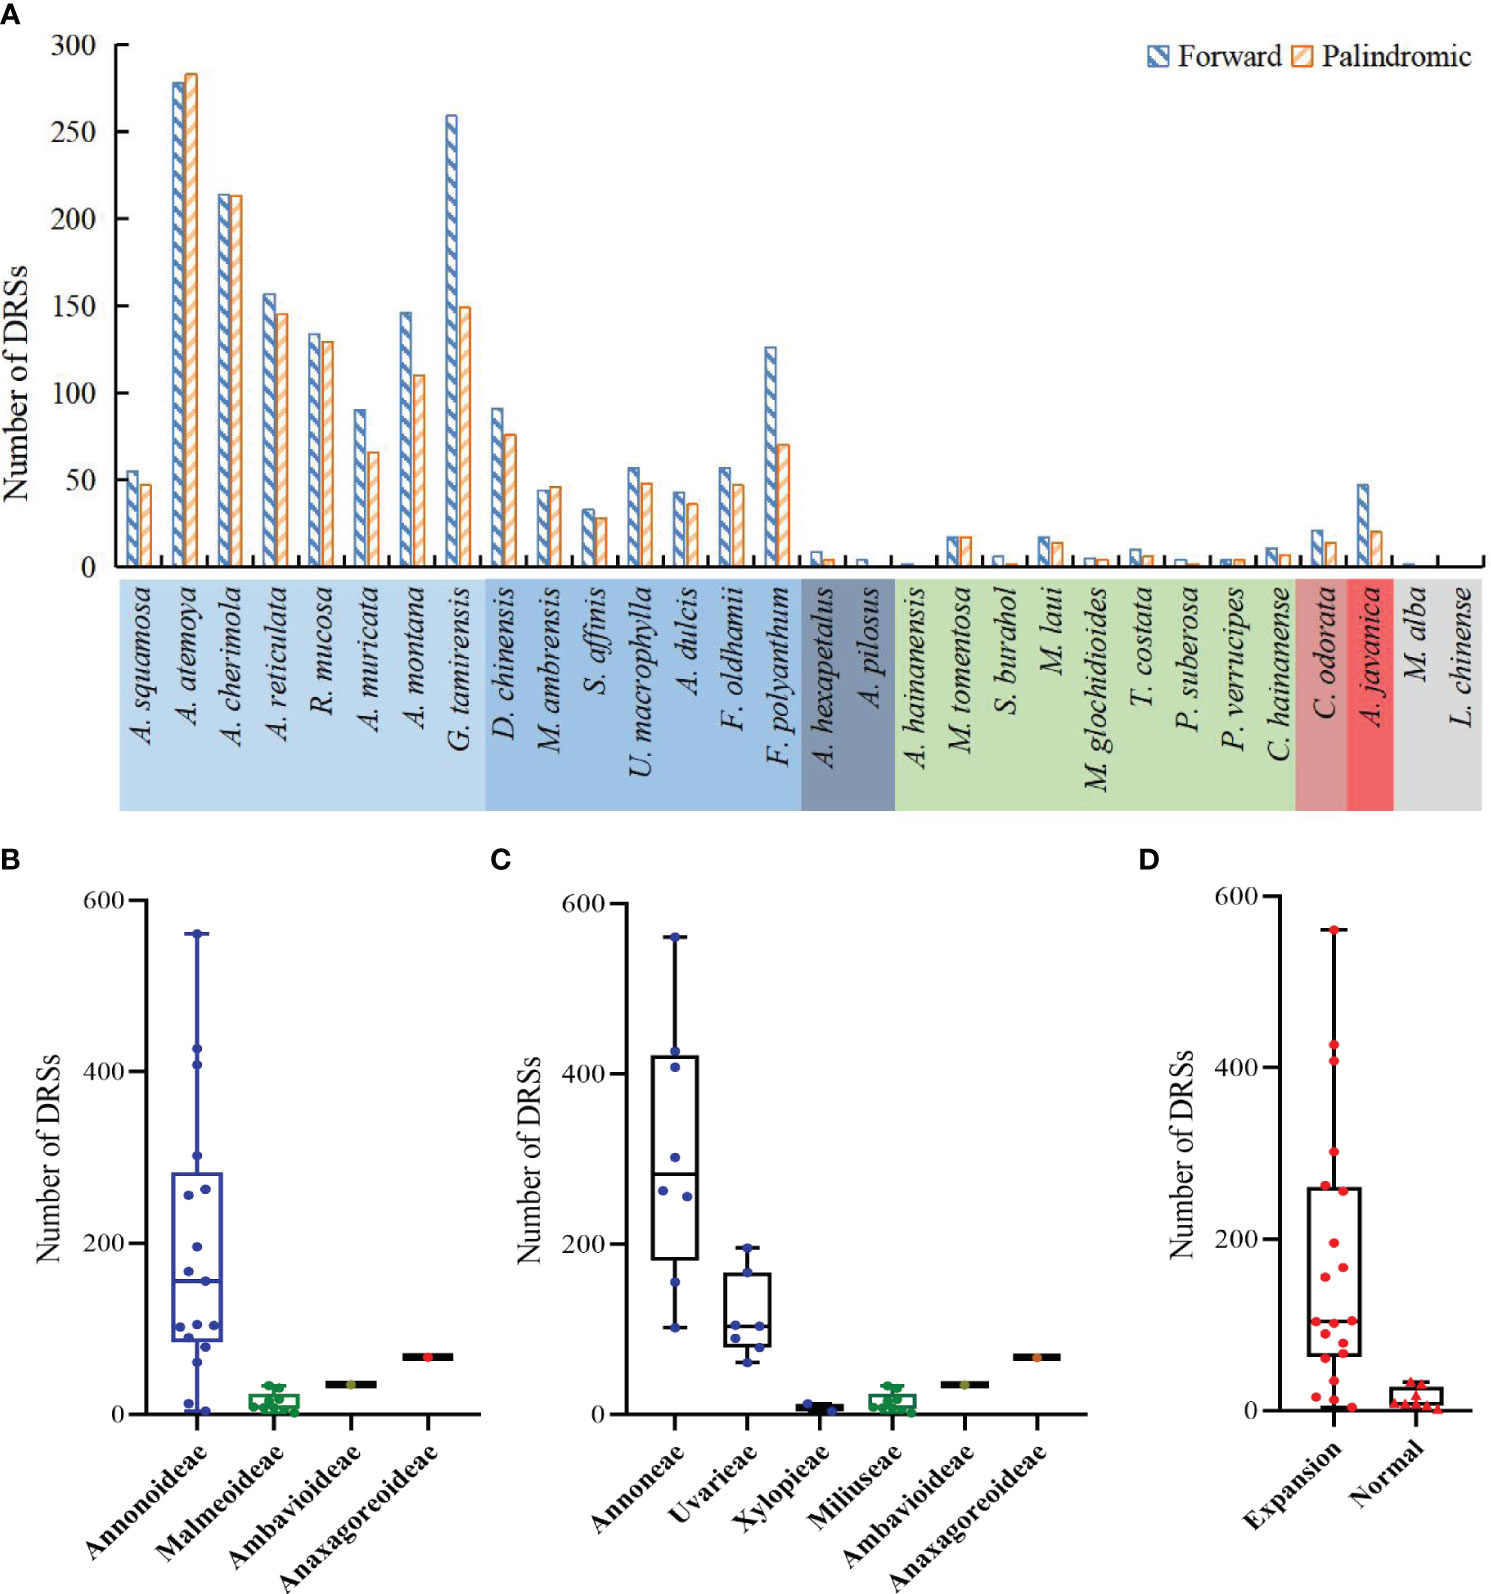
Figure 9 Distribution of dispersed repeat sequences in sampled species. (A) Number per species. (B) Distribution among the four subfamilies. (C) Distribution among the six tribes. (D) Distribution between species with IR expansion and other species. Rank-sum test results show significant differences in the number of dispersed repeat sequences among different subfamilies in (B), among different tribes in (C), and between species with IR expansion and other species in (D).
We noticed that Goniothalamus tamirensis showed a comparable level of expansion in the IR region as Uvarieae (Figure 5). However, the size of the LSC region in Goniothalamus tamirensis (87,019 bp) was approximately 4 kb larger than that of Uvarieae (82,584 bp ~ 83,995 bp) (Table 1). Through an analysis of repetitive sequence distribution, we discovered 114 DRSs (about 2 kb) in the LSC region of Goniothalamus tamirensis, with 113 of them being F-DRSs. In contrast, Uvarieae species had 4 to 24 DRSs in their LSC region (Supplementary Table S7). Additionally, Cananga odorata also showed a similar extent of expansion from the IR region to the LSC (Figure 5), and its LSC size (83,620 bp) was comparable to that of Uvarieae (Table 1). Only three F-DRSs were detected in the LSC region of Cananga odorata (Supplementary Table S7). Therefore, the presence of a significant number of F-DRSs is the primary contributing factor to the enlargement of the LSC region in G. tamirensis. In addition, Goniothalamus tamirensis has more TRSs (126) than other Annoneae species, especially in the LSC region (58, Supplementary Table S4).
4 Discussion
4.1 The expansion of the IR region drives the enlargement of the plastome in Annonaceae
The size of most land plant plastomes is typically between 120 and 160 kb. We have observed a gradual enlargement of plastomes in Annonaceae, ranging from 159 kb to 201.9 kb. The plastome size of Annonoideae exceeds 178 kb, and the size of the IR region falls between 42 kb and 64 kb. This exceeds the typical size range of the IR region in most land plants, which is 15 kb to 30 kb (Zhu et al., 2016). Among the land plants with sequenced plastomes, it is not common to find plastomes larger than 200 kb. According to incomplete statistics in the NCBI database, there are approximately 32 land plant species with plastomes larger than 200 kb. This includes six Pelargonium species (Geraniaceae), 17 Rhododendron species (Ericaceae), two Cypripedium species (Orchidaceae), Vitis vinifera L. (Vitaceae), Magnolia stellata (Siebold et Zucc.) Maxim. (Magnoliaceae), and five Annona species in this study (Supplementary Table S8). The sizes of these genomes range from 200,001 bp to 242,575 bp, with GC content ranging from 28.2% to 39.9%.
The expansion of plastomes is mainly caused by the duplication of genes within the IR region (Sinn et al., 2018; Li et al., 2020), or the expansion of non-coding repetitive sequences (Dugas et al., 2015; Li et al., 2020). The largest plastome in angiosperms is observed in Pelargonium transvaalense R.Knuth (242,575 bp), where the IR region expands to 87,724 bp (Weng et al., 2017). The expansion of Pelargonium plastomes involves the movement of the IR region into the SSC region, causing the majority of the SSC region to enter the IR region and resulting in the replication of numerous gene fragments (Chumley et al., 2006; Weng et al., 2017). Guo et al. (2021) found that in Cypripedium, the expansion occurs in the LSC region, while the lengths of the IR and SSC regions remain unchanged, and the expansion is closely related to the increase of non-coding sequences. Repetitive sequences also play a significant role in genome enlargement. Zhang et al. (2022) observed that the enlarged plastomes in Cypripedium have more long sequence repeats and SSRs, suggesting that the increase in repetitive sequences contributes to the obvious enlargement of the genome. Li et al. (2020) proposed that the expansion of Magnolia liliflora Desr. plastome is mainly associated with the significant expansion of the IR region and the presence of abundant repetitive sequences. In this study, the enlargement of Annonoideae plastomes is primarily attributed to the expansion of the IR region, with a single IR region expanding by approximately 16 kb to 38 kb. Similarly, in the Annonaceae, the expansion of the IR region directly leads to the enlargement of the plastome.
The GC content also changes with the expansion of the genome. Guo et al. (2021) observed that the plastome of Cypripedium subtropicum S. C. Chen & K. Y. Lang (212,668 bp) had a lower GC content (28.8%), which may be related to the increase of AT-biased non-coding regions. Kim et al. (2015) also suggested that the high AT content may be caused by repetitive sequences composed of A and T in the non-coding regions of the single-copy region. Unlike the decrease in GC content, Among these five Annona species, the GC content of the plastomes ranged from 39.3% to 39.6%, significantly higher than other Annonaceae species (P = 0.002). We observed that the GC content of the LSC region was also significantly higher than other Annonaceae species, which may influence the increase in GC content of the plastome. In addition, consistent with observations in other taxa (Hishamuddin et al., 2020; Zhang et al., 2022), the GC content of the LSC and SSC regions of Annonaceae plastomes was significantly lower than that of the IR region, which is associated with a decrease in A/T bases in the four rRNA genes within the IR region.
4.2 Structural rearrangements of plastomes in Annonaceae
In some taxa, the plastome undergoes structural changes during the process of evolution, typically involving rearrangements, expansion of the IR regions, and an increase in sequence repetitions. In the Ericaceae, for example, there are over 20 species with plastomes larger than 200 kb, and within this family, there are rearrangements, expansion of the IR regions, variations in genome size, and repetition of fragments (Li et al., 2020). In the Annonaceae, through global alignment (Figure 3) and boundary analysis (Figure 4), we identified four inversion events (Figure 3), including trnV-GAC ~ ndhB in Goniothalamus tamirensis, trnI-VAU-ycf2-trnL-CAA in Annona montana and Annona muricata, psbJ ~ 5’-rps12 in Cananga odorata, and ycf4 ~ atpE in Anaxagorea javanica. The occurrence of different inversions in different species suggests that these events may have happened independently. Inversions in the entire IR region are relatively rare, appearing only in Chieniodendron hainanense within the Annonaceae. We cannot confirm the existence of this scenario and further sampling is required for verification. Inversions in plastomes are a common occurrence, and some events are used as evidence for classification. For instance, Raubeson and Jansen (1992) discovered that the presence of an approximately 35 kb inversion in the LSC region of lycophytes constitutes strong evidence for their differentiation from angiosperms.
The expansion of the IR region in the Annonaceae is dynamic. In Annonoideae (except for Artabotrys), the IR region expanded into both the SSC and LSC regions. In Malmeoideae, only Trivalvaria costata was found to have an expansion of its IR region towards the LSC region by 2 kb. Based on the dynamic changes observed in the IR region from the available data, we speculate that the IR region in some other species within Malmeoideae may have also undergone expansion. In the basal group, Anaxagorea javanica primarily expanded its IR region towards the SSC region, while in Cananga odorata, the IR region mainly expanded towards the LSC region. In addition, the expansion of IR region into SSC region in Annonoideae includes trnL-UAG, while it is absent from the IR region of Anaxagorea javanica (Figure 4). The distinct expansion patterns suggest that they may have independent origins. Large expansions of IR regions have been observed in multiple lineages (Chumley et al., 2006; Weng et al., 2017; Sinn et al., 2018). Some studies suggested that IR region expansion was related to the Poly(A) tracts. Goulding et al. (1996) found a 12 kb expansion of the IR region in the plastomes of Nicotiana acuminata (Graham) Hook. The junction between the IR and LSC was located in the intron 1 of clpP, and they proposed that this expansion occurred through double-strand DNA breaks and recombination between the poly(A) tracts of clpP intron 1 and upstream of rps19. The expansion of the IR in Inga is located between ndhD and SSC, with this region being rich in 78% AT content and containing many potential poly(A) tracts (Dugas et al., 2015). Unlike the massive expansion of IR regions, IR regions are sometimes lost (Ruhlman et al., 2017; Cauz-Santos et al., 2020) or contracted (He et al., 2020) in the plastomes of some plant lineages and algae. Previous studies have shown that many characteristics in Annonaceae are closely associated with its high diversification rate, such as climbing habits, day-night rhythm of pollen adhesion, monoecy, and seed dispersal with seeds enclosed in single-seeded fruits (Xue et al., 2019). We observed three different arrangement patterns in the plastomes of seven species within the Annona, demonstrating the diversity of plastome structures within this genus. Overall, significant structural variations exist in the plastomes of the Annonaceae. Some structural features, particularly the varying degrees of IR expansion, can be utilized for phylogenetic research.
Due to the large expansion of the IR region, there was a large variation in the gene number of Annonaceae (129-165). In Annonoideae, 10 to 32 protein-coding genes enter the IR region in Annonoideae, which directly increases the total number of genes. Notably, in Annona, 5’-rps12 is located in the IR region, which is rarely reported before (Ping et al., 2023). In ferns and gymnosperms, it has been found that 3’-rps12 enters or leaves the IR region as the IR region expands or contracts, and it has been shown that 3’-rps12 in the IR region has reduced substitution rates and a more conserved sequence signature (Ping et al., 2021b, c). The number of genes was greatly influenced by changes in the IR region, but the types of PCGs were almost identical.
4.3 Phylogenetic relationship of Annonaceae
Due to the extensive diversity of Annonaceae, phylogenetic studies on this family have always been subject to controversy (Maas et al., 2015; Chatrou et al., 2018; Ortiz-Rodriguez et al., 2018). In recent years, molecular evidence, primarily derived from plastome data, has successfully aided in resolving some ambiguous classification issues. Tang et al. (2015) utilized sequences from nine plastomes to demonstrate the monophyly of Goniothalamus. Xue et al. (2020) constructed a phylogenetic tree using chloroplast genes (matK, rbcL, and trnL-F) and provided evidence that Polyalthia amoena A. C. Sm., Polyalthia capillata A. C. Sm., and Polyalthia loriformis Gillespie belong to Huberantha. Wang et al. (2021), through phylogenetic analysis of five chloroplast regions (psbA-trnH, trnL-F, matK, rbcL, and atpB-rbcL), explicitly placed Meiogyne kwangtungensis P. T. Li within the branch of Pseuduvaria. Ping et al. (2023) constructed a phylogenetic tree of 65 magnoliid species using shared PCGs and found support for Annonoideae and Malmeoideae as sister groups. In our study, we investigated the phylogenetic relationships of 28 Annonaceae species based on 75 shared plastid PCGs. Our results support Annonoideae and Malmeoideae as monophyletic groups and sister clades, with Cananga odorata outside of them, followed by Anaxagorea javanica. Additionally, we observed that the phylogenetic relationships within Malmeoideae species had low support in all trees except the BI tree, consistent with previous research (Ping et al., 2023). Furthermore, we found that Chieniodendron hainanense is located within Malmeoideae, which is consistent with the findings of Thomas et al. (2012), who placed Chieniodendron within Meiogyne (Malmeoideae). Considering the various expansion patterns of the IRs within the Annonaceae, we believe that these structural changes can serve as a basis for systematic classification. However, the number of reported plastomes in Annonaceae is currently limited, necessitating the addition of more data that can be combined with morphological features to elucidate the relationships and evolutionary processes within Annonaceae.
4.4 Repetitive sequences contribute to the enlargement of plastome size
Repetitive elements play an important role in the structure and size stability of plastomes (Wu et al., 2021). Recently, Li et al. (2023) found a significant correlation between the number of repetitions and tandem repeats with the size of the IR region and plastome in Alismatidae. Zhou et al. (2022) discovered that short repeats and intermediate repeat regions in Selaginella mediate various conformations, resulting in diverse and complex structures in plastomes, and identified six new configurations. Long repetitive sequences play an important role in genome rearrangement and are often used to study phylogenetic relationships between species; furthermore, they promote intermolecular recombination in plastomes to generate diversity (Park et al., 2017). This study found that species with expanded IR regions, particularly in Annonoideae, tend to have more repetitive sequences. And the expansion of the LSC region in Goniothalamus tamirensis is mainly due to the presence of a large number of forward dispersed repetitive sequences, indicating that forward dispersed repetitive sequences play an important role in plastome size.
SSRs, as molecular markers, are commonly used for studies on genetic diversity, population structure, genetic mapping, phylogenetics, and variety identification (Potter et al., 2015; He et al., 2020). Similar to most species (Wu et al., 2021; Li et al., 2023), SSRs in Annonaceae are mainly composed of mononucleotides and A/T bases. However, Liu et al. (2021) found that SSRs in Polypodiaceae are mainly composed of G/C mononucleotides and predominantly located in the LSC region, consistent with the distribution of SSRs in Malmeoideae. Due to the expansion of the IR region in Annonoideae, the number of SSRs in the LSC and IR are close to each other. SSRs in Annonaceae are mainly located in the intergenic spacer region (IGS), similar to observations in ferns (Liu et al., 2021; Zhu et al., 2021) and cypresses (Ping et al., 2021a). Additionally, Zhu et al. (2021) found that the distribution of SSRs in Cyatheaceae shows intergeneric specificity, providing information for phylogenetic studies within the family.
5 Conclusion
Within Magnoliales, the Annonaceae is the most diverse at both the genus and species levels, and existing data demonstrate the diversity of plastomes within this family, including genome expansion, varying degrees and modes of IR region expansion, inversions and boundary shifts. During the analysis of the available data, we noticed some confusion in the assembly results, particularly regarding the orientation of the SSC region, which appears to be random. Of concern is the fact that only Chieniodendron hainanense exhibits inversion of the entire IR region. To clarify these issues, more plastomes of Annonaceae species need to be obtained for further investigation of their structural changes and evolutionary processes. This will provide additional information for the phylogenetics, genetics, and evolution of the Annonaceae.
Data availability statement
The data presented in the study are deposited in the NCBI repository (https://www.ncbi.nlm.nih.gov/nuccore/), accession number: MN241494, MN241495, KU563738, MT742547, MN241491, MK087989, MT742546, MN241496, OQ687053, MN241488, MN241489, MH992130, MN241490, MW136266, MW829282, MZ936420, OK216144, MN253543, OQ682535, MN253544, OL979152, OM047203, OM914484, OM937139, MW018366, MK035708, MN016933, MK087990, NC_037005, NC_030504.
Author contributions
JP: Data curation, Methodology, Writing – original draft. JH: Data curation, Methodology, Writing – original draft. TW: Writing – review & editing. YS: Writing – review & editing.
Funding
The author(s) declare financial support was received for the research, authorship, and/or publication of this article. This research was funded by the National Natural Science Foundation of China [31872670, and 32071781], Guangdong Basic and Applied Basic Research Foundation [2021A1515010911], Science and Technology Projects in Guangzhou [202206010107], and Project of Department of Science and Technology of Shenzhen City, Guangdong, China [JCYJ20190813172001780 and JCYJ20210324141000001].
Conflict of interest
The authors declare that the research was conducted in the absence of any commercial or financial relationships that could be construed as a potential conflict of interest.
Publisher’s note
All claims expressed in this article are solely those of the authors and do not necessarily represent those of their affiliated organizations, or those of the publisher, the editors and the reviewers. Any product that may be evaluated in this article, or claim that may be made by its manufacturer, is not guaranteed or endorsed by the publisher.
Supplementary material
The Supplementary Material for this article can be found online at: https://www.frontiersin.org/articles/10.3389/fpls.2024.1351388/full#supplementary-material
References
Amiryousefi, A., Hyvönen, J., Poczai, P. (2018). IRscope: an online program to visualize the junction sites of chloroplast genomes. Bioinformatics 34, 3030–3031. doi: 10.1093/bioinformatics/bty220
Beier, S., Thiel, T., Münch, T., Scholz, U., Mascher, M. (2017). MISA-web: A web server for microsatellite prediction. Bioinformatics 33, 2583–2585. doi: 10.1093/bioinformatics/btx198
Benson, G. (1999). Tandem repeats finder: a program to analyze DNA sequences. Nucleic Acids Res. 27, 573–580. doi: 10.1093/nar/27.2.573
Cauz-Santos, L. A., da Costa, Z. P., Callot, C., Cauet, S., Zucchi, M. I., Bergès, H., et al. (2020). A repertory of rearrangements and the loss of an inverted repeat region in Passiflora chloroplast genomes. Genome Biol. Evol. 12, 1841–1857. doi: 10.1093/gbe/evaa155
Chaowasku, T., Damthongdee, A., Jongsook, H., Nuraliev, M. S., Ngo, D. T., Le, H. T., et al. (2018). Genus Huberantha (Annonaceae) revisited: erection of Polyalthiopsis, a new genus for H. floribunda, with a new combination H. luensis. Ann. Bot. Fenn. 55, 121–136. doi: 10.5735/085.055.0114
Chatrou, L. W., Pirie, M. D., Erkens, R. H. J., Couvreur, T. L., Neubig, K. M., Abbott, J. R., et al. (2012). A new subfamilial and tribal classification of the pantropical plant family Annonaceae informed by molecular phylogenetics. Bot. J. Linn. Soc 169, 5–40. doi: 10.1111/boj.2012.169.issue-1
Chatrou, L. W., Turner, I. M., Klitgaard, B. B., Maas, P. J., Utteridge, T. M. (2018). A linear sequence to facilitate curation of herbarium specimens of Annonaceae. Kew Bull. 73, 1–10. doi: 10.1007/s12225-018-9764-3
Chaw, S. M., Wu, C. S., Sudianto, E. (2018). Evolution of gymnosperm plastid genomes. Adv. Bot. Res. 85, 195–222. doi: 10.1016/bs.abr.2017.11.018
Chumley, T. W., Palmer, J. D., Mower, J. P., Fourcade, H. M., Calie, P. J., Boore, J. L., et al. (2006). The complete chloroplast genome sequence of Pelargonium × hortorum: Organization and evolution of the largest and most highly rearranged chloroplast genome of land plants. Mol. Biol. Evol. 23, 2175–2190. doi: 10.1093/molbev/msl089
Dugas, D. V., Hernandez, D., Koenen, E. J., Schwarz, E., Straub, S., Hughes, C. E., et al. (2015). Mimosoid legume plastome evolution: IR expansion, tandem repeat expansions and accelerated rate of evolution in clpP. Sci. Rep. 5, 16958. doi: 10.1038/srep16958
Gan, Y., Zhang, Q., Ping, J. (2022). The complete chloroplast genome of Miliusa glochidioides (Annonaceae) and phylogenetic analysis. Mitochondr. DNA B 7, 1604–1605. doi: 10.1080/23802359.2022.2116947
Goulding, S. E., Olmstead, R. G., Morden, C. W., Morden, C. W. (1996). Ebb and flow of the chloroplast inverted repeat. Mol. Gen. Genet. MGG 252, 195–206. doi: 10.1007/BF02173220
Greiner, S., Lehwark, P., Bock, R. (2019). Organellar Genome DRAW (OGDRAW) version 1.3, 1: Expanded toolkit for the graphical visualization of organellar genomes. Nucleic Acids Res. 47, W59–W64. doi: 10.1093/nar/gkz238
Guo, X., Tang, C. C., Thomas, D. C., Couvreur, T. L., Saunders, R. M. (2017). A mega-phylogeny of the Annonaceae: Taxonomic placement of five enigmatic genera and support for a new tribe, Phoenicantheae. Sci. Rep. 7, 7323. doi: 10.1038/s41598-017-07252-2
Guo, Y. Y., Yang, J. X., Li, H. K., Zhao, H. S. (2021). Chloroplast genomes of two species of Cypripedium: Expanded genome size and proliferation of AT-biased repeat sequences. Front. Plant Sci. 12. doi: 10.3389/fpls.2021.609729
He, S., Yang, Y., Li, Z., Wang, X., Guo, Y., Wu, H. (2020). Comparative analysis of four Zantedeschia chloroplast genomes: expansion and contraction of the IR region, phylogenetic analyses and SSR genetic diversity assessment. Peer J. 8, e9132. doi: 10.7717/peerj.9132
Hishamuddin, M. S., Lee, S. Y., Ng, W. L., Ramlee, S. I., Lamasudin, D. U., Mohamed, R. (2020). Comparison of eight complete chloroplast genomes of the endangered Aquilaria tree species (Thymelaeaceae) and their phylogenetic relationships. Sci. Rep. 10, 13034. doi: 10.1038/s41598-020-70030-0
Huelsenbeck, J. P., Ronquist, F. (2001). MRBAYES: Bayesian inference of phylogenetic trees. Bioinformatics 17, 754–755. doi: 10.1093/bioinformatics/17.8.754
Jin, J. J., Yu, W. B., Yang, J. B., Song, Y., DePamphilis, C. W., Yi, T. S., et al. (2020). GetOrganelle: A fast and versatile toolkit for accurate de novo assembly of organelle genomes. Genome Biol. 21, 1–31. doi: 10.1186/s13059-020-02154-5
Kearse, M., Moir, R., Wilson, A., Stones-Havas, S., Cheung, M., Sturrock, S., et al. (2012). Geneious basic: An integrated and extendable desktop software platform for the organization and analysis of sequence data. Bioinformatics 28, 1647–1649. doi: 10.1093/bioinformatics/bts199
Kim, J. S., Kim, H. T., Kim, J. H. (2015). The largest plastid genome of monocots: a novel genome type containing AT residue repeats in the slipper orchid Cypripedium japonicum. Plant Mol. Biol. Rep. 33, 1210–1220. doi: 10.1007/s11105-014-0833-y
Kumar, S., Stecher, G., Li, M., Knyaz, C., Tamura, K. (2018). MEGA X: Molecular evolutionary genetics analysis across computing platforms. Mol. Biol. Evol. 35, 1547–1549. doi: 10.1093/molbev/msy096
Kurtz, S., Schleiermacher, C. (1999). REPuter: fast computation of maximal repeats in complete genomes. Bioinformatics B15, 426–427. doi: 10.1093/bioinformatics/15.5.426
Li, P. T., Gilbert, M. G. (2011). “Annonaceae,” in Flora of China. Eds. Wu., Z. Y., Raven., P. H., Hong, D. Y. (Beijing: Beijing Missouri Botanical Garden Press, St. Louis, Science Press), 672–713.
Li, H., Guo, Q., Li, Q., Yang, L. (2020). Long-reads reveal that Rhododendron delavayi plastid genome contains extensive repeat sequences, and recombination exists among plastid genomes of photosynthetic Ericaceae. Peer J. 8, e9048. doi: 10.7717/peerj.9048
Li, Z. Z., Lehtonen, S., Chen, J. M. (2023). The dynamic history of plastome structure across aquatic subclass Alismatidae. BMC Plant Biol. 23, 125. doi: 10.1186/s12870-023-04125-x44
Lian, C. L., Yang, H., Lan, J. X., Zhang, X., Zhang, F., Yang, J., et al. (2022). Comparative analysis of chloroplast genomes reveals phylogenetic relationships and intraspecific variation in the medicinal plant Isodon rubescens. PloS One 17, e0266546. doi: 10.1371/journal.pone.0266546
Liu, S. S., Wang, Z., Su, Y. J., Wang, T. (2021). Comparative genomic analysis of Polypodiaceae chloroplasts reveals fine structural features and dynamic insertion sequences. BMC Plant Biol. 21, 1–15. doi: 10.1186/s12870-020-02800-x
Maas, P. J. M., Westra, L. Y. T., Guerrero, S. A., Lobão, A. Q., Scharf, U., Zamora, N. A. (2015). Confronting a morphological nightmare revision of the Neotropical genus Guatteria (Annonaceae). Blumea 60, 1–219. doi: 10.3767/000651915X690341
Martin, M. (2011). Cutadapt removes adapter sequences from high-throughput sequencing reads. EMBnet. J. 17, 10–12. doi: 10.14806/ej.17.1.200
Mower, J. P., Vickrey, T. L. (2018). Structural diversity among plastid genomes of land plants. Adv. Bot. Res. 85, 263–292. doi: 10.1016/bs.abr.2017.11.013
Ortiz-Rodriguez, A. E., Ornelas, J. F., Sanchez, E. R. (2018). Molecular phylogeny and divergence time estimates of the Desmopsis-Stenanona clade (Annonaceae) in Mesoamerica. Mol. Phylogenet. Evol. 122, 80–94. doi: 10.1016/j.ympev.2018.01.021
Park, I., Yang, S., Choi, G., Kim, W. J., Moon, B. C. (2017). The complete chloroplast genome sequences of Aconitum pseudolaeve and Aconitum longecassidatum, and development of molecular markers for distinguishing species in the Aconitum subgenus Lycoctonum. Molecules 22, 2012. doi: 10.3390/molecules22112012
Ping, J. Y., Feng, P. P., Hao, J., Li, J. Y., Su, Y. J., Wang, T. (2021c). The molecular evolution pattern of rps12 gene in gymnosperms (in Chinese). Chin. Sci. Bull. 66, 3182–3193. doi: 10.1360/TB-2020-1528
Ping, J. Y., Feng, P. P., Li, J. Y., Zhang, R. J., Su, Y. J., Wang, T., et al. (2021a). Molecular evolution and SSRs analysis based on the chloroplast genome of Callitropsis funebris. Ecol. Evol. 11, 4786–4802. doi: 10.1002/ece3.7381
Ping, J. Y., Li, A. M., Feng, P. P., Zhu, M., Su, Y. J., Wang, T., et al. (2021b). The highly conserved rps12 gene in ferns provides strong evidence for decreased substitution rates in the inverted repeat region. Plant Syst. Evol. 307, 1–9. doi: 10.1007/s00606-021-01750-7
Ping, J. Y., Zhong, X. N., Wang, T., Su, Y. J. (2023). Structural characterization of Trivalvaria costata chloroplast genome and molecular evolution of rps12 gene in Magnoliids. Forests 14, 1101. doi: 10.3390/f14061101
Potter, K. M., Hipkins, V. D., Mahalovich, M. F., Means, R. E. (2015). Nuclear genetic variation across the range of Ponderosa pine (Pinus ponderosa): phylogeographic, taxonomic and conservation implications. Tree Genet. Genomes 11, 38. doi: 10.1007/s11295-015-0865-y
Punyasena, S. W., Eshel, G., McElwain, J. C. (2008). The influence of climate on the spatial patterning of Neotropical plant families. J. Biogeogr. 35, 117–130. doi: 10.1111/j.1365-2699.2007.01773.x
Qu, X. J., Moore, M. J., Li, D. Z., Yi, T. S. (2019). PGA: A software package for rapid, accurate, and flexible batch annotation of plastomes. Plant Methods 15, 1–12. doi: 10.1186/s13007-019-0435-7
Raubeson, L. A., Jansen, R. K. (1992). Chloroplast DNA evidence on the ancient evolutionary split in vascular land plants. Science 255, 1697–1699. doi: 10.1126/science.255.5052.1697
Ruhlman, T. A., Zhang, J., Blazier, J. C., Sabir, J. S., Jansen, R. K. (2017). Recombination-dependent replication and gene conversion homogenize repeat sequences and diversify plastid genome structure. Am. J. Bot. 104, 559–572. doi: 10.3732/ajb.1600453
Saunders, R. M. K., Guo, X., Tang, C. C. (2020). Friesodielsia subaequalis (Annonaceae) a new nomenclatural combination following conservation of the generic name against Schefferomitra. Phytotaxa 464, 183–184. doi: 10.11646/phytotaxa.464.2.5
Sinn, B. T., Sedmak, D. D., Kelly, L. M., Freudenstein, J. V. (2018). Total duplication of the small single copy region in the angiosperm plastome: rearrangement and inverted repeat instability in Asarum. Am. J. Bot. 105, 71–84. doi: 10.1002/ajb2.1001
Stamatakis, A. (2014). RaxML version 8: A tool for phylogenetic analysis and post-analysis of large phylogeies. Bioinformatics 30, 1312–1313. doi: 10.1093/bioinformatics/btu033
Swofford, D. L. (2002). PAUP*: Phylogenetic analysis using parsimony (and other methods), version 4 (Sunderland, MA: Sinauer Associates).
Tang, C. C., Thomas, D. C., Saunders, R. M. K. (2015). Molecular phylogenetics of the species-rich angiosperm genus Goniothalamus (Annonaceae) inferred from nine chloroplast DNA regions: Synapomorphies and putative correlated evolutionary changes in fruit and seed morphology. Mol. Phylogenet. Evol. 92, 124–139. doi: 10.1016/j.ympev.2015.06.016
Thomas, D. C., Surveswaran, S., Xue, B., Sankowsky, G., Mols, J. B., Keßler, P. J., et al. (2012). Molecular phylogenetics and historical biogeography of the Meiogyne-Fitzalania clade (Annonaceae): Generic paraphyly and late Miocene-Pliocene diversification in Australasia and the Pacific. Taxon 61, 559–575. doi: 10.1002/tax.613006
Tillich, M., Lehwark, P., Pellizzer, T., Ulbricht-Jones, E. S., Fischer, A., Bock, R., et al. (2017). GeSeq-versatile and accurate annotation of organelle genomes. Nucleic Acids Res. 45, W6–W11. doi: 10.1093/nar/gkx391
Tonti-Filippini, J., Nevill, P. G., Dixon, K., Small, I. (2017). What can we do with 1000 plastid genomes? Plant J. 90, 808–818. doi: 10.1111/tpj.13491
Wang, Q. L., Zhang, H., Shao, Y. Y., Wang, Z. N., Xue, B. (2021). A second species of Pseuduvaria in China the identity of the enigmatic species Meiogyne kwangtungensis. PhytoKeys 172, 1–15. doi: 10.3897/phytokeys.172.61025
Weng, M. L., Ruhlman, T. A., Jansen, R. K. (2017). Expansion of inverted repeat does not decrease substitution rates in Pelargonium plastid genomes. New Phytol. 214, 842–851. doi: 10.1111/nph.14375
Wu, S., Chen, J., Li, Y., Liu, A., Li, A., Yin, M., et al. (2021). Extensive genomic rearrangements mediated by repetitive sequences in plastomes of Medicago and its relatives. BMC Plant Biol. 21, 1–16. doi: 10.1186/s12870-021-03202-3
Xue, B., Ding, H. B., Yao, G., Shao, Y. Y., Fan, X. J., Tan, Y. H. (2020). From Polyalthia to Polyalthiopsis (Annonaceae) transfer of species enlarges a previously monotypic genus. PhytoKeys 148, 71–91. doi: 10.3897/phytokeys.148.50929
Xue, B., Guo, X., Landis, J. B., Sun, M., Tang, C. C., Soltis, P. S., et al. (2019). Accelerated diversification correlated with functional traits shapes extant diversity of the early divergent angiosperm family Annonaceae. Mol. Phylogenet. Evol. 142, 106659. doi: 10.1101/652065
Xue, B., Nurmawati, S., Xu, Y., Li, Y. Q. (2021). Excluding the species Monoon fragrans (Annonaceae) from the flora of China. Phytotaxa 487, 91–96. doi: 10.11646/phytotaxa.487.1.8
Zhang, J. Y., Liao, M., Cheng, Y. H., Feng, Y., Ju, W. B., Deng, H. N., et al. (2022). Comparative chloroplast genomics of seven endangered Cypripedium species and phylogenetic relationships of Orchidaceae. Front. Plant Sci. 13. doi: 10.3389/fpls.2022.911702
Zhou, X. M., Zhao, J., Yang, J. J., Le Péchon, T., Zhang, L., He, Z. R., et al. (2022). Plastome structure, evolution, and phylogeny of Selaginella. Mol. Phylogenet. Evol. 169, 107410. doi: 10.1016/j.ympev.2022.107410
Zhu, M., Feng, P. P., Ping, J. Y., Li, J. Y., Su, Y. J., \Wang, T. (2021). Phylogenetic significance of the characteristics of simple sequence repeats at the genus level based on the complete chloroplast genome sequences of Cyatheaceae. Ecol. Evol. 11, 14327–14340. doi: 10.1002/ece3.8151
Keywords: Annonaceae, plastomes, phylogeny, IR expansion, repetitive sequences
Citation: Ping J, Hao J, Wang T and Su Y (2024) Comparative analysis of plastid genomes reveals rearrangements, repetitive sequence features, and phylogeny in the Annonaceae. Front. Plant Sci. 15:1351388. doi: 10.3389/fpls.2024.1351388
Received: 06 December 2023; Accepted: 02 April 2024;
Published: 17 April 2024.
Edited by:
Michael L. Moody, The University of Texas at El Paso, United StatesReviewed by:
Joseph Charboneau, University of Michigan, United StatesShiou Yih Lee, INTI International University, Malaysia
Copyright © 2024 Ping, Hao, Wang and Su. This is an open-access article distributed under the terms of the Creative Commons Attribution License (CC BY). The use, distribution or reproduction in other forums is permitted, provided the original author(s) and the copyright owner(s) are credited and that the original publication in this journal is cited, in accordance with accepted academic practice. No use, distribution or reproduction is permitted which does not comply with these terms.
*Correspondence: Ting Wang, tingwang@scau.edu.cn; Yingjuan Su, suyj@mail.sysu.edu.cn