 Qiuliang Huang1
 Haoyang Liu1Changshun Li1,2Xiaoru Zhu3
 Zongsheng Yuan4Jialiang Lai1Minghui Cao1Zhenbei Huang1Yushan Yang1Shenglan Zhuo1
 Zengwei Lü1
 Guofang Zhang1*
- 1College of Forestry, Fujian Agriculture and Forestry University, Fuzhou, Fujian, China
- 2Service Center, Fujian Meteorological Bureau, Fuzhou, Fujian, China
- 3Project Department, Norite International Construction Group Co., Xi’an, Shaanxi, China
- 4Institute of Oceanography, Minjiang University, Fuzhou, Fujian, China
Introduction: Arid and semi-arid regions are climate-sensitive areas, which account for about 40% of the world’s land surface area. Future environment change will impact the environment of these area, resulting in a sharp expansion of arid and semi-arid regions. Cotoneaster multiflorus is a multi-functional tree species with extreme cold, drought and barren resistance, as well as ornamental and medicinal functions. It was found to be one of the most important tree species for ecological restoration in arid and semi-arid areas. However, bioclimatic factors play an important role in the growth, development and distribution of plants. Therefore, exploring the response pattern and ecological adaptability of C. multiflorus to future climate change is important for the long-term ecological restoration of C. multiflorus in arid and semi-arid areas.
Methods: In this study, we predicted the potential distribution of C. multiflorus in China under different climate scenarios based on the MaxEnt 2.0 model, and discussed its adaptability and the major factors affecting its geographical distribution.
Results: The major factors that explained the geographical distribution of C. multiflorus were Annual precipitation (Bio12), Min air temperature of the coldest month (Bio6), and Mean air temperature of the coldest quarter (Bio11). However, C. multiflorus could thrive in environments where Annual precipitation (Bio12) >150 mm, Min air temperature of the coldest month (Bio6) > -42.5°C, and Mean air temperature of the coldest quarter (Bio11) > -20°C, showcasing its characteristics of cold and drought tolerance. Under different future climate scenarios, the total suitable area for C. multiflorus ranged from 411.199×10⁴ km² to 470.191×10⁴ km², which was 0.8~6.14 percentage points higher than the current total suitable area. Additionally, it would further shift towards higher latitude.
Discussion: The MaxEnt 2.0 model predicted the potential distribution pattern of C. multiflorus in the context of future climate change, and identified its ecological adaptability and the main climatic factors affecting its distribution. This study provides an important theoretical basis for natural vegetation restoration in arid and semi-arid areas.
1 Introduction
Since the last interglacial period, multiple global climate fluctuations have profoundly affected the vegetation and ice cover volume in most regions on the world (Zhang et al., 2019). About 40% of the world’s land surface is arid or semi-arid, and with the continued warming in the second half of the 20th century, most parts of the world are experiencing a trend towards drought (Dai, 2011; Haile et al., 2019; Lan et al., 2022). The Millennium Drought in Australia from 2002 to 2009 (Van Dijk et al., 2013), the summer drought in Europe in 2003 (Ciais et al., 2005), the East African drought in 2011 (Lott et al., 2013), and the Mega-Drought in the Southwest United States from 2010 to 2012 (Gleick and Heberger, 2012) were examples for this trend. China is one of the countries with a large area of drought and water scarcity, and it faces serious water resource shortages. The arid and semi-arid areas of China cover a total area of 5.66 million square kilometers, accounting for about 58.6% of the country’s land area, mainly distributed in North China, Northwest China, Inner Mongolia, the Loess Plateau, and the most parts of Qinghai-Tibet Plateau (Yan and Gao, 2003).
It is crucial to select appropriate tree species and establish long-term ecological restoration plans for drought-prone and semi-arid regions by utilizing species distribution data and environmental information to generate niche-based models that explore and predict species’ response patterns to future climate change (Zhang et al., 2020; Subedi et al., 2023, 2024; Varol et al., 2022). The Maximum Entropy (Maxent) model is a density estimation and species distribution model (Phillips et al., 2006) that is one of the most effective and widely used methods for studying the impact of climate change on species habitat suitability (Araújo et al., 2019). It has high prediction accuracy, good generality, strong stability, and performs well with small sample sizes compared to other modeling methods (Elith et al., 2006; Khanum et al., 2013; Ji et al., 2020). The Maxent model can also provide an intuitive representation of species distribution areas at different time periods. In contrast, it is possible to identify the response patterns of the same species to different climate changes (Shi et al., 2022). The Maxent model has been widely used for species distribution modeling on Earth (Jiang et al., 2022; Huang et al., 2023; Lai et al., 2023; Zhao et al., 2023).
The concept of niche has been used to explain the spatial and temporal distribution, abundance, and resource utilization of species (Chase and Leibold, 2003; Peterson et al., 2011). The differences of niche among species determine the potential fundamental drivers of species coexistence and ecosystem functionality (Godoy et al., 2020). The two main characteristics of niche are niche breadth and niche overlap referred to species in community. Niche breadth measures the population’s ability to utilize resources, while niche overlap reflects the degree of similarity in the competition for environmental resources among different populations, providing references for community stability (Colwell and Futuyma, 1971; Gu et al., 2017; Hu et al., 2022). Therefore, in order to fully investigate the importance of plant-plant interactions in a changing environment, it is necessary to conduct field surveys and study based on niche, which helps us better understand species interactions, distribution, coexistence, and the underlying mechanisms, and provides theoretical basis for forest management and natural vegetation restoration.
The Cotoneaster genus, a relatively ancient and extensive genus with over 90 species, belongs to the Rosaceae family. It is mainly distributed in Asia and Europe, with more than 50 species found in China, most of which are native to the region (Monier et al., 1998; Chang and Jeon, 2003; Khan et al., 2009). The diversification of the Cotoneaster genus can be traced back to the early Miocene period, approximately 20 million years ago, and all existing species have evolved since the middle Miocene, around the same time (Yang et al., 2022). Cotoneaster species are notable for their widespread occurrence of apomixis, interspecific hybridization, and intraspecific morphological variation (Bartish et al., 2001; Meng et al., 2021). Among these, C. multiflorus is a shrub that belongs to the Maloideae subfamily of the Rosaceae family (Yang et al., 2022).
C. multiflorus is a multi-functional tree species that has not been fully explored. For example, numerous Cotoneaster species have gained popularity in garden landscapes due to their attractive leaves, colorful flowers, and vibrant fruits (Bartish et al., 2001; Liu X. P. et al., 2018). Besides, various types of Cotoneaster species are used to treat bronchitis, gastritis, vasculitis, wound infections, and as natural antioxidants (Palme et al., 1994; Khan et al., 2009; Liu R. H. et al., 2018). Moreover, with its extensive root system and tolerance to cold, drought, and poor soil, C. multiflorus serves as a pioneering tree species for vegetation restoration in arid and semi-arid loess hilly areas and rocky mountainous ecological transition zones (Kou, 2016) (Figure 1). However, evidence on C. multiflorus is still largely lacking, focusing mainly on breeding (Yu et al., 2018; Sun et al., 2020), introduction trials (Chen et al., 2021), extraction of constituents (Chang and Jeon, 2003; Jia, 2022), molecular-level classification (Yang et al., 2022), and morphological studies (Ding et al., 2007; Niaki et al., 2019). Also, much less is known about the current distribution, future response to global climate change, community structure, and ecological adaptation of C. multiflorus. Therefore, we conducted field investigations and employed the ENMeval data package to assist in selecting the MaxEnt model. The study aimed at predicting the potential distribution of C. multiflorus under the context of climate change, and identity the primary climatic factors that restrict its distribution, as well as its ecological adaptability. This study will provide novel evidence for developing effective policy for ecological restoration in arid and semi-arid areas.
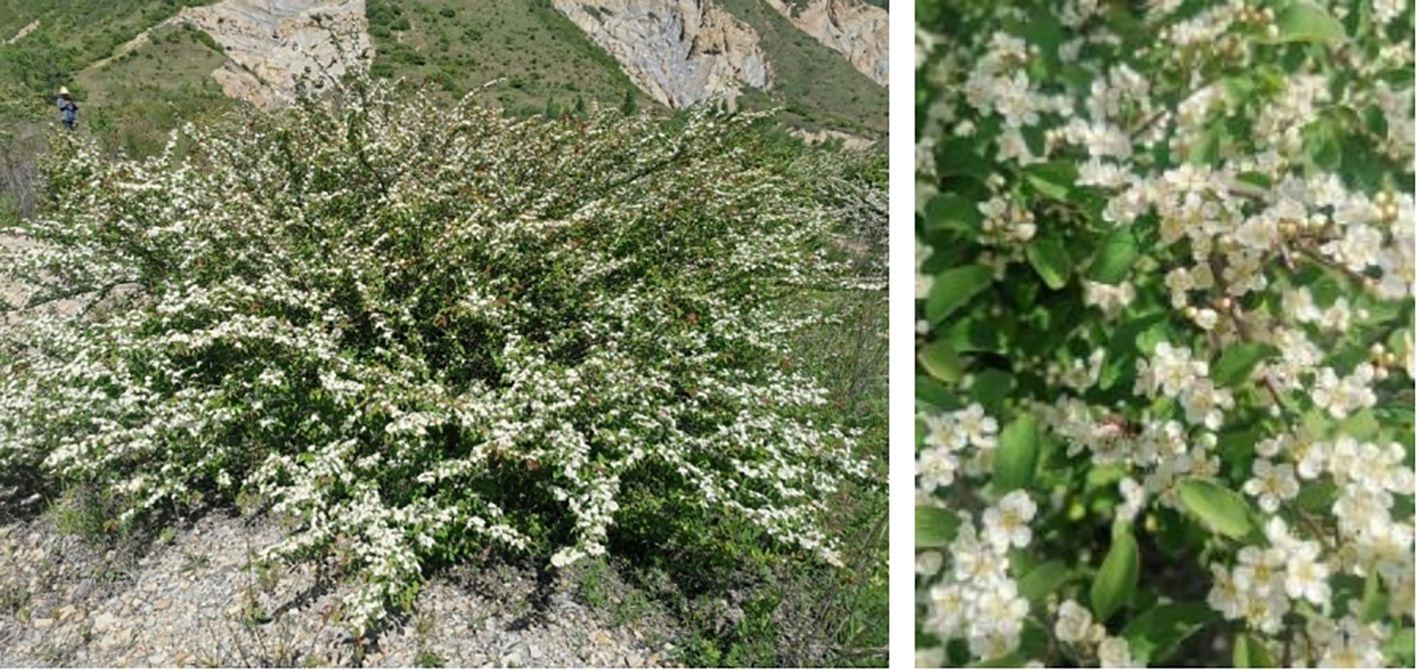
Figure 1 Cotoneaster multiflorus growing on bedrock.
2 Materials and methods
2.1 The study area
According to “Flora of China”, C. multiflorus is widely distributed in China, with its natural range extending from the northern part of Altay Prefecture in Xinjiang Uygur Autonomous Region to the southwestern part of Yunnan Province, and from the western end of Wanda Mountains in the eastern part of Heilongjiang Province to the western end of Bortala Mongolian Autonomous Prefecture, Xinjiang Uygur Autonomous Region. The natural distribution range of C. multiflorus is approximately 80°~130° E and 23°~48° N. To avoid overlooking potential suitable areas for C. multiflorus within China and to provide reference for future seed introduction, the study area was expanded to 72°~136° E and 0°~55° N (Figure 2).
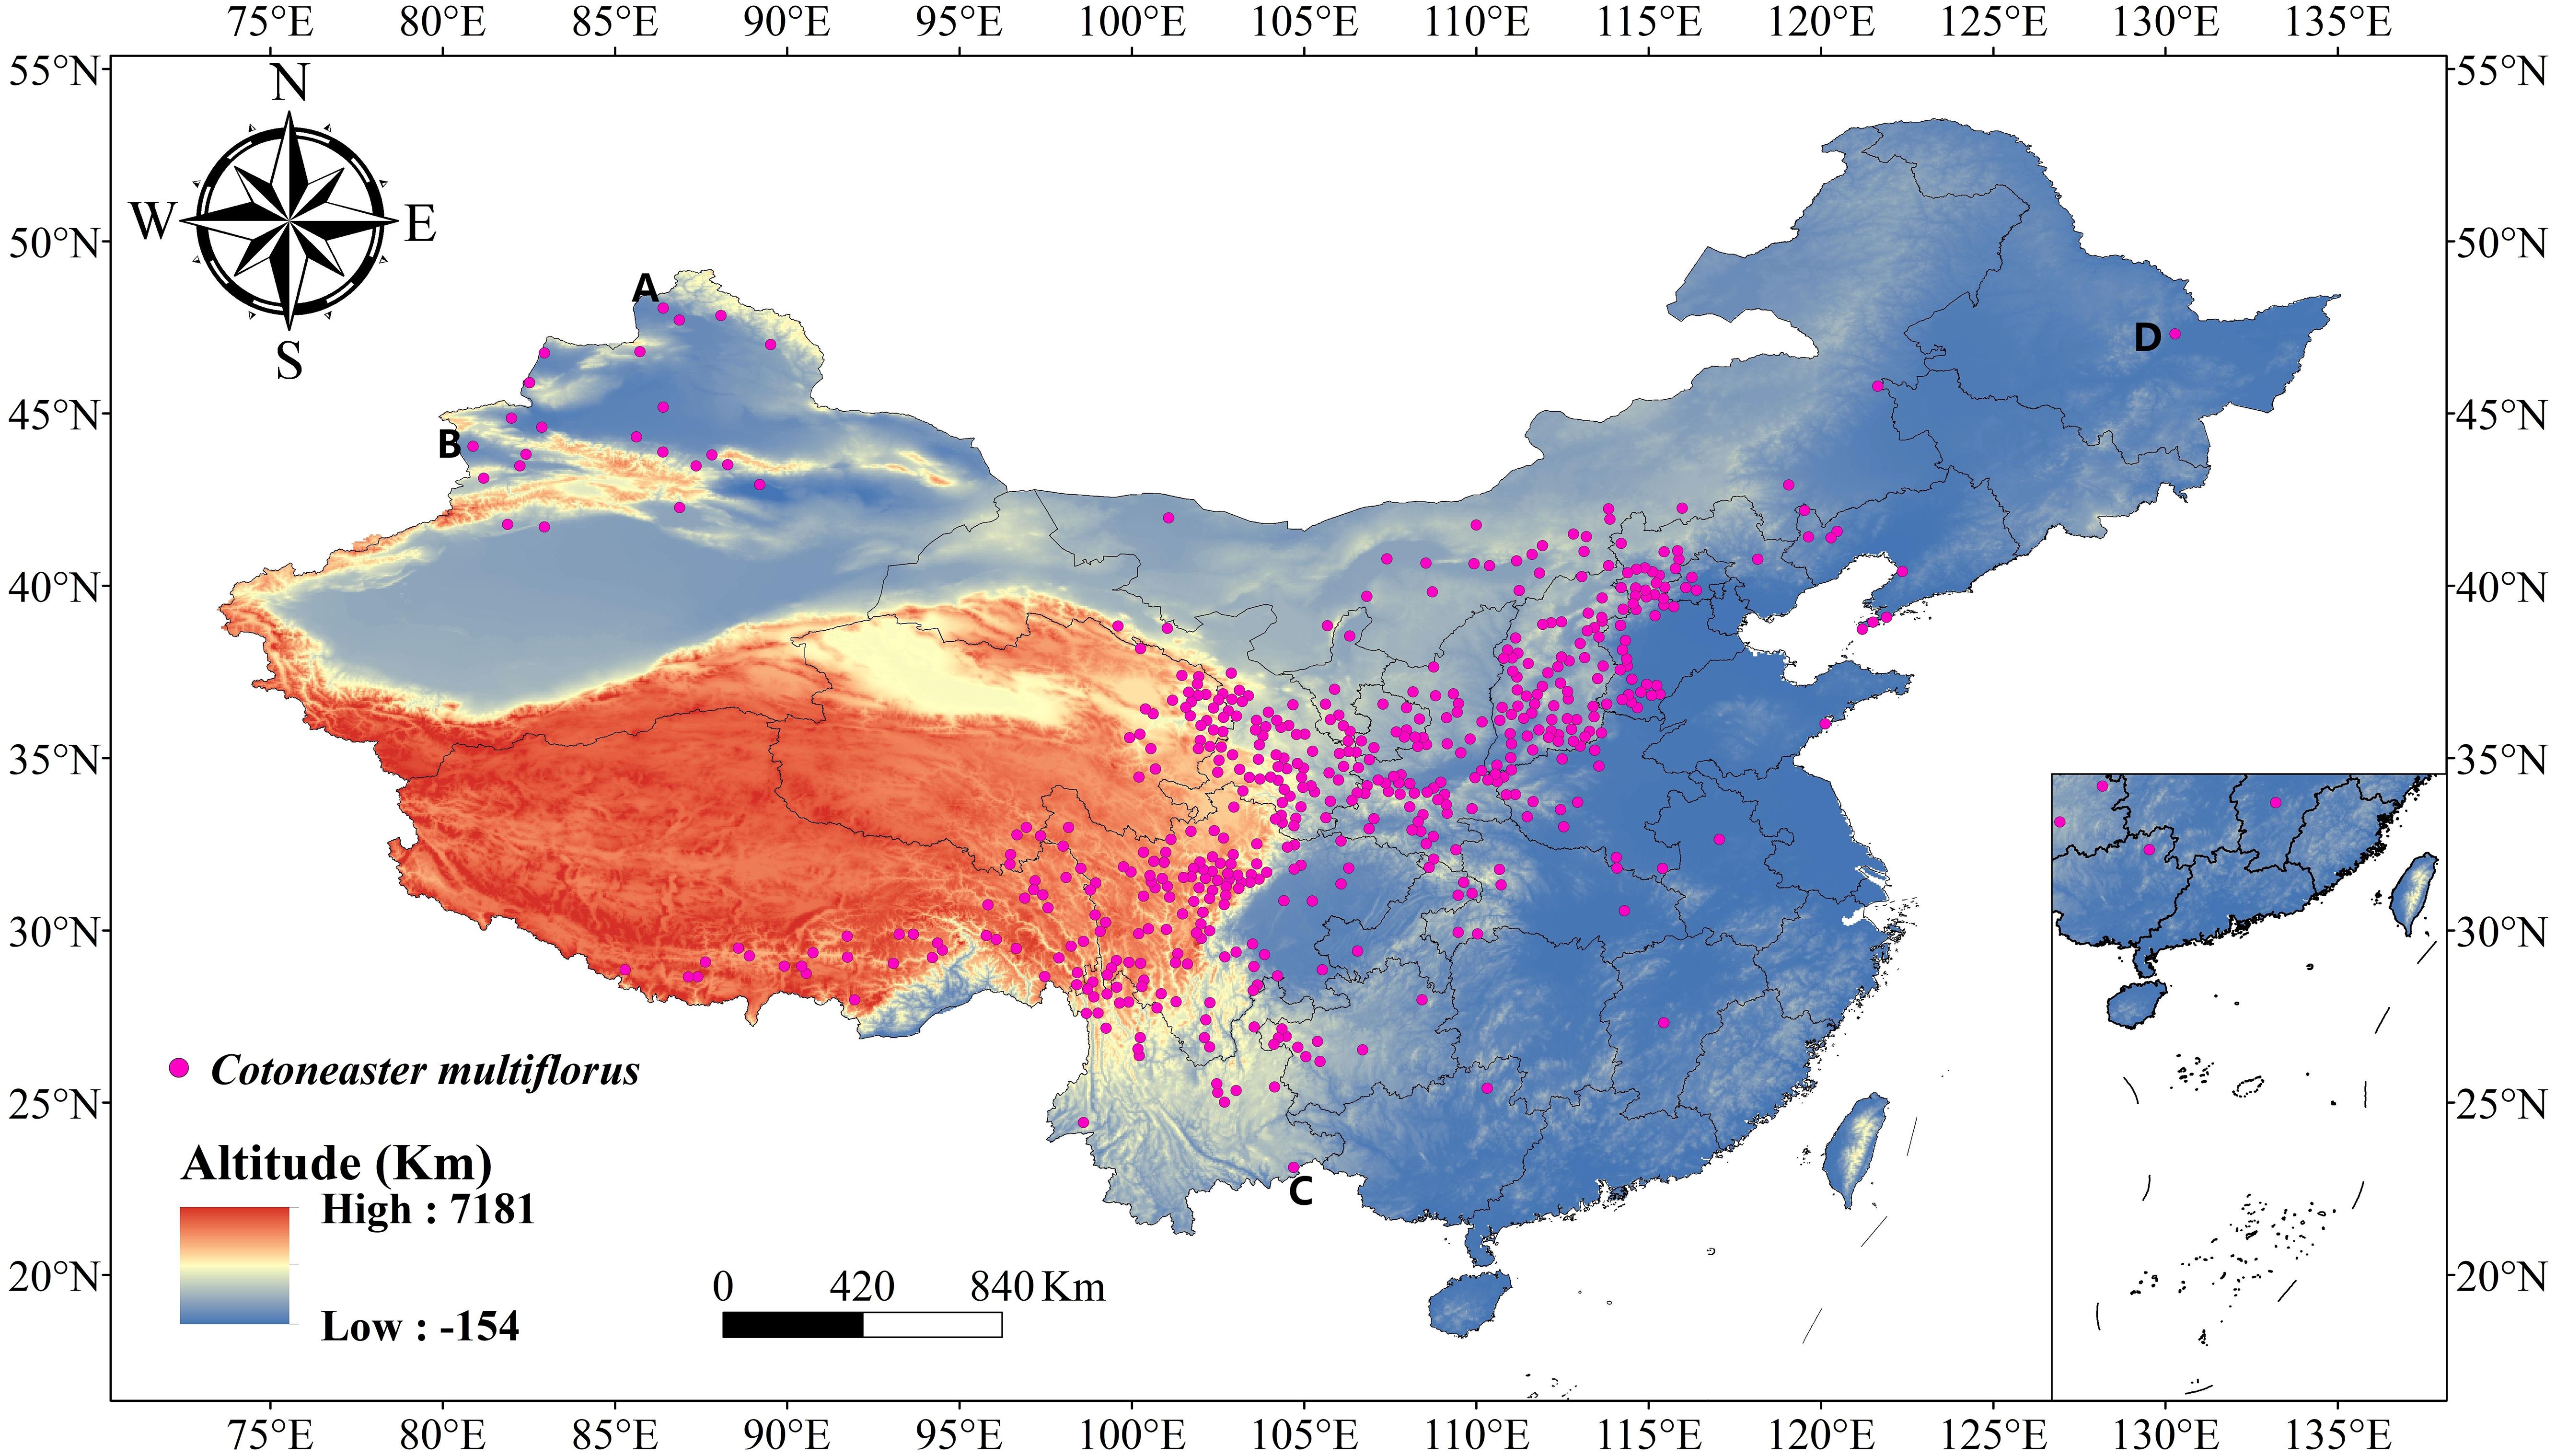
Figure 2 The distribution of C. multiflorus. (A) The northern part of Altay Prefecture in Xinjiang Uygur Autonomous Region; (B) The western end of Bortala Mongolian Autonomous Prefecture, Xinjiang Uygur Autonomous Region; (C) The southwestern part of Yunnan Province; (D) The western end of Wanda Mountains in eastern Heilongjiang Province.
2.2 Data on the distribution of C. multiflorus
The distribution data of C. multiflorus in this study were obtained from field surveys and databases. We conducted field surveys of natural populations of C. multiflorus in the Ningxia Hui Autonomous Region from March to July 2021, collecting 84 distribution records. Other distribution records were obtained by searching specimen and literature databases, including Global Biodiversity Information Facility (GBIF)1, National Specimen Infrastructure (NSII)2, Chinese Virtual Herbarium (CVH)3, Plant Species Information System4, China National Knowledge Infrastructure (CNKI) and Web of Science (SCI), as well as native flora, collecting 2,057 distribution records. A total of 2,141 distribution records were obtained in this study. To reduce model errors caused by clustering effects, we imported the C. multiflorus distribution point data into ArcGIS, removed artificially planted distribution points, ambiguous records, duplicate distribution points, and conducted buffer zone analysis (Li et al., 2016). Only one distribution point was retained within each 1 km × 1 km grid, resulting in a final set of 539 valid samples.
2.3 Data on environmental variables
The provincial administrative map of China used in this study was sourced from the National Basic Geographic Information System Database of China. Contemporary and future climate data [2050s (2041-2060), 2090s (2081-2100)] were obtained using BCC-CMN2-MR in Worldclim 2.1, including SSP1-RCP2.6 (SSP126), SSP2-RCP4.5 (SSP245), and SSP5-RCP8.5 (SSP585). ‘SSP’ represents Shared Socioeconomic Pathway, with SSP126, SSP245, and SSP585 representing low, middle, and high greenhouse gas emission scenarios respectively, while ‘RCP’ represents Representative Concentration Pathways (Popp et al., 2016). This study included seven climate backgrounds (Current, SSP126-2050s, SSP126-2090s, SSP245-2050s, SSP245-2090s, SSP585-2050s, SSP585-2090s), each containing 19 environmental variables with a spatial resolution of 2.5’. To avoid overfitting of the model, Pearson correlation analysis was used in SPSS 25.0 software to screen environmental variables. Environmental variables with |r|< 0.8 were retained, while those with |r| > 0.8 were selected based on their close relationship with C. multiflorus growth (Tang et al., 2021; Xu D. et al., 2019). Finally, 8 environmental variables were selected, as shown in Table 1.
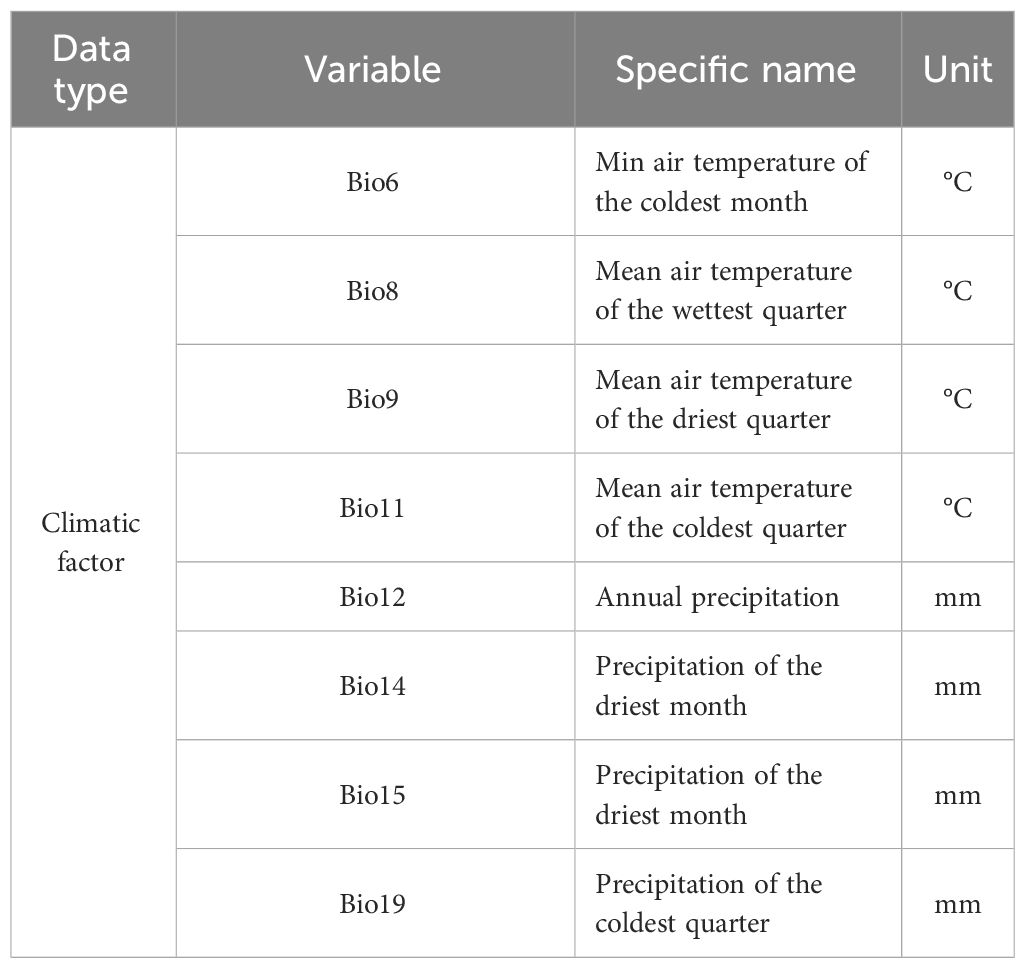
Table 1 Filtered environmental variables.
2.4 Model specification and accuracy evaluation
When optimizing the MaxEnt model by calling the ENMeval package in R software, adjusting the optimal values of the regularization multiplier (RM) and feature categories (FC) can significantly improve the prediction accuracy (Phillips and Dudík, 2008; Cobos et al., 2019; Kass et al., 2021). In this study, we used the EMNeval 2.0 program package in R v4.3.1 for parameter optimization, setting RM in the range of 0.1 to 6 with an interval of 0.5, resulting in a total of 13 regulation multipliers. We also used 10 FC: H, L, LQ, LQH, LQHP, and LQHPT, where L represents linear, Q represents quadratic, H represents hinge, P represents product, and T represents threshold. The ENMeval program package tested the above 78 parameter combinations, and the model fitting degree and complexity were determined using the delta AICc model based on the Akaike information criterion (Kuiper and Hoijtink, 2011). After determining the RM and FC parameter combinations, the collected C. multiflorus sample distribution points and environmental variables were imported into the MaxEnt software. 75% of the sample data was randomly selected as the training set, and 25% as the test set. The maximum number of iterations was set to 1000, and the performance of Bootstrap was repeated 10 times. Other MaxEnt parameters were set to default values.
The simulation accuracy was evaluated using the Receiver Operating Characteristic curve (ROC curve). The area enclosed by the ROC curve and the horizontal axis is the AUC (Area Under Curve) value. The range of AUC values is 0~1, with higher values indicating better prediction performance. Generally speaking, an AUC value less than 0.7 indicates poor prediction performance, 0.7~0.8 indicates relatively accurate, 0.8~0.9 very accurate, and 0.9~1 extremely accurate (Swets, 1988; Araújo et al., 2005; Mahmoodi et al., 2022).
2.5 Classification of suitable areas for C. multiflorus
The simulation result files were imported into ArcGIS software for classification of suitability areas. This study employed Jenks’ natural breaks grading method to divide the habitat of C. multiflorus into four levels: unsuitable area (0~0.1), low suitable area (0.1~0.3), medium suitable area (0.3~0.5), and highly suitable area (0.5~1) (Ren et al., 2020). Furthermore, using the ‘Overlay Analysis’ tool in ArcGIS 10.5, the contemporary suitable habitat of C. multiflorus was served as a reference to compare and define the following three scenarios based on changes in the range of C. multiflorus: (1) Retained suitable area: areas suitable in both contemporary and future periods; (2) Increased suitable area: areas currently unsuitable but suitable in the future; (3) Lost suitable area: areas currently suitable but unsuitable in the future. Area statistics and visual representation were conducted using ArcGIS 10.5 (Khwarahm, 2020).
2.6 Calculation of niche breadth and niche overlap
Importance value is a quantitative index used to characterize the status of species in the community. Great importance value means the species is dominant in the community (Feroz et al., 2008). After field investigation (supplementary 1), the main tree species with important value greater than 1% were selected for niche research. Niche overlap reflects the similarity in resource utilization among plants. A higher niche overlap index suggests greater similarity in resource requirements and increased competition (Yuan et al., 2021). Niche breadth was measured by Levins index (BL) and Shannon index (BS), niche overlap was measured by Pianka index (Oik). The calculation formulas were as follows in Equations 1–4 (Fang et al., 2009; Liu R. H. et al., 2018; Liu et al., 2006):
In the above formulas, Pij is the ratio of utilization of species i on resource position j to the total utilization of all resource positions, Pik is in the same way. r represents the total number of resource bits. The value domains of BL and BS are [1,r] and [0,1nr], respectively. Oik is the niche overlap index between species i and k, ranging from 0 to 1.
3 Results
3.1 Model accuracy evaluation
When FC=LQHPT and RM=2.5, the ΔAICc value reached its minimum (ΔAICc = 0) (Figure 3), indicating that the model with this parameter combination was the optimal one. Under these parameters, the result of MaxEnt prediction showed that the value of AUC was 0.875 (Figure 4).
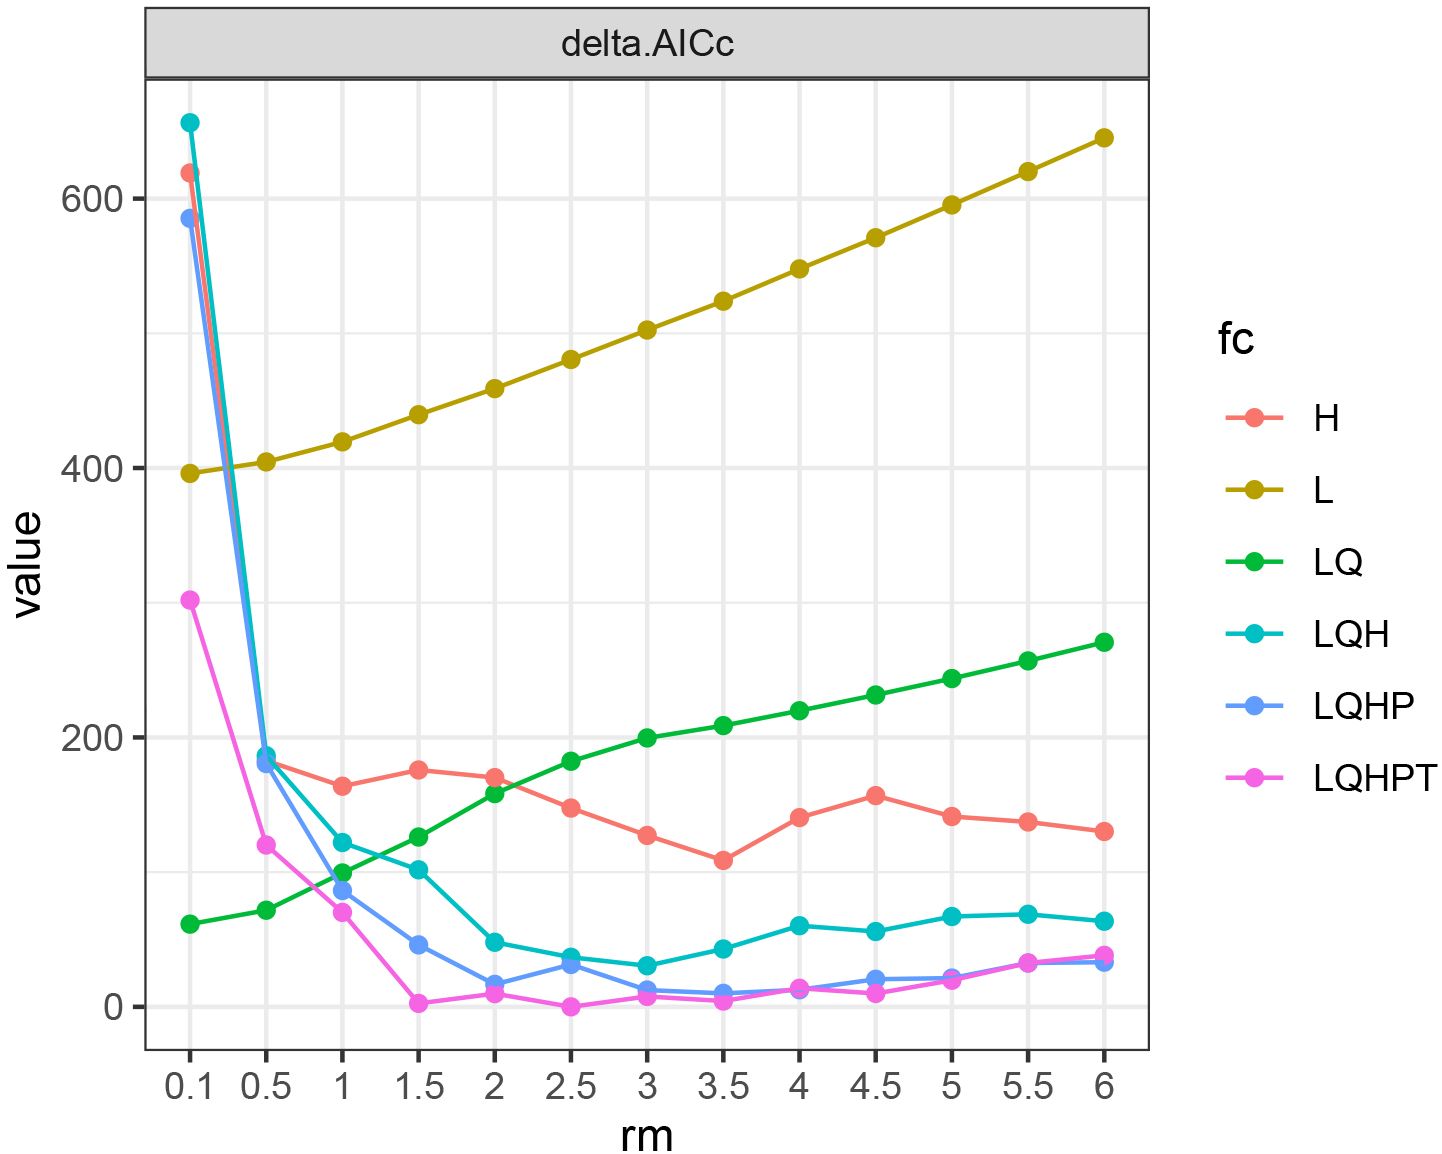
Figure 3 AICc value of parameter combinations based on the ENMeval calculation. fc, feature categories; rm, regularization multiplier; AICc, Akaike information criterion correction; L, linear; Q, quadratic; H, hinge; P, product; T, threshold. H, L, LQ, LQH, LQHP and LQHPT mean different feature categories. ΔAICc = 0 means the model with this parameter combination is the optimal one.
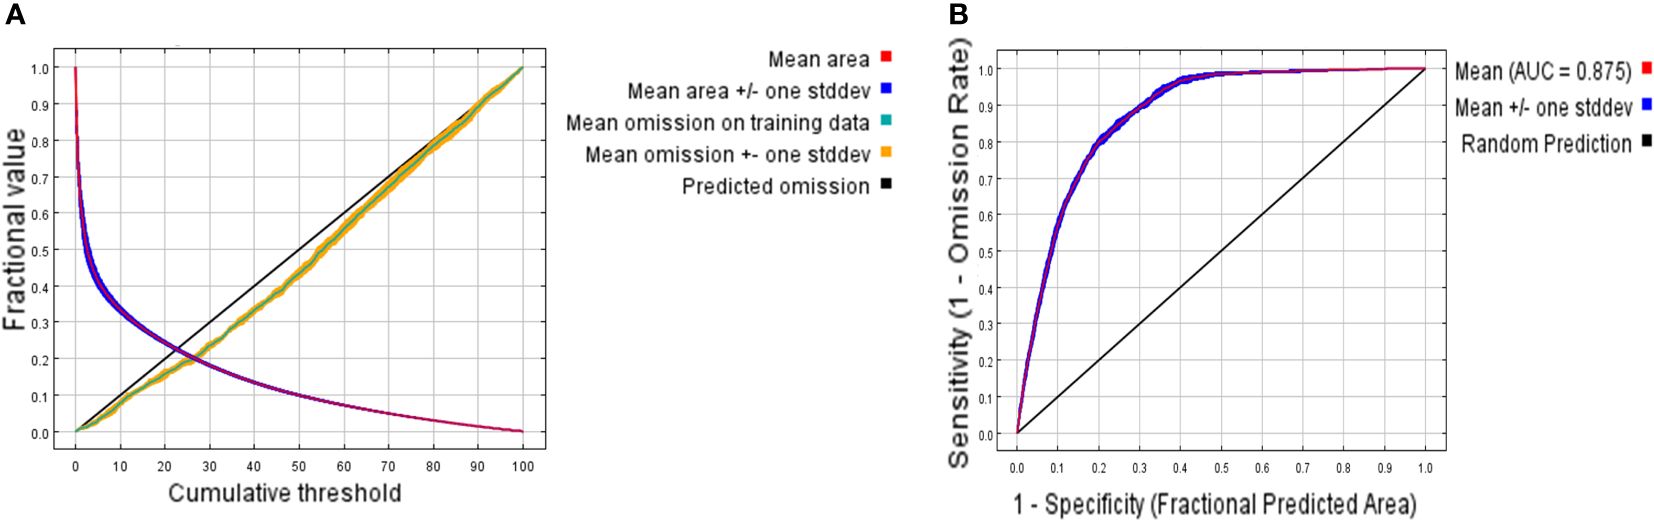
Figure 4 ROC curves of MaxEnt result. (A) The ROC verification curve of Maxent model; (B) Jackknife test of the importance of variables. The area enclosed by ROC curve and x axis is AUC (Area Under Curve) value. High AUC values indicate better prediction performance.
3.2 Analysis of environmental variables affecting potential distribution of C. multiflorus
According to Table 2, the top five contributing environmental variables were Annual precipitation (Bio12, 32.9%), Mean air temperature of the coldest quarter (Bio11, 25.0%), Min air temperature of the coldest month (Bio6, 13.8%), Precipitation of the coldest quarter (Bio19, 11.4%), and Precipitation of the driest month (Bio14, 6.2%), totaling 89.3%. The permutation importance ranked the top five environmental variables as Annual precipitation (Bio12, 37.6%), Mean air temperature of the coldest quarter (Bio11, 20.0%), Precipitation of the coldest quarter (Bio19, 14.4%), Precipitation of the driest month (Bio14, 11.0%), and Min air temperature of the coldest month (Bio6, 8.1%), totaling 91.1%.
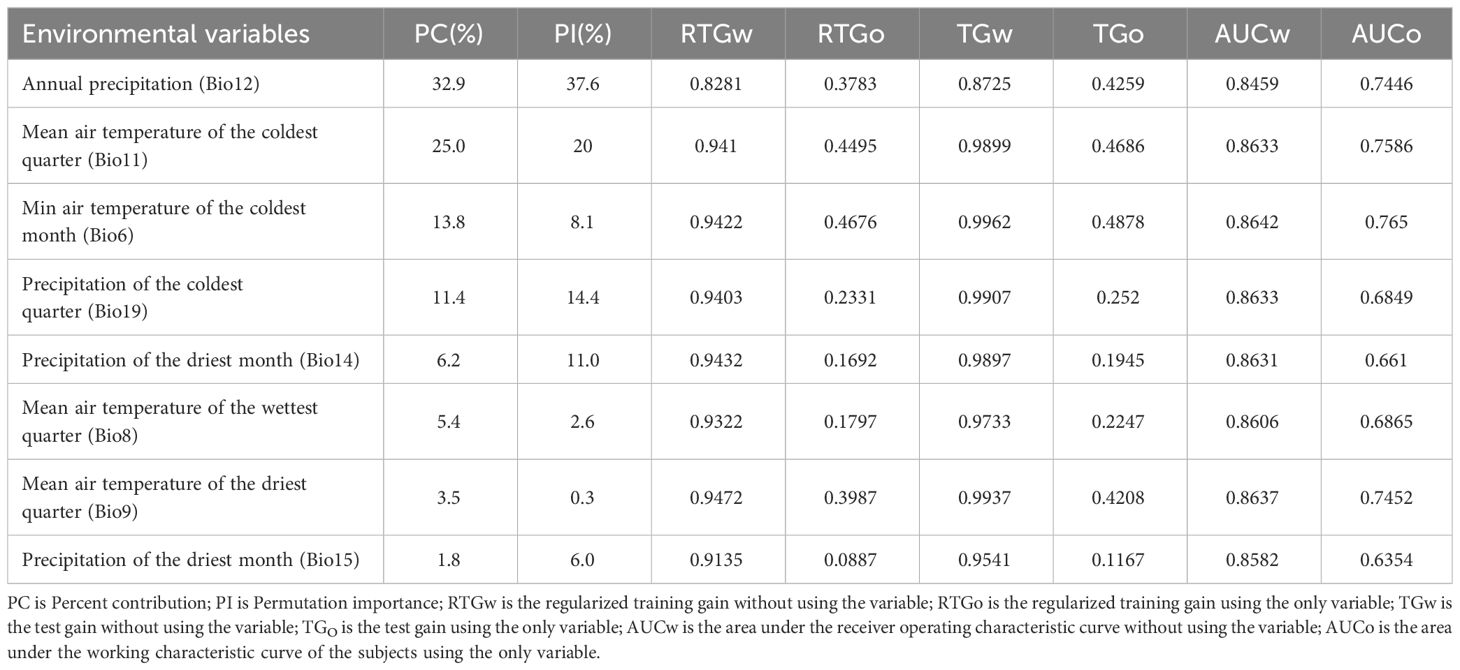
Table 2 Various parameters of the main environmental variables of C. multiflorus.
The Jackknife test (Figure 5) showed that when individual environmental variables were sequentially excluded, the model’s regularized training gain, test gain, and AUC values decreased most notably for Annual precipitation (Bio12), Precipitation of the driest month (Bio15), and Mean air temperature of the wettest quarter (Bio8). When using only individual variables, the top three with the highest regularized training gain and AUC value gains included Min air temperature of the coldest month (Bio6), Mean air temperature of the coldest quarter (Bio11), and Mean air temperature of driest quarter (Bio9), while the top three with the highest test gain included Min air temperature of the coldest month (Bio6), Mean air temperature of the coldest quarter (Bio11), and Annual precipitation (Bio12).
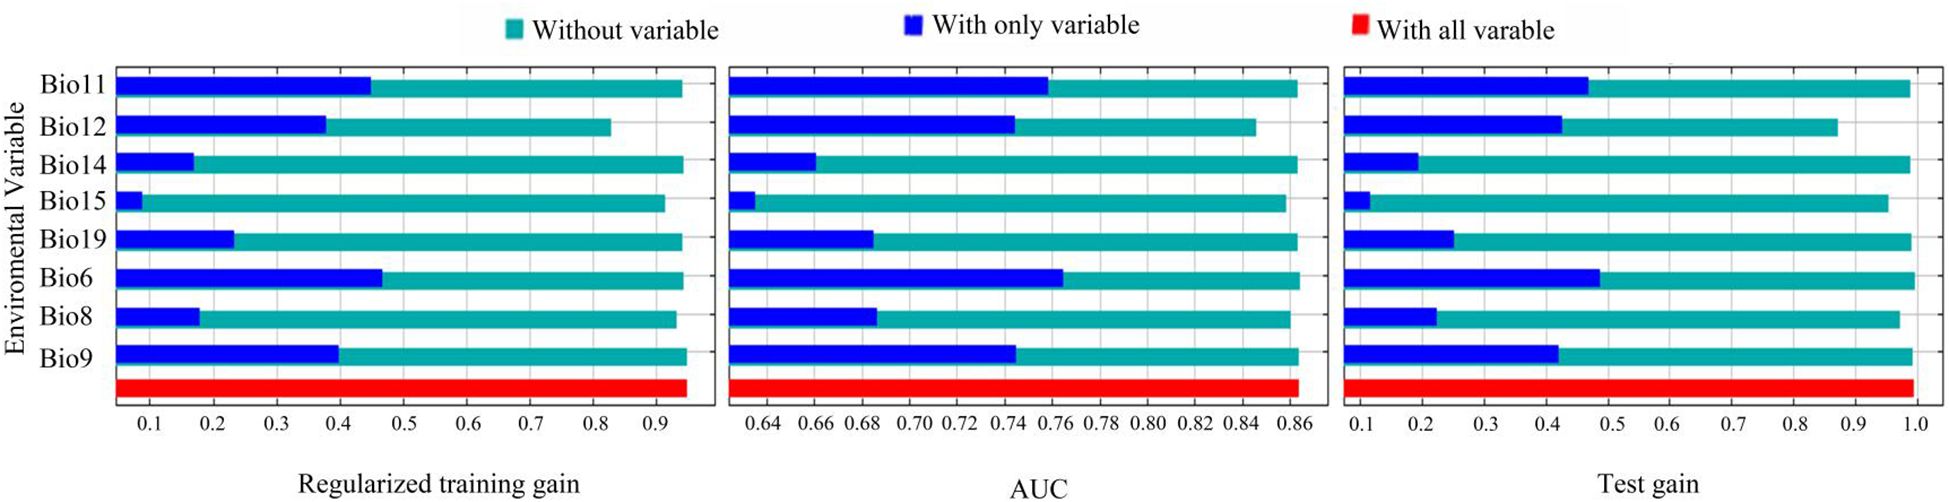
Figure 5 The environmental variables that have the most impact on C. multiflorus. Bio11: Mean air temperature of the coldest quarter; Bio12: Annual precipitation; Bio14: Precipitation of the driest month; Bio15: Precipitation of the driest month; Bio19: Precipitation of the coldest quarter; Bio6: Min air temperature of the coldest month; Bio8: Mean air temperature of the wettest quarter; Bio9: Mean air temperature of the driest quarter.
The response curves of main environmental variables (Figure 6) indicated that C. multiflorus could thrive in environments with Annual precipitation (Bio12) greater than 150 mm, Min air temperature of the coldest month (Bio6) higher than -42.5°C, and Mean air temperature of the coldest quarter (Bio11) higher than -20°C.
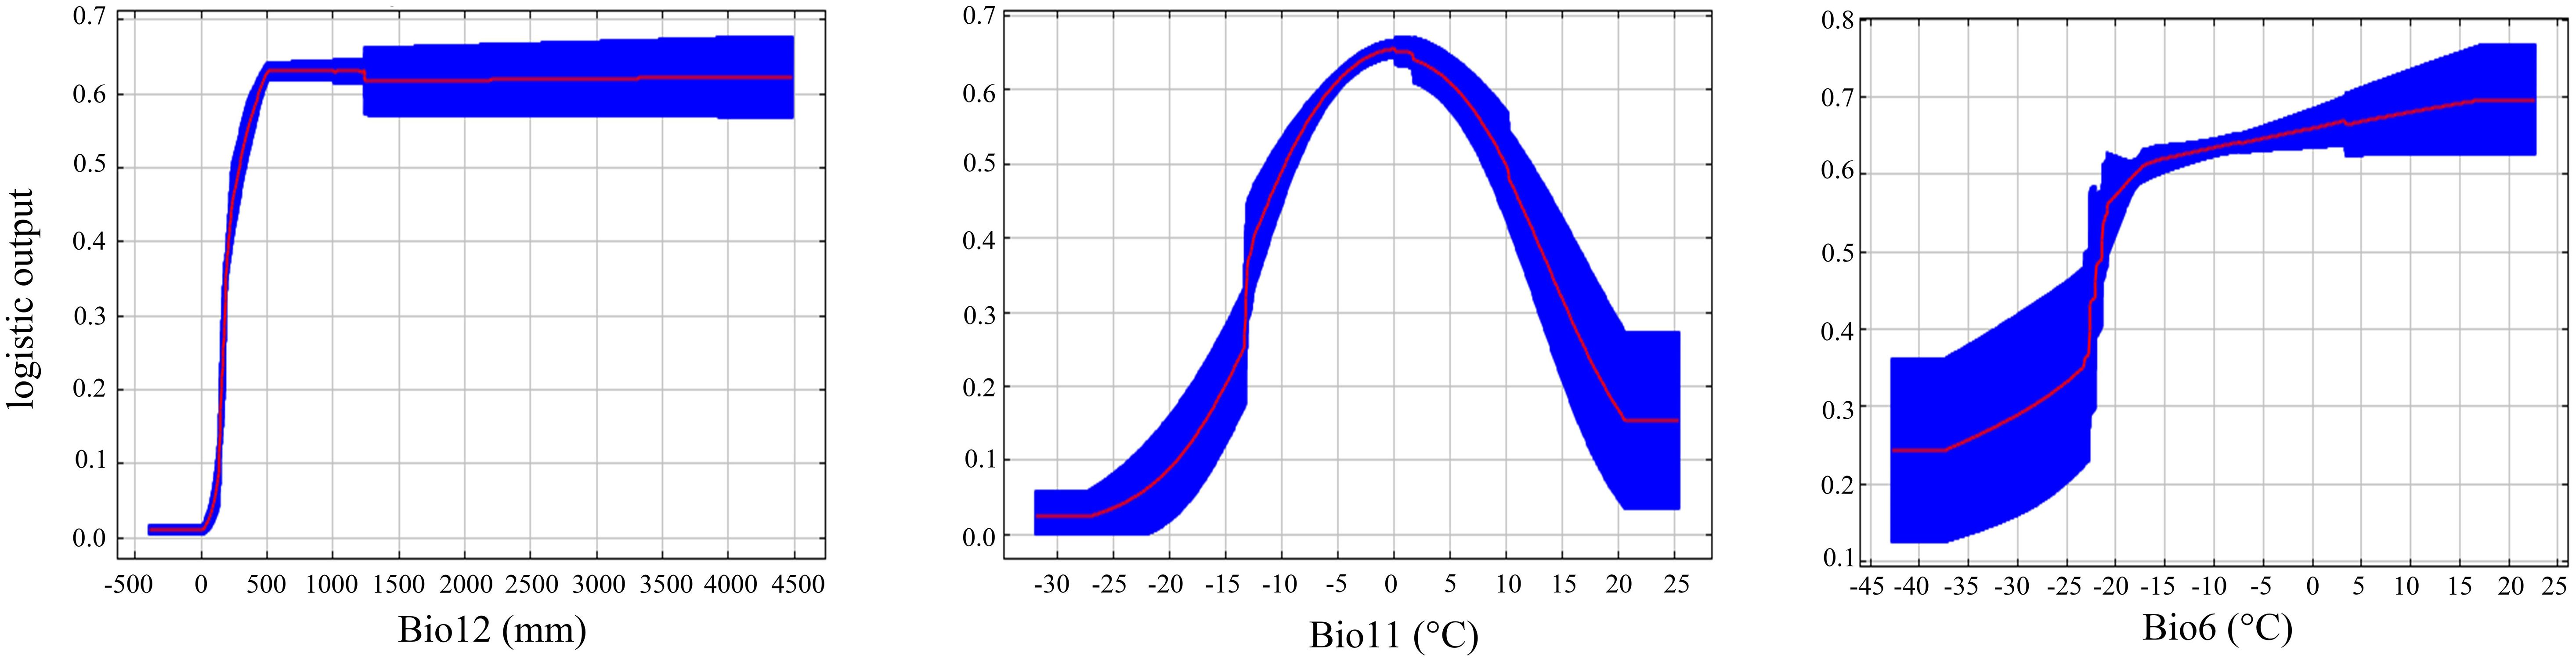
Figure 6 Suitable range of C. multiflorus for environmental variables. Bio11: Mean air temperature of the coldest quarter; Bio12: Annual precipitation; Bio14: Precipitation of the driest month; Bio15: Precipitation seasonality; Bio19: Precipitation of the coldest quarter; Bio6: Min air temperature of the coldest month; Bio8: Mean air temperature of the wettest quarter; Bio9: Mean air temperature of the driest quarter.
3.3 Geographical distribution of C. multiflorus under different climate scenarios
The prediction results of the MaxEnt model (Figure 7) showed that the current potential suitable area of C. multiflorus was much larger than the actual collection distribution range (Figures 1, 7). The total suitable area of C. multiflorus during this period was 411.20 × 10⁴ km2, accounting for 42.83% of the total area of the country (Table 3). The highly suitable areas were mainly distributed in a few areas of Shaanxi, Shanxi, southern Ningxia, southern Gansu, northern Sichuan, Xinjiang Uygur Autonomous Region, and Tibet Autonomous Region, concentrated in arid, semi-arid, and semi-humid areas on both sides of the isohyet of 400 mm (Figure 7), indicating that C. multiflorus had strong adaptability and a wide distribution. The highly, medium and low suitable areas accounted for 24.82%, 36.19% and 38.99% of the total suitable area, respectively.
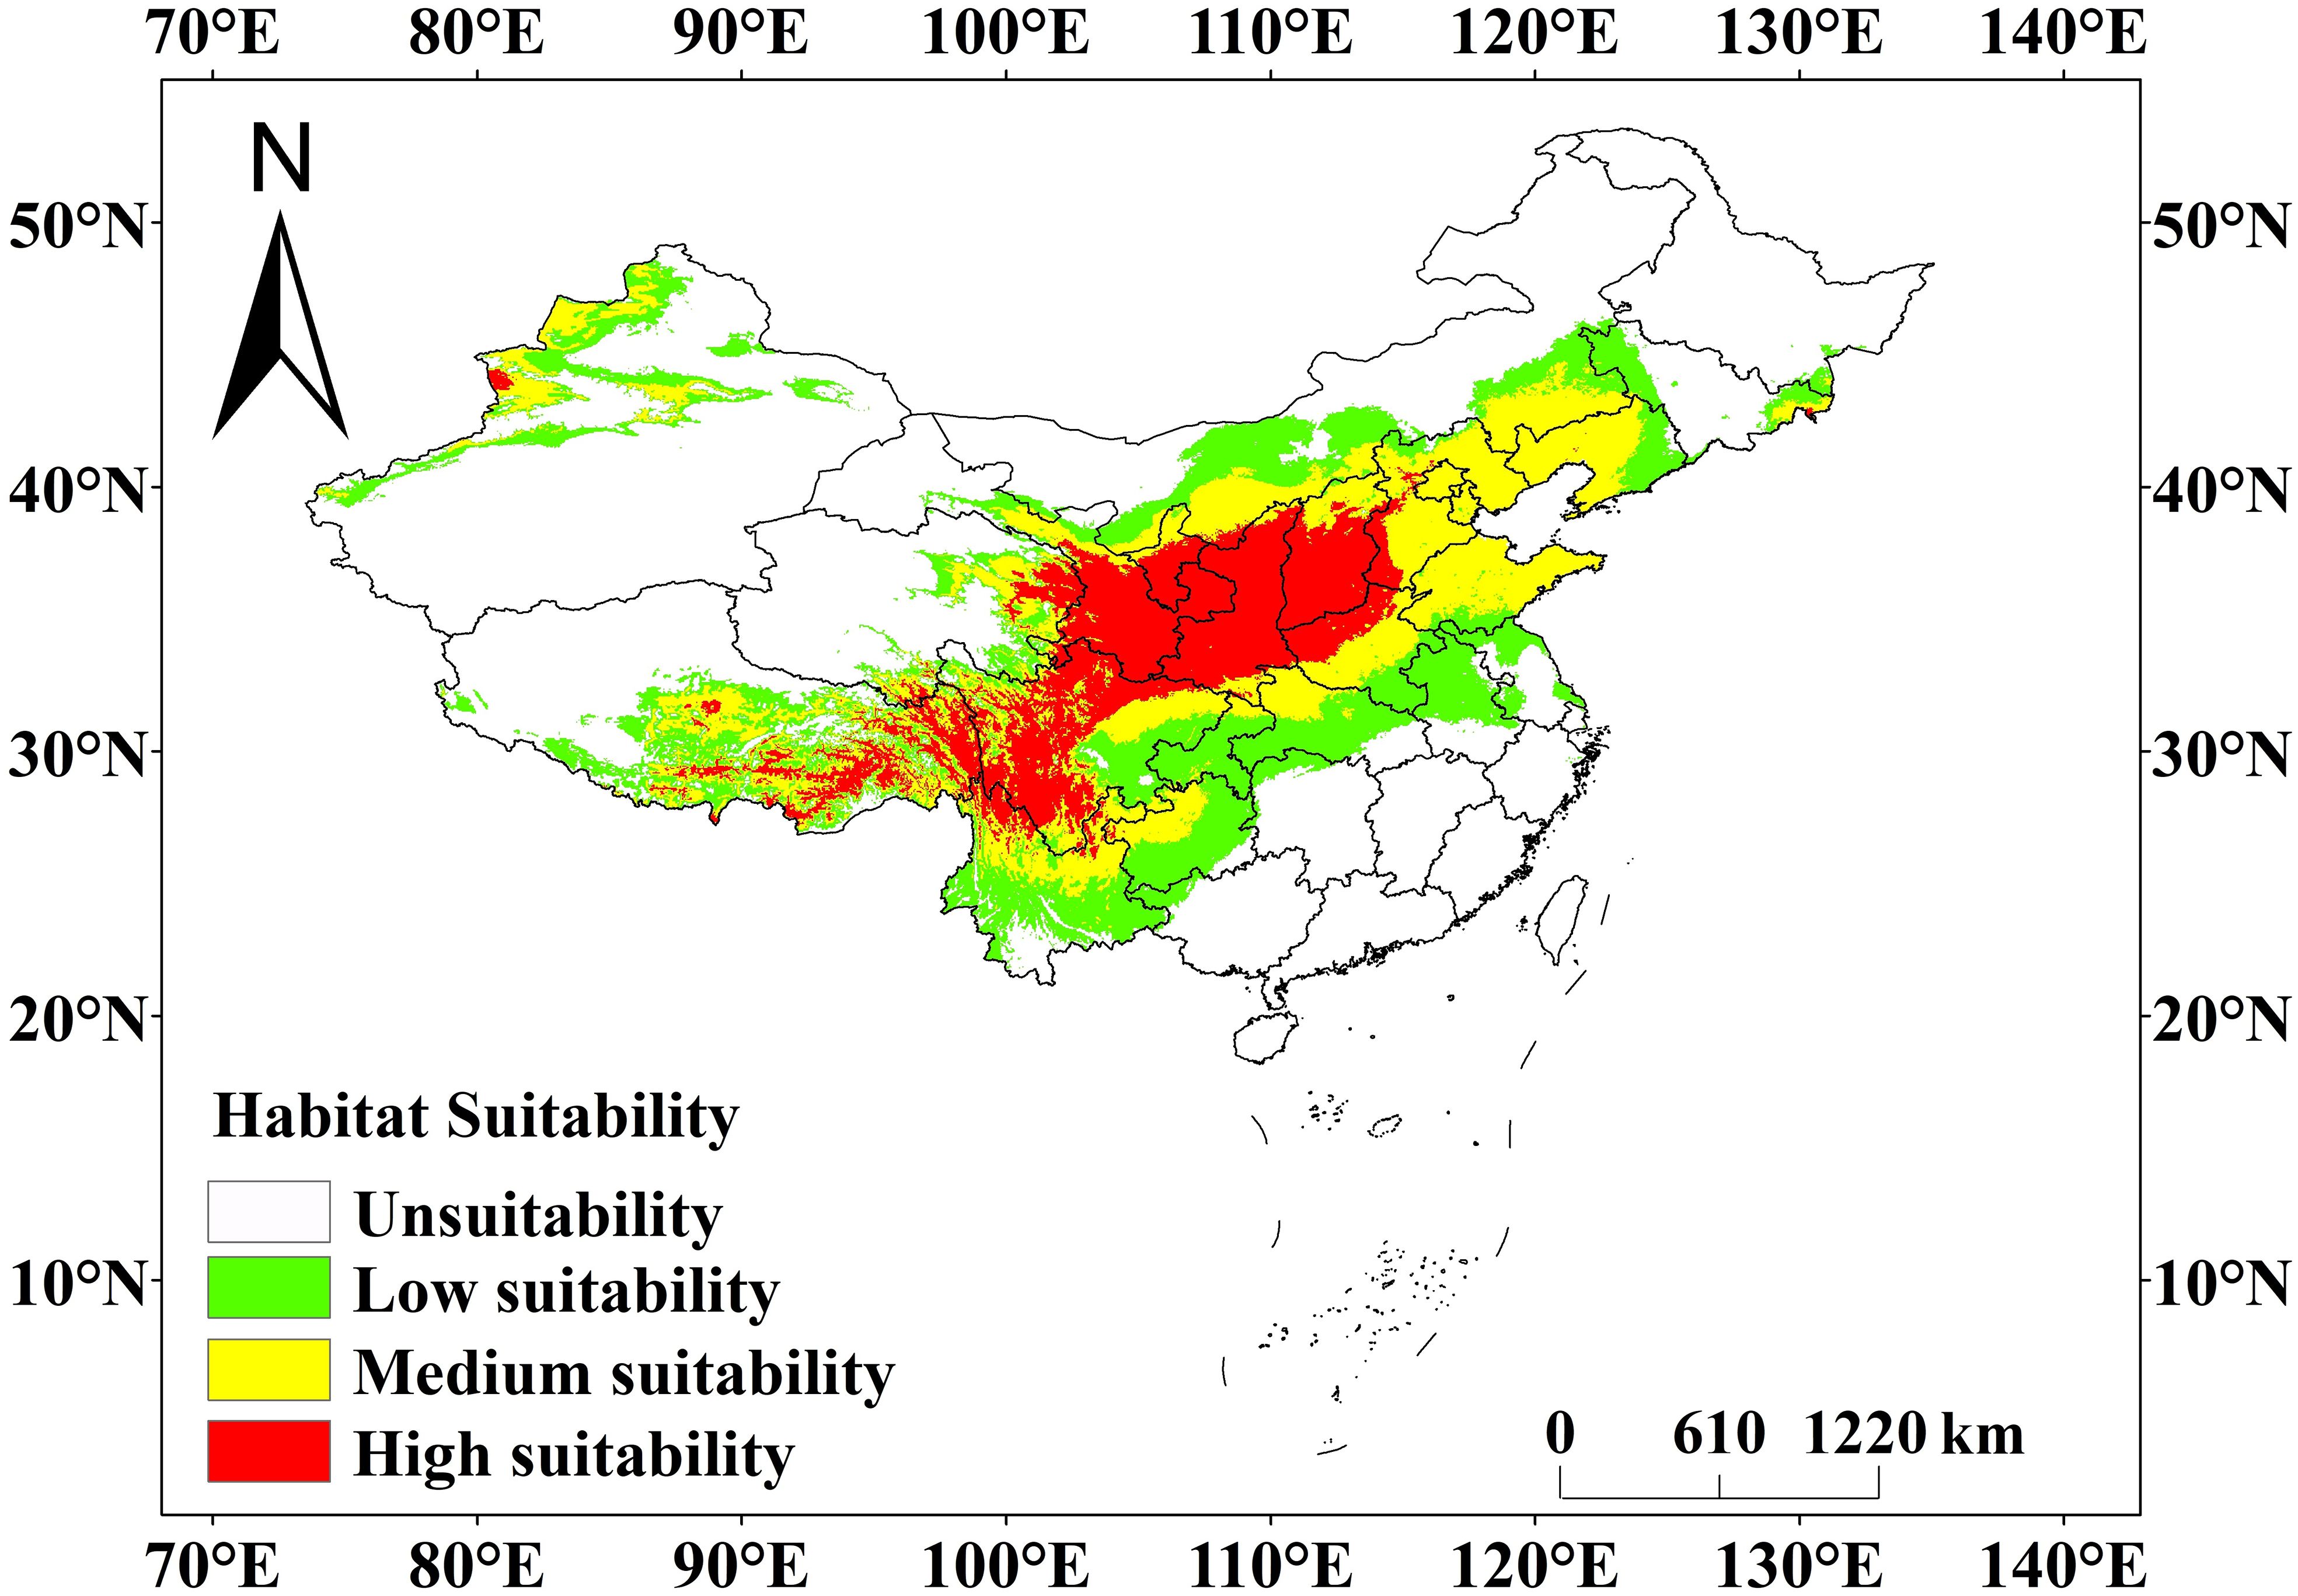
Figure 7 Prediction of current geographical distribution pattern of C. multiflorus by MaxEnt model. This study employed Jenks’ natural breaks grading method to divide the habitat of C. multiflorus into four levels: unsuitable area (0~0.1), low suitable area (0.1~0.3), medium suitable area (0.3~0.5), and highly suitable area (0.5~1).
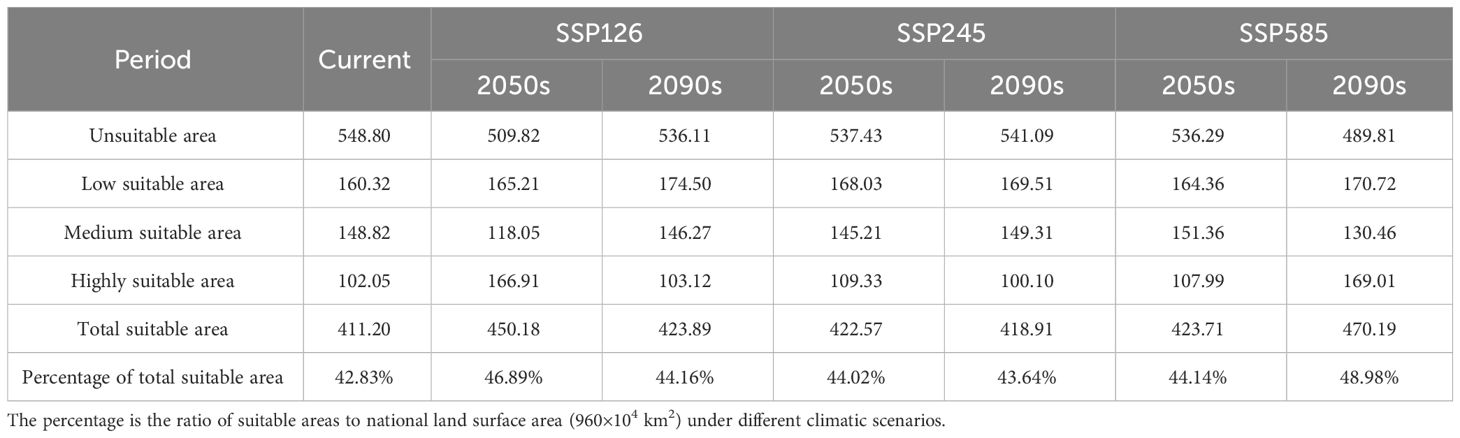
Table 3 The change of suitable areas of C. multiflorus in different periods (unit: ×104 km2).
From the results of predicting suitable areas for C. multiflorus under future climate scenarios (Figure 8; Table 3), it can be seen that in the 2050s, the total suitable area of C. multiflorus under SSP126, SSP245, and SSP585 slightly increased. It is worth noting that the highly and medium suitable area of C. multiflorus under the background of SSP126 increased by 63.55% and decreased by 26.07%, respectively, compared with that under the current background. The low suitable area increased only by 3.05%, 4.81%, and 2.52%, respectively. In the 2090s, under the different backgrounds of SSP126, SSP245, and SSP585, the total suitable area of C. multiflorus also increased. The highly and medium suitable area of C. multiflorus under the background of SSP585 increased by 65.61% and decreased by 14.07%, respectively, compared with that under the current background. The low suitable area had no obvious change.
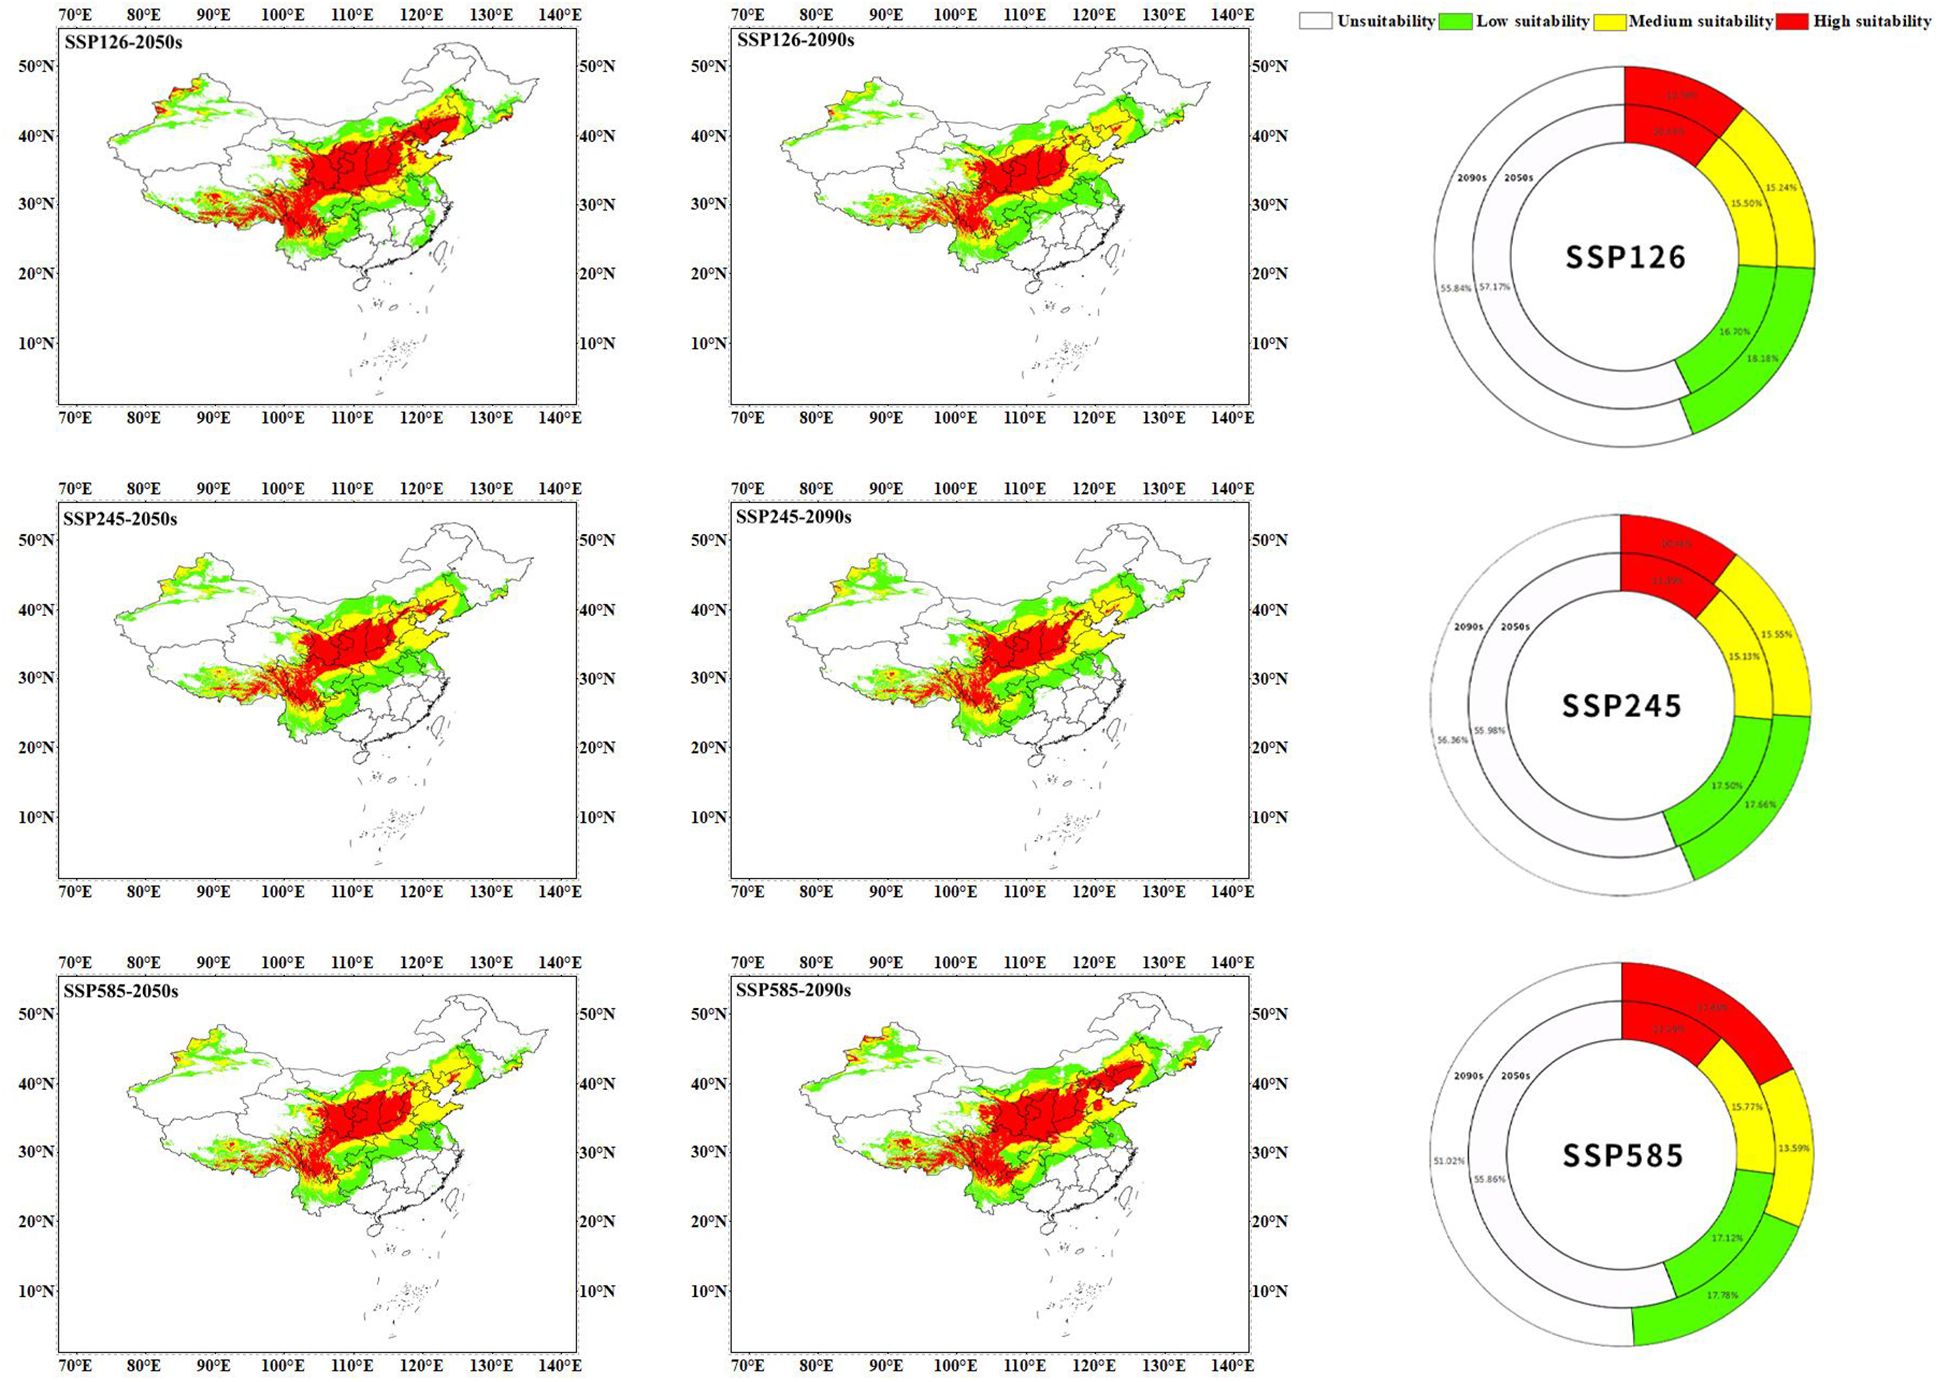
Figure 8 The prediction of suitable areas for C. multiflorus under future climate scenarios.
Under the SSP126 climate scenario, the total suitable area in the 2090s decreased by 2.74 percentage points compared to the 2050s. Specifically, the medium and low suitable area increased by 5.62% and 23.90%, respectively, while the highly suitable area decreased by 61.86%. Under the SSP245 climate scenario, there was little difference in the total and different grades of suitable area between the 2050s and 2090s. Under the SSP585 climate scenario, the total suitable area in the 2090s increased by 4.84 percentage points compared to the 2050s. Specifically, the highly and low suitable area increased by 56.50% and 3.87%, respectively, while the medium suitable area decreased by 16.01%.
Overall, the SSP126, SSP245, and SSP585 climate scenarios showed that the total suitable area and highly suitable area in the 2050s and 2090s were larger than the current condition (except for SSP245-2090s). The differences in the medium and low suitable area (165.467×10⁴ km²~174.771×10⁴ km²) between the 2050s and 2090s under different climate scenarios were not significant compared to that under the current condition (160.484×10⁴ km²), except for SSP126-2050s.
3.4 Distribution pattern change of C. multiflorus in future climate scenarios
The map of spatial change of geographical distribution pattern (Figure 9; Table 4) showed that the top two climate scenarios with the highest growth rate of potential suitable areas for C. multiflorus in the future were SSP126-2050s (11.53%) and SSP585-2090s (15.69%), other future climate scenarios ranged from 5.19% to 5.84%. It is worth noting that under the SSP126-2050s scenario, potential suitable areas of C. multiflorus would first appear in Zhejiang, Fujian, and Jiangxi. The top two climate scenarios with the highest loss rate of potential suitable areas were SSP245-2090s (3.31%) and SSP245-2050s (2.91%), but all loss areas were intermittent and small areas. Overall, the retention rates of potential suitable areas for C. multiflorus under different future climate scenarios ranged from 96.69% to 98.84%, showing an increasing trend (1.88~14.53%).
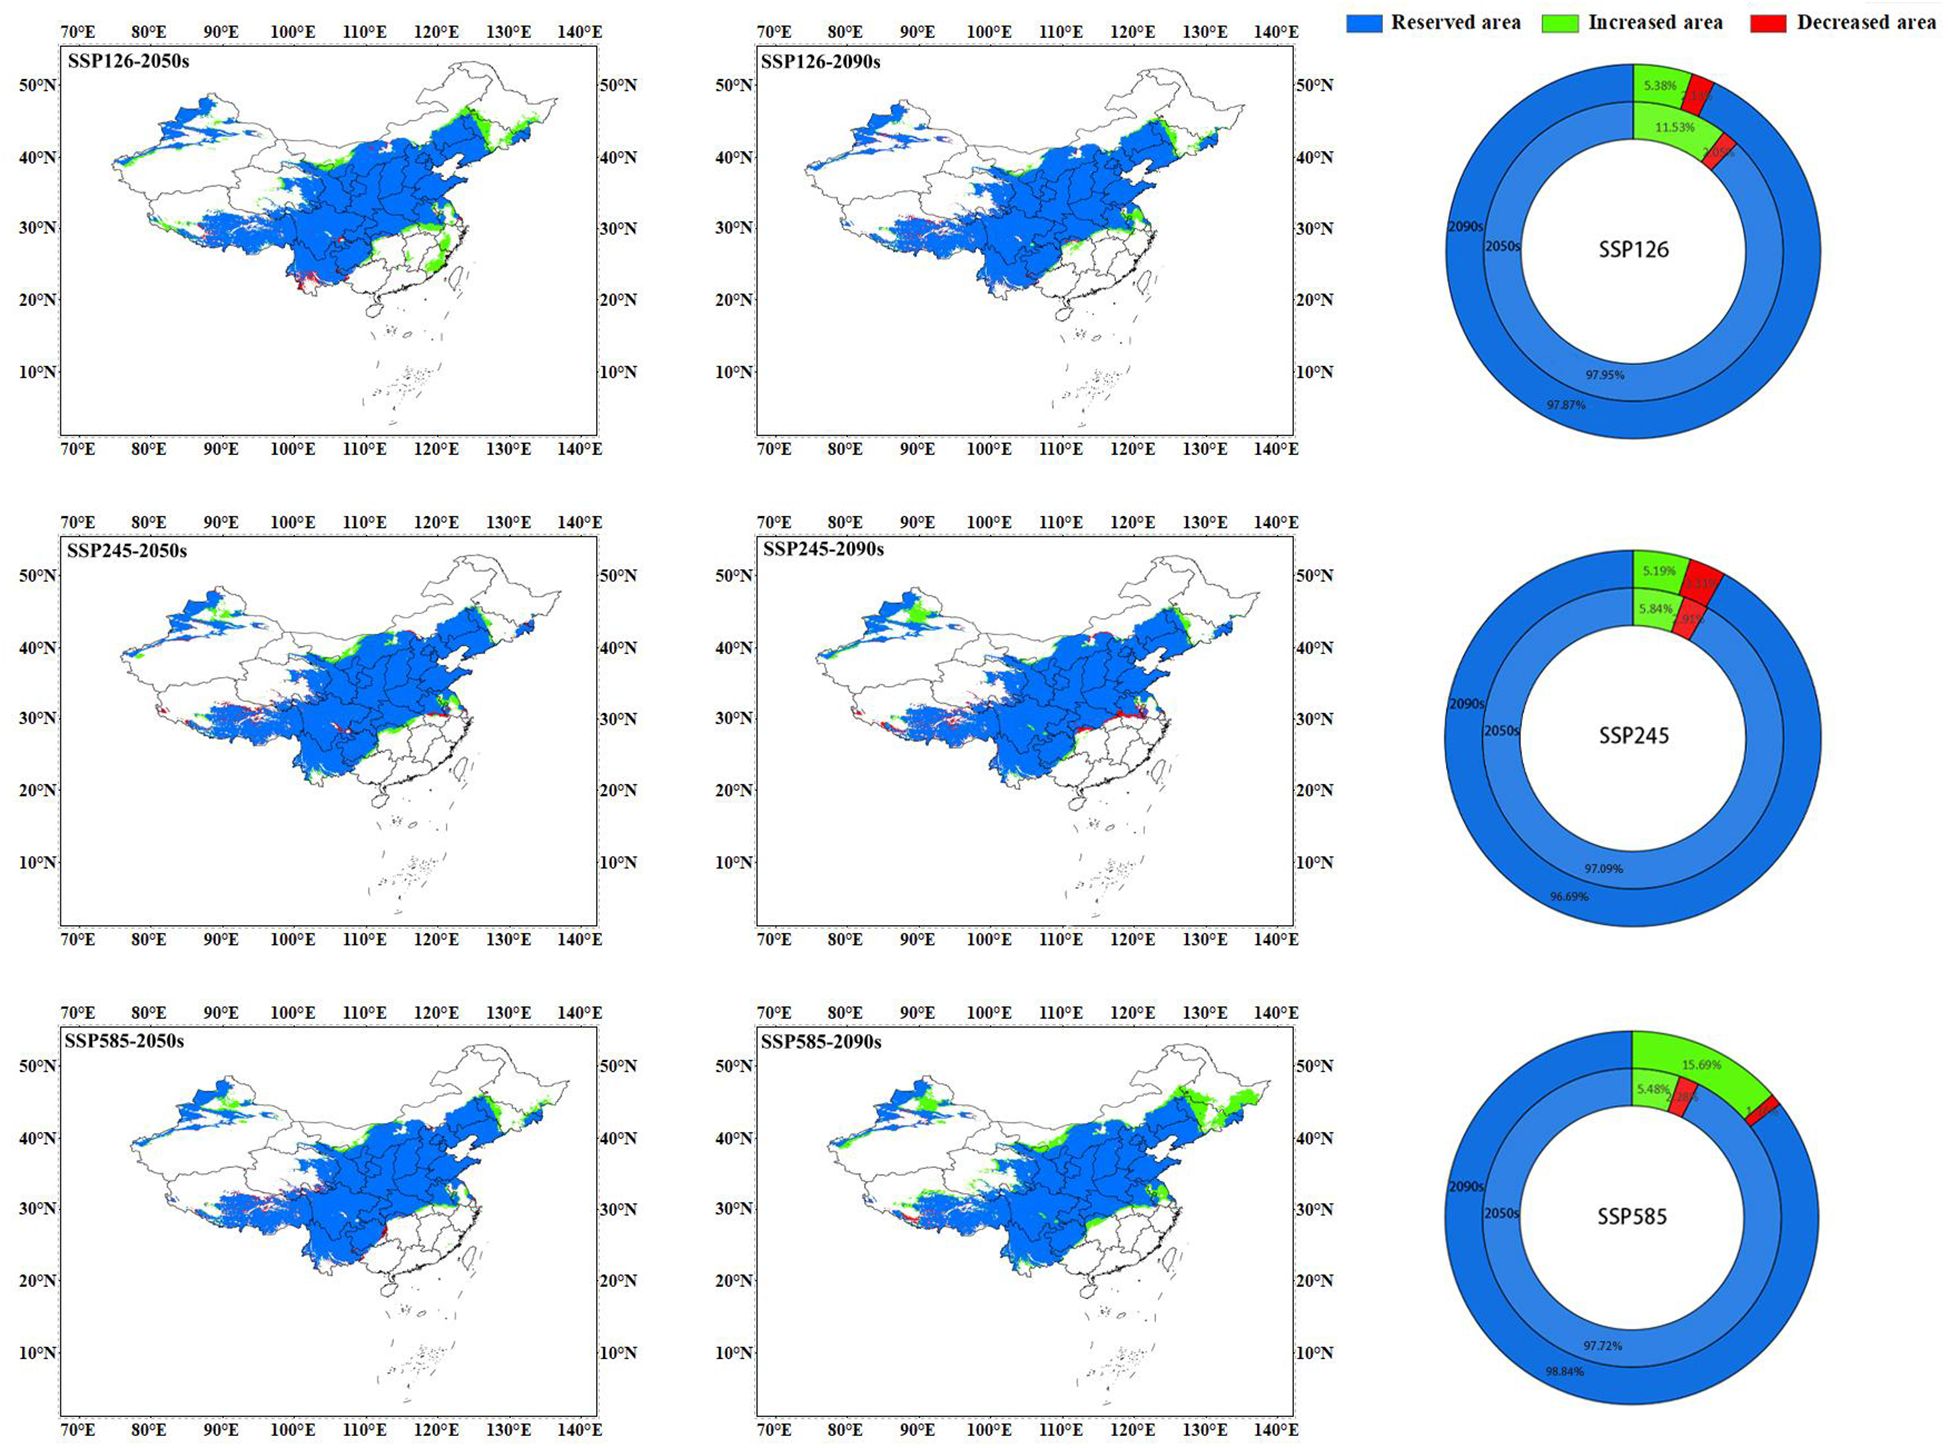
Figure 9 Spatial change of geographical distribution pattern of C. multiflorus under future climate scenarios.
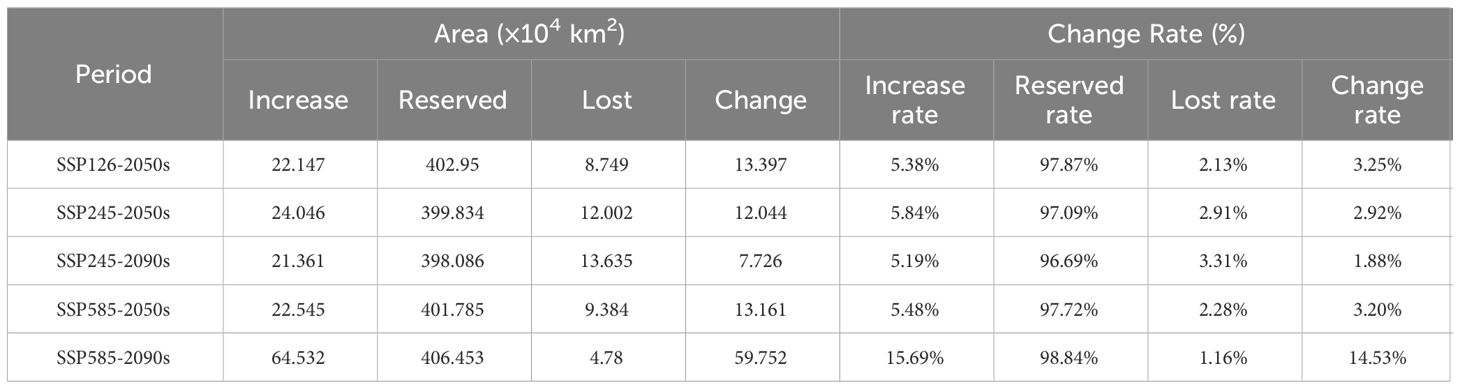
Table 4 Spatial change of suitable areas for C. multiflorus in different periods.
3.5 Analysis of niche breadth of main shrub species within C. multiflorus community
The importance value is an indicator that describes the significance of a plant species in a community. A higher importance value generally implies that the species holds a crucial position in the community, with a larger population size and wider distribution range compared to other populations. Niche breadth reflects the adaptability of a population within an ecosystem (Cai et al., 2021). From Table 5, we can observe that C. multiflorus had the highest importance value (10.48) within the shrub community. However, its niche breadth, as measured by the Levins index, ranks third (BL = 0.59), and fourth according to the Shannon index (BS =3.16).
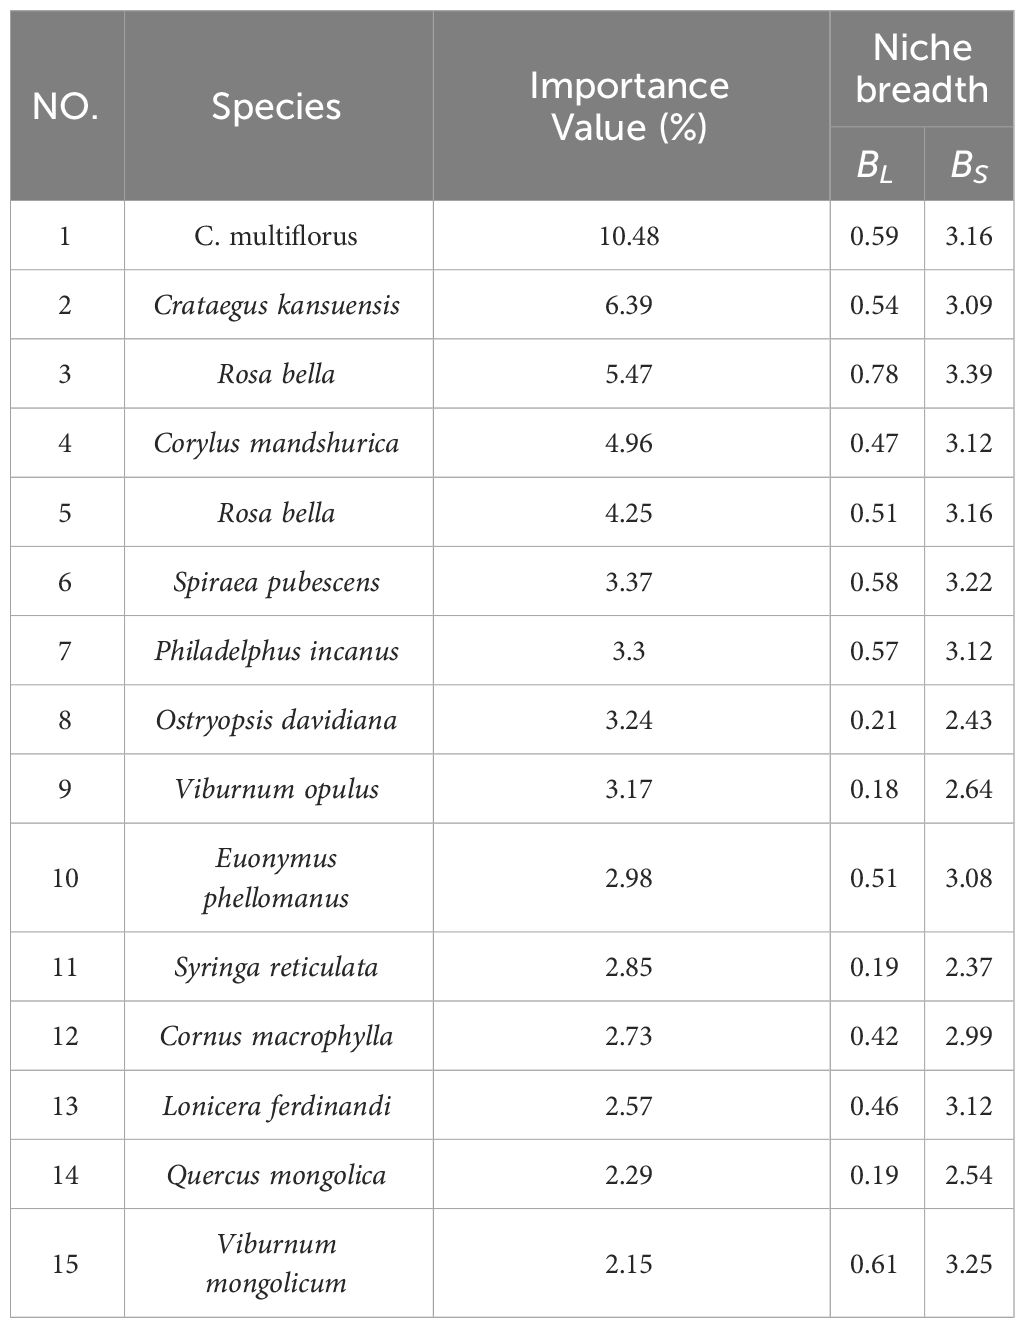
Table 5 Niche breadth of main tree species in C. multiflorus community.
3.6 Analysis of niche overlap of main shrub species within C. multiflorus community
As shown in Table 6, within C. multiflorus shrub community, 105 species pairs were formed by the 15 major shrub plant species. The niche overlap index (Oik) ranged from 0.09 to 0.79. Among these pairs, 63 pairs (60% of total pairs) had insignificant overlap (0<Oik< 0.5) and 42 pairs (40% of total pairs) had significant overlap (Oik > 0.5), suggesting that the ecological habits of these species pairs were not highly similar. 9 pairs with an Oik value above 0.7, and most of these pairs consisted of species with relatively wide niches. Among them, C. multiflorus-Philadelphus incanus had the highest niche overlap (0.79). There were 16 pairs with an Oik value less than 0.2, and these pairs had relatively narrow niche breadth, such as Ostryopsis davidiana - Viburnum opulus subsp. calvescens (0.09), O. davidiana - Quercus mongolica (0.09), and Syringa reticulata subsp. amurensis - Q. mongolica (0.09). Overall, the average Oik value was 0.43, relatively fewer pairs with high overlap.
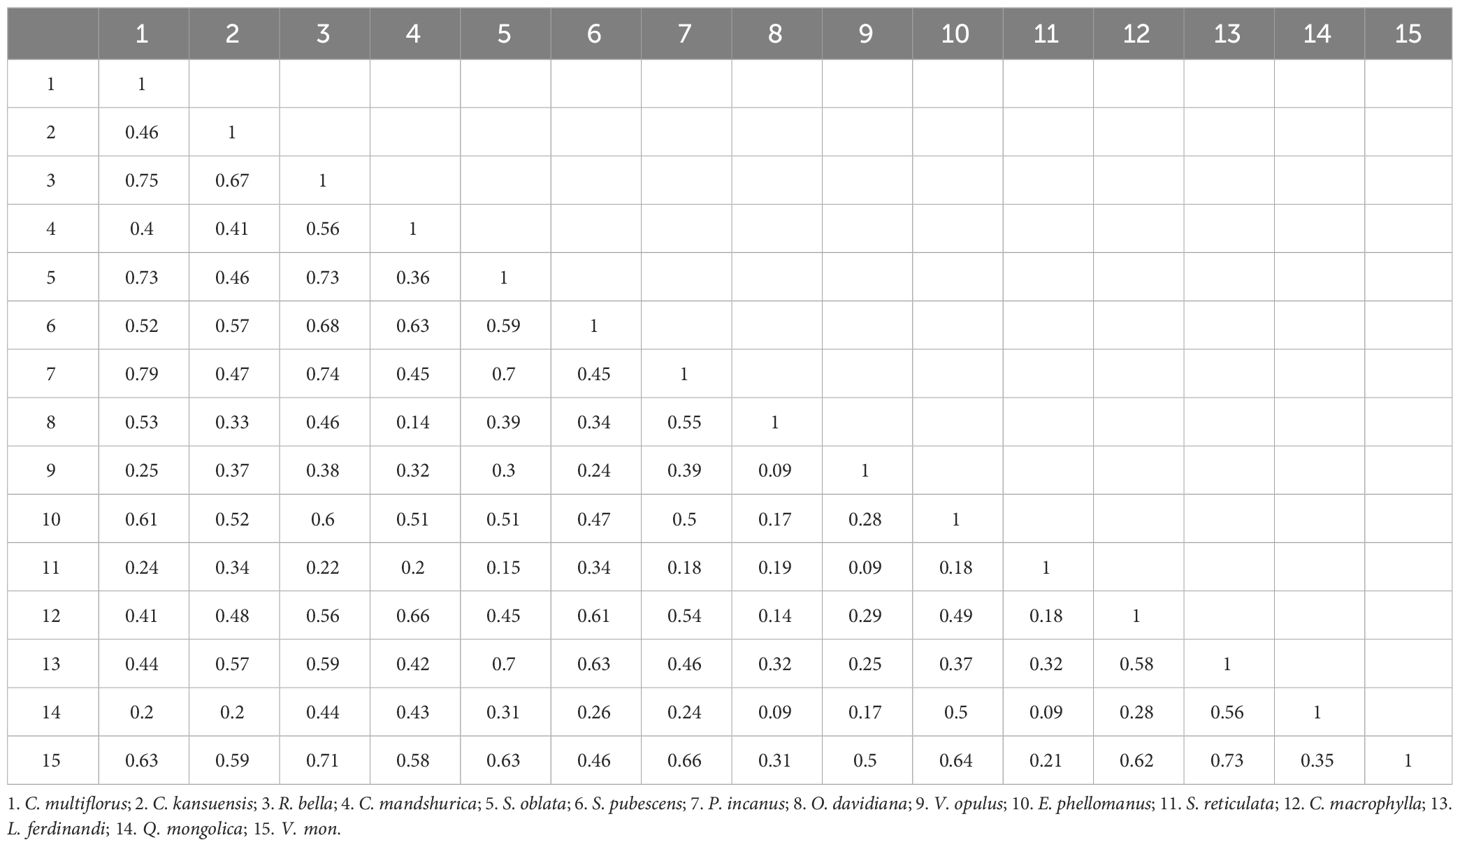
Table 6 Niche overlap of main shrub species in C. multiflorus community.
4 Discussion
4.1 Model optimization and accuracy evaluation
This study employed the ENMeval 2.0 version, which successfully solved the problems present in previous versions of the MaxEnt model, such as lacking optimal parameter selection (Morales et al., 2017), and overfitting (Merow et al., 2014; Elith and Graham, 2009), which led to inaccurate results. The ENMeval 2.0 version also helps researchers in resolving issues related to insufficient model performance and parameterization reporting, heavy reliance on AICc for model selection, and underutilization of spatial cross-validation (Kass et al., 2021).Therefore, this study employed the ENMeval 2.0 package to determine the optimal parameters for the MaxEnt model, ultimately identifying FC as LQPTH and RM as 2.5. Based on the optimized MaxEnt model, the simulated current distribution range of C. multiflorus was roughly consistent with the records in the Flora of China. Moreover, the AUC value (0.875) exceeded 0.8, indicating a high level of credibility for this simulation and providing a research basis for subsequent investigations (Araújo et al., 2005; Tang et al., 2021; Mahmoodi et al., 2022). The result is also useful to the collections of C. multiflorus germplasm resources as well as seed introduction.
4.2 Constraints of environmental variables on the potential distribution of C. multiflorus
Jackknife test (Figure 5) revealed that the top three variables significantly influencing the distribution of C. multiflorus were Annual precipitation (Bio12), Min air temperature of the coldest month (Bio6), and Mean air temperature of the coldest quarter (Bio11), which aligned with the environmental factors affecting the distribution of Haloxylon, a genus with drought-resistance (Zhang et al., 2022). Among these, the contribution rate and the importance value of Annual precipitation (Bio12) were the highest, indicating that in arid and semi-arid regions, precipitation is more important than temperature. This is consistent with the findings of Qin et al. (2023), who observed that extreme drought in certain areas consumed soil moisture reserves, restricting plant survival and growth. Furthermore, when Annual precipitation (Bio12) exceeded 150 mm, C. multiflorus can survive, and when it exceeded 500 mm, the survival rate was 0.60 (Figure 6). This further indicates that C. multiflorus exhibits strong tolerance to drought and may serve as a pioneer species for ecological restoration in arid and semi-arid areas.
Climate factors can not completely determine the geographical distribution of C. multiflorus. Soil conditions, human activities, and other factors also play important roles in shaping the distribution of plants at different spatial scales (Shishir et al., 2020; Xu W. B. et al., 2019). For instance, the seeds of C. multiflorus have hard outer shells, waxy inner membranes, poor permeability, and long physiological dormancy periods (Yu et al., 2017). Some scholars found that seeds not subjected to cold storage will not germinate the following year (Chi et al., 2015). These seed properties may influence the growth and distribution of C. multiflorus, consistent with the findings of Zhou et al. (2016) and Alzate et al. (2023). Additionally, it reproduces both sexually (inter-species hybridization) and asexually (Nybom and Bartish, 2007; Meng et al., 2021). This not only increases its genetic diversity and stress resistance to some extent but also effectively stabilizes hybrid advantages (Patel et al., 2018; Nitta et al., 2022), making it possible to adapt to various extreme climates. Therefore, in order to predict the distribution of plants accurately, it is necessary to consider more environmental factors and bio-ecological characteristics.
4.3 The potential geographical range of C. multiflorus under future climate change scenarios
With the exponential growth of global greenhouse gas emissions, the trend of future climate warming in China will be further exacerbated (Li et al., 2020). C. multiflorus will be able to effectively respond to global warming. Under different future climate scenarios, the proportion of the total suitable area for C. multiflorus ranges from 43.64% to 48.98%, which is 0.8 to 6.14 percentage points higher than the current situation. This suggests that, within a certain range, moderate climate warming may facilitate species dispersal and population expansion (Bazzaz, 1990; Thomas et al., 2004; Schöb et al., 2009), especially benefiting drought-resistant shrub species (Screen, 2014).
Previous studies have shown that the climate scenario SSP245 is closest to the actual predicted climate conditions in China (Gao et al., 2013; Lai et al., 2023). However, under the climate scenario SSP126-2050s with the lowest carbon emissions, the total and highly suitable area of C. multiflorus increased by 4.06 and 11.53 percentage points compared to that of the current climate scenario, respectively. In addition to expanding to the high latitude areas of Liaoning in northeastern China and the southern part of Heilongjiang, C. multiflorus also expanded to the lower latitude regions of Anhui, and appeared for the first time in Zhejiang, Fujian, and some parts of Jiangxi. However, with the continuous increase in greenhouse gas emissions (SSP126-2090s), C. multiflorus disappeared in the above areas. This indicated that under low carbon emissions, these areas could meet the most suitable growth condition for C. multiflorus, but their advantages might disappeared when the climate turned warm.
Under all the climate scenarios, C. multiflorus expanded towards higher latitudes (Figure 10), mainly towards the northern part of Xinjiang, Liaoning, and the southern part of Heilongjiang in northeastern China. This might be due to the fact that with the emission of greenhouse gases, the rainfall would gradually increase from the current altitude to higher altitudes (Jiang et al., 2022), while the temperature in temperate continental and cold temperate arid climate regions would also rise, which was more conducive to the growth of C. multiflorus. This is consistent with previous studies, which indicate that with the intensification of global warming, the distribution of most species will shift to higher latitudes and altitudes (Zhang et al., 2018; Faticov et al., 2021).
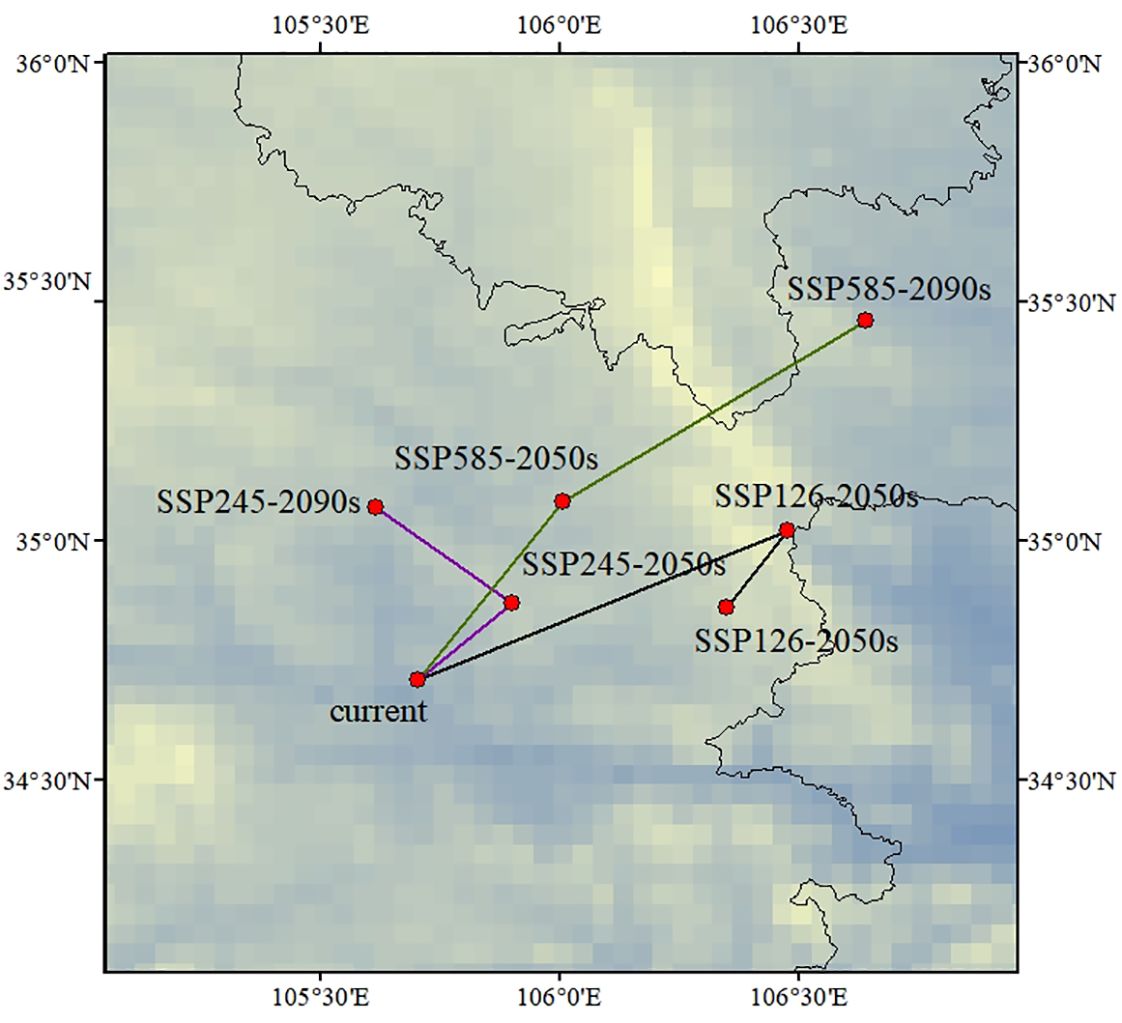
Figure 10 Migration location of the center of suitable areas for C. multiflorus during periods.
4.4 The niche characteristics within C. multiflorus community
This study used MaxEnt model and CMIP6 data to simulate the potential suitable areas of C. multiflorus under different climate change scenarios. However, its distribution is not only affected by climatic factors, but also by population distribution (Theunis et al., 2005), community structure (Zhao et al., 2022) and many other factors. Therefore, when planning forest management and formulating restoration strategies, more attention should be paid to the differences of niche between species, which are crucial for explaining species coexistence at regional scales, as well as sustainable conservation and management of forests under climate change.
Niche analysis helps to understand coexistence mechanisms, predict community responses (Huang et al., 2019), and explain environmental tolerance of species (Smith et al., 2019). As shown in Tables 5, 6, the shrub community mainly consisted of 10 tree species from the Rosaceae, Betulaceae, Oleaceae, Hydrangeaceae, Adoxaceae, Celastraceae, Cornaceae, Caprifoliaceae, and Fagaceae families, indicating high species diversity and strong structural stability. C. multiflorus had the highest importance value (10.48), and could coexist with other tree species, demonstrating strong adaptability and dominance in community.
Interestingly, the presence of two woody tree species, Cornus macrophylla and Q. mongolica, within the shrub community suggested that the C. multiflorus community could adapt to relatively harsh conditions and begin to accumulate soil moisture and nutrients, promoting the construction of forest communities. The niche breadth of C. multiflorus ranked third, and the Shannon index ranked fourth with significant overlap with species such as Rosa bella, Syringa oblata, P. incanus, Euonymus phellomanus, Viburnum mongolicum, O. davidiana, and Spiraea ouensanensis, suggesting that these species may have a competitive relationship with C. multiflorus. Therefore, in ecologically fragile environments, it is advisable to first establish a C. multiflorus community, and avoid species with significantly overlapping niches, such as R. bella, S. oblata, P. incanus, E. phellomanus, V. mongolicum, O. davidiana, and S. ouensanensis.
5 Conclusion
In this study, we predicted the potential spatial pattern of C. multiflorus in China by MaxEnt 2.0 model, combined with climatic factors and field investigation. Besides, we explored the main climatic factors and ecological adaptability which affect its distribution. The results showed that the main climatic factors were Annual precipitation (Bio12), Min air temperature of the coldest month (Bio6) and Mean air temperature of the coldest quarter (Bio11). C. multiflorus can grow in the environment with Annual precipitation (Bio12) >150mm, Min air temperature of the coldest month (Bio6) > -42.5°C and Mean air temperature of the coldest quarter (Bio11) > -20°C, which is in line with the characteristics of high cold and drought resistance. In addition, its distribution will further expand to higher latitudes. C. multiflorus can show dominance in communities, while coexists with other shrub species. In conclusion, under the trend of global warming, C. multiflorus can be regarded as a pioneer species for ecological restoration in arid and semi-arid areas.
Data availability statement
The original contributions presented in the study are included in the article/Supplementary Material. Further inquiries can be directed to the corresponding author.
Author contributions
QH: Conceptualization, Data curation, Formal Analysis, Methodology, Validation, Visualization, Writing – original draft, Writing – review & editing. HL: Writing – original draft, Validation. CL: Data curation, Formal Analysis, Writing – original draft. XZ: Investigation, Writing – original draft, Data curation. ZY: Formal Analysis, Writing – original draft. JL: Data curation, Investigation, Visualization, Writing – original draft. MC: Data curation, Investigation, Writing – original draft. ZH: Data curation, Investigation, Writing – original draft. YY: Data curation, Writing – original draft. SZ: Data curation, Writing – original draft. ZL: Data curation, Writing – original draft. GZ: Conceptualization, Funding acquisition, Project administration, Supervision, Visualization, Writing – review & editing.
Funding
The author(s) declare that financial support was received for the research, authorship, and/or publication of this article. This study was supported by the Fujian Science and Technology Plan Project (2022I0008), East-West Collaborative Project (KH180062A, 11891008004, KH190315A), Science and Technology Innovation Fund of Fujian Agriculture and Forestry University (CXZX2019046).
Conflict of interest
Author XZ was employed by Shanxi Water Affairs Group Construction Investment Co. LTD, China.
The remaining authors declare that the research was conducted in the absence of any commercial or financial relationships that could be construed as a potential conflict of interest.
Publisher’s note
All claims expressed in this article are solely those of the authors and do not necessarily represent those of their affiliated organizations, or those of the publisher, the editors and the reviewers. Any product that may be evaluated in this article, or claim that may be made by its manufacturer, is not guaranteed or endorsed by the publisher.
Supplementary material
The Supplementary Material for this article can be found online at: https://www.frontiersin.org/articles/10.3389/fpls.2024.1360190/full#supplementary-material
Footnotes
References
Alzate, D. C., Quijano-Abril, M. A., Salazar-Suaza, D., Giraldo-Sánchez, C. E., Rojas-Villa, G. M. (2023). Morphoanatomical Analysis and Diversity of Andean Urban Wetland seed Banks: A tool for Ecological Rehabilitation. Wetlands 43, 67–81. doi: 10.1007/s13157-023-01715-1
Araújo, M. B., Anderson, R. P., Márcia, B. A., Beale, C. M., Dormann, C. F., Regan, E., et al. (2019). Standards for distribution models in biodiversity assessments. Sci. Advances. 5, 1–11. doi: 10.1126/sciadv.aat4858
Araújo, M. B., Pearson, R. G., Thuiller, W., Erhard, M. (2005). Validation of species-climate impact models under climate change. Glob.Chang. Biol. 11, 1504–1513. doi: 10.1111/j.1365-2486.2005.01000.x
Bartish, I. V., Hylmö, B., Nybom, H. (2001). RAPD analysis of interspecific relationships in presumably apomictic Cotoneaster species. Euphytica 120, 273–280. doi: 10.1023/A:1017585600386
Bazzaz, F. A. (1990). The response of natural ecosystems to the rising global CO2 levels. Annu. Rev. Ecol. Systemat. 21, 167–196. doi: 10.1146/annurev.es.21.110190.001123
Cai, Q., Welk, E., Ji, C., Fang, W., Sabatini, F. M., Zhu, J., et al. (2021). The relationship between niche breadth and range size of beech (Fagus) species worldwide. J. Biogeog. 48, 1240–1253. doi: 10.1111/jbi.14074
Chang, C., Jeon, J. I. (2003). Leaf flavonoids in Cotoneaster wilsonii (Rosaceae) from the island Ulleung-do, Korea. Biochem. Syst. Ecol. 31, 171–179. doi: 10.1016/S0305-1978(02)00064-9
Chase, J. M., Leibold, M. A. (2003). “Ecological niches: linking classical and contemporary approaches,” in Interspecific interactions (University of Chicago Press, Chicago, IL). doi: 10.1016/j.biocon.2004.02.003
Chen, G., Wang, Y. M., Lu, D., Zhao, X. P., Wang, B., Run, K. L., et al. (2021). Introduction adaptability of Cotoneaster multiflorus in Zhangye City in arid and semi-arid region of Hexi. For. Sci. Technol. 8, 32–35. doi: 10.13456/j.cnki.lykt.2020.08.21.0001
Chi, W. Z., Zhou, B., Guo, J. P., Sheng, W. (2015). Introduction and propagation of Cotoneaster multiflorus, an ornamental plant. Prot. For. Sci. Technol. 10, 111–112. doi: 10.13601/j.issn.1005-5215.2015.10.042
Ciais, P., Reichstein, M., Viovy, N., Granier, A., Ogée, J., Allard, V., et al. (2005). Europe-wide reduction in primary productivity caused by the heat and drought in 2003. Nature 437, 529–533. doi: 10.1038/nature03972
Cobos, M. E., Peterson, A. T., Barve, N., Osorio-Olvera, L. (2019). Kuenm: An R package for detailed development of ecological niche models using MaxEnt. PeerJ 7, 6281–6296. doi: 10.7717/peerj.6281
Colwell, R. K., Futuyma, D. J. (1971). On the measurement of niche breadth and overlap. Ecology 52, 567–576. doi: 10.2307/1934144
Dai, A. (2011). Drought under global warming: a review. Wiley Interdisciplinary Reviews. Climate Change. 2, 45–65. doi: 10.1002/(ISSN)1757-7799
Ding, S. X., Sun, K., Wu, Q., Su, X., Chen, W., Dong, L. N. (2007). Comparison of morphological and statistical analysis of three species of Trapa genus. Plant Res. 27, 154–158. doi: 10.3969/j.issn.1673-5102.2007.02.009
Elith, T., Catherinem, H. G., Robert, P. A., DudÍk, S., Ferrier, A., Guisan, A., et al. (2006). Novel methods improve prediction of species’ distributions from occurrence data. Ecography 29, 129–151. doi: 10.1111/j.2006.0906-7590.04596.x
Elith, J., Graham, C. H. (2009). Do they? how do they? WHY do they differ? on finding reasons for differing performances of species distribution models. Ecography 32 (1), 66–77. doi: 10.1111/j.1600-0587.2008.05505.x
Fang, J. Y., Wang, X. P., Shen, Z. H. (2009). The main content, methods, and technical specifications of the plant community survey. Biodiversity 17, 533–548. doi: 10.3724/SP.J.1003.2009.09253
Faticov, M., Abdelfattah, A., Roslin, T., Vacher, C., Hambäck, P., Blanchet, F. G., et al. (2021). Climate warming dominates over plant genotype in shaping the seasonal trajectory of foliar fungal communities on oak. New Phytol. 231, 1770–1783. doi: 10.1111/nph.17434
Feroz, S. M., Yoshimura, K., Hagihara, A. (2008). Stand stratification and woody species diversity of a subtropical forest in limestone habitat in the northern part of Okinawa Island. J. Plant Res. 121, 329–337. doi: 10.1007/s10265-008-0162-z
Gao, X. J., Wang, M., Li, F. G. (2013). Climate change over China in the 21st century as simulated by BCC_CSM1.1-regCM4.0. Atmospheric Oceanic Sci. Lett. 6, 381–386. doi: 10.3878/j.issn.1674-2834.13.0029
Gleick, P. H., Heberger, M. (2012). The coming mega drought. Sci. Am. 306, 14. doi: 10.1038/scientificamerican0112-14
Godoy, O., G´omez-Aparicio, L., Matías, L., P´erez-Ramos, I. M., Allan, E. (2020). An excess of niche differences maximizes ecosystem functioning. Nat. Commun. 11, 4180. doi: 10.1038/s41467-020-17960-5
Gu, L., Gong, Z. W., Li, W. Z. (2017). Niches and interspecific associations of dominant populations in three changed stages of natural secondary forests on Loess Plateau, P. R. China. Sci. Rep. 7, 6671–6683. doi: 10.1038/s41598-017-06689-9
Haile, G. G., Tang, Q. H., Sun, S., Huang, Z. W., Zhang, X. J., Liu, X. C. (2019). Droughts in East Africa: Causes, impacts and resilience. Earth-Sci. Rev. 193, 146–161. doi: 10.1016/j.earscirev.2019.04.015
Hu, Y., Wang, H., Jia, H., Pen, M., Liu, N., Wei, J., et al. (2022). Ecological niche and interspecific association of plant communities in alpine desertification grasslands: A case study of qinghai lake basin. Plants 11, 2724. doi: 10.3390/plants11202724
Huang, L., Xue, W., Herben, T. (2019). Temporal niche differentiation among species changes with habitat productivity and light conditions. J. Vegetation Sci. 30, 438–447. doi: 10.1111/jvs.12741
Huang, Y. M., Zhang, G. L., Fu, W. D., Zhang, Y., Zhao, Z. H., Li, Z. H., et al. (2023). Impacts of climate change on climatically suitable regions of two invasive Erigeron weeds in China. Front. Plant Sci. 14. doi: 10.3389/fpls.2023.1238656
Ji, W., Han, K., Lu, Y. Y., Wei, J. F. (2020). Predicting the potential distribution of the vine mealybug, Planococcus ficus under climate change by MaxEnt. Crop Protection. 137, 1–23. doi: 10.1016/j.cropro.2020.105268
Jia, J. (2022). Ionic liquid-based Microwave-assisted extraction of oligomeric proanthocyanidins from Cotoneaster multiflorus pulp. Heilongjiang Med. 35, 37–40. doi: 10.14035/j.cnki.hljyy.2022.01.013
Jiang, R., Zou, M., Qin, Y., Tan, G. D., Huang, S. P., Quan, H. G., et al. (2022). Modeling of the potential geographical distribution of three Fritillaria species under climate change. Front. Plant Sci. 12. doi: 10.3389/fpls.2021.749838
Kass, J. M., Muscarella, R., Galante, P. J., Bohl, C. L., Pinilla-Buitrago, G. E., Boria, R. A., et al. (2021). ENMeval 2.0: Redesigned for customizable and reproducible modeling of species’ niches and distributions. Methods Ecol. Evol. 12, 1602–1608. doi: 10.1111/2041-210X.13628
Khan, S., Riaz, N., Afza, N., Malik, A., Aziz-ur-Rehman, Iqbal, L., et al. (2009). Antioxidant constituents from cotoneaster racemiflora. J. Asian Nat. Prod. Res. 11, 44–48. doi: 10.1080/10286020802435745
Khanum, R., Mumtaz, A. S., Kumar, S. (2013). Predicting impacts of climate change on medicinal asclepiads of Pakistan using Maxent modeling. Acta Oecol. 49, 23–31. doi: 10.1016/j.actao.2013.02.007
Khwarahm, N. R. (2020). Mapping current and potential future distributions of the oak tree (Quercus aegilops) in the Kurdistan Region, Iraq. Ecol. Processes. 9, 1–16. doi: 10.1186/s13717-020-00259-0
Kou, M. (2016). The characteristics of erosion-resistant plant and its community in the hill and gully loess plateau region (Beijing: University of Chinese Academy of Sciences).
Kuiper, R. M., Hoijtink, H. (2011). How to handle missing data in regression models using information criteria. Stat. Neerlandica. 65, 489–506. doi: 10.1111/j.1467-9574.2011.00496.x
Lai, W. F., Shi, C. Y., Wen, G. W., Lü, Z. W., Ye, L. Q., Huang, Q. L., et al. (2023). Potential impacts of climate change on the distribution of the relict plant Shaniodendron subaequale. Heliyon 9, 14402–14402. doi: 10.1016/j.heliyon.2023.e14402
Lan, Z., Huiliang, L., Hongxiang, Z., Yanfeng, C., Lingwei, Z., Kudusi, K., et al. (2022). Potential distribution of three types of ephemeral plants under climate changes. Front. Plant Sci. 13, 1035684. doi: 10.3389/fpls.2022.1035684
Li, Y., Zhang, X. W., Fang, Y. M. (2016). Responses of the distribution pattern of Quercus chenii to climate change following the Last Glacial Maximum. Chin. J. Plant Ecol. 40, 1164–1178. doi: 10.17521/cjpe.2016.0032
Li, Y., Li, M., Li, C., Liu, Z. Z. (2020). Optimized maxent model predictions of climate change impacts on the suitable distribution of cunninghamia lanceolata in China. Forests 11, 302–327. doi: 10.3390/f11030302
Li, D. Z., Shi, Q., Zhang, R. G. (2006). Species or population ecological niche width and ecological niche overlap measurement model. Forestry Sci. J. 42, 95–103.
Liu, R. H., Chang, B., Rong, C. Y. (2018). The ecological niche of the main woody plant community in the maple-poplar community on the banks of the Li River. Appl. Ecol. J. 29, 3917–3926. doi: 10.13287/j.1001-9332.201812.001
Liu, X. P., Jia, J., Jing, X., Li, G. L. (2018). Antioxidant activities of extracts from sarcocarp of Cotoneaster multiflorus. J. Chem. 7, 4619768–4619775. doi: 10.1155/2018/4619768
Lott, F. C., Christidis, N., Stott, P. A. (2013). Can the 2011 East African drought be attributed to human-induced climate change? Geophys. Res. Lett. 40, 1177–1181. doi: 10.1002/grl.50235
Mahmoodi, S., Heydari, M., Ahmadi, K., Khwarahm, N. R., Karami, O., Almasieh, K., et al. (2022). The current and future potential geographical distribution of Nepeta crispa Willd., an endemic, rare and threatened aromatic plant of Iran: Implications for ecological conservation and restoration. Ecol. Indicators. 137, 108752–108763. doi: 10.1016/j.ecolind.2022.108752
Meng, K. K., Chen, S. F., Xu, K. W., Zhou, R. C., Li, M. W., Dhamala, M. K., et al. (2021). Phylogenomic analyses based on genome-skimming data reveal cyto-nuclear discordance in the evolutionary history of Cotoneaster (Rosaceae). Mol. Phylogenet. Evol. 158, 107083. doi: 10.1016/j.ympev.2021.107083
Merow, C., Smith, M., Edwards, T. C., Jr., Sean M, A. G., McMahon, S. M., Normand, S., et al. (2014). What do we gain from simplicity versus complexity in species distribution models? Ecography 37, 1267–1281. doi: 10.1111/ecog.00845
Monier, C., Bossis, E., Chabanet, C., Samson, R. (1998). Different bacteria can enhance the micropropagation response of Cotoneaster lacteus (Rosaceae). J. Appl. Microbiol. 85, 1047–1055. doi: 10.1111/jam.1998.85.issue-6
Morales, N. S., Fernandez, I. C., BacaGonzalez, V. (2017). MaxEnt's parameter configuration and small samples: are we paying attention to recommendations ? a systematic review. PEER J. 5, 3093–3109. doi: 10.7717/peerj.3093
Niaki, N. A. R., Attar, F., Mirtadzadini, M., Mahdigholi, K., Sheidai, M. (2019). Micromorphological studies of the leaf epidermis of Iranian Cotoneaster Medik. Nordic J. Botany. 37, 1–48. doi: 10.1111/njb.02074
Nitta, J. H., Mishler, B. D., Iwasaki, W., Ebihara, A. (2022). Spatial phylogenetics of Japanese ferns: Patterns, processes, and implications for conservation. Am. J. botany. 109, 727–745. doi: 10.1002/ajb2.1848
Nybom, H., Bartish, V. I. (2007). DNA markers and morphometry reveal multiclonal and poorly defined taxa in an apomictic cotoneaster species complex. Taxon 56, 119–128. doi: 10.2307/25065742
Palme, E., Bilia, A. R., De Feo, V., Morelli, I. (1994). Flavonoid glycosides from Cotoneaster thymaefolia. Phytochemistry 35, 1381–1382. doi: 10.1016/S0031-9422(06)80133-0
Patel, N., Li, C., Zhang, L., Zhang, L. B., Barrington, D. S. (2018). Biodiversity and apomixis: Insights from the East-Asian holly ferns in Polystichum section Xiphopolystichum. Mol. Phylogenet. Evol. 127, 345–355. doi: 10.1016/j.ympev.2018.05.003
Peterson, A., Soberón, J., Pearson, R., Anderson, R., Martínez-Meyer, E., Nakamura, M., et al. (2011). Ecological niches and geographic distributions (MPB-49). (Princeton University: Princeton University Press). doi: 10.23943/princeton/9780691136868.001.0001
Phillips, S. T., Anderson, R. P., Schapire, R. E. (2006). Maximum entropy modeling of species geographic distributions. Ecol. Model. 190, 231–259. doi: 10.1016/j.ecolmodel.2005.03.026
Phillips, S. J., Dudík, M. (2008). Modeling of species distributions with MaxEnt: New extensions and a comprehensive evaluation. Ecography 31, 161–175. doi: 10.1111/j.0906-7590.2008.5203.x
Popp, A., Calvin, K., Fujimori, S., Havlik, P., Humpenöder, F., Stehfest, E., et al. (2016). Land-use futures in the shared socio-economic pathways. Global Environ. Change. 42, 1632–1647. doi: 10.1016/j.gloenvcha.2016.10.002
Qin, M., Gao, X., Feng, M., Jin, N., Wang, C., Cheng, W. (2023). Modeling of the potential geographical distribution of naked oat under climate change. Front. Plant Sci. 13. doi: 10.3389/fpls.2022.1009577
Ren, Z., Zagortchev, L., Ma, J., Yan, M., Li, J. (2020). Predicting the potential distribution of the parasitic Cuscuta chinensis under global warming. BMC Ecol. 20, 28–42. doi: 10.1186/s12898-020-00295-6
Schöb, C., Kammer, P. M., Choler, P., Veit, H. (2009). Small-scale plant species distribution in snowbeds and its sensitivity to climate change. Plant Ecol. 200, 91–104. doi: 10.1007/s11258-008-9435-9
Screen, A. J. (2014). Arctic amplification decreases temperature variance in northern mid-to high-latitudes. Nat. Climate Change. 4, 577–582. doi: 10.1038/nclimate2268
Shi, N., Naudiyal, N., Wang, J., Gaire, N. P., Wu, Y., Wei, Y. Q., et al. (2022). Assessing the impact of climate change on potential distribution of Meconopsis punicea and its influence on ecosystem services supply in the southeastern margin of Qinghai-Tibet Plateau. Front. Plant Sci. 12. doi: 10.3389/fpls.2021.830119
Shishir, S., Mollah, T. M., Tsuyuzaki, S., Wada, N. (2020). Predicting the probable impact of climate change on the distribution of threatened Shorea robusta forest in Purbachal, Bangladesh. Global Ecol. Conserv. 24, 1250–1265. doi: 10.1016/j.gecco.2020.e01250
Smith, A. B., Godsoe, W., Rodríguez-S´anchez, F., Wang, H.-H., Warren, D. (2019). Niche estimation above and below the species level. Trends Ecol. Evol. 34, 260–273. doi: 10.1016/j.tree.2018.10.012
Subedi, S. C., Drake, S., Adhikari, B., Coggeshall, M. V. (2024). Climate-change habitat shifts for the vulnerable endemic oak species (Quercus arkansana Sarg.). J. Forestry Res. 35, 1–11. doi: 10.1007/s11676-023-01673-8
Subedi, S. C., Ruston, B., Hogan, J., Coggeshall, M. V. (2023). Defining the extent of suitable habitat for the endangered Maple-Leaf oak (Quercus acerifolia). Front. Biogeograph. 15, 58763–58775. doi: 10.21425/F5FBG58763
Sun, J. W., Zhao, Y. J., Xie, N., Zhang, R., Guo, T., Wang, Y. L., et al. (2020). Technical regulation for sowing and breeding of Cotoneaster in water. For. Sci. Technol. 22, 66–68. doi: 10.13456/j.cnki.lykt.2019.04.02.0003
Swets, J. (1988). Measuring the accuracy of diagnostic systems. Science 240, 1285–1293. doi: 10.1126/science.3287615
Tang, X., Yuan, Y., Li, X., Zhang, J. (2021). Maximum entropy modeling to predict the impact of climate change on pine wilt disease in China. Front. Plant Sci. 12. doi: 10.3389/fpls.2021.652500
Theunis, L., Gilbert, M., Roisin, Y., Leponce, M. (2005). Spatial structure of litter-dwelling ant distribution in a subtropical dry forest. Insectes Sociaux 52, 366–377. doi: 10.1007/s00040-005-0822-0
Thomas, C. D., Cameron, A., Green, R. E., Bakkenes, M., Beaumont, L. J., Collingham, Y. C., et al. (2004). Extinction risk from climate change. Nature 427, 145–149. doi: 10.1038/nature02121
Van Dijk, A. I. J. M., Beck, H. E., Crosbie, R. S., De Jeu, R. A. M., Liu, Y. Y., Podge, G. M., et al. (2013). The Millennium Drought in southeast Australia, (2001-2009): Natural and human causes and implications for water resources, ecosystems, economy, and society. Water Resour. Res. 49, 1040–1057. doi: 10.1002/wrcr.20123
Varol, T., Cetin, M., Ozel, H. B., Sevik, H., Zeren Cetin, I. (2022). The effects of climate change scenarios on Carpinus betulus and Carpinus orientalis in Europe. Water Air Soil pollut. 233, 45, 1–45,13. doi: 10.1007/s11270-022-05516-w
Xu, W. B., Svenning, J. C., Chen, G. K., Zhang, M. G., Huang, J. H., Chen, B., et al. (2019). Human activities have opposing effects on distributions of narrow-ranged and widespread plant species in China. PNAS 116, 26674–26681. doi: 10.1073/pnas.1911851116
Xu, D., Zhuo, Z., Wang, R., Ye, M., Pu, B. (2019). Modeling the distribution of Zanthoxylum armatum in China with MaxEnt modeling. Global Ecol. Conserv. 19, 691–700. doi: 10.1016/j.gecco.2019.e00691
Yan, J. H., Gao, Y. (2003). The main measures to improve the survival rate of afforestation in the semiarid areas of western Liaoning. Jilin Forestry Sci. Technol. 32, 61–63. doi: 10.16115/j.cnki.issn.1005-7129.2003.02.020
Yang, J. Y., Kim, S., Pak, J. H., Kim, S. (2022). Infrageneric plastid genomes of Cotoneaster (Rosaceae): implications for the plastome evolution and origin of C. wilsonii on Ulleung island. Genes 13, 728–747. doi: 10.3390/genes13050728
Yu, H. R., Li, Q. F., He, Y. M., Wei, Q., Jia, Y. S. (2017). Influence of different processing methods on seed germination of two kinds of Cotoneaster Medikus shrub. Grassland Pratacul. 29, 41–46. doi: 10.3969/j.issn.2095-5952.2017.03.010
Yu, H. R., Li, Q. F., Jia, Y. S., He, Y. M. (2018). Study on dormancy and germination characeristics of four kinds of shrub plant seeds. Northern Horticul. 22, 88–93. doi: 10.11937/bfyy.20174200
Yuan, Y., Tang, X., Liu, M., Liu, X., Tao, J. (2021). Species distribution models of the Spartina alterniflora loisel in its origin and invasive country reveal an ecological niche shift. Front. Plant Sc. 12. doi: 10.3389/fpls.2021.738769
Zhang, W. X., Kou, Y. X., Zhang, L., Zeng, W. D., Zhang, Z. Y. (2020). Suitable distribution of endangered species Pseudotaxus chienii (Cheng) Cheng (Taxaceae) in five periods using niche modeling. Chin. J. Ecol. 39, 600–613. doi: 10.13292/j.1000-4890.202002.028
Zhang, D., Ma, S. M., Wei, B., Wang, C. C., Zhang, L., Yan, H. (2022). Historical distribution pattern and driving mechanism of Haloxylon in China. Biodiversity Sci. 30, 42–51. doi: 10.17520/biods.2021192
Zhang, K. L., Yao, L. J., Meng, J. S., Tao, J. (2018). Maxent modeling for predicting the potential geographical distribution of two peony species under climate change. Sci. Total Environ. 634, 1326–1334. doi: 10.1016/j.scitotenv.2018.04.112
Zhang, W. H., Zhang, Z. Q., Liao, Z. B., Wang, Y., Chen, S. T., Shao, Q. F., et al. (2019). Changes in the Asian monsoon climate during the late last interglacial recorded in oxygen isotopes of a stalagmite from the Yongxing Cave, central China. J. Asian Earth Sci. 179, 211–218. doi: 10.1016/j.jseaes.2019.04.024
Zhao, Y. H., Wen, Y. F., Zhang, W. Q., Wang, C. C., Yan, Y. D., Hao, S. W., et al. (2023). Distribution pattern and change prediction of Phellodendron habitat in China under climate change. Ecol. Evol. 13, 10374–10374. doi: 10.1002/ece3.10374
Zhao, J. H., Ye, Y. Q., Sun, X. D., Lan, W. J., Fang, Y., Chen, B., et al. (2022). Population dynamics and sptial distribution of the rare and endangered plant Tsuga chinensis var. tchekinagensis in Wuyishan,jiangxi province. Acta Ecologica Sinica. 42, 4032–4404. doi: 10.5846/stxb202011052827
Keywords: Cotoneaster multiflorus, MaxEnt 2.0 model, distribution, niche, arid and semi-arid areas, ecological restoration
Citation: Huang Q, Liu H, Li C, Zhu X, Yuan Z, Lai J, Cao M, Huang Z, Yang Y, Zhuo S, Lü Z and Zhang G (2024) Predicting the geographical distribution and niche characteristics of Cotoneaster multiflorus based on future climate change. Front. Plant Sci. 15:1360190. doi: 10.3389/fpls.2024.1360190
Received: 04 January 2024; Accepted: 02 April 2024;
Published: 08 May 2024.
Edited by:
Martin Karl-Friedrich Bader, Linnaeus University, SwedenReviewed by:
Suresh Chandra Subedi, Arkansas Tech University, United StatesKatarzyna Zielińska, University of Łódź, Poland
Copyright © 2024 Huang, Liu, Li, Zhu, Yuan, Lai, Cao, Huang, Yang, Zhuo, Lü and Zhang. This is an open-access article distributed under the terms of the Creative Commons Attribution License (CC BY). The use, distribution or reproduction in other forums is permitted, provided the original author(s) and the copyright owner(s) are credited and that the original publication in this journal is cited, in accordance with accepted academic practice. No use, distribution or reproduction is permitted which does not comply with these terms.
*Correspondence: Guofang Zhang, fjzgfzgf@163.com