


- BRAMS Laboratory, Department of Psychology, University of Montreal, Montreal, QC, Canada
A small number of individuals have severe musical problems that have neuro-genetic underpinnings. This musical disorder is termed “congenital amusia,” an umbrella term for lifelong musical disabilities that cannot be attributed to deafness, lack of exposure, or brain damage after birth. Amusics seem to lack the ability to detect fine pitch differences in tone sequences. However, differences between statements and questions, which vary in final pitch, are well perceived by most congenital amusic individuals. We hypothesized that the origin of this apparent domain-specificity of the disorder lies in the range of pitch variations, which are very coarse in speech as compared to music. Here, we tested this hypothesis by using a continuum of gradually increasing final pitch in both speech and tone sequences. To this aim, nine amusic cases and nine matched controls were presented with statements and questions that varied on a pitch continuum from falling to rising in 11 steps. The sentences were either naturally spoken or were tone sequence versions of these. The task was to categorize the sentences as statements or questions and the tone sequences as falling or rising. In each case, the observation of an S-shaped identification function indicates that amusics can accurately identify unambiguous examples of statements and questions but have problems with fine variations between these endpoints. Thus, the results indicate that a deficient pitch perception might compromise music, not because it is specialized for that domain but because music requirements are more fine-grained.
Introduction
Like language, music is universal. All cultures have some form of music, and the vast majority of individuals seek out and enjoy exposure to music in their daily lives. Capacities for music appear early in human development, and continue throughout one’s lifetime (Trehub and Hannon, 2006). However, it is estimated that about 4% of the general population show a pervasive deficit in music perception and production that cannot be explained by hearing loss, brain damage, intellectual deficiencies, or lack of exposure (Peretz, 2008). This musical deficit, commonly known as tone-deafness and now termed congenital amusia, is hereditary (Peretz et al., 2007). Congenital amusia (or simply, amusia) is associated with abnormal gray matter in the right auditory cortex and inferior frontal cortex (Hyde et al., 2007) as well as reduced fiber tracts that connect these two regions (Loui et al., 2009). Amusia is often manifested through a disinterest in music and poor production or re-production abilities, and amusics often report that they do not “understand” music. The condition is typically diagnosed using the Montreal Battery of Evaluation of Amusia (MBEA; Peretz et al., 2003), which assesses the ability to perceive changed notes in short melodies in six tests isolating tonality, contour, rhythm, and memory; amusics fail to perceive melodic pitch violations that are generally quite obvious to musically normal individuals.
It has been hypothesized that the core deficit of congenital amusia is one of fine-grained pitch discrimination (Peretz et al., 2002). Amusic individuals are impaired in processing pitch directions (Foxton et al., 2004; Liu et al., 2010) and detecting pitch deviations that are smaller than one semitone within tone sequences (Hyde and Peretz, 2004) as well as in tone pairs (Peretz et al., 2002). Their pitch discrimination abilities are at chance for tones differing by under half a semitone (compare to estimates of 1/20th to 1/6th of a semitone for normal listeners), and errors can persist up to a distance of two semitones. (Hyde and Peretz, 2004). In music, pitch differences of one semitone are relevant to melodic parsing, and it is necessary to hear these differences reliably in order to comprehend the structure of music. Given that amusic individuals are probably born with such an elemental deficit (normal infants’ pitch acuity is in the order of half a semitone; Olsho et al., 1982), they probably have not assimilated the structure of musical scales nor acquired the sophisticated tonal knowledge that normally developing individuals implicitly acquire via mere exposure (Tillmann et al., 2000). Thus, a perceptual system that is unable to perceive small pitch changes is likely to miss an essential part of musical structure (Peretz and Hyde, 2003).
Speech also makes use of changes in pitch to convey linguistic differences. For example, pitch can distinguish between lexically identical sentences spoken as a statement or a question. Speech intonation perception appears to be spared in the majority of amusic individuals (Ayotte et al., 2002; Peretz et al., 2002; Patel et al., 2005), and amusics generally do not report problems in understanding speech prosody. However, other studies show deficiencies in amusics’ speech intonation perception and production abilities. For example, Patel et al. (2008) showed that approximately 30% of both Québecois and British amusics showed deficits in discriminating whether a spoken utterance was a statement or a question. This deficit was correlated with the rate of pitch change during the final syllable for the British amusics, but not for the Québecois amusics, which may be tied to language differences. Further work tested British amusics on sentences using somewhat smaller pitch differences between statements and questions, and showed mild deficits in identifying, discriminating, and imitating these intonation patterns. These impairments were correlated with the size of their pitch direction discrimination thresholds (Liu et al., 2010).
Another use of pitch in speech occurs in tone languages, such as Mandarin, in which tone is a contrastive feature. In Mandarin, unlike the majority of tone languages, many of these tones involve differences in contour, rather than simply F0. Non-native speaking amusics do not discriminate these lexical tones as well as controls (Nguyen et al., 2009), and amusic native Mandarin speakers tend to make more errors than controls on identification and discrimination of lexical tones (Jiang et al., 2010; Nan et al., 2010), especially confusing the two tones closest in pitch contour (i.e., tones 2 and 3; Nan et al., in press). While most Chinese amusics showed mild to no impairment in these speech-related tasks, a subset, again near 30%, displayed lexical tone agnosia – severe impairments in identifying and discriminating lexical tones (Nan et al., 2010).
The general trend seems to be that a larger amusia-related deficit for speech tasks emerges more consistently when the speech involves more subtle pitch changes. Thus, the differences observed in amusics’ performance on music and speech tasks may reflect a merely quantitative difference between the two domains. The pitch variations used in music are much more fine-grained (Vos and Troost, 1989) than those used in speech intonation (Fitzsimmons et al., 2001; Patel et al., 2008). Statement–question pairs typically have pitch differences on the order of 5–12 semitones, which is considerably larger than the 1–2 semitone differences that are relevant in the parsing of music. Because amusics’ pitch discrimination thresholds typically lie around the 1–2 semitone range (Foxton et al., 2004; Hyde and Peretz, 2004), this would lead to generally good identification of speech prosody, but poor music perception abilities. While previous studies have suggested that subtler pitch changes would lead to more uncertainty in speech intonation processing, none have studied the effects of decreasing intonation pitch cues systematically. The goal of the present study is to test the hypothesis that the larger size of relevant pitch differences in language than in music is responsible for the differences in perceptual abilities between the two domains in congenital amusia.
To this aim, we use otherwise identical sentences pronounced as statements or questions and examine how they are identified across small pitch variations ranging between the statement and question extremes. The main difference between the different versions lies in the pitch of the final syllable. In statement cases (e.g., “He speaks French.”), the pitch of the final syllable falls from its previous level, whereas in question cases (e.g., “He speaks French?”), it rises. This particular case is of interest for two main reasons. First, it is almost entirely pitch dependent, and does not rely on timing or volume differences to create the statement/question distinction. Second, this change in pitch creates a linguistic distinction, such that the two outcomes have different meanings, making it important for full speech understanding. In this study, the pitch difference between statement and question endpoints is divided into 11 equal steps, creating a continuum of sentence intonations. Figure 1 shows an example of one such continuum. We also use tone sequence analogs of each speech stimulus, which have the same mean pitch and timing, but contain no lexical information. Amusics and controls identify each sentence or tone sequence as a statement or a question (“falling” or “rising” for tone sequences). While stimuli at the endpoints of the continuum clearly fall into one category or the other, those at intermediate steps represent more ambiguous versions. Thus, the overall slope of the categorization curve can inform about the boundary used for statement/question categorizations and how much small changes in intonation can affect this judgment.
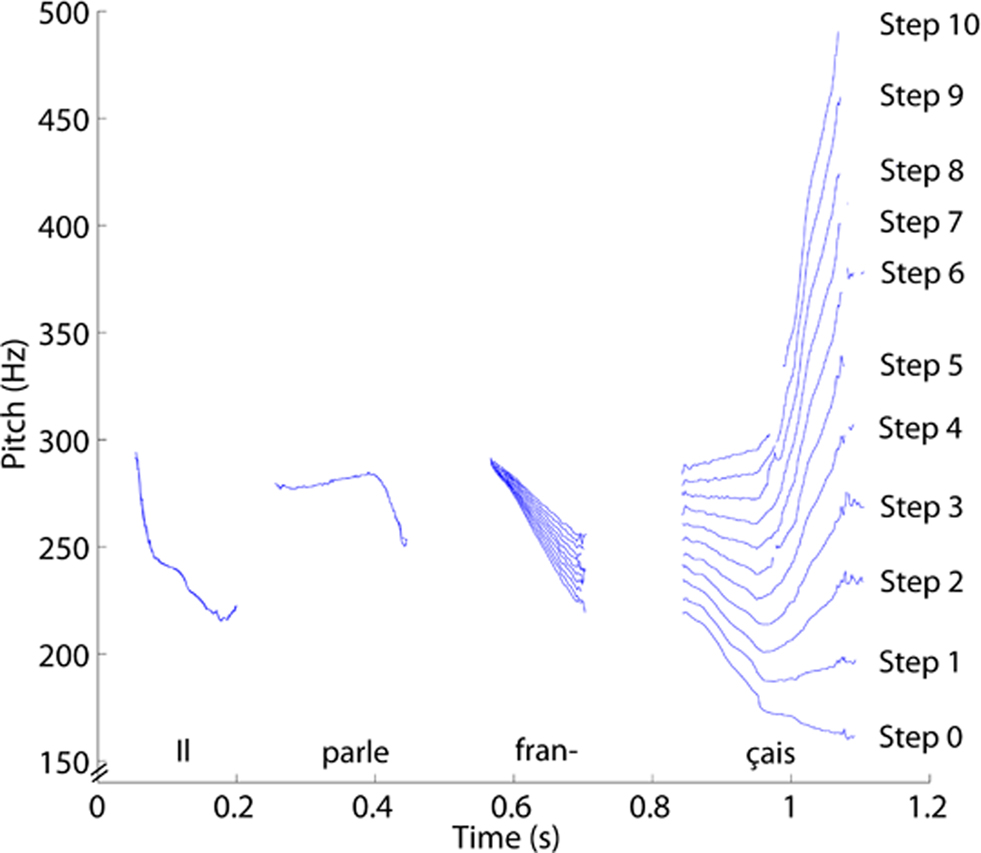
Figure 1. The fundamental frequency across time for all 11 steps of the sentence “Il parle français. ”
We hypothesize that speech will show a steeper categorization curve than tones, reflecting the greater familiarity with the task and stimuli. Amusics should perform worse, with a less steep categorization curve, in both tasks than controls due to their less accurate pitch discrimination abilities. Statement/question or rising/falling identification can be considered as a two-step process, with listeners first perceiving the pitch change present in the stimulus, and then determining whether this change lies above or below some categorization boundary. Errors in perception, in either direction, affect the first step in this process, but do not affect the categorization boundary used for the judgment. Normal listeners will accurately perceive the pitch change, making only a few errors, which should lead to a relatively steep categorization curve. Amusics, on the other hand, will make more pitch discrimination errors. If we assume that these errors are evenly distributed, then many of the errors for stimuli close to the categorization boundary will cause it to be misperceived as being on the other side of the boundary. However, the same amount of error for stimuli far from the categorization boundary will not cause it to cross this boundary. Thus, we predict that most amusics should correctly categorize most of the stimuli at the extremes of the continua, in line with prior studies using the same stimuli (Ayotte et al., 2002; Peretz et al., 2002; Patel et al., 2005, 2008), but make more categorization errors as stimuli approach the categorization boundary. Therefore, the slope of the curve should be related to amusics’ discrimination thresholds for pitch. We also hypothesize that amusics and controls will show categorization boundaries in the same position along the continuum, reflecting the fact that it is only their perception, and not their judgment, which is impaired.
Materials and Methods
Participants
Ten congenital amusics (six female) and 10 matched controls (seven female) gave informed consent to participate in the experiment1. Amusics were determined by the scores on the MBEA (Peretz et al., 2003). This battery assesses the components of music processing with a total of six tests concerning melody, rhythm, meter, and memory. Table 1 shows MBEA global scores, pitch discrimination thresholds obtained in five-tones sequences (Hyde and Peretz, 2004; one amusic case – TC – did not complete this task), and other background information for each amusic participant and for the control group. Ethics approval was granted by the Comité d’éthique de la recherche de la Faculté des arts et des sciences, and informed consent was obtained from all participants.
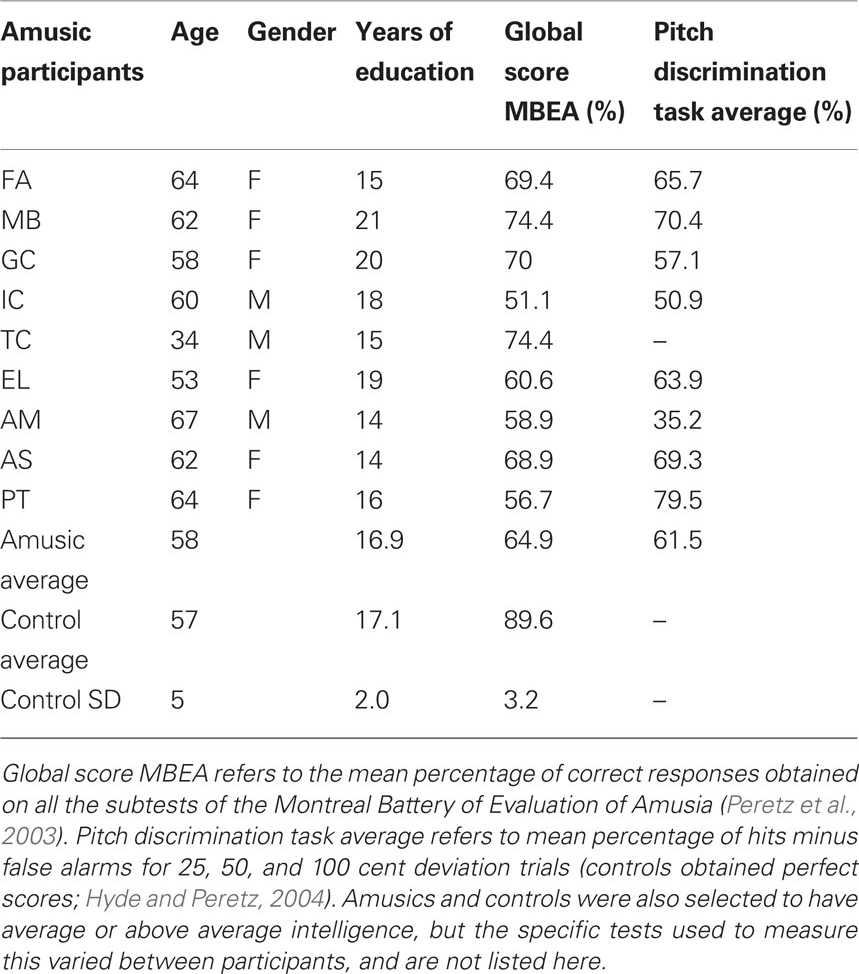
Table 1. Amusic and control participant characteristics.
Stimuli
Eight sentences (four pairs of statements and questions) and their tone analogs were taken from the material used by Patel et al. (1998) initially. The sentences were spoken by a female native French speaker with a continental accent (average F0 across all sentences = 251.46 Hz). Sentences ranged between 4 and 7 syllables (average duration = 1.33 s). Members of each pair were lexically identical but differed in intonation contour. Specifically, the final region of the intonation contour (usually the last syllable or word) differed in whether it contained an upward or downward pitch glide. Sentences were modified using a cross-splicing technique so that members of a pair were acoustically identical until the final region. The waveform of the final region was edited so that across members of a pair the timing of syllables was identical and the acoustic waveform amplitude and loudness were equalized (by scaling up the lower amplitude sentence to match the higher), leaving pitch as the only salient cue for discrimination (see Patel et al., 1998, for details).
These statement–question pairs served as endpoints of a continuum created by modifying the final F0 value, only for the regions that distinguished the statements and questions. Using Praat software, nine intermediate steps were created between the statement and question endpoints, equally spaced along a linear scale in Hertz (Hertz is a typical scale used in speech research). Each sentence set therefore comprised 11 steps (ranging from 0 to 10) such that step 0 was a naturally spoken statement, step 10 a naturally spoken question, and steps 1–9 a linear progression of last word pitch heights spanning the range between the outer steps. Each step varied only in pitch, and the beginnings of each sentence were identical across steps. This manipulation yielded 44 different speech stimuli. Because the endpoints are naturally spoken sentences, the continua do not reflect any a priori assumptions about the pitch patterns of statements and questions, but rather a reasonable range of steps between the two. Table 2 lists the sentences and describes the pitch difference between each step. Figure 1 shows the fundamental frequency across time for all 11 steps of one sample sentence.
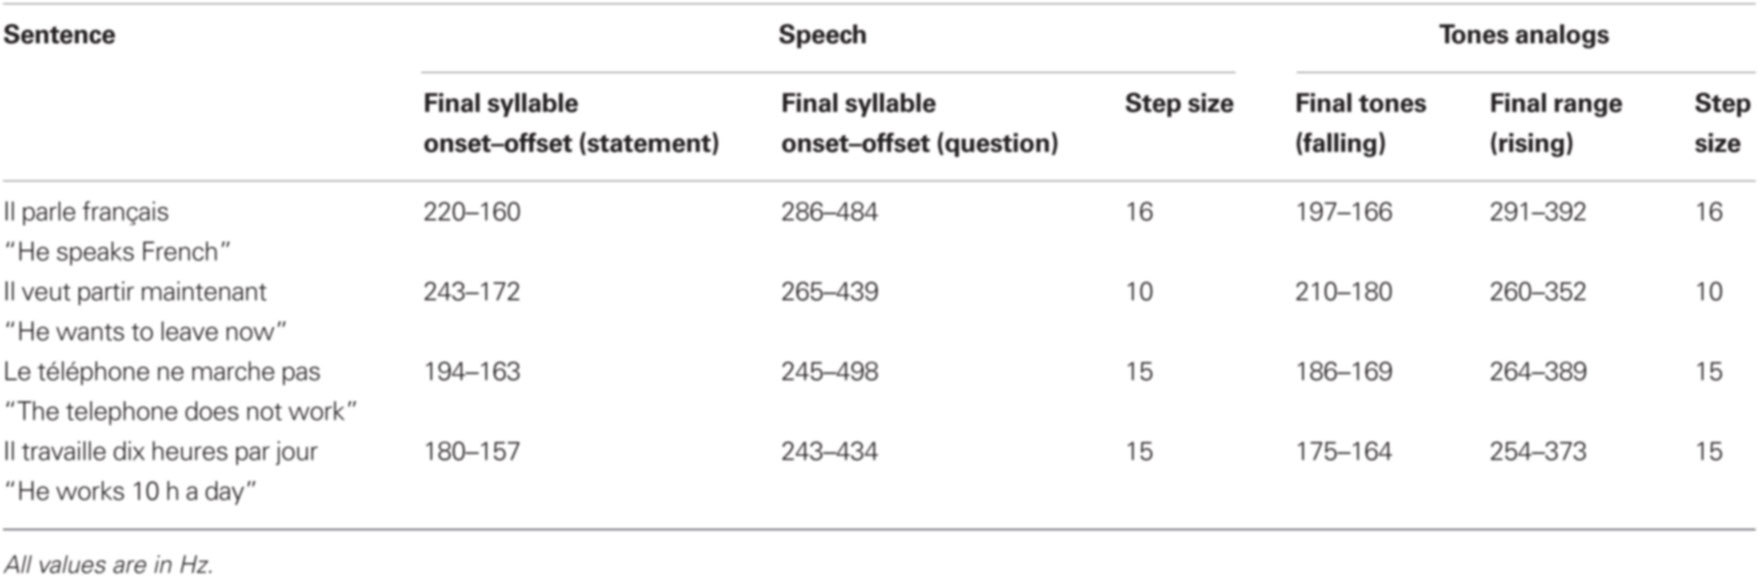
Table 2. The F0s of the onset and offset of the final syllable for speech, and of the final two tones for tone analogs are displayed for the outermost steps of each sentence, labeled “Statement” and “Question” here for speech, and “Falling” and “Rising” for tone analogs. The average step size (the frequency difference between successive steps) is also shown for each stimulus.
For each stimulus sentence, an analogous tone sequence was created by replacing each syllable with a tone whose pitch was fixed at the frequency midway between the highest and lowest F0 of the syllable (see Patel et al., 1998, for details). The final syllable in each sentence was replaced by two tones in each case, to model the rise or fall of the original sentence prosody over that word. Prior work shows that there are no performance differences among amusics associated with a fixed-tone vs. a gliding-tone representation of speech contour (Patel et al., 2005). All tones had a complex frequency structure consisting of a fundamental and seven odd harmonics of decreasing amplitude, giving them a clarinet-like quality, so that they would not be confused with mumbled speech, and each tone used the same amplitude. Members of each tone sequence continuum were identical in terms of the duration and rhythm of tones, and differed in pitch only on the final tones of the sequence. A 10–15-ms gap was placed between tones which replaced directly adjacent syllables. These manipulations resulted in tone sequences which followed the speech contour of each of the 44 speech stimuli. Figure 2 shows the fundamental frequency across time for all 11 steps of one sample tone analog. Examples of speech and tone analog stimuli can be found online at http://www.brams.umontreal.ca/short/sq-intonation/
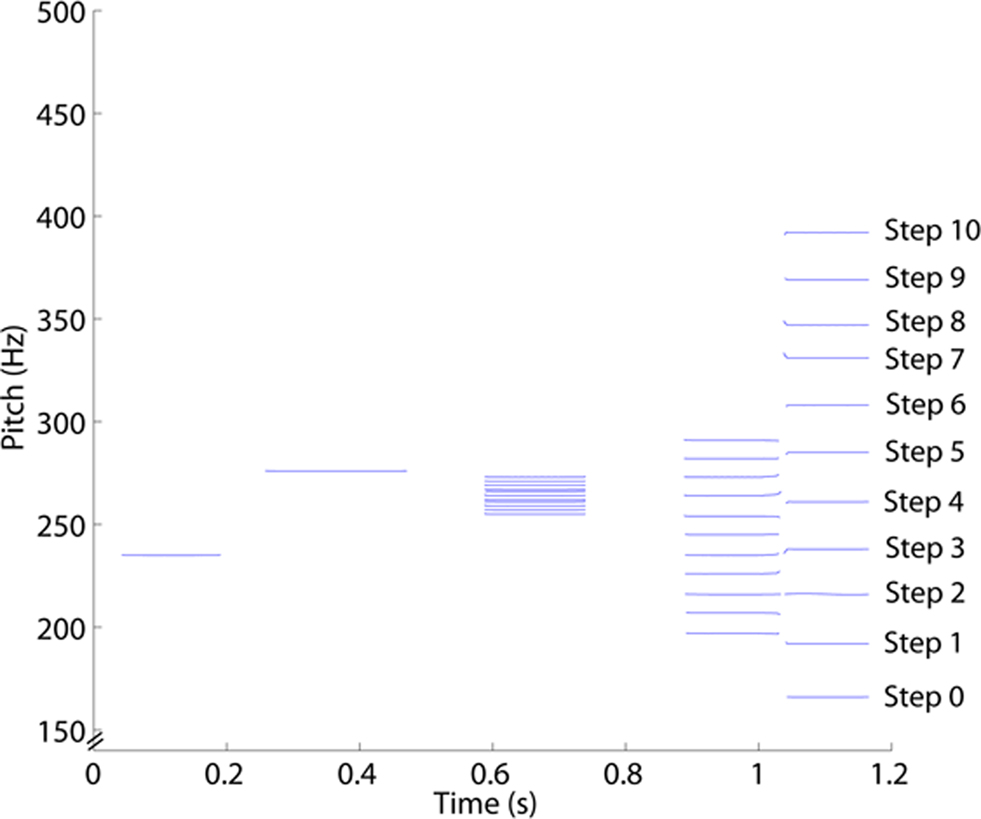
Figure 2. The fundamental frequency across time for all 11 steps of the tone analog of the sentence “Il parle français. ” The final syllable is split into two tones. Note that the 11 steps seem more closely spaced in this condition only because they are at the means of the final syllables, which are changing in pitch.
Procedure and Design
The experiment was blocked into sentence and tone sequence conditions. In the sentence block, the 44 speech stimuli were randomly presented, and participants were asked to judge whether each stimulus was a statement or a question. The tone sequence block used the same design, but participants were instead asked to judge whether the stimulus ended on a rising or falling contour instead. Stimuli were heard through Sony MDR CD550 headphones, and presentation levels were adjusted to each participant’s comfort. Participants pressed the left “Alt” on the keyboard to indicate a statement or falling contour, and “0” on the number pad to indicate a question or rising contour. Responses were recorded using E-prime. Three of the nine amusics and four of the nine controls were presented with the sentence block before the tone sequence block.
Results
For each participant, identification scores were calculated as the mean of “question” responses (Figure 3) and of “rising” responses (Figure 4) collected at each step for each sentence and tone stimulus, respectively. The functions are a fairly regular S shape for both amusics and controls. The logistic regression best fitting the group data are overlaid in the Figure. For each participant, the logistic regression was computed for each of their answers, shown in Table 3, using step as a predictor. The slope of each logistic regression indicates how consistent each participant’s categorization of the sentences or melodies was: high slopes show a clearly defined categorization boundary, and lower slopes indicate less internal consistency. Because of the small number of data points for each participant at each step, there is a good amount of variability associated with individual subjects’ regression estimates; however, the logistic regression analysis technique is designed to account for these types of errors, and most participants’ data showed a good fit to their regressions. Because logistic regression slopes can rise exponentially with linearly increasing accuracy (which is why slope values for nearly perfect performance are disproportionately large), non-parametric tests (Mann–Whitney U) were used to evaluate the regression data as well as the dividing line data. For all cases where the assumptions of the t-tests were not severely violated, the significance or non-significance was confirmed by an independent measures t-test. A Mann–Whitney U comparing slopes of the individual regressions between amusics and controls in the speech condition showed significantly lower slopes of the identification functions for amusics than for controls, Mann–Whitney U = 6.5, p = 0.006. In the tone sequence condition, we also found significantly lower slopes for the identification function for amusics than controls, Mann–Whitney U = 17.5, p = 0.04. In both speech and tone sequences, amusics showed less consistent categorization than did controls. t-Tests comparing the slopes of the identification functions between speech and tone sequence conditions showed no significant difference between the two, either for amusics or controls.
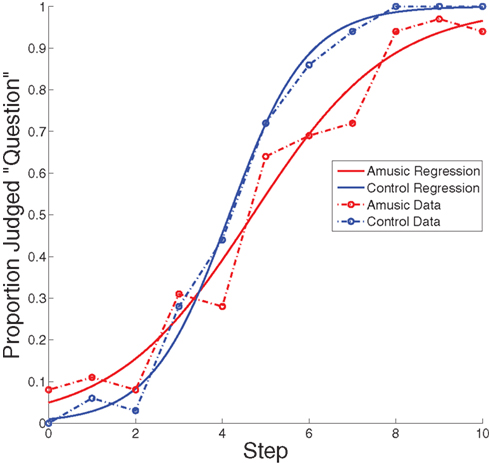
Figure 3. Observed data and logistic regressions for sentence stimuli. These regressions are derived from the summed data across controls and amusics, and represent a regression of the average rather than an average of individual regressions. Binomial confidence intervals are omitted here for clarity, but do not exceed ±0.17.
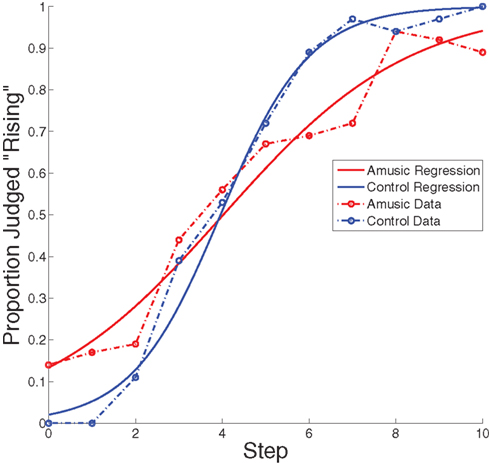
Figure 4. Observed data and logistic regressions for tone sequence stimuli. These regressions are derived from the summed data across controls and amusics, and represent a regression of the average rather than an average of individual regressions. Binomial confidence intervals are omitted here for clarity, but do not exceed ±0.17.
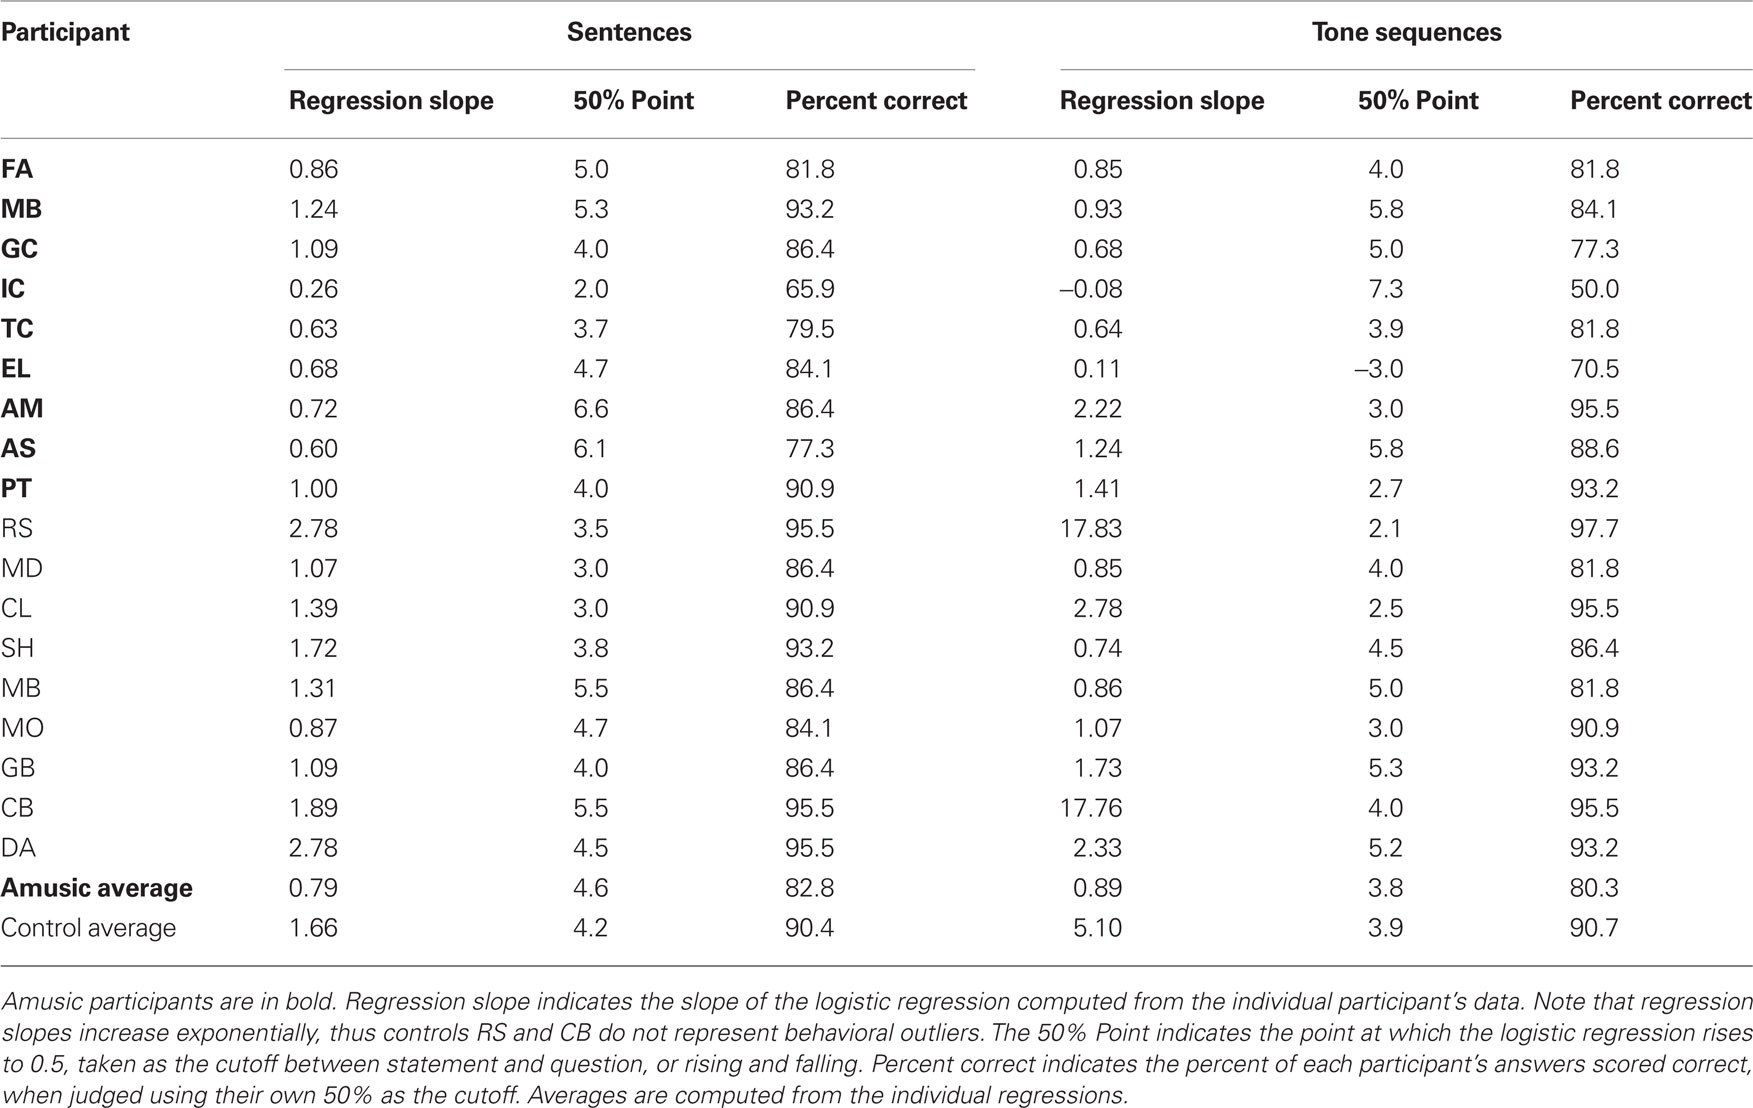
Table 3. Individual participants’ regressions analyses for sentence and tone sequence conditions.
As can be seen in Table 3, two amusic participants, IC and EL, showed very low slopes for their regressions, in the tone sequence condition. This indicates that, even toward the most extreme cases, these participants were unable to reliably categorize tone sequences as ending on a rising or falling pitch. These participants accounted for the majority of the errors among amusics in the tone sequence condition. When these two participants are removed from the analysis, the difference between amusics and controls in the tone sequence condition no longer reaches significance, Mann–Whitney U = 17.5, n.s.
Based on the results of the individual logistic regressions, we examined the dividing line between steps categorized as statements (or falling sequences) and steps categorized as questions (or rising sequences). This was defined as the point where the logistic regression reaches 50%, and represents the step at which each participant divides between the two categories. This value is negative in one case (EL), reflecting the participant’s bias to identify tone stimuli as “rising”; although she still showed a tendency to respond “falling” more often for lower steps than higher steps, the majority of her responses were “rising” across all steps. Nevertheless, the position of the dividing line did not vary between amusics and controls in either the speech or tone sequence condition. These dividing lines were used to determine the percentage of correct responses, such that all responses of question or rising were considered as correct when in a step above the individual dividing line and incorrect when in a step below it. These data were evaluated with an independent measures t-test, as they did not violate the assumptions; all effects were confirmed with a non-parametric Mann–Whitney U-test. For the speech condition, the percentage of correct responses was lower for the amusics than for the controls, t(13) = −2.43, p = 0.03. In the tone sequence condition, the percentage of correct responses for amusics was lower than that for controls, but this effect did not meet the threshold for significance, t(11) = 2.08, p = 0.06; this effect was of a similar size when measured through non-parametric tests. Again, this difference becomes less significant when IC and EL are removed from the analysis, t(12) = 1.446, n.s.
Correlations were also computed among amusics between regression slopes, 50% points, and percent correct values for speech and tone conditions and the amusics’ discrimination abilities (here defined as average hits minus false alarms across the 25, 50, and 100 cent conditions used in Hyde and Peretz, 2004; see Table 1). Although there was a trend for higher speech regression slopes to be associated with better discrimination abilities, r = 0.42, neither this correlation nor any of the others measured reached significance. Performance was not related to the severity of the disorder, as measured with the MBEA, either.
Because the dividing lines were consistent between amusics and controls (within tasks), a follow-up analysis was done, scoring the answers of amusics and controls as either correct or incorrect using this consensus dividing line in each domain. Whereas the previous analyses were performed using the dividing line computed separately for each individual participant, this analysis uses the same dividing line for all participants, based on the aggregate data. In the speech condition, for steps 0–4, all answers of “statement” were scored as correct, and answers of “question” as incorrect, and vice versa for steps 5–10. In the tone condition, this consensus dividing line was slightly lower, between steps 3 and 4. A 2 × 2 mixed-design ANOVA using the factors of amusia and stimulus type (speech or tone sequence) showed a significant effect of amusia, F(1, 16) = 6.00, p = 0.026. Amusics made more errors in their categorization than controls when judged against global standards. There was no effect of Stimulus Type, and no interaction between Stimulus Type and Amusia. A follow-up analysis comparing amusics’ and controls’ shift in identifications for speech stimuli between step 4 and 5 showed that amusics were no more likely than controls to change their identifications from statement to question between these two steps, t(16) = 0.588, p = 0.565, n.s. In addition, no effect of order of presentation (tones first vs. speech first) was found for any measures in this experiment, nor was any difference found between the stimuli using large step sizes (15–16 Hz) and the one using small step sizes (10 Hz). We also compared the error rates for the endpoint stimuli, the only ones which are naturally produced and can be said to have an actual correct or incorrect response. Amusics’ responses were not significantly different from controls’ at either endpoint in speech or music, for statements or for questions [t(8) > 1.84, p > 0.10, n.s., for all four comparisons]. Only one of the nine amusics (IC) tested here showed a noticeable deficit in speech contour processing at the endpoints (more than one error at step 0 or 10) in speech, and the same subject was even more impaired in evaluating the tone sequences as well (although this is a very limited sample from the data set).
Discussion
In this study, amusics and controls were presented with a continuum of sentences ranging from statement to question, or their analogous tone sequences. Each participant was asked to categorize the sentence examples as a question or a statement, and to categorize the tone sequence examples as rising or falling. Sentences and tone sequences were categorized similarly to each other. The lack of differences between identification functions for speech and tone stimuli indicate that, for both controls and amusics, the pitch processing necessary to make these judgments is not specific to language. Amusics showed no indication that their deficit specifically affected one domain or the other for identification judgments, which bolsters the idea that their pitch deficits are not limited to the domain of music. However, across both sets of stimuli, the data show that amusics make these categorizations in a less consistent manner than the controls, and these differences were seen by examining how the judgments changed over changing pitch differences (i.e., between steps), rather than only the naturally produced endpoints.
Despite their different abilities in making these judgments, the regressions showed that, overall, amusics and controls used the same categorization boundaries between statements and questions. This same pattern held over the tone sequence stimuli as well. Despite the variation between participants (which was greater for amusics than controls), both groups judged the majority of sentence stimuli on step 4 or below to be statements, and step 5 or above to be questions. For the tone sequence stimuli, the dividing line between rising and falling judgments was lower, between steps 3 and 4, but still consistent between groups. When these dividing lines were used to assess accuracy, amusics proved to be less accurate than the controls, making more errors both when using their own judgments to establish the dividing line as well as when judged according to the consensus standards. This is true for both the speech and tone sequence stimuli, although the tone sequence results are largely driven by two amusic subjects who perform particularly poorly.
Two amusic subjects (IC and EL) performed very poorly with tones but did better with speech; IC showed a small improvement in speech compared with music, but was impaired on both tasks, whereas EL showed fairly good speech identification. This pattern is the opposite of what was observed in a same-different discrimination task (Patel et al., 2008). In that earlier report, IC and EL were among the few amusics who were more impaired with speech discrimination than with tone discrimination. Task demands may account for this discrepancy. Whereas in Patel et al.’s task, participants were asked to explicitly discriminate between two successive stimuli, here, participants were asked to categorize them. The categorization task is likely to be more familiar in the case of speech (statement vs. question categorization) than tones (rising vs. falling), which may have compensated for their poor intonation discrimination abilities.
In general, the pattern of results indicates that amusics and controls are using the same standards to categorize stimuli, but that amusics do so with less accuracy and internal consistency. Amusics’ shallower categorization curves reflect the perceptual errors made by amusics, which would occur equally often at each step of the continua, but would disproportionately affect the categorization judgments of steps closer to the boundary, given that only small pitch perception errors near the boundary would cross that boundary. However, these shallower curves do not affect the placement of this boundary line itself. Thus, the results are consistent with amusics’ deficits in pitch perception (Foxton et al., 2004; Hyde and Peretz, 2004), although the correlation between categorization and pitch thresholds did not reach significance. This might be due to the fact that we report here pitch discrimination thresholds obtained in the context of a repeated tone sequence (Hyde and Peretz, 2004). These pitch thresholds are much higher (above one semitone) when tested with a pitch direction task, that is closer to the present context, rather than pitch change task (Foxton et al., 2004). In the current experiment, the average pitch difference between steps 4 and 5 of the speech stimuli was slightly more than one semitone (between 0.6 and 1.4 semitones) and matched the pitch direction threshold of most amusics (Foxton et al., 2004). Because this is explicitly the task of the tone sequence judgment and essentially the task of a statement–question judgment, these factors may explain why amusics’ perceptual errors lead to miscategorizations even when the difference between steps is larger than one semitone.
These results have implications for amusics who speak a tonal language, such as Mandarin. These languages rely on lexical tones, which are systematic patterns of pitch change acting as discriminating features of words. Thus, our finding that amusics’ pitch processing difficulties extend to language as well suggests that amusic tonal language speakers may exhibit difficulties in distinguishing lexical tones from one another. In fact, two recent studies confirm this suggestion, showing that amusic speakers of a tonal language have impairments in discriminating and identifying both melodic contour and lexical tones (Jiang et al., 2010; Nan et al., 2010). These studies support the idea that the pitch processing difficulties of amusics can transfer to speech processing.
Overall, these results show that amusics are worse at categorizing stimuli with changing pitch patterns than controls, but do not categorize in a fundamentally different way. The errors that amusics make in categorization seem to be due to the pitch perception deficit, which creates more uncertainty as to the pitch contour. The amusics can accurately identify unambiguous examples of statements and questions but have problems with fine variations between these endpoints; this replicates the former results of Ayotte et al. (2002) and Patel et al. (2008), while showing how amusics’ deficits emerge in the data when the pitch variations in intonation are systematically manipulated. These results provide support for the notion that the pitch deficit inherent in congenital amusia is music-relevant but not music-specific.
Conflict of Interest Statement
The authors declare that the research was conducted in the absence of any commercial or financial relationships that could be construed as a potential conflict of interest.
Acknowledgments
This work was supported by grants from the Canadian Institutes of Health Research, the Natural Sciences and Engineering Research Council of Canada and a Canada Research Chair in neurocognition of music to Isabelle Peretz and a fellowship in Auditory Cognitive Neuroscience from the CREATE program of the Natural Sciences and Engineering Research Council of Canada to Sean Hutchins.
Footnote
- ^The data from one amusic participant, JL, was removed, based on the onset of Parkinson’s disease. The data from one control participant was also removed as an outlier, due to presumed inattentiveness during the speech identification task.
References
Ayotte, J., Peretz, I., and Hyde, K. L. (2002). Congenital amusia: a group study of adults afflicted with a music-specific disorder. Brain 125, 238–251.
Fitzsimmons, M., Sheahan, N., and Staunton, H. (2001). Gender and the integration of acoustic dimensions of prosody: implications for clinical studies. Brain Lang. 78, 94–108.
Foxton, J. M., Dean, J. L., Gee, R., Peretz, I., and Griffiths, T. (2004). Characterization of deficits in pitch perception underlying tone-deafness. Brain 127, 801–810.
Hyde, K. L., Lerch, J. P., Zatorre, R. J., Griffiths, T. D., Evans, A., and Peretz, I. (2007). Cortical thickness in congenital amusia: when less is better than more. J. Neurosci. 27, 13028 –13032.
Hyde, K. L., and Peretz, I. (2004). Brains that are out of tune but in time. Psychol. Sci. 15, 356–360.
Jiang, C., Hamm, J. P., Lim, V. K., Kirk, I. J., and Yang, Y. (2010). Processing melodic contour and speech intonation in congenital amusics with Mandarin Chinese. Neuropsychologia 48, 2630–2639.
Liu, F., Patel, A. D., Fourcin, A., and Stewart, L. (2010). Intonation processing in congenital amusia: discrimination, identification, and imitation. Brain 133, 1682–1693.
Loui, P., Alsop, D., and Schlaug, G. (2009). Tone deafness: a new disconnection syndrome? J. Neurosci. 29, 10215–10220.
Nan, Y., Sun, Y., and Peretz, I. (2010). Congenital amusia in speakers of a tone language: association with lexical tone agnosia. Brain 133, 2635–2642.
Nguyen, S., Tillmann, B., Gosselin, N., and Peretz, I. (2009). Tonal language processing in congenital amusia. Ann. N. Y. Acad. Sci. 1169, 490–493.
Olsho, L. W., Schoon, C., Sakai, R., Turpin, R., and Sperduto, V. (1982). Auditory frequency discrimination in infancy. Dev. Psychol. 18, 721–726.
Patel, A. D., Foxton, J. M., and Griffiths, T. D. (2005). Musically tone-deaf individuals have difficulty discriminating intonation contours extracted from speech. Brain Cogn. 59, 310–313.
Patel, A. D., Peretz, I., Tramo, M., and Labrecque, R. (1998). Processing prosodic and musical patterns: a neuropsychological investigation. Brain Lang. 61, 123–144.
Patel, A. D., Wong, M., Foxton, J., Lochy, A., and Peretz, I. (2008). Speech intonation perception deficits in musical tone deafness (congenital amusia). Music Percept. 25, 357–368.
Peretz, I., Ayotte, J., Zatorre, R. J., Mehler, J., Ahad, P., Penhune, V. B., et al. (2002). Congenital amusia: a disorder of fine-grained pitch discrimination. Neuron 33, 185–191.
Peretz, I., Champod, A. S., and Hyde, K. (2003). Varieties of musical disorders. the Montreal battery of evaluation of amusia. Ann. N. Y. Acad. Sci. 999, 58–75.
Peretz, I., Cummings, S., and Dube, M. P. (2007). The genetics of congenital amusia (tone deafness): a family-aggregation study. Am. J. Hum. Genet. 81, 582–588.
Peretz, I., and Hyde, K. L. (2003). What is specific to music processing? Insights from congenital amusia. Trends Cogn. Sci. 7, 362–367.
Tillmann, B., Bharucha, J. J., and Bigand, E. (2000). Implicit learning of tonality: a self-organizing approach. Psychol. Rev. 107, 885–913.
Keywords: congenital amusia, speech, prosody, pitch
Citation: Hutchins S, Gosselin N and Peretz I (2010) Identification of changes along a continuum of speech intonation is impaired in congenital amusia. Front. Psychology 1:236. doi: 10.3389/fpsyg.2010.00236
Received: 28 September 2010;
Accepted: 12 December 2010;
Published online: 27 December 2010.
Edited by:
Andrew J. Oxenham, University of Minnesota, USAReviewed by:
Chris Plack, The University of Manchester, UKAndrew J. Oxenham, University of Minnesota, USA
Fang Liu, University College London, UK
Copyright: © 2010 Hutchins, Gosselin and Peretz. This is an open-access article subject to an exclusive license agreement between the authors and the Frontiers Research Foundation, which permits unrestricted use, distribution, and reproduction in any medium, provided the original authors and source are credited.
*Correspondence: Sean Hutchins, BRAMS Laboratory, Pavillon 1430 Boulevard Mont-Royal, Montréal, QC H2V 4P3, Canada. e-mail:c2Vhbi5taWNoYWVsLmh1dGNoaW5zQHVtb250cmVhbC5jYQ==