 Harold Hill1*
 Peter Claes2 Michelle Corcoran1
 Mark Walters3
 Alan Johnston4,5 and John Gerald Clement2
- 1 School of Psychology, University of Wollongong, Wollongong, NSW, Australia
- 2 Melbourne Dental School, University of Melbourne, Melbourne, VIC, Australia
- 3 Cranio-Maxillo-Facial Unit, Princess Margaret Hospital for Children, Perth, WA, Australia
- 4 Department of Cognitive, Perceptual and Brain Sciences, University College London, London, UK
- 5 CoMPLEX, University College London, London, UK
Not all detectable differences between face images correspond to a change in identity. Here we measure both sensitivity to change and the criterion difference that is perceived as a change in identity. Both measures are used to test between possible similarity metrics. Using a same/different task and the method of constant stimuli criterion is specified as the 50% “different” point (P50) and sensitivity as the difference limen (DL). Stimuli and differences are defined within a “face-space” based on principal components analysis of measured differences in three-dimensional shape. In Experiment 1 we varied views available. Criterion (P50) was lowest for identical full-face view comparisons that can be based on image differences. When comparing across views P50, was the same for a static 45° change as for multiple animated views, although sensitivity (DL) was higher for the animated case, where it was as high as for identical views. Experiments 2 and 3 tested possible similarity metrics. Experiment 2 contrasted Euclidean and Mahalanobis distance by setting PC1 or PC2 to zero. DL did not differ between conditions consistent with Mahalanobis. P50 was lower when PC2 changed emphasizing that perceived changes in identity are not determined by the magnitude of Euclidean physical differences. Experiment 3 contrasted a distance with an angle based similarity measure. We varied the distinctiveness of the faces being compared by varying distance from the origin, a manipulation that affects distances but not angles between faces. Angular P50 and DL were both constant for faces from 1 to 2 SD from the mean, consistent with an angular measure. We conclude that both criterion and sensitivity need to be considered and that an angular similarity metric based on standardized PC values provides the best metric for specifying what physical differences will be perceived to change in identity.
Introduction
Being able to detect differences between different face images is critical for recognition. However not all detectable changes correspond to a change in identity. In this paper we measure the criterion difference people use when making “same or different identity?” judgments, with criterion specified in terms of physical differences in three-dimensional (3D) shape of the face itself. The criterion corresponds to the physical difference above which people will tend to respond “different” and below which they will tend to respond “same.” We also measure sensitivity to determine the extent to which these measures co-vary. For example in Experiment 1 we vary viewpoint, a manipulation well-known to affect sensitivity but one which does not affect underlying differences in shape. Both criterion and sensitivity are tested and defined within a “face-space” based on a principal components analysis (PCA) of measured variations in 3D face shape and, in Experiments 2 and 3, differences between conditions allow us to test between alternative distance metrics for relating physical to perceived differences.
Many previous studies have addressed our ability to detect changes between faces. For example Freire et al. (2000) examined detection of changes in facial features or the spacing between those features. Some of the motivation for the current study comes from the observation that examples of the stimuli in this and many other studies can often look like the same person even when there are clearly detectable image differences (e.g., Figure 1; Freire et al., 2000). The instructions given in these studies encourage participants to respond on the basis of any difference by emphasizing that “faces would be quite similar in appearance” (Freire et al., 2000) or “kind of like twins” (Mondloch et al., 2002) and “Correct” responses are defined in terms of the presence or absence of any physical difference. Additionally, comparisons are made between identical views – examples are often modified images – allowing image, rather than face, based. Detecting differences between images is necessary for recognition and the studies cited have made critical contributions to understanding featural and configural information. Here we measure the magnitude of differences that are perceived as a change in identity as well as measuring sensitivity to differences.
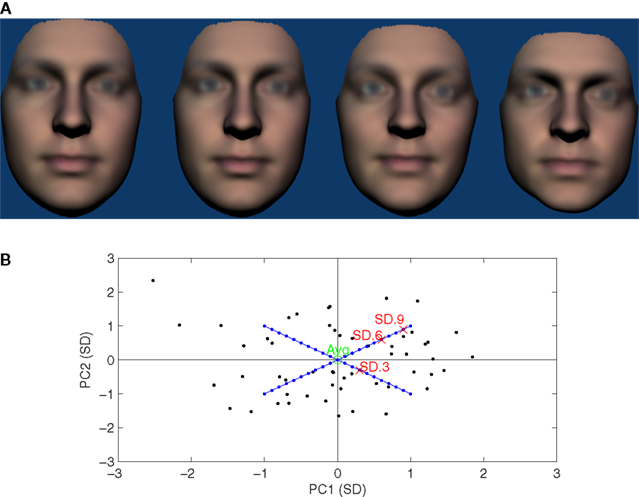
Figure 1. (A) Examples of the stimuli shown in the FF condition of Experiment 1. From left to right, the average reference face and 0.3, 0.6, and 0.9 SD comparison faces. The P50 observed in this condition was 0.33 SD, just to the right of the second face from the left. (B) Two-dimensional illustration of face-space used for Experiment 1. Black points show locations of the 54 faces used to define the face-space. The locations of the average reference face and the 0.3, 0.6, and 0.9 SD comparison faces illustrated in (A) are also indicated. The blue diagonals and points represent possible locations of the comparison faces used and for which Euclidean and Mahalanobis distances are equivalent. Please note that in the 22 dimensional space used mean Mahalanobis distance from the average of the 54 actual faces was 4.6 SD ≈√(22) cf (Burton and Vokey, 1998).
This distinction mirrors that made between sensitivity and bias in signal detection theory. Same/different and other decisions are co-determined by both sensitivity, the ability to discriminate, and criterion, the point on the decision axis where responses change (Macmillan and Creelman, 2005). It is criterion that determines bias, the tendency to prefer one response over the other. In low level psychophysics sensitivity is normally the focus and the same/different task avoided precisely because it is subject to bias. Instead other tasks including two-alternative forced choice (2-AFC) and odd-one-out are used that are designed to minimize bias. Correct responses can be made on the basis of any difference and bias reflects an arbitrary tendency to prefer one response over another. These tasks have been applied to measuring sensitivity to differences between faces (Rhodes et al., 2007; Dakin and Omigie, 2009; Ross et al., 2010) but, again, stimuli often look like the same person even when the images can be discriminated. As Rhodes et al. (2007) point out “only in the case of identical twins, do we need to determine whether two faces are truly identical or not.” While those authors go on to use suprathreshold measures of sensitivity, we use the criterion difference inherent to a same/different decision to estimate the magnitude of physical different that is perceived as a change in identity.
Bias has been reported in previous experiments on face matching and recognition. For example there is a bias to respond “same” when matching a photograph to a live individual (Kemp et al., 1997; Megreya and Burton, 2008; Davis and Valentine, 2009), when matching other as opposed to own race faces (Slone et al., 2000; Meissner and Brigham, 2001), if instructions are given emphasizing that appearance may have changed (Chapman and Wells, 2007), if a photographic line-up is presented simultaneously as opposed to sequentially (Meissner et al., 2005), or if the faces being matched have similar external features (Fletcher et al., 2008). While all of these results can be interpreted in terms of criteria, measuring this has not previously been the explicit aim as it is here.
We record the proportion of “different” responses as a function of the physical differences between faces and use these proportions to estimate the physical difference that would result in people responding “different” 50% of the time (P50). P50 specifies the abscissa location of the psychometric function that links physical differences to observer responses and thus is determined by criterion. Specifically, P50 corresponds to the point where the mean difference between the faces in a pair would be equal to the criterion. We also estimate difference limen (DL), half the difference between the 75 and 25% points on the psychometric function. This corresponds to the steepness of the psychometric function, and index of sensitivity: a smaller DL indicates a steeper function and thus higher sensitivity. Previous studies using same/different tasks have only reported proportion correct providing an indication of sensitivity but not criterion (Freire et al., 2000; Mondloch et al., 2002). Estimating both P50 and DL allows us to focus on criterion but also relate our results to previous findings on sensitivity. It also allows us to test whether criterion and sensitivity co-vary.
In Experiment 1 we vary the views available, a manipulation well-known to affect sensitivity (Bruce et al., 1987; Hill et al., 1997; Troje and Bulthoff, 1998; Favelle et al., 2007), especially for unfamiliar faces (Hancock et al., 2000). In many of the studies cited above the faces being compared were presented in the same view (Freire et al., 2000; Mondloch et al., 2002; Rhodes et al., 2007; Dakin and Omigie, 2009; Ross et al., 2010) and this allows decisions to be based on image differences alone: all differences in the images presented result from differences between the faces. Changing view introduces image changes that are much larger than those associated with a change in identity (Moses et al., 1996), but which themselves do not provide information about whether the face is the same or different person. As well as the usual identical full-face (0°) view comparison, we also include two conditions where the faces are compared across changes in viewpoint. One condition involved matching between static full-face and a three-quarter (TQ; 45°) views, a condition well-known to reduce sensitivity (Liu and Chaudhuri, 2002). The other involved matching between an animated sequence of seven views (−45° to 45° in steps of 15°), temporally offset to avoid image based comparisons (see Movie S1). Similar animations have been shown to increase subsequent sensitivity compared to static or jumbled views in an old/new recognition task (Hill et al., 1997). If criterion is independent of sensitivity and is determined by differences between faces that are independent of viewing conditions it, unlike sensitivity, will not vary the two conditions requiring face based comparisons.
The differences between reference and comparison faces in Experiment 1 and the experimental manipulations used in Experiments 2 and 3 are all defined in terms of “face-space,” a widely used metaphor defined and elaborated elsewhere (Valentine, 1991, 1995, 2001; O’Toole et al., 2001b). Briefly, face-space models propose that faces are encoded in terms of their location in a multi-dimensional space where the dimensions correspond to “features” that can be used to discriminate between them. Distances within the space correspond to similarity and are fundamental to categorization decisions including recognition (Aeria et al., 2010). In all the experiments reported here we use a physical face-space (O’Toole et al., 2001a) based on PCA of differences in 3D shape to define the stimuli tested (Vetter and Blanz, 1999; Claes, 2007). We also compare conditions designed to test between different possible distance metrics within this space to see which best predict human perception and decisions.
We focus on shape because it is a property of the face itself and as such genuinely represents a face- rather than an image-space. In practical terms shape is also relatively difficult to alter artificially. It is the target of many forms of surgical interventions, and critical for craniofacial reconstruction (Claes et al., 2006) and understanding how physical changes in shape are perceived is critical for these applications. Surface reflectance is the other key property in determining the appearance of faces, but the reflectance information currently provided by scanners is itself image based and affected by factors extrinsic to the face itself, particularly lighting. Also, while relatively few principal components (PCs) can explain the majority of the data in the case of shape, modeling detailed facial reflectance including unique facial markings is much more challenging and requires many more components to explain an equal proportion of variation. Lastly reflectance can and is readily and easily altered by the application of makeup. Thus, while we do not wish to deny the importance of reflectance information (Hill et al., 1995; O’Toole et al., 1999; Russell et al., 2007), here we focus on shape, and keep reflectance constant.
Principal components analysis of shape or any other property defines a space with orthogonal axes that correspond to the principal sources of variation between faces. The PCs are the dimensions of the space and are ordered in terms of the proportion of the total variation that they account for. PCA based physical face-spaces are widely used, although most are based on PCA of face images (Turk and Pentland, 1991). The performance of automatic systems based on these analyses corresponds well with that of humans (Burton et al., 2001). The degree of correspondence depends on the similarity measure used and, for example, Mahalanobis distance (Mahalanobis, 1936) has been found to produce a better correspondence than Euclidean distance (Burton et al., 2001). Mahalanobis distance weights each variable according to its variance and covariances:
where T indicates transpose, and  and
and  are two vectors from a distribution with variance–covariance matrix S. In the case of PCA, covariance between dimensions is zero by definition and, in that case, Mahalanobis distance equates to standardized Euclidean distance, the square root of the sum of the squares of all PC values standardized by their associated SD (De Maesschalck et al., 2000). Raw Euclidean distance is simple the sum of the squares of unstandardized PC values. As identity specific information is necessarily shared by only a few if any faces, it is encoded in lower PC dimensions (O’Toole et al., 1993). These have smaller variance and thus values by definition as so contribute little to Euclidean or other distance measures when PC values are not standardized. While Experiment 1 was designed so that Euclidean and Mahalanobis distances are equivalent, Experiment 2 provides a test between these metrics.
An alternative similarity metric is based on differences between angles subtended by “identity vectors” at the origin of face-space rather than distances (Leopold et al., 2001; Romdhani et al., 2005; Ross et al., 2010). In a PCA space the origin is the average face and this may play the role of a norm or prototype with identity vectors defining faces with respect to that point. The direction of the identity vector is more important than its magnitude in determining identity, probably because direction captures the relations between different sources of variation (Ross et al., 2010). Automatic caricatures, which exaggerate differences from the mean while preserving or even enhancing perceived identity, inspired such models, and emphasize the importance of direction over magnitude (Brennan, 1985; Rhodes, 1996).
In Experiment 3 we test between angle and distance based measures by varying the distinctiveness of the faces being compared. Distinctiveness is a central concept to face-space models often characterized in terms of “how easy would it be to pick out this person in a crowd” (Light et al., 1979; Valentine, 1991). Subjective ratings show good inter-rater agreement and predict memorability (Light et al., 1979; Valentine and Bruce, 1986; Vokey and Read, 1992). Distinctiveness also correlates with distance from the average in both physical (Bruce et al., 1994; Hancock et al., 1998) and psychological face-spaces (Johnston et al., 1997). Here we varied distinctiveness by varying the distance of the faces being compared from the origin in physical space, i.e., the magnitude of the identity vectors. Comparison faces were “lateral caricatures” (Rhodes et al., 1998; Lewis and Johnston, 1999) of the reference faces, having identity vectors with the same magnitude but in a different direction. Increasing distinctiveness by increasing magnitude leaves the angles between identity vectors unchanged while increasing the distance between faces proportionally (by similar triangles).
Conclusion
In all experiments we estimate criterion P50 and sensitivity DL in terms of physical differences in facial shape. In Experiment 1 we use the average face as a reference and test whether P50 and DL are affected by the face views available. We expect sensitivity to be affected but, if criterion is a function of the differences between faces and independent of sensitivity, it should remain constant. Experiment 2 provides a test between two possible physical distance metrics, Mahalanobis and Euclidean, to see which best predicts observed P50 and DL. Lastly, in Experiment 3 we use 10 references faces and vary the distinctiveness of both reference and comparison faces in order to test between angle and distance based similarity measures. The general methods are described next followed by the individual experiments.
General Methods and Materials
Stimuli
All Stimuli were rendered images of 3D solid body computer models of synthetic faces based on measurements of real faces. For Experiments 1 and 2, the analysis was based on 54 faces recorded using a NEC “Fiore” 3D facial surface scanner (Yoshino et al., 2000). Ethics approval was given by the University of Melbourne, Human Research Ethics Committee (HESC 050550.1), VIC, Australia. For Experiment 3 the analysis was based on 224 real faces recorded using a 3dMD scanner (Aeria et al., 2010). Ethics approval was granted by the Princess Margaret Hospital for Children ethics committee (PMHEC 1443/EP), Perth, WA, Australia. In each case equal numbers of males and females randomly selected from those available were included. The Melbourne database consists of two distinct populations, Japanese and “Caucasian”1, of which only ones labeled Caucasian were used. The Perth database contains people from a variety of origins and ethnicity was not used as a criterion for inclusion/exclusion (which was randomized). Self-reported ethnicities of the 224 faces used were: 155 Caucasian, 29 Chinese, 10 Indian, 8 Eurasian, 5 Italian, 3 Anglo-Indian, 2 Filipino Australian, and 1 each of African (Black), African-Italian, Anglo-Saxon, Chilean, Chinese-Indian, Malaysian, Mixed, Portuguese, Somalian, Spanish, Vietnamese, and one face with no self-reported ethnicity. Ethnicity was not the focus of this research but this information is included as ethnicity is known to affect facial processing (Meissner and Brigham, 2001). All faces were shown with the same modeled surface reflectance, “skin color,” which was based on the average of the faces used to define the face-space (Figures 1, 2, 4, and 6 show examples).
Scanned shape data for each individual real face is first fit to a generic face mesh with well specified topological properties (Claes, 2007). Each face is represented as a vector with x, y, z position values for each vertex. The mesh with 9,327 vertices was used for Experiments 1 and 2 and one with 12,016 vertices for Experiment 3. The dimensionality is considerably reduced by using PCA while still retaining 98% of the original variance, the rest being largely noise. Twenty-two dimensions were needed to satisfy this criterion in Experiments 1 and 2 and 38 in Experiment 3. This dimensionality is of the same order as that suggested appropriate for recognition (Lewis, 2004). The synthetic face models used as stimuli were defined within these PCA spaces assuming normal distributions averaged around the mean face and with SD for each dimension based on the real faces. All differences between faces are specified in units of these SD, z-scores.
Details of the synthetic faces generated were determined by experimental design and are specified in the corresponding methods section. Both types of scanner record information about surface color as well as shape, and this information was used to define an average surface color which was applied to all stimuli. Synthetic face models were imported to Blender v2.45 (www.blender.com), an open source 3D modeling software package. A single directional white light (intensity 1.5) from 30° above the line of sight and a 60-mm camera 0.5 m in front of the face were used to render the scene. Seven views were generated of each face by rotating it about its vertical axis in 15° steps from left TQ (−45°) to right TQ (45°). Each view was rendered using Blender’s internal raytracing engine and output as 480 × 480 pixel bitmap on the default Blender blue background (RGB 15, 56, 102). Modeled surface reflectance was based on average values and kept constant for all views of all face models. Other Blender settings were left at default values. Copies of the stimuli are available from the corresponding author on request.
Participants
Ethical approval for all experiments was granted by the University of Wollongong Human Research Ethics Committee, application HE09/358, in accordance with Australian National guidelines. All participants were students at the university, were over 18, and were assumed to have normal or corrected to normal vision and face processing abilities. Participation was irrespective of ethnicity and this was not recorded.
Procedure
For Experiments 1 and 3 testing took place in groups of up to 20 but at individual computers. For Experiment 2 participants were tested individually. Presentation of stimuli and recording of responses was controlled by individual Dell PCs using software written in Runtime Revolution. Viewing distance was unconstrained but approximately 50 cm. Participants entered an individual identifier and on screen and instructions informed them that they would be shown pairs of faces presented simultaneously and that their task was to decide whether “the two faces are the same person or not.” The 480 × 480 pixel images measured 14 cm × 14 cm (16° × 16°) on the screen. Individual faces varied in size but were approximately 7 cm × 10 cm (8° × 11°). The centers of each image were separated by 18 cm (20°) horizontally and offset 5 cm (6°) vertically to prevent direct comparisons. Left/right positions and order of trials was fully randomized for each participant. Responses were made by moving a scroll bar. Although this enabled participants to indicate a level of confidence in their decision results were binarized as “same” or “different” for analysis. The slider started each trial positioned on the center tick mark but this was not a valid response and participants had to move the pointer to one side or the other. Images remained on the screen until a response was made. Ten practice trials preceded the experiment proper during or after which participants were able to ask questions regarding the task. No feedback about accuracy was given at any stage. There were a total of 110 trials in Experiments 1 and 3 and 220 in Experiment 2.
Design and Treatment of Results
All experiments used the method of constant stimuli with 11 levels of difference including identical face pairs. There were 10 repetitions at each level and the percentage of “different” responses recorded. Observed response probabilities were used to estimate the median location (P50) and 25th (P25) and 75th (P75) percentiles for each observer using the Spearman–Karber method, a distribution free approach to estimating psychometric functions (Miller and Ulrich, 2001). Data were first monotonized (Klein, 2001) as this gives the maximum likelihood estimate of the true response probability (Miller and Ulrich, 2001). The median was used as a distribution free estimate of criterion location (P50), as there is a 50% probability the criterion falls below this point. Similarly half the inter quartile range (IQR), (P75−P25)/2, was used to estimate the DL, a measure inversely related to sensitivity. Between condition differences in P50 and DL were tested using non-parametric test and effect size, r, calculated on the basis of corresponding z and N values (Field, 2009).
Experiment 1: Criterion as a Function of Views Presented
Introduction
The primary aim of this experiment was to estimate the criterion adopted by observers when deciding whether two faces presented are of the same person or not. We also measure sensitivity and test how both vary as a function of the face views presented.
The average face was used as the reference throughout. We expect criterion will vary as a function of both location and direction in face-space and the average represents a neutral starting point in both respects. Direction was randomized with the constraint that all comparison faces were at the corners of concentric multi-dimensional hypercubes (Wilson et al., 2002). That is they were equal distances away on all PC dimensions when distance is specified in terms of the SD associated with each dimension. This corresponds to Mahalanobis distance but constraining the comparison faces in this way ensures that they were equivalent with respect to other possible distance metrics including Euclidean. Examples of the stimuli are shown in Figure 1A) and their corresponding locations on the first 2D of face-space in Figure 1B).
We varied the face views shown as a between participants manipulation. In one condition (FF) identical full-faces views were shown as for many previous studies (Freire et al., 2000; Mondloch et al., 2002; Rhodes et al., 2007; Dakin and Omigie, 2009; Ross et al., 2010). In this condition all image differences reflect differences between the faces and decisions may reflect image based rather than face based comparisons (Bruce, 1982). In a second condition (TQ) comparison faces were shown in TQ view, preventing direct image based comparisons. This view change is known to result in large image differences and lower sensitivity (Bruce et al., 1987; Moses et al., 1996; Troje and Bulthoff, 1996, 1998; Hill et al., 1997; O’Toole et al., 1998). Thirdly we included an animated condition (GIF) where seven views (−45° to 45° in 15° increments) of each face were presented in an animated sequence giving the impression of a head oscillating from side to side. This condition was designed to maximize information about face shape available by providing both multiple views and motion based cues to structure. Similar presentation conditions lead to better recognition memory (Hill et al., 1997) and were expected to increase sensitivity compared to a single static view. The animations were presented offset in time to prevent direct image based comparisons.
We expected sensitivity to be high for FF and GIF but lower for TQ. Criterion may not vary if it is independent of sensitivity and reflects underlying difference in shape between faces as intended.
Method and Materials
Participants
Forty-seven undergraduate students took part in this experiment as part of third year laboratory classes.
Design
Participants were randomly assigned to one of the three conditions: paired full-face (FF), full face, and TQ or paired GIF animations (GIF) as outlined in the Section “Introduction and General Methods and Materials.” The method of constant stimuli was used with 10 repetitions at each of 11 levels of difference between the faces. The levels used varied from 0, identical faces, to 1 in steps of 0.1 defined units of SD for each of the 22 PCs used. Sign was randomized for each dimension independently giving 222 possible faces for each level. There were a total of 110 trials with order and left/right positions fully randomized for each participant.
Other details of the method and materials were as described in the Section “General Methods and Materials.”
Results
Figure 2 shows the overall proportion of “different” responses as a function of distance from the reference face for each of the three conditions of viewpoint. Table 1 gives medians and interquartile ranges for P50 and DL. Overall the number of “different” responses increased with greater physical differences between stimuli, measured in SD units, as intended. The rank order correlation between distance and proportion “different” was Spearman’s rho rs = 0.511, p < 0.001 (N = 5,170 trials; unmonotonized data). One participant in the FF condition was not included in the analysis because P50 could not be determined as the maximum difference between stimuli, 1 SD, elicited less than 50% “different” responses. Similarly P75 could not be estimated for four other participants (three in TQ and one in FF) and DL was set to the maximum possible value of 0.5 SD.
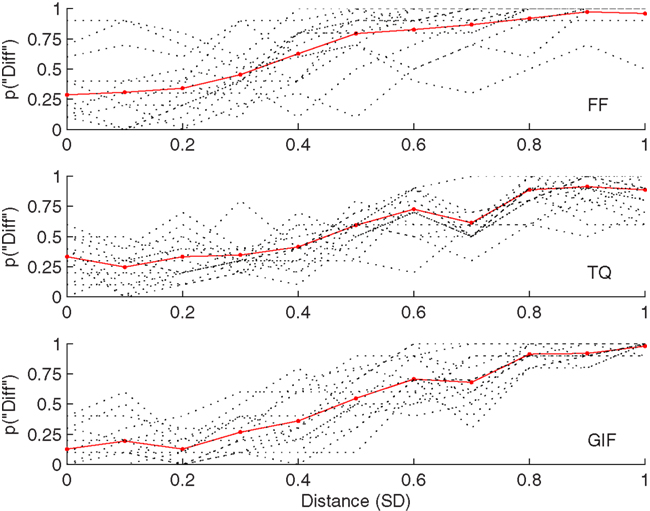
Figure 2. Proportion “different” responses as a function of physical difference in SD units for the three conditions of Experiment 1. Dotted lines indicate individual psychometric functions and solid red lines combined data.
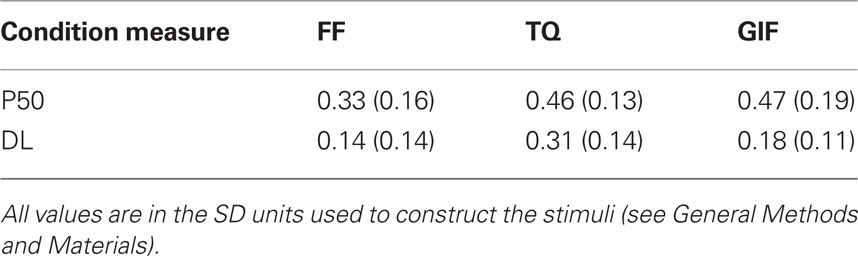
Table 1. Median (IQR) of P50 and DL for all participants.
A Kruskal–Wallis test showed a main effect of Views presented on P50: H(2) = 9.23, p = 0.01. Follow-up Mann–Whitney tests with Bonferroni corrected alpha = 0.05/3 confirmed that P50 was significantly lower in the FF condition than TQ, U = 54.5, p = 0.008, effect size r = −0.47, or GIF, U = 49.5, p = 0.008, effect size r = −0.48. There was no significant difference between TQ and GIF conditions, U = 110, p = 0.711, r = −0.07.
There was also a main effect of View on DL: H(2) = 13.59, p = 0.001. Follow-up Mann–Whitney tests with Bonferroni corrected alpha = 0.05/3 showed that DL was significantly higher, and thus sensitivity lower, for TQ than FF, U = 38.5, p = 0.001, effect size r = −0.58, or GIF, U = 48.5, p = 0.004, effect size r = −0.51. There was no significant difference in DL between FF and GIF, U = 78.5, p = 0.161, r = −0.26.
Median false alarm rates (“different” responses at the 0 SD level) for the three conditions were: FF 0.15 TQ 0.35 GIF 0.10. The high rate in TQ shows how changes in viewing conditions can be misinterpreted as a change in identity even when there is no change in the shape of the face.
Discussion
The proportion of “different identity” decisions increased with distance from the average reference face as expected. Criterion was significantly lower for FF than TQ or GIF, which did not differ from each other. Sensitivity was higher for FF and GIF than TQ as expected.
Criterion was constant for both conditions that involved comparing between views, despite the significant difference in sensitivity. This is consistent with people making their judgments on the basis of differences between faces that are independent of viewing conditions that significantly affect sensitivity. Criterion was significantly lower in the identical view condition, but as argued in the introduction, this is likely to reflect image rather than face based comparisons. Based on this data, the best estimate of the criterion people used is 0.47 SD when the average face is the reference. While it would clearly be necessary to test a variety of other view combinations and other changes in presentation conditions to determine if this remains constant over a wider range of conditions, that is not the focus of this work.
Sensitivity was higher for FF and GIF comparisons than for TQ comparisons as expected. The GIF condition was associated with both high sensitivity and low false alarm rates while still ensuring that comparisons have to be face rather than image based and was used for the remaining experiments.
Experiment 2: Contrasting Euclidean and Mahalanobis Distance Metrics
Introduction
This experiment was designed as a test between Euclidean and Mahalanobis distance metrics again using the average face as a reference. While in Experiment 1 comparison faces were designed to be equivalent with respect to these two metrics, here we compared two conditions that would be expected to differ. Here stimuli were generated in the same manner as before except that either the first (PC1) or second (PC2) PCs was set to zero (Please see Figure 3). This meant that Euclidean but not Mahalanobis distances will differ between the conditions.
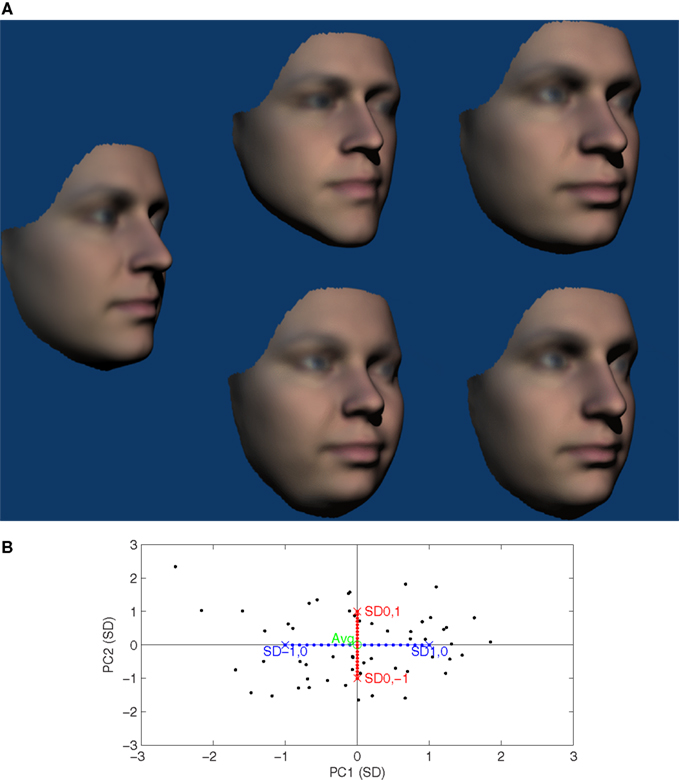
Figure 3. (A) Examples stimuli used in Experiment 2. The average reference face is shown on the left and all other faces are 1 SD away. The top row shows PC2 zero faces and the bottom row PC1 zero faces. The average faces is shown here at 45° and other faces at 30° but in the experiment all were shown as temporally offset GIF animations rotating between 45° and −45°. (B) Two-dimensional illustration of the face-space used for Experiment 2. Black points show locations of the 54 faces used to define the face-space. The locations of the average reference face and the PC1 zero (0, ±1 SD) and PC2 zero (±1, 0 SD) comparison faces shown in (A) are also indicated. Red/blue points indicate possible locations of comparison faces for PC1 zero and PC2 zero conditions respectively.
By definition PC1 is associated with more physical variation and a larger SD than PC2. This means that Euclidean distances will be larger when PC2 is zero and PC1 varies than when the reverse is true. For the particular PCA space used Euclidean distances will be ∼1.5× greater in the PC2 zero condition – a function of the proportions of total variance accounted for by each dimension in the PCA space. In contrast Mahalanobis distances are standardized by SD and will not vary between conditions.
If criterion corresponds to a particular Mahalanobis distances, P50 will not vary between conditions. In contrast, if criterion corresponds to particular Euclidean distance, the P50 SD value will be 1.5× larger in the PC1 zero condition.
Viewing conditions were constant in this experiment ruling out one possible source of variation in sensitivity. If sensitivity is constant, the same differences between conditions would be expected for DL as for P50. However sensitivity can vary as a function of direction in face-space (Ross et al., 2010), and this could also produce a difference between the conditions tested here.
Method and Materials
Participants
Twenty-four undergraduate students took part in this experiment for course credit and were tested individually.
Design
This experiment was a within subjects design with two conditions, PC1 zero or PC2 zero. Comparison faces were constructed in the same way as for Experiment 1, except that either PC1 or PC2 was zero for all comparison faces in the condition. Sign was randomized for other dimensions as before. There were a total of 220 trials, 110 for each condition. Order was fully randomized for each participant and PC1 zero and PC2 zero trials were not distinguished in any way.
The reference face was the average face for both conditions and all stimuli were presented as animated GIFs. Other details of the method and materials were as described in the Section “General Methods and Materials.”
Results
Figure 4 shows the overall proportion of “different” responses as a function of distance from the reference face for PC1 zero and PC2 zero conditions. Table 2 gives group medians and interquartile ranges for P50 and DL. Overall number of “different” responses again correlated positively with physical differences between stimuli: Spearman’s rho rs = 0.541, p < 0.001 (N = 5,280 trials).
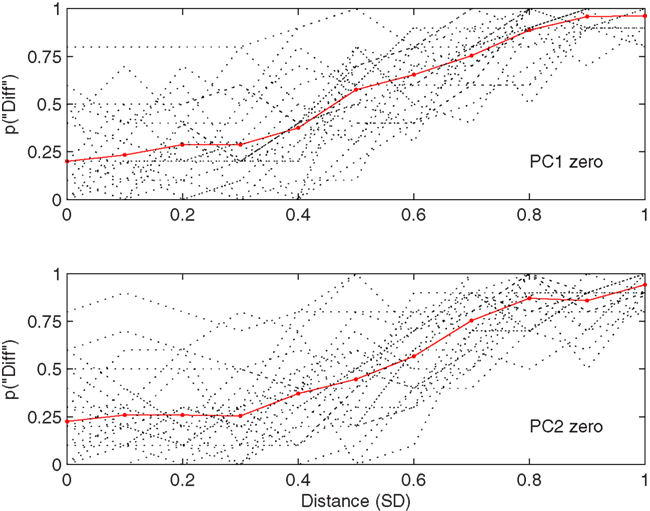
Figure 4. Proportion “different” responses as a function of physical difference in SD units for the two conditions of Experiment 2. Dotted lines indicate individual psychometric functions and solid red lines combined data.
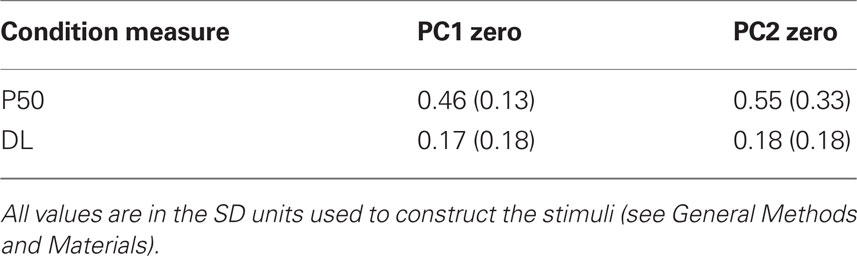
Table 2. Median (IQR) of P50 and DL for all participants.
Wilcoxon signed ranks dependent samples test showed that P50 was significantly lower for PC1 zero faces, N = 24, T = 49, p = 0.02, r = −0.48. This is the opposite direction to that predicted by Euclidean distance.
There was no significant difference in DL, N = 24, T = 118, 0 = 0.54, r = 0.13, consistent with sensitivity reflecting Mahalanobis distance.
Median false alarms rate (“different” responses at 0 SD level) was 0.15 based on the 20 identical 0 SD pairs.
Discussion
Participants adopted a significantly lower criterion in the PC1 zero condition but sensitivity did not differ. The null effect on sensitivity is consistent with Mahalanobis distance and the difference in criterion is in the opposite direction to the predicted by Euclidean distance. While there is considerable overlap between individual functions, P50 appears to be somewhat more affected by changes in PC2, despite the fact that this dimension accounts for less physical variation than PC1. Standardizing PC values in terms of the associated SD, as is the case for Mahalanobis distance, provides a principled way of ensuring that distances are not dominated by the values of early PCs.
As can be seen from Figure 3A, size differences are a major source of variation captured by PC1. Previous work has shown that size differences do not affect human categorizations even when potentially discriminating (Bruce et al., 1993), and the relative unimportance of PC1 found here may reflect this. P50 for the PC1 but not PC2 zero condition was similar to that found in the GIF condition of Experiment 1 where all PC dimensions varied under the same viewing conditions, suggesting that fixing PC2 but not PC1 affects the proportion of “different” decisions. If PC1 is unique in its lack of influence, we would expect P50 to remain around 0.46 SD if other PC dimensions were set at zero but this remains to be tested.
In Experiment 3 we test whether an angle based similarity measure in general better accounts for perceived changes in identity than distance based measures.
Experiment 3: Comparing Angle and Distance Based Measures
Introduction
In this experiment we test whether changes in angle capture changes in perceived identity better than changes in distance. Angle here refers to is the differences in direction between the “identity vectors” that define reference and comparison faces relative to the mean in face-space (Leopold et al., 2001). Angle is contrasted as a measure to distance between the end points of the same vectors. Varying the magnitude of the vectors affects distance between endpoints but not angle. Vector magnitude also corresponds to perceived distinctiveness.
Ten reference faces were used, all one SD from the mean and generated in the same way as the 1 SD comparison faces in Experiment 1. One SD is the mean value expected for a face drawn from a multinormally distributed population. For each of these reference faces comparison faces were “lateral caricatures” constructed by moving in a direction orthogonal to the reference face identity vector (Rhodes et al., 1998; Lewis and Johnston, 1999; Ross et al., 2010). Comparison faces were the same distance from the average but in a different direction. All faces can be thought of as located on the same multi-dimensional annulus in face-space. Angular differences in direction between pairs of faces were systematically varied and P50 and DL calculated in these terms.
As a between participants manipulation we varied the distance of both comparison and reference faces from the mean, in effect moving all faces to a different annulus. This has the effect of varying their distinctiveness and the distance between them in face-space while keeping angular differences constant. Distances between vector endpoints increase in proportion to distance from the mean (by similar triangles). We ran four conditions with SD 0.5, 1.0, 1.5, or 2.0. Reference faces for other conditions were generated by automatically caricaturing the 1 SD reference faces (Brennan, 1985; Rhodes, 1996; O’Toole et al., 1997). 0.5 SD reference faces constitute 50% “anti-caricatures” while the 1.5 and 2 SD versions represent 150 and 200% caricatures respectively. New sets of comparison faces were generated for each condition to avoid possible confounds associated with the particular faces used. Please see Figure 5 for examples of stimuli.
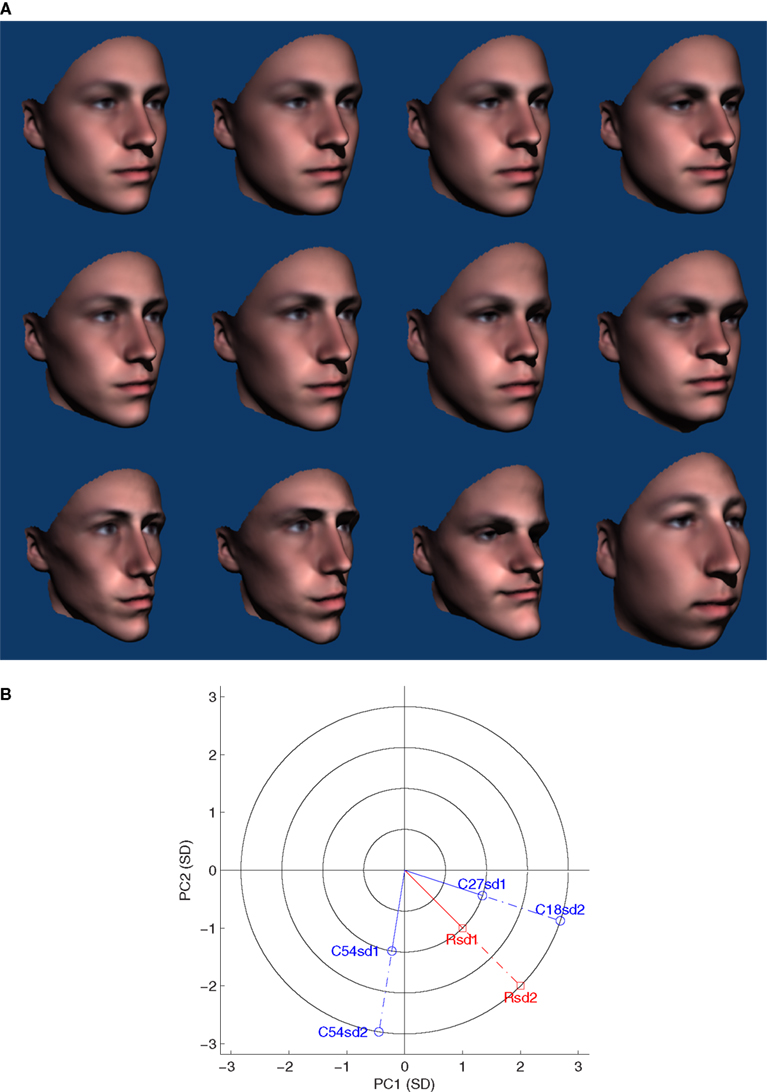
Figure 5. (A) Example stimuli from Experiment 3. The rows show 0.5, 1.0, and 2.0 SD conditions respectively. The first column shows one of the reference faces used and corresponds to 50, 100, and 200% caricatures of that face. The following three columns show random examples of 27°, 54°, and 81° comparison faces used in each condition. P50 was found to be slightly to the right of the third face in the first row (59.4°) and to the left of the third face in rows two (48.9°) and three (51.0°). All faces shown here at an angle of 30° but in the experiment all faces were shown as animation appearing to rotate between −45° to 45°. (B) Two-dimensional illustration of the relationship between reference and comparison faces in Experiment 3. Concentric circles show the four levels of distinctiveness used, 0.5, 1, 1.5, and 2 SD. Reference faces for the 1 and 2 SD conditions are indicated in red as R1SD and R2SD respectively. Corresponding comparison faces are shown in blue. C1SD27 and C1SD54 are possible 27° and 54° comparison faces for the R1SD reference face. C2SD27 and C2SD54 are the equivalent comparison faces for the R2SD reference face. The angle subtended at the origin remains constant between conditions but the distance between equivalent reference and comparison faces is greater for the 2 SD faces.
If perceived differences in identity are determined by differences in angle, distinctiveness should have little or no effect on P50 and/or DL. Alternatively, if distance between faces is critical, P50 and/or DL expressed as an angle should decrease with increasing distinctiveness as a constant distance between faces will correspond to a smaller angle when the faces are at a greater distance form the mean.
Method and Materials
Stimuli
All stimuli were generated using a PCA space based on a different set of faces and measurements than Experiments 1 and 2 (please see General Methods and Materials). Ten reference faces were used generated in the same way as the 1 SD comparison faces in Experiment 1 (i.e., ±1 SD from the mean on all dimensions). This ensured that reference faces were all equivalent Euclidean and Mahalanobis distances away from the average. As with Experiment 1, there were 11 levels of difference between the reference and the comparison face with 10 repetitions at each. Here differences were defined in terms of angle with levels from 0° to 90° in steps of 9°. All angles were calculated using Mahalanobis distances. Direction relative to the reference face was randomized with the constraint that direction was always orthogonal to the reference face’s identity vector. Orthogonalization was achieved using the Gram–Schmidt procedure and the magnitude of resulting vectors scaled so that comparison face vectors had the same magnitude as the corresponding reference faces. Euclidean values will have varied somewhat depending on random direction. In order to avoid possible confounds, one of 10 possible comparison faces at each angle and for each reference face was randomly selected for each participant. For the between subjects conditions the reference faces were “caricatured” by scaling all PC values equally and new comparison faces generated. Resulting levels of distinctiveness were 0.5, 1.0, 1.5, and 2.0 SD.
Participants
One hundred eleven undergraduate students took part in this experiment as part of third year laboratory classes.
Design
Participants were randomly assigned to different groups which varied according to the distinctiveness of the faces shown: 0.5, 1.0, 1.5, or 2.0 SD. P50 and DL were both specified in terms of angle.
Other details of the method were as described in the Section “General Methods and Materials.”
Results
Figure 6 show the overall proportion of “different” responses as a function of distance from the reference face for each of the three conditions of viewpoint. Table 3 gives medians and interquartile ranges for P50 and DL. Overall number of “different” responses increased with increasing angle between identity vectors: Spearman’s rho rs = 0.621, p < 0.001. Increasing the angle between identity vectors increased the proportion of “different” responses (N = 12,210 total trials). Individual data for participants in the distinctiveness 0.5 condition was truncated in a number of cases. No P50 location could be calculated for four participants, three because their “different” response rate was <50% for the largest difference used (P50 set to 1, an underestimate) and one because false alarm rate was greater than 50 (P50 set to 0). Similarly, no P75 could be obtained for 10 participants in this condition because their “different” response rate never reached that level. In these cases P75 was set to 1 and DL calculated accordingly (DL underestimated). Two other participants, one in distinctiveness condition 1.0 and one in 2.0, also did not reach a 75% response rate and were also assigned P75 = 1. Re-analysis of data with these participants omitted did not change the effects reported so they are included here.
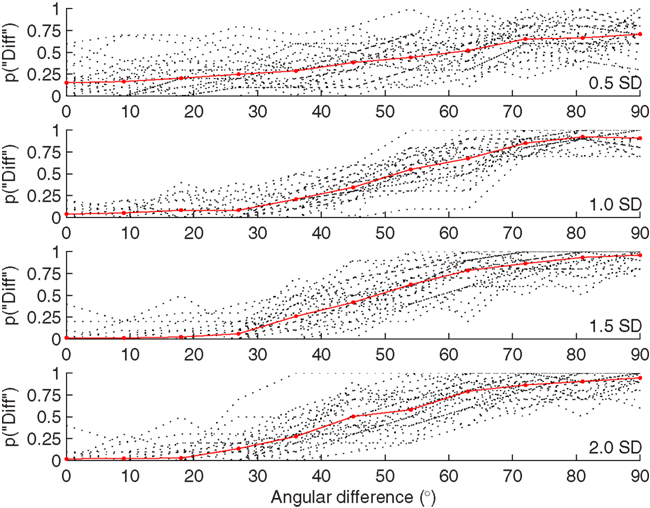
Figure 6. Proportion “different” responses as a function of physical difference expressed as the angle subtended at the origin of face-space for the four conditions of Experiment 3. Dotted lines indicate individual psychometric functions and solid red lines combined data.
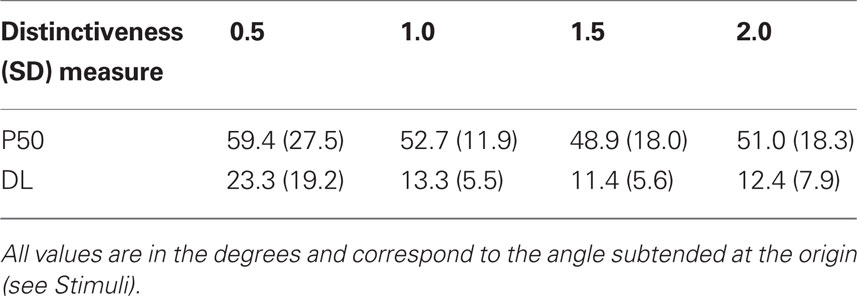
Table 3. Median (IQR) of P50 and DL for all participants.
A Kruskal–Wallis test showed an effect of Distinctiveness on P50, with sensitivity appearing to be higher for the “anti-caricatured” 0.5 SD condition: H(3) = 9.09, p = 0.03. Follow-up Mann–Whitney tests with Bonferroni corrected alpha = 0.05/6 showed no significant pairwise differences in location between levels (all p’s > 0.1/6).
There was also an effect of distinctiveness on sensitivity with DL higher, sensitivity lower, for the 0.5 SD condition: H(3) = 33.9, p < 0.001. Follow-up Mann–Whitney tests with Bonferroni corrected alpha = 0.05/6 showed that DL was significantly higher in the 0.5 SD condition than 1.0 SD, U = 156.5, p < 0.001, r = −0.55; 1.5 SD, U = 95, p < 0.001, r = −0.66, and 2.0 SD, U = 125, p < 0.001, r = −0.71, conditions. Median false alarms rates (“different” responses at 0° level) were all 0 except for the 0.5 SD condition which had a median rate of 0.1.
Discussion
Both criterion and sensitivity expressed as an angle were constant over the SD1 to SD2 range: median P50 was 51.5° and median sensitivity DL 12.3°. This is consistent with an angle based similarity metric predicting perceived differences in identity. The corresponding distances between faces will have doubled over this range and results are clearly not consistent with either P50 or DL reflecting a constant distance as this would have corresponded to a decreasing angle.
Difference limen was significantly larger for 0.5 SD faces and there was a trend for a higher P50 in this condition. Previous studies have found that anti-caricatures are more poorly recognized than lateral caricatures, contrary to an angle based account (Rhodes et al., 1998; Lewis and Johnston, 1999). The results of Experiment 1 suggest that 0.5 SD faces are perceived as the same as the average face much of the time. The higher P50 and DL found in this experiment suggests that we have difficulty discriminating between them and are less likely to judge them as “different” (see Figure 5A, row 1). This maybe why anti-caricatures (0.5 SD) behaved differently from the “normal” (1 SD) or caricatured (1.5 and 2 SD) faces here.
A criterion angle of 51.5° was found for judgments of faces in the normal (1 SD) to distinctive (2 SD) range. Angular differences account for both criterion and sensitivity over this range. In future it would be important to test if this generalizes to cases where the magnitudes of comparison and reference face identity vectors are not the same, for example when the reference face is distinctive but the comparison face is not.
General Discussion
We measured criteria (P50) and sensitivity (DL) for same or different identity decisions in terms of differences in 3D face shape. Increasing physical differences between faces increased the proportion of “different” identity responses throughout. The relationship between physical differences and response proportions provided the basis for estimates of the magnitude of differences perceived as a change in identity.
In Experiment 1 criterion was the same for a static or an animated change in view, despite the expected difference in sensitivity. This is consistent with criterion being determined by underlying differences between faces and not particular properties of the views shown. Sensitivity for the animated condition was equivalent to identical full-face view comparisons. The latter condition was associated with a significantly smaller criterion difference but both this and the high sensitivity may be accounted for by image rather than face based comparisons. The overall dissociation between sensitivity and criterion emphasizes the need to consider both when seeking to understand and predict both laboratory and real world identity matching.
Experiment 2 showed that neither criterion nor sensitivity corresponds to Euclidean distance: the major sources of physical variation are not necessarily the most important for decisions about identity. Sensitivity corresponded well with Mahalanobis distance, where each PC is weighted in terms of its variance. However criterion was still disproportionately affected by PC2, although this is associated with less physical variation than PC1 with which it was compared. This may reflect the particular dimensions tested and it was argued that Mahalanobis distance provides a principled way to weight the contribution of different sources of variation that allows dimensions more likely to be associated with individual variation to influence physical distance measures.
Experiment 3 provided evidence that an angle based difference measure better predicts perceived differences in identity than a distance based measure. Angular criterion and sensitivity were constant over a range where corresponding distances doubled. Observers were less sensitive to differences between “anti-caricatured” faces 0.5 SD from the mean, and the associated criterion was higher.
In the introduction we argued that perceiving a change in identity involves more than just being able to detect differences between images. Our aim was to measure criterion difference that would correspond to a perceived change in identity at least 50% of the time. The human face recognition system remains one of the best available (although see O’Toole et al., 2007) and an assumption of this work was that the criterion adopted by humans would provide a valuable estimate in the context of automatic or objective comparisons. Criterion difference may also be critical to the problem of knowing who you do not know, the “unfamiliar” response in recognition. Any face seen for the first time will always have a known face that is the closest match and has the potential to lead to a false identification. A criterion difference above which a novel face is correctly categorized as unfamiliar is one possible solution to this issue (Shin and Nosofsky, 1992). While equivalent or very similar decision rules can be formulated based on the ratio of the closest match to one or more other matches (Valentine, 1991; Wills et al., 2000; Ross et al., 2010), understanding how different a face has to be before it is perceived as a different person is the central problem.
There were considerable individual differences, as evidenced here by IQR for P50 and reported previously (Kemp et al., 1997; Megreya and Burton, 2008). Understanding these is necessary for establishing objective and general criteria but medians provide an initial estimate. It would also be valuable to test if the estimates of criterion do predict which faces are perceived as familiar in recognition tests. It may also be important to try and deliberately manipulate criterion through, for example, instructions. Here we asked people to respond on the basis of whether “the two faces are the same person or not” but it may be necessary to demonstrate that this produces different results than if we ask people to respond on the basis of “any difference.” Sensitivity is estimated by the latter task and we have shown that criterion can change independently of this. Animating views in Experiment 1 increased sensitivity without changing the physical difference that was perceived as a change in identity. It is also potentially interesting to see whether the reverse change in instructions and analysis in terms of criterion and sensitivity would inform interpretation of previously reported experiments (Freire et al., 2000; Maurer et al., 2002).
The criterion observed did not correspond to step change but both individual and pooled psychometric functions had sigmoid or similar non-linear functions with response rates often constant at the ends of the scale. The comparison between animated and static views in Experiment 1 showed that the underlying psychometric function can be made steeper without shifting criterion. In a sense criterion corresponds to a category boundary between “same” and “different” person although we did not seek to test for categorical perception as such (Harnard, 1987). This would be possible in future, especially measuring discrimination at the category boundary although categorical perception is though to be associated with familiar rather than unfamiliar faces (Mckone et al., 2001; Angeli et al., 2008).
The broader aim of this work is to link physical and psychological face-spaces. Experiments 2 and 3 provided evidence for Mahalanobis over Euclidean distance as a metric, and for differences in angle over distance as determinants of identity distinctions. Clearly there are many other issues to explore, particularly the optimal weighting of physical dimensions and we are currently doing this by seeking to establish a psychological face-space on the basis of perceived similarity that can be specified in terms of the physical face-space. It will then be necessary to test whether the psychological face-space provides a better account of perceived changes in identity using the methods developed here.
While the use of 3D shape models has considerable advantages, keeping surface reflectance constant inevitably affects the task and generalization of results. Surface scanning technology is advancing and can now produce near photorealistic results. If accurate surface reflectance information that was independent of lighting could be recorded and modeled, this would provide an even more powerful tool for generating controlled stimuli. The ability to scan faces at increasing frame rates will also allow within face variation to be addressed – faces are constantly changing quite dramatically in shape when, for example, we speak, eat, or express emotion although there is no corresponding change in identity. Incorporating such variation in face-space models is a critical challenge for future work especially as within face changes epitomize types of large detectable changes that should not be interpreted as a change in identity.
Summary
The criteria adopted when people make same or different identity decisions determine whether two example faces are seen as being the same person or not. The experiments reported provided estimates of the physical differences in 3D face shape that correspond to these criteria. Criterion was also found to dissociate from sensitivity with, for example, P50 but not DL the same for an animated and a static change in view (Experiment 1). Raw Euclidean physical differences in shape did not characterize when faces were seen as different but Mahalanobis distances predicted sensitivity and provide a principled compromise for weighting different sources of variation (Experiment 2). The angles between identity vectors were found to characterize perceived changes in identity better than distances for faces one or more SD from the average (Experiment 3). Taken together, the results demonstrate the importance of considering criterion in addition to sensitivity and suggest that angular differences based on a Mahalanobis metric may provide a good way to link physical to perceived differences.
Conflict of Interest Statement
The authors declare that the research was conducted in the absence of any commercial or financial relationships that could be construed as a potential conflict of interest.
Acknowledgments
This work was supported by Australian Research Council Discovery Project 0986898 and Engineering and Physical Sciences Research Council grant EP/F037503/1. Thanks to Harry Matthews for careful and insightful comments on earlier drafts.
Supplementary Material
The Movie S1 for this article can be found online at http://www.frontiersin.org/Perception_Science/10.3389/fpsyg.2011.00041/abstract
Movie S1. Illustration of matching across animated views, the animated GIF condition used in all experiments. The stimuli shown here are taken from Experiment 3 and show a reference face (left) and comparison face (right) where the “identity vectors” subtend an angle of 54° at the origin of the face-space used. Both faces are 1 SD from the average. Please see Experiment 3 and Figure 5 for details.
Footnote
- ^The term “Caucasian” is not well defined but is widely used refer to “white” people of European origin.
References
Aeria, G., Claes, P., Vandermeulen, D., and Clement, J. G. (2010). Targeting specific facial variation for different identification tasks. Forensic Sci. Int. 201, 118–124.
Angeli, A., Davidoff, J., and Valentine, T. (2008). Face familiarity, distinctiveness, and categorical perception. Q. J. Exp. Psychol. 61, 690–707.
Bruce, V. (1982). Changing faces: visual and non-visual coding processes in face recognition. Br. J. Psychol. 73, 105–116.
Bruce, V., Burton, A. M., and Dench, N. (1994). What’s distinctive about a distinctive face? Q. J. Exp. Psychol. A 47, 119–141.
Bruce, V., Burton, A. M., Hanna, E., Healey, P., Mason, O., Coombes, A., Fright, R., and Linney, A. (1993). Sex discrimination: how do we tell the difference between male and female faces? Perception 22, 131–152.
Bruce, V., Valentine, T., and Baddeley, A. (1987). The basis of the 3/4 view advantage in face recognition. Appl. Cogn. Psychol. 1, 109–120.
Burton, A. M., Miller, P., Bruce, V., Hancock, P. J. B., and Henderson, Z. (2001). Human and automatic face recognition: a comparison across image formats. Vision Res. 41, 3185–3195.
Burton, A. M., and Vokey, J. R. (1998). The face-space typicality paradox: understanding the face-space metaphor. Q. J. Exp. Psychol. A 51, 475–583.
Chapman, S., and Wells, G. (2007). Eyewitness lineups: is the appearance-change instruction a good idea? Law Hum. Behav. 31, 3–22.
Claes, P. (2007). A Robust Statistical Surface Registration Framework using Implicit Function Representations: Applications in Craniofacial Reconstruction. Ph.D. thesis, Katholieke Universiteit Leuven, Leuven.
Claes, P., Vandermeulen, D., De Greef, S., Willems, G., and Suetens, P. (2006). Craniofacial reconstruction using a combined statistical model of face shape and soft tissue depths: methodology and validation. Forensic Sci. Int. 159, S147–S158.
Dakin, S. C., and Omigie, D. (2009). Psychophysical evidence for a non-linear representation of facial identity. Vision Res. 49, 2285–2296.
Davis, J. P., and Valentine, T. (2009). CCTV on trial: matching video images with the defendant in the dock. Appl. Cogn. Psychol. 23, 482–505.
De Maesschalck, R., Jouan-Rimbaud, D., and Massart, D. L. (2000). The Mahalanobis distance. Chemom. Intell. Lab. Syst. 50, 1–18.
Favelle, S., Palmisano, S., and Maloney, R. (2007). Things are looking up: differential decline in face recognition following pitch and yaw rotation. Perception 36, 1334–1352.
Fletcher, K., Butavicius, M. A., and Lee, M. D. (2008). Attention to internal face features in unfamiliar face matching. Br. J. Psychol. 99, 379–394.
Freire, A., Lee, K., and Symons, L. A. (2000). The face-inversion effect as a deficit in the encoding of configural information: direct evidence. Perception 29, 159–170.
Hancock, P. J. B., Bruce, V., and Burton, A. M. (2000). Recognition of unfamiliar faces. Trends Cogn. Sci. 4, 330–337.
Hancock, P. J. B., Bruce, V., and Burton, M. A. (1998). A comparison of two computer-based face identification systems with human perceptions of faces. Vision Res. 38, 2277–2288.
Harnard, S. (1987). Categorical Perception: The Ground-work of Cognition. New York: Cambridge University Press.
Hill, H., Bruce, V., and Akamatsu, S. (1995). Perceiving the sex and race of faces: the role of shape and colour. Proc. R. Soc. Lond., B, Biol. Sci. 261, 367–373.
Hill, H., Schyns, P. G., and Akamatsu, S. (1997). Information and viewpoint dependence in face recognition. Cognition 62, 201–222.
Johnston, R. A., Milne, A. B., Williams, C., and Hosie, J. (1997). Do distinctive faces come from outer space. Vis. Cogn. 4, 59–67.
Kemp, R., Towell, N., and Pike, G. (1997). When seeing should not be believing: photographs, credit cards and fraud. Appl. Cogn. Psychol. 11, 211–222.
Klein, S. A. (2001). Measuring, estimating, and understanding the psychometric function: a commentary. Percept. Psychophys. 63, 1421–1455.
Leopold, D. A., O’Toole, A. J., Vetter, T., and Blanz, V. (2001). Prototype-referenced shape encoding revealed by high-level aftereffects. Nat. Neurosci. 4, 89–94.
Lewis, M. (2004). Face-space-R: towards a unified account of face recognition. Vis. Cogn. 11, 29–69.
Lewis, M. B., and Johnston, R. A. (1999). A unified account of the effects of caricaturing faces. Vis. Cogn. 6, 1–41.
Light, L. L., Kayra-Stuart, F., and Hollander, S. (1979). Recognition memory for typical and unusual faces. J. Exp. Psychol. Hum. Learn. Mem. 5, 212–228.
Liu, C. H., and Chaudhuri, A. (2002). Reassessing the 3/4 view effect in face recognition. Cognition 83, 31–48.
Macmillan, N., and Creelman, C. (2005). Detection Theory: A User’s Guide. Mahwah, NJ: Lawrence Erlbaum Associates.
Mahalanobis, P. C. (1936). “On the generalised distance in statistics,” in Proceedings National Institute of Science, Calcutta, 49–55.
Maurer, D., Grand, R. L., and Mondloch, C. J. (2002). The many faces of configural processing. Trends Cogn. Sci. 6, 255–260.
Mckone, E., Martini, P., and Nakayama, K. (2001). Categorical perception of face identity in noise isolates configural processing. J. Exp. Psychol. Hum. Percept. Perform. 27, 573–599.
Megreya, A. M., and Burton, A. M. (2008). Matching faces to photographs: poor performance in eyewitness memory (without the memory). J. Exp. Psychol. Appl. 14, 364–372.
Meissner, C. A., and Brigham, J. C. (2001). Thirty years of investigating the own-race bias in memory for faces: a meta-analytic review. Psychol. Public Policy Law 7, 3–35.
Meissner, C. A., Tredoux, C. G., Parker, J. F., and Maclin, O. H. (2005). Eyewitness decisions in simultaneous and sequential lineups: a dual-process signal detection theory analysis. Mem. Cognit. 33, 783–792.
Miller, J., and Ulrich, R. (2001). On the analysis of psychometric functions: the Spearman-Kärber method. Percept. Psychophys. 63, 1399–1420.
Mondloch, C. J., Grand, R. L., and Maurer, D. (2002). Configural face processing develops more slowly than featural face processing. Perception 31, 553–566.
Moses, Y., Ullman, S., and Edelman, S. (1996). Generalization to novel images in upright and inverted images. Perception 25, 443–461.
O’Toole, A. J., Abdi, H., Deffenbacher, K. A., and Valentin, D. (1993). Low-dimensional representation of faces in higher dimensions of the face space. J. Opt. Soc. Am. A 10, 405–411.
O’Toole, A. J., Edelman, S., and Bulthoff, H. H. (1998). Stimulus-specific effects in face recognition over changes in viewpoint. Vision Res. 38, 2351–2363.
O’Toole, A. J., Leopold, D. A., Vetter, T., and Blanz, V. (2001a). Prototype-referenced shape perception: adaptation and aftereffects in a multidimensional face space. J. Vis. 1, 332.
O’Toole, A. J., Wenger, M. J., and Townsend, J. T. (2001b). “Quantitative models of perceiving and remembering faces: precedents and possibilities,” in Computational, Geometric, and Process Perspectives on Facial Cognition, eds M. J. Wenger and J. T. Townsend (Mahwah, NJ: Lawrence Erlbaum Associates), 1–38.
O’Toole, A. J., Phillips, P. J., Jiang, F., Ayyad, J., Penard, N., and Parent, M. A. (2007). Face recogntion algorithms surpass humans matching acros changes in illumination. IEEE Trans. Pattern Anal. Mach. Intell. 29, 1642–1646.
O’Toole, A. J., Price, T., Vetter, T., Bartlett, J. C., and Blanz, V. (1999). 3D shape and 2D surface textures of human faces: the role of “averages” in attractiveness and age. Image Vis. Comput. 18, 9–19.
O’Toole, A. J., Vetter, T., Volz, H., and Salter, E. M. (1997). Three-dimensional caricatures of human heads: distinctiveness and the perception of facial age. Perception 26, 719–732.
Rhodes, G., Carey, S., Byatt, G., and Proffitt, F. (1998). Coding spatial variations in faces and simple shapes: a test of two models. Vision Res. 38, 2307–2321.
Rhodes, G., Maloney, L. T., Turner, J., and Ewing, L. (2007). Adaptive face coding and discrimination around the average face. Vision Res. 47, 974–989.
Romdhani, S., Blanz, V., Basso, C., and Vetter, T. (2005). “Morphable models of faces,” in Handbook of Face Recognition, eds S. Z. Li and A. K. Jain (New York: Springer), 217–245.
Ross, D. A., Hancock, P. J. B., and Lewis, M. B. (2010). Changing faces: direction is important. Vis. Cogn. 18, 67–81.
Russell, R., Biederman, I., Nederhouser, M., and Sinha, P. (2007). The utility of surface reflectance for the recognition of upright and inverted faces. Vision Res. 47, 157–165.
Shin, H. J., and Nosofsky, R. M. (1992). Similarity-scaling studies of dot-pattern classification and recognition. J. Exp. Psychol. Gen. 121, 278–304.
Slone, A. E., Brigham, J. C., and Meissner, C. A. (2000). Social and cognitive factors affecting the own-race bias in Whites. Basic Appl. Soc. Psych. 22, 71–84.
Troje, N. F., and Bulthoff, H. H. (1996). Face recognition under varying poses: the role of texture and shape. Vision Res. 36, 1761–1771.
Troje, N. F., and Bulthoff, H. H. (1998). How is bilateral symmetry of human faces used for recognition of novel views? Vision Res. 38, 79–89.
Valentine, T. (1991). A unified account of the effects of distinctiveness, inversion and race in face recognition. Q. J. Exp. Psychol. 44A, 161–204.
Valentine, T. (ed.). (1995). Cognitive and Computational Aspects of Face Recognition: Explorations in Face Space. London: Routledge.
Valentine, T. (2001). “Face-space models of face recognition,” in Computational, Geometric and Process Perspectives on Facial Cognition: Contexts and Challenges, eds M. J. Wenger and J. T. Townsend (Mahwah, NJ: Lawrence Erlbaum Associates Inc.), 83–114.
Valentine, T., and Bruce, V. (1986). The effects of distinctiveness in recognising and classifying faces. Perception 15, 525–535.
Vetter, T., and Blanz, V. (1999). “A morphable model for the synthesis of 3D faces,” in SIGGRAPH, ed. A. Rockwood (New York, NY: Addison Wesley), 187–194.
Vokey, J. R., and Read, J. D. (1992). Familiarity, memorability, and the effect of typicality on the recogntion of faces. Mem. Cognit. 20, 291–302.
Wills, A. J., Reimers, S., Stewart, N., Suret, M., and Mclaren, I. P. L. (2000). Tests of the ratio rule in categorization. Q. J. Exp. Psychol. A 53, 983–1011.
Wilson, H. R., Loffler, G., and Wilkinson, F. (2002). Synthetic faces, face cubes, and the geometry of face space. Vision Res. 42, 2909–2923.
Keywords: face recognition, criterion, sensitivity, face-space, three-dimensional shape, viewpoint, distinctiveness
Citation: Hill H, Claes P, Corcoran M, Walters M, Johnston A and Clement JG (2011) How different is different? Criterion and sensitivity in face-space. Front. Psychology 2:41. doi: 10.3389/fpsyg.2011.00041
Received: 21 December 2010;
Paper pending published: 25 January 2011;
Accepted: 28 February 2011;
Published online: 23 March 2011.
Edited by:
Frans Verstraten, Universiteit Utrecht, NetherlandsReviewed by:
Alice O’Toole, University of Texas at Dallas, USANicholas Costen, Manchester Metropolitan University, UK
Copyright: © 2011 Hill, Claes, Corcoran, Walters, Johnston and Clement. This is an open-access article subject to an exclusive license agreement between the authors and Frontiers Media SA, which permits unrestricted use, distribution, and reproduction in any medium, provided the original authors and source are credited.
*Correspondence: Harold Hill, School of Psychology, University of Wollongong, Wollongong, NSW 2522, Australia. e-mail:aGFycnlAdW93LmVkdS5hdQ==