

- 1 Brain Structure and Function, Neuroscience Research Australia, Sydney, NSW, Australia
- 2 School of Psychology, University of New South Wales, Sydney, NSW, Australia
Scene segmentation depends on interaction between geometrical and photometric factors. It has been shown that reversals in contrast polarity at points of highest orientation discontinuity along closed contours significantly impair shape discrimination performance, while changes in contrast polarity at straight(er) contour segments do not have such deleterious effects (Spehar, 2002). Here we employ (semi) high resolution fMRI (1.5 mm × 1.5 mm × 1.5 mm) to investigate the neuronal substrate underlying these perception effects. Stimuli consisted of simple elements (a) squares with contrast reversals along straight segments; (b) squares with contrast reversals in the corner (highest orientation discontinuity); (c) L-Junctions with contrast reversals along the straight ends; (d) L-Junctions with contrast reversals in the corner. Element with contrast polarity reversals are easy to distinguish though appear geometrically equivalent. For squares with contrast polarity reversals only along straight lines we find significantly lower BOLD modulation compared to any of the control conditions, which show similar responses to each other. In the light of previous psychophysical work (Elder and Zucker, 1993; Spehar, 2002) we speculate that this effect is due to closure perception. We observe this across a wide range of areas on occipital cortex.
Introduction
The visual system exhibits a remarkable ability to recover considerable portions of objects’ boundaries that are routinely missing in complex natural scenes due to occlusion, camouflage, or low visibility. The processes by which these spatially separated elements are grouped into continuous contours and closed regions form the critical first steps of surface and object processing. First considered by Gestalt psychologists, the principles of perceptual organization based on proximity, good continuation, and perceptual closure are still one of the most intuitive principles underpinning this remarkable ability (Koffka, 1935; Wertheimer, 1958). The original suggestions that the visual system automatically connects line elements that form continuous and smooth contours have by now developed into a number of parametrically quantified computational models of contour integration (Kellman and Shipley, 1991; Field et al., 1993). A central feature of these models is that the contour linking mechanisms operate on outputs of oriented spatiotemporal filters; a notion that is consistent with preferential linking of collinear or nearly collinear neighboring elements (Hess et al., 1998; Hess and Field, 1999). These assertions have been well supported at the neurophysiological level, where the same geometrical features have been shown to influence contextual interactions observed at earliest stages of cortical processing of contour fragments (Li and Gilbert, 2002).
The Role of Contour Closure in Contour Integration and Shape Discrimination
In addition to factors such as distance and orientation of contour fragments, it has been suggested that the process of selective integration of contour fragments is aided by contour closure (Elder and Zucker, 1993, 1998; Kovacs and Julesz, 1993; Geisler and Perry, 2009). Kovacs and Julesz (1993) reported the “closure enhancement effect” whereby closed contours were easier to detect at greater spacing of contour segments than comparable open-ended contours of similar length and curvature.
In their studies, Elder and Zucker (1993, 1998) used a visual search methodology varying the degree of closure by adding closure-inducing elements to both target and distractor shapes simultaneously. The closure-inducing segments by themselves provided no means for discrimination between target and distractors, providing for the same degree of closure for target and distractors, as schematically depicted in Table 1. They found that the search efficiency for a concave target among convex distractors was low for open stimuli consisting of unconnected but nearby contours (Table 1, top row), but high for closed stimuli formed by the addition of two identical line segments to each of the open figures (Table 1, second row). Interestingly, Elder and Zucker (1993) observed that this improved performance is essentially lost when contrast polarity reversed at corners within each inducer (Table 1, third row). They concluded that perceptual closure is sensitive to contrast polarity variations among contour elements.
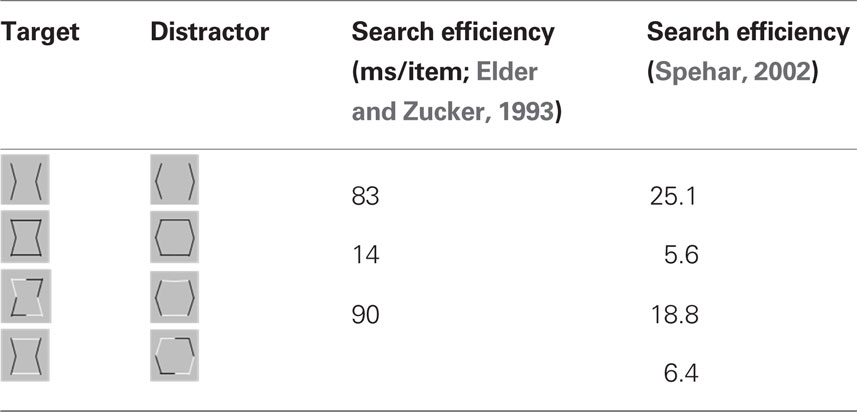
Table 1. Dependency of search performance on closure.
In a subsequent study, Spehar (2002) re-examined the effects of contrast polarity reversals in perceptual closure and found that this effect was critically dependent on the spatial distribution of contour segments of varying contrast polarity along the bounding contour. The presence of contrast polarity reversals was only detrimental to shape discrimination performance when contrast polarity reversals were positioned at corners (or at points of high contour curvature of the bounding contour), but significantly less when they occurred at straight(er) contour segments (Table 1, bottom row). Spehar (2002)argued that the coincidence of points of high contour curvature (i.e., a corner or junction) and contrast polarity reversal (i.e., a change in illumination or texture of the object) is a rare occasion. Accordingly, if the contrast polarity reverses at such junctions the probability that these segments will be grouped together is decreased. These findings suggest that the interpolation process is not simply influenced by the presence vs. absence of contrast polarity variations; rather, it depends on their precise geometrical distribution. In fact there seem to be certain hot-spots where contrast polarity reversals maximally affect the perceptual process. This pattern of results is consistent with a distance-dependent influence of contrast polarity observed in a number of visual judgments ranging from Vernier alignment to line orientation and separation discrimination (for reviews see Loffler, 2008). Spehar (2002); Westheimer, 2007; speculated that the effect contrast polarity on perceptual closure integration reflects ecological regularities in their distribution in natural scenes.
Recent studies investigating the statistical regularities in distribution of contour fragments in natural images have shown that the joint statistics of oriented filter responses in natural images, is consistent with the principles of proximity, collinearity, parallelism, and cocircularity (Geisler et al., 2001; Sigman et al., 2001; Elder and Goldberg, 2002; Dumoulin and Hess, 2006). In general, these studies examined a wide variety of natural images for a co-occurrence of particular pairs of oriented line segments as a function of their orientation or relative position in an image and they found that co-occurrence was maximal when the edge elements were of the same orientation and decreased as the orientation difference between the pair elements increased. Both Geisler et al. (2001) and Elder and Goldberg (2001) have independently established that these statistical associations were indeed related to the perceived object-related interrelationships between spatially separated contour segments. They used image tracing method and observers had to select all oriented elements that are perceived as belonging to the same contour, for all contours in the image. Thus obtained contour assignment information was used to demonstrate that the edge segments consistent with a smooth continuous contour are more likely to belong to the same physical contour, compared to edge segments with greater orientation difference. Furthermore, Geisler and Perry (2009) extended their analysis to contrast polarity of contour segments and found high degree of co-occurrence for collinear segments of different contrast polarity.
Their findings suggest that the process of selective integration of contour fragments belonging to the same physical object, and exclusion of extraneous contour segments is aided by contour closure. Furthermore, for collinear contour fragments this process appears to be insensitive to contrast polarity. This is consistent with our finding that discontinuities in tangent orientation and contrast sign did not disrupt perceptual closure of a contour when they occurred at different points (Spehar, 2002).
The Present Study
Here we employ semi-high resolution fMRI (1.5 mm × 1.5 mm × 1.5 mm) combined with a retinotopic ROI analysis in early visual cortex (see Materials and Methods for a detailed justification) to investigate the neuronal substrate affected by the spatial distribution of contrast polarity variations in closed configurations. In line with the approach developed by Elder and Zucker (1993) we keep the physical degree of contour closure constant across different distributions of contrast polarity variations. We use either fully closed shapes (SQUARES), or isolated parts (L-JUNCTIONS), crossed with contrast polarity variations positioned either at straight contour segments (COLLINEAR) or at corners (INTERSECTING). Contrast polarity reversals were manipulated at the element level of multiple simultaneously presented small elements. We employed multiple element displays to resemble a stimulus setup in visual search arrays, though subjects did not perform a search task, but rather a central color discrimination task irrelevant to the questions of this manuscript.
Materials and Methods
Subjects
Functional Magnetic Resonance Data was acquired from nine subjects (three female) with a mean age of 26 years. Experimental procedures were reviewed and approved by a UNSW Ethical Committee.
Experimental Stimuli
The stimuli were composed of simple black and white lines on a gray background and are illustrated in Figure 1, but we also provide short demo videos in “Appendix.” We have two different shapes, closed squares and open L-Junctions, and for each shape a COLLINEAR REVERSAL and an INTERSECTING REVERSAL configuration. Collinear reversal configurations do not have a contrast reversal in the corner but only along the straight lines. This results in a total of four different conditions. Each individual element was 0.9° in diameter, a complete screen was composed of 8 (squares) or 12 (L-junctions) element arranged around 3°of eccentricity (see Figure 1) with randomized orientation, contrast direction, and jittered position. The rgb and luminance values were as follows: gray rgb = 100 (54 cd/m2), inducer black: rgb = 20 (3 cd/m2) inducer white rgb = 180 (180 cd/m2), and rgb = 240 (230 cd/m2) for the white fixation cross. Each element consisted of the identical number of dark and white pixels. Stimuli were presented in 12 s blocks with every 500 ms a new pattern from the same condition (fMRI block design).
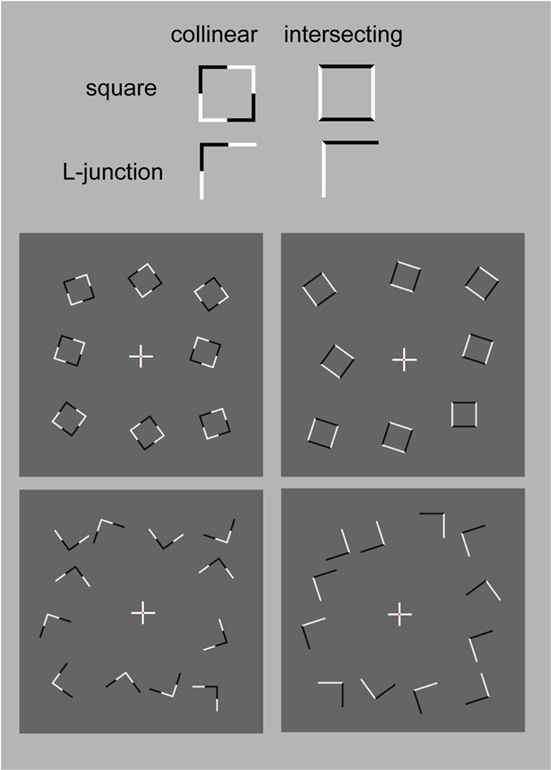
Figure 1. Schematic setup of the visual stimuli employed in this study. We also provide demo video in Supplementary Material. Basically the study employed a two by two design: Geometry (Square vs. L-Junction) and Contrast Polarity (collinear vs. intersecting) resulting in four conditions with the abbreviated names SquareCo, SquareIn, JunctionCo, and JunctionIn. Individual elements of the stimuli are depicted on the left; on the right complete stimulus arrangements are depicted.
Subjects performed a central attention task, where subjects were ask to detect a color change of the very center (2 × 2 pixels, 0.06°) of the fixation cross. Briefly, the central fixation dot could exhibit one of three behaviors, (i) flicker randomly in luminance (gray), (ii) be of the same white as the reminder of the fixation cross, (iii) turn red. Subjects were instructed to press and hold a response button as long as the fixation dot was red, while ignore any other changes in the fixation cross. This mildly demanding task served essentially two purposes, maintaining general vigilance of the subjects, while at the same distracted and discourage subjects from exploring the square and junction elements in the visual periphery, which where task irrelevant but relevant to the experimental question. Since the recording of button responses randomly interfered with the precision of our stimulus presentation software we did not systematically collect the responses. When subject’s responses were recorded performance was typically around 95% correct.
Block types were complete randomized. For the fMRI experiment 24 (i.e., six per condition) of such 12 s blocks + three 12 s blocks fixation-only were grouped into a “run” lasting 5 min 24 s. Each subjects viewed eight such runs with varying randomizations.
General MRI Procedures
Magnetic resonance imaging (MRI) was performed on Philips 3T achieva X-Series scanner at St. Vincent’s Hospital and Neuroscience Research Australia (NeuRA), Sydney. The scanning protocols employed in this study used an eight-channel phased array head coil and fairly high resolution (0.75 mm isovoxel for T1 anatomy scans and 1.5 mm isovoxel for functional scans). Using a modern multi-channel imaging system greatly reduces noise from the scanner (Triantafyllou et al., 2006, 2011) making high resolution fMRI not only feasible but highly recommendable, balancing noise contribution from the scanner and the brain. Further high resolution echoplanar imaging (EPI) procedures improve accuracy of motion correction, and feasibility of alignment between functional EPI data and the anatomical T1 data used for the reconstruction of surface representations. While the general analysis procedures and principles in this study do not necessarily require such high resolutions as employed here, it is likely that these procedures increased the sensitivity (though this is difficult to quantify and certainly not the focus of this manuscript). The data was analyzed using the freely available Matlab toolboxes SPM5, the Stanford mrVISTA tools and various in-house functions and scripts.
Retinotopic Mapping, ROI Analysis
For each subject we performed retinotopic mapping procedures to identify the early visual areas providing the basis for our ROI analysis. The specific Retinotopic mapping procedures are described in detail in previous work (Schira et al., 2007, 2009). Briefly, cyclic stimuli consisting of expanding rings or rotating wedges were employed to generate phase encoded eccentricity and polar and angle maps for each subject. Based on these maps we identified five visual areas, V1, V2, V3, hV4, V3A/B following a framework of early visual cortex organization most current concepts agree on Tyler et al. (2005), Larsson and Heeger (2006), Hansen et al. (2007), Dumoulin and Wandell (2008), Winawer et al. (2010). Finally, we identified a 6st region we name occipital lateral fovea (OLF)/LO1 acknowledging that its organization is currently under discussion (Tyler et al., 2005; Larsson and Heeger, 2006; Hansen et al., 2007; Swisher et al., 2007; Amano et al., 2009; Kolster et al., 2010). OLF refers to occipital lateral fovea acknowledging that this region of cortex responded preferably to very foveal stimuli in our retinotopic mapping protocols. In some previous studies it would have categorized as part of the Foveal Confluence, but our optimized mapping protocols allow us to subdivide the foveal confluence into foveal V1, V2, V3, and the reminder (Schira et al., 2009) – which we label OLF. We defined this region as immediately anterior of the foveal representation of V3. Despite the disagreements on its organization we included OLF/LO1 in our analysis since it suggested to border and overlaps with so called lateral occipital cortex (LOC) which is often associated with object perception (Grill-Spector et al., 1998a,b; Hasson et al., 2002; Carlson et al., 2007; Fang et al., 2008; Sayres and Grill-Spector, 2008). Figure 3 illustrates the location and the results of the retinotopic mapping scans for one exemplary subject. These set of ROIs also covers early visual cortex reasonably well, essentially providing a sensitive and precise spatial normalization of each subject. Further, where feasible, each ROI excluded the most peripheral and foveal ranges, so that it generously covered the eccentricity ranges reflecting the position of the Junction and Square stimuli, without including too much cortex outside the eccentricity ranges of the stimuli. Further, for analyzing foveal responses (see Figure 5) in V1 and V2/3 small ROIs were restricted to eccentricity phases smaller than 1°. Importantly; ROI definitions (except for the SPM-normalized group analysis) were entirely derived from on the basis of Retinotopic mapping results.
Scanning Protocols
Anatomical data
For each subject a high resolution (0.75 mm × 0.75 mm × 0.75 mm) T1 weighted anatomical data set was acquired as introduced in (Schira et al., 2009) and segmented using ITKgray software. Based on this segmentation a 3d manifold of cortical gray matter was reconstructed, serving as the basis for data extraction with the individual ROI analysis.
Functional data
To achieve high resolution, speed, and small distortions, we used a SENSE-accelerated (Pruessmann et al., 1999) EPI sequence. Great care was taken to minimize distortion, and each subject’s data were carefully investigated to ensure distortion was minimal. Functional data were acquired in 46 slices roughly orthogonal to the calcarine sulcus. Each slice was 1.5 mm thick with a 128 × 128 matrix, 192 mm field of view, and a SENSE factor of 2.3, resulting in an effective resolution of 1.5 mm isovoxel. Volume repetition time was 3 s. Functional data were motion corrected and slice scan-time corrected using the SPM5 software package, then imported into the mrVista-Toolbox (Stanford University, Stanford, CA, USA; http://white.stanford.edu/software/) where all further processing and analysis were performed. No spatial smoothing was performed for mrVISTA based ROI analysis. Each subject was scanned in two (typically 1 h) sessions, the first for acquiring retinotopic mapping and anatomical T1 data the second for the contrast polarity experiments. Contrast polarity data was acquired in several (8–12 depending subject) short runs. Each run lasted 5 min and 24 s and contained 27 short 12 s blocks (3×Fixation, 6× each experimental condition JUNCTIONCO; JUNCTIONIN; SQUARECO; SQUAREIN). Each run had a different (unique) randomization.
For SPM-group analysis functional data was normalized to the avg152T1.nii target via individual subjects T1-scan, 8 mm FWHM smoothed and fist level random effects analysis using a canonical HRF set was performed. More importantly, a second level “random effects flexible contrast analysis” was performed to allow testing multiple contrasts. We investigated 3 t-contrasts, (a) Shape (Square vs. Figure), (b) Contrast Reversal (SQUARECO AND JUNCTIONCO vs. JUNCTIONIN and SQUAREIN), and finally (c) SQUARECO vs. JUNCTIONCO, all FDR corrected and a minimal cluster size of 10 (high resolution) voxels.
For ROI analysis on averaged group data the “RFX plot toolbox” was employed. ROI time series were extracted from significant voxel clusters (FDR corrected) within a 5-mm radius of the center of group cluster. SPM time courses were plotted as effect size (normalized Beta values).
Results
First, we extracted BOLD responses for each subjects individually defined retinotopic ROI, averaged across hemispheres. We generally find moderate increase in BOLD responses to the experimental condition relative to baseline; each condition resulted in an average signal modulation off 0.35% relative to the Fixation condition. Figure 2 summarizes the peak (average of the 6- to 12-s after block onset) BOLD responses for each condition and retinotopic ROI (for time courses BOLD responses refer to Figure 4).
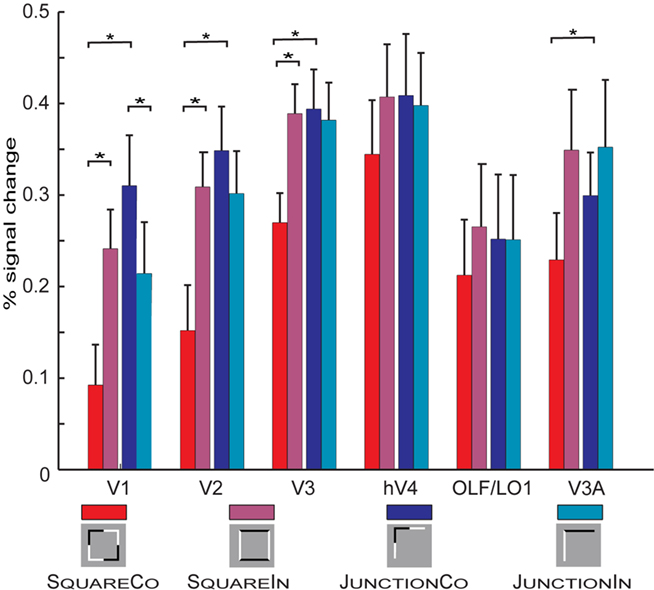
Figure 2. Summarized responses across all retinotopic ROIs and conditions pooled across hemispheres. Error bars depict SE across subjects. The small pictograms present a simplified version of the actual stimuli (see Figure 1 for a more accurate depiction of the employed stimuli). Important significant differences are marked with stars, for a complete report on significant differences see “Appendix.” For the square configurations the SquareCo condition results in the less BOLD response across all visual areas, this is significant in V1, V2, and V3. For the L-Junction configurations the observed effects are weaker, in the opposite direction and only significant in V1. In V1, V2, and V3 we also find a significant difference between the conditions SquareCo and JunctionCo.
We jointly tested the two geometrical configurations, performing a set of six independent 2 by 2 ANOVA with the factors Shape (square vs. L-junction) and contrast reversal (collinear vs. intersecting) and subjects as the source of independent observations. Table 2 summarizes the results of these ANOVA. For those areas with a significant interaction (V1, V2, V3) we further performed a Tukey’s honest statistical difference (HSD) test to further explore the interaction (see Appendix for complete statistical tables). Simplified, summarizing the effects found in the ANOVA, for each of the early visual areas V1, V2, and V3 there is a significant main effect of shape and a significant interaction between shape and contrast polarity reversals. Looking at the results in Figure 2 it becomes apparent that the condition SQUARECO resulted in lower BOLD response than all other conditions an effect present in all ROIs we tested, but significant only in V1–V3. Finally, in V3a the ANOVA there was a significant effect of Contrast Reversal type, but no significant interaction (and hence no HSD test was performed).
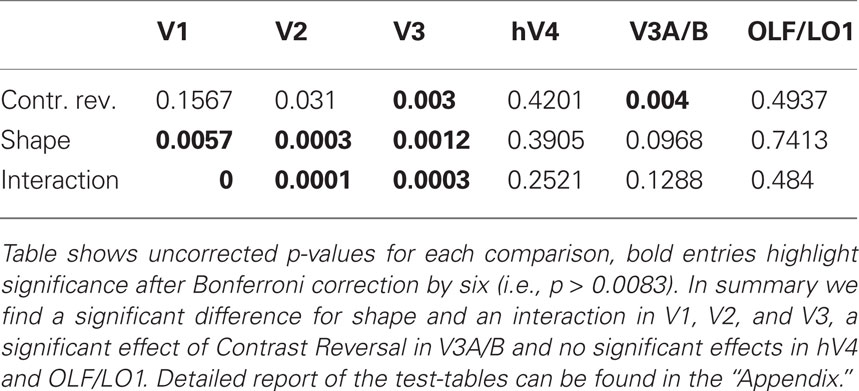
Table 2. Summary of the results of the six independent ANOVAs performed.
In more detail exploring the HSD test, in V1 we find for both geometrical configurations (Square but also Junction) a significant difference between the collinear and the intersecting conditions. This effect has the opposite direction for square and L-junctions (explaining the interaction in the ANOVA). Further, we find a significant difference between the two collinear conditions, SQUARECO and JUNCTIONCO, but no significant difference between the two conditions with intersecting contrast polarity changes: SQUAREIN and JUNCTIONIN. In V2 the difference between the L-junction configurations is smaller (and essentially absent in V3) so only for squares there was a significant difference between the collinear and the intersecting patterns, but not between the two L-junction conditions. In neither of the areas defined retinotopically we found any significant difference between the two intersecting conditions.
To highlight effects within the geometric configurations, Figure 3 replots the data from Figure 2, depicting various comparisons between the conditions. Figure 3A shows that across all investigated early visual areas the intersecting Square condition resulted in stronger BOLD modulation than the collinear Square condition (significant in V1, V2, and V3). This strong effect resulting from subtle contrast polarity modulation is absent when comparing the two conditions containing simple L-junctions (Figure 3B). On the contrary comparing the two junction conditions, we find a small increase in BOLD for the collinear condition. This is only significant in V1.
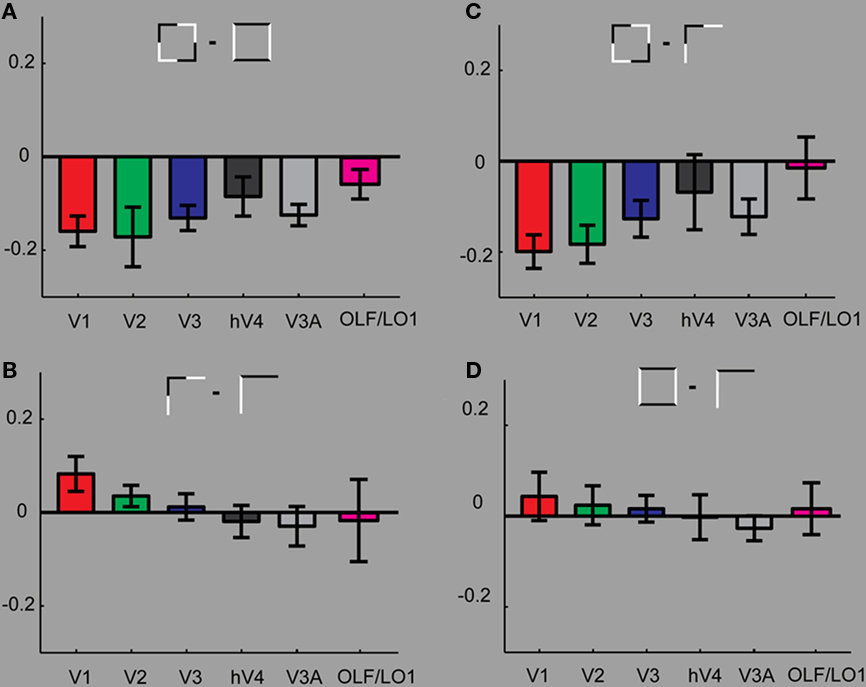
Figure 3. Comparing results within geometric configurations. (A) Compares the responses between the two square conditions. We find that throughout the tested ROIs stronger responses for the control condition (SquareIn) than for the condition SquareCo. (B) Investigates the differences between the two L-junction conditions. Here we find slight increases in responses to the JunctionCo than to the control condition in V1 (significant). In all other ROIs the responses to the valid and non-valid junction patterns are almost identical. (C) The strongest response differences result comparing the two collinear conditions. (D) Comparing the two intersecting control conditions reveals no difference, confirming that comparing the two collinear conditions is meaningful and not confounded by strong effects from simple stimulus properties such as number of elements and contrast borders.
In early visual areas V1, V2, V3, and hV4 (but less so in V3A) our retinotopic mapping analysis revealed a clear and reliable eccentricity gradient. Accordingly the ROIs in these areas were restricted to eccentricities ranging from 1.5° to 4°. Previously (Schira et al., 2009) we demonstrated that we are able to segregate early visual areas in the very foveal sections. Accordingly, we defined two further ROIs, exploring foveal responses: foveal V1 and foveal V2/V3, i.e., those regions in these areas representing eccentricities from 0° to 1°. It has to be noted that there were no visual stimuli presented in those foveal parts of the visual field but rather a mean gray background and the fixation task in the very center (>0.1°). If responses to our stimuli are retinotopically restricted within visual areas, one would not expect response modulation in these ROIs. Accordingly, they serve as a control probing accuracy of our retinotopic mapping protocols, but also test spread of BOLD modulation beyond retinotopic organization. Figure 4 depicts the time course of these regions, please note in Figure 4D responses to stimulus presentation in visual area OLF/LO1.
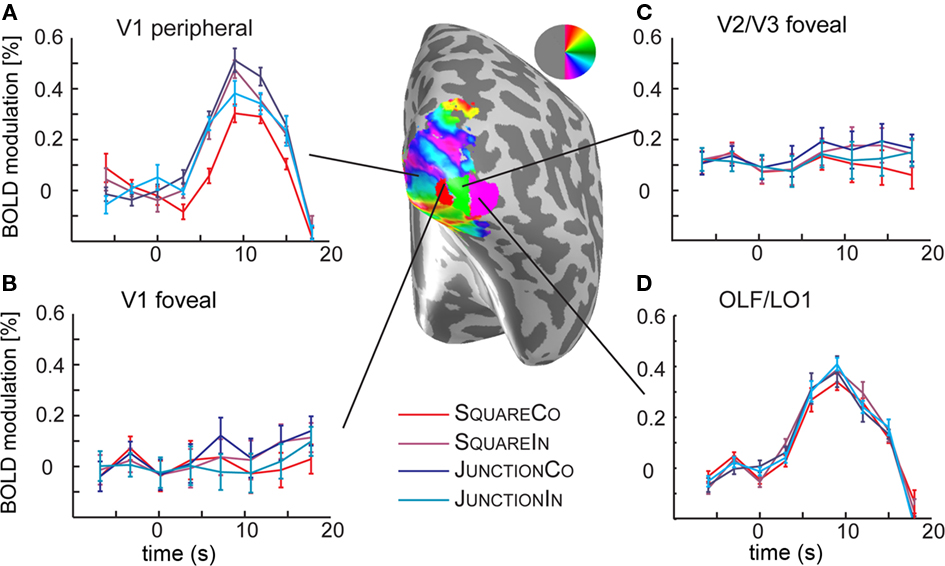
Figure 4. Analysis of the time courses in the foveal confluence. (A) Shows the time course in the time course in V1 in the periphery, i.e., the region the junction and square stimuli were presented. The curves demonstrate clear response curves to stimulus onset, and different response heights are visible for different shape, and contrast polarity conditions, reflecting the results depicted in Figures 2 and 3. (B) In the foveal regions of V1, however there is no significant response to the stimuli. (C) In foveal V2/V3 the responses are similar to those in foveal V1. (D) Shows the time course in the OLF/LO1 ROI demonstrating a clear response to the stimulus presentation. Note however that the eccentricity maps on this region of cortex (not shown) mostly demonstrate preference for foveal stimuli. Different to the peripheral V1 responses, there is no obvious response modulation with respect to the stimulus conditions.
To avoid overlooking strong effects beyond the retinotopically mapped early visual cortex, we also explored the data in a less hypothesis driven fashion. SPM5 was used to normalize each subject into MNI space and a standard random effects group analysis was employed. Essentially, SPM revealed one additional area beyond those identified with retinotopic mapping. Contrasting the response differences to shape (i.e., Squares vs. Junctions) revealed three significant clusters surviving FDR correction, these areas show stronger responses for Junctions than for Squares (see Figure 5 for their location and Table 3 for statistics). By projecting these MNI locations into the individual subjects (normalized) anatomies we could approximate these MNI locations in individual subjects (and retinotopically classified) brains. Firstly, we found a bilateral response in LOC (MNI coordinates −46 −86 2 and 48 −78 0). We consistently located this patch anterior to the foveal confluence of V1–V3, roughly between V3A/B and hV4, often just anterior the ROI we identify as OLF/LO1. The third patch (right upper occipital lobe at MNI 20 −90 24) was partially overlapping the set of early visual areas we identified by retinotopic mapping, just superior to the peripheral end of V3, roughly in the vicinity of area V6 or at the border between V3A/B and V6. This patch was overlapping with our retinotopic ROI analysis in some subjects, neighboring to the retinotopic regions in other subjects.
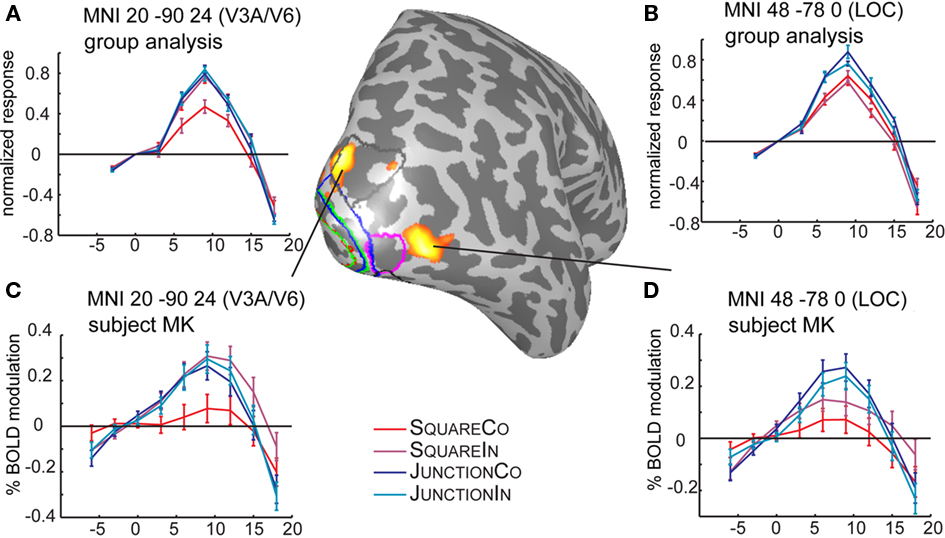
Figure 5. Time courses and locations of the SPM-group analysis. The results of the SPM test are projected in red on the right hemisphere of subject MK. The top plots (A,B) depict the time courses from the group analysis, the bottom plots (C,D) depicts the same coordinates (by the means of an inverse normalization) in a single subject. Marked on the surface are the retinotopic regions in subject MK, V1 (red), V2 (green), V3 (blue), V3A/B (gray), OLF/LO1 (magenta). The MNI patch 20 −90 24 partially overlaps with the V3A/B roi just next to the periphery of dorsal V3. The second patch (MNI 48 −78 0), is located just anterior to the ROI OLF/LO1, depicted in magenta.
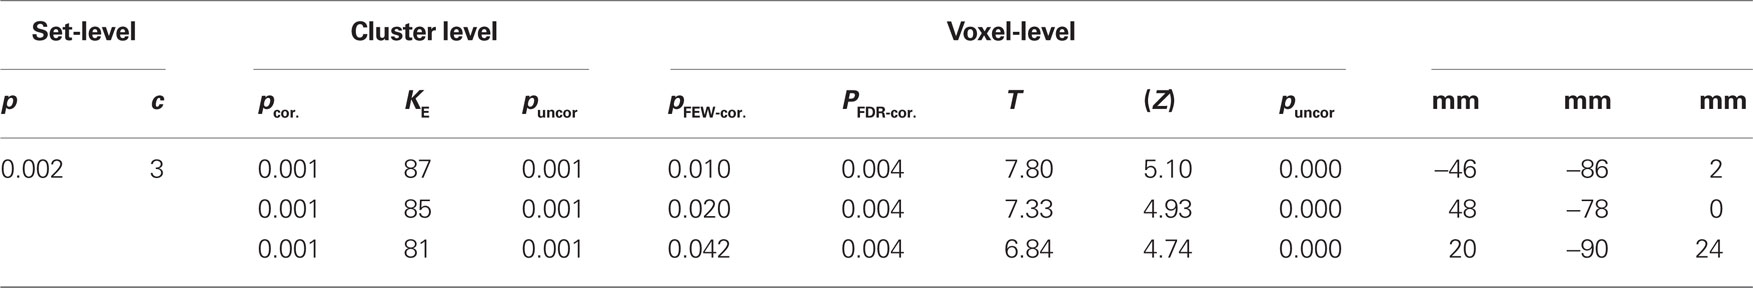
Table 3. SPM-group analysis for effects of shape, threshold FDR corrected p > 0.001, minimal cluster size of 10.
Close inspection of the group analysis in the corresponding location in the left hemisphere (MNI −20 −90 24, not shown), reveals a very similar time course but the difference between conditions apparently failed to reach significance.
Discussion
Introducing small contrast polarity variations in simple square or L-Junction elements we find widespread BOLD modulations, in early visual cortex areas V1, V2, V3, hV4, and V3a. In the square configuration, moving the contrast polarity reversal from straight line segments into the corners of the figures resulted in a significant increase of BOLD modulation across early visual cortex. Despite rather small differences in these two figures, the BOLD effects found in this study and the differences in search performance reported by Spehar and colleagues (Spehar, 2002; Spehar and Clifford, 2003) suggest that early visual cortex processes these two configurations differently. The earlier psychophysical work suggests that if located at the very corner contrast polarity reversals impairs closure or shape discrimination with such configurations (Elder and Zucker, 1993, 1998; Spehar, 2002).
The design chosen for this study with short presentation times and simultaneous presentation of multiple elements resembled a typical stimulus display from a visual search task. We aimed to investigate fast and parallel processing of visual elements, a processing supposedly distributed across early visual cortex and the receptive field organization of this stage of visual processing. According to search times reported by Spehar (2002), with a search time of 25 ms per element in the slowest condition (see Table 1 right column top row) the 500-ms presentation time should be sufficient for the visual system to analyze each stimulus element.
Foveal Responses
Early visual cortex is retinotopically organized and accordingly it has been demonstrated that BOLD effects resulting from experimental manipulations of visual stimuli are typically neatly restricted to appropriate retinotopic subparts of early visual areas (Mendola et al., 1999; Schira et al., 2004; Kraft et al., 2005). Comparing the responses from different eccentricity ranges (see Figure 4) confirms this principle, demonstrating that in V1–V3 response modulations are restricted to the peripheral subparts while the very foveal subparts of V1–V3 shows very little response to the stimulus presentations. OLF/LO1 however, does show clear response modulations to stimulus onset relative to fixation (Figure 4D), even though in retinotopic mapping experiments this area of cortex typically responded preferentially to foveal stimuli of the eccentricity measurement. A simple explanation for this might be that receptive fields in this part of visual cortex are most likely very large. Amano et al. (2009) estimated population receptive field sizes of about 2° in LO1 in contrast to only 0.25° for V1 (both at an estimated eccentricity of 1°). Accordingly, while eccentricity mapping typically identifies OLF as foveal cortex, it probably also responds to visual stimuli presented at more peripheral locations.
Differential Responses Square and Junction Conditions, an Effect of Closure?
When comparing the two L-junction conditions, JUNCTIONCO and JUNCTIONIN, the observed BOLD modulation resulting from the contrast polarity modulation is converse to the BOLD modulation observed in the square conditions. That is we found an increase in BOLD modulation when shifting the contrast polarity reversals from the very corner to the straight flanks. However, this effect is smaller and mostly restricted to V1 (where it is significant). Obviously, neither of the junction configurations can result in perceptual closure, however it is unclear to what degree other perceptual grouping mechanisms influence their visual interpretation. Currently, there is little work this result could be compared with or little theoretical frameworks that could offer an explanation for this observation. One hypotheses would be that contrast polarity reversals at the very edge disrupt contour integration, since they present unlikely elements in a visual scene (Geisler and Perry, 2009), and accordingly the visual system has no neuronal structures detecting them such as those suggested for junctions without contrast polarity reversals (Hegde and Van Essen, 2003).
One possibility is that it may be related to the reported sensitivity of end stopping cells to contrast polarity variations (Yazdanbakhsh and Livingstone, 2006). End stopping cells are complex type cells in V1 that respond to oriented bars preferably of a distinct (maximal) length. It is typically assumed that these cells are of key significance in low-level processes involved in detecting and integrating of contours. Yazdanbakhsh and Livingstone (2006) further report that response in some end stopping cells increases when a bar of optimal length is extended by opposite contrast bars, while their response is decreased when the same flanks are of the same color than the central bar. This in particular may be an explanation for the small increase in V1 BOLD response we find between the JUNCTIONCO and JUNCTIONIN conditions – in the absence of closure. It cannot however, explain the stronger more widespread and most importantly inversed response between SQUARECO and SQUAREIN.
With respect to fMRI responses it has been suggested that grouping stimulus elements into figures results in reduced activity in early visual cortex (Murray et al., 2002; Fang et al., 2008) a hypotheses that has been dubbed as “perceptual explaining away” (Kersten and Yuille, 2003). Following this, the perceptually grouped SQUARECO should result in lower BOLD-responses in early visual cortex than the not grouped SQUAREIN condition. While we have observed this pattern of results across all early visual areas (Figure 3A), this hypothesis also postulates a “higher” processing stage such as the LOC holding an abstract representation of the explained elements, a stage supposedly apparent by an increased BOLD response. We could not find such a stage in our data. Explicitly searching for stronger response to SQUARECO over SQUAREIN (SPM t-test) did not reveal any significant effects. However, it might be simplistic to assume that such a higher level representation of objects will necessarily result in sufficient neuronal activity to elicit a BOLD modulation for significant group level effects in such a crude procedure such as an SPM analysis. Furthermore, the difference in processing of grouped and closed objects at higher levels of visual processing levels might even influence activity in early visual areas where its BOLD effect would be overcompensated by the decrease in activity we observed.
On the other hand, Dumoulin and Hess (2006) argue that the inverse relationship between V1 and higher cortical areas in response to the varying degrees of image structure is not necessarily best explained by the shape-based perceptual feedback mechanism. Instead, they suggest that decreased activity in V1 with increasing image structure may be explained by concomitant signal changes in low-level image statistics that generally vary with shape. These assertions have implications for the results we report here as closure is obviously related to circularity and both have been implicated as important aspects of intermediate shape processing (Wilson et al., 1997; Wilkinson et al., 2000). In particular, we want to rule out that the effects we report are a consequence of differences in low-level image properties between the two contrast polarity placement conditions in our square junction configurations.
The Effects of RMS Contrast and Power Spectra on fMRI Activity
When designing the stimulus patterns it was apparent that 16 junction elements (i.e., eight halved squares) resulted in a very crowded display, shifting the overall appearance of the display (see Discussion above on texture composed of irregularly spaced elements). Accordingly, we reduced the number of junction elements to 12. This reduction of elements resulted in different RMS contrast (Pelli, 1990) for junction conditions (0.071) and square conditions (0.086). We believe that the small differences in RMS contrast did not significantly contribute to the effects we observe. For example, comparison between the two intersecting control conditions (between 12 junction elements and 8 square elements but both with intersecting contrast polarity reversals) reveals no significant differences in the BOLD response. More importantly, our most critical comparisons are within the two types of open and closed shape configurations and refer to the different placement of contrast polarity variations within them. Here, we observed significant differences in the BOLD response between intersecting and collinear configurations despite no differences in the respective RMS contrast energy.
As it has been shown that fMRI responses are also influenced by spatial frequency (Sasaki et al., 2001), we also calculated rotationally averaged power spectra depicted in Figure 6. While we did find small differences between conditions (including a less homogeneous distribution of frequencies in the square conditions compared to the junction conditions), the slopes for log amplitude vs. log frequency were virtually identical between all four conditions with variation between junctions and squares conditions larger than within the corresponding intersecting and collinear variants within each of these conditions (−1.46 ± 0.15). Similar to our line of argument with respect to differences in RMS contrast between these configurations, we do not believe that the differences in the spatial frequency between our stimuli were responsible for the observed effects.
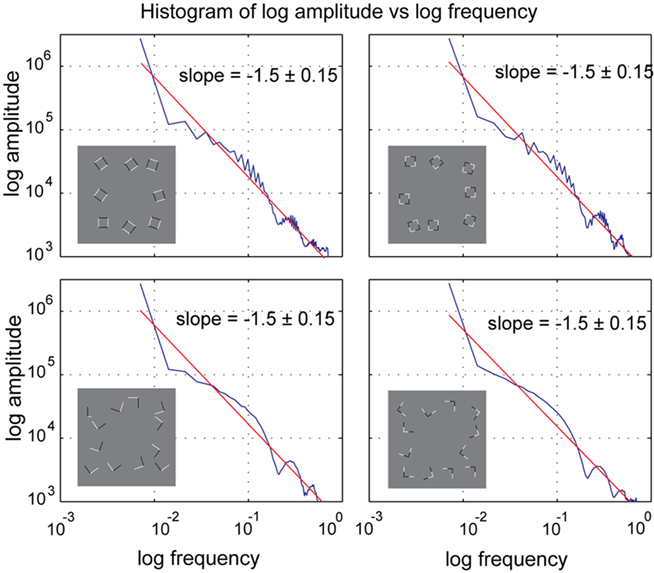
Figure 6. Amplitude histogram of rotationally averaged power spectrum analysis. There are small differences between spectra of the same within geometrical configurations (i.e., between the two square conditions), but these differences are subtle and most importantly the slopes and the area under the curves is very similar across all conditions.
Responses in LOC
While our group analysis did reveal significant effects in LOC, responses with respect to SQUARECO and the SQUAREIN were virtually identical (see Figure 5B). This is noteworthy, since LOC demonstrates a clearly different response pattern than early visual areas V1 through hV4. We rather found the LOC response to vary between the junction and the square conditions, while contrast polarity manipulations did not affect LOC responses. The absence of LOC modulation with respect to contrast polarity manipulations may reflect the absence of geometrical or overall spatial layout differences between various distributions of contrast polarity variations. Different from typical designs investigating contour integration or object recognition (Grill-Spector et al., 1998a,b; Murray et al., 2002; Kourtzi et al., 2003; Fang et al., 2008; Sayres and Grill-Spector, 2008) our displays did not contain a central figure surrounded by a background. Appelbaum et al. (2010) reported that EEG sources located around LOC depended greatly on the geometrical configuration of the stimulus setup. Only stimulus configurations with surrounded figure/ground arrangements were found to modulate LOC activity while other patterns such as fields of randomly oriented “texture-doublets” or segmented stripe patterns did not. Another potential reason could be due to the fact that subjects performed a central attention task and probably did not notice any difference between the two square conditions. A recent study by Carlson et al. (2007) demonstrated an absence of LOC adaptation for masked (and not perceived) stimuli. It is also unclear why LOC responded more strongly overall to the junction conditions than the square conditions; one explanation could be the higher number of independent elements (12 junctions rather than 8 squares).
Perceiving an Object or a Texture
One of our central observations is that essentially the same contrast polarity manipulations resulted in very different BOLD – modulations depending if open junctions or closed squares were manipulated. As pointed out earlier we believe that this is due to the differences between the local elements of our stimulus, more precisely that in the square configurations closed figures were manipulated but open figures in the L-Junction configurations. An alternative hypothesis would be on the global arrangement of the stimulus display rather than local differences between the closed and open elements. Our patterns consisted of a number of randomly distributed elements, designed to be similar to the patterns previously used in visual search based estimates experiments (Elder and Zucker, 1993; Spehar and Clifford, 2003). Principally, in a visual display with multiple elements these can be seen independently as “shapes” or together as a “texture” (Julesz, 1975, referred to as “form” or “material” by Goldmeier, 1937). The degree to which a given stimulus display falls more in one or the other of these two categories cannot be precisely determined. Kimchi and Palmer (1982) demonstrated that increasing the number of elements in an visual display gradually shifts the degree to which they are perceived individually or as texture. According to these notions, one might argue that in general, our open L-junction elements were more likely to be processed as texture-like, than the larger and fewer closed square elements. It has been suggested from fMRI and lesion studies that form and texture are processed by separate channels (Cavina-Pratesi et al., 2010), which may be effected differently by contrast polarity. However, the group analysis did not reveal significant activities in any of the higher level areas suggested in texture perception, indicating that there was no major shift from object to texture processing between junctions and squares.
Conclusion
Complementing results from psychophysics (Spehar, 2000, 2002) and analysis of natural images (Geisler and Perry, 2009) we observe the effects of contrast polarity in processing of closed shapes and component junctions. Simple manipulations of the contrast polarity distribution result in significantly different BOLD responses, for both geometric configurations tested here. The observation that the identical manipulations of contrast polarity reversals result in opposite modulation of V1 BOLD responses for closed and open configurations is evidence that this is not a simple effect of local contrast properties.
Conflict of Interest Statement
The authors declare that the research was conducted in the absence of any commercial or financial relationships that could be construed as a potential conflict of interest.
Acknowledgments
This research was supported by Australian Research Council Grant DP0666441 and the J. McDonnell Foundation Grant 22002082.
Supplementary Material
The Movies 1, 2, 3, and 4 for this article can be found online at http://www.frontiersin.org/Perception_Science/10.3389/fpsyg.2011.00047/abstract
References
Amano, K., Wandell, B. A., and Dumoulin, S. O. (2009). Visual field maps, population receptive field sizes, and visual field coverage in the human MT+ complex. J. Neurophysiol. 102, 2704–2718.
Appelbaum, L. G., Ales, J. M., Cottereau, B., and Norcia, A. M. (2010). Configural specificity of the lateral occipital cortex. Neuropsychologia 48, 3323–3328.
Carlson, T. A., Rauschenberger, R., and Verstraten, F. A. (2007). No representation without awareness in the lateral occipital cortex. Psychol. Sci. 18, 298–302.
Cavina-Pratesi, C., Kentridge, R. W., Heywood, C. A., and Milner, A. D. (2010). Separate processing of texture and form in the ventral stream: evidence from FMRI and visual agnosia. Cereb. Cortex 20, 433–446.
Dumoulin, S. O., and Hess, R. F. (2006). Modulation of V1 activity by shape: image-statistics or shape-based perception? J. Neurophysiol. 95, 3654–3664.
Dumoulin, S. O., and Wandell, B. A. (2008). Population receptive field estimates in human visual cortex. Neuroimage 39, 647–660.
Elder, J. H., and Goldberg, R. M. (2001). Image editing in the contour domain. IEEE Trans. Pattern Anal. Mach. Intell. 23, 291–296.
Elder, J., and Zucker, S. (1993). The effect of contour closure on the rapid discrimination of two-dimensional shapes. Vision Res. 33, 981–991.
Elder, J. H., and Zucker, S. W. (1998). Evidence for boundary-specific grouping. Vision Res. 38, 143–152.
Elder, J. H., and Goldberg, R. M. (2002). Ecological statistics of Gestalt laws for the perceptual organization of contours. J. Vis. 2, 324–353.
Fang, F., Kersten, D., and Murray, S. O. (2008). Perceptual grouping and inverse fMRI activity patterns in human visual cortex. J. Vis. 8, 2.1–2.9.
Field, D. J., Hayes, A., and Hess, R. F. (1993). Contour integration by the human visual system: evidence for a local “association field.” Vision Res. 33, 173–193.
Geisler, W. S., and Perry, J. S. (2009). Contour statistics in natural images: grouping across occlusions. Vis. Neurosci. 26, 109–121.
Geisler, W. S., Perry, J. S., Super, B. J., and Gallogly, D. P. (2001). Edge co-occurrence in natural images predicts contour grouping performance. Vision Res. 41, 711–724.
Grill-Spector, K., Kushnir, T., Edelman, S., Itzchak, Y., and Malach, R. (1998a). Cue-invariant activation in object-related areas of the human occipital lobe. Neuron 21, 191–202.
Grill-Spector, K., Kushnir, T., Hendler, T., Edelman, S., Itzchak, Y., and Malach, R. (1998b). A sequence of object-processing stages revealed by fMRI in the human occipital lobe. Hum. Brain Mapp. 6, 316–328.
Hansen, K. A., Kay, K. N., and Gallant, J. L. (2007). Topographic organization in and near human visual area V4. J. Neurosci. 27, 11896–11911.
Hasson, U., Levy, I., Behrmann, M., Hendler, T., and Malach, R. (2002). Eccentricity bias as an organizing principle for human high-order object areas. Neuron 34, 479–490.
Hegde, J., and Van Essen, D. C. (2003). Strategies of shape representation in macaque visual area V2. Vis. Neurosci. 20, 313–328.
Hess, R., and Field, D. (1999). Integration of contours: new insights. Trends Cogn. Sci. 3, 480–486.
Hess, R. F., Dakin, S. C., and Field, D. J. (1998). The role of “contrast enhancement” in the detection and appearance of visual contours. Vision Res. 38, 783–787.
Kellman, P. J., and Shipley, T. F. (1991). A theory of visual interpolation in object perception. Cogn. Psychol. 23, 141–221.
Kersten, D., and Yuille, A. (2003). Bayesian models of object perception. Curr. Opin. Neurobiol. 13, 150–158.
Kimchi, R., and Palmer, S. E. (1982). Form and texture in hierarchically constructed patterns. J. Exp. Psychol. Hum. Percept. Perform. 8, 521–535.
Kolster, H., Peeters, R., and Orban, G. A. (2010). The retinotopic organization of the human middle temporal area MT/V5 and its cortical neighbors. J. Neurosci. 30, 9801–9820.
Kourtzi, Z., Tolias, A. S., Altmann, C. F., Augath, M., and Logothetis, N. K. (2003). Integration of local features into global shapes: monkey and human FMRI studies. Neuron 37, 333–346.
Kovacs, I., and Julesz, B. (1993). A closed curve is much more than an incomplete one: effect of closure in figure-ground segmentation. Proc. Natl. Acad. Sci. U.S.A. 90, 7495–7497.
Kraft, A., Schira, M. M., Hagendorf, H., Schmidt, S., Olma, M., and Brandt, S. A. (2005). fMRI localizer technique: efficient acquisition and functional properties of single retinotopic positions in the human visual cortex. Neuroimage 28, 453–463.
Larsson, J., and Heeger, D. J. (2006). Two retinotopic visual areas in human lateral occipital cortex. J. Neurosci. 26, 13128–13142.
Li, W., and Gilbert, C. D. (2002). Global contour saliency and local colinear interactions. J. Neurophysiol. 88, 2846–2856.
Loffler, G. (2008). Perception of contours and shapes: low and intermediate stage mechanisms. Vision Res. 48, 2106–2127.
Mendola, J. D., Dale, A. M., Fischl, B., Liu, A. K., and Tootell, R. B. (1999). The representation of illusory and real contours in human cortical visual areas revealed by functional magnetic resonance imaging. J. Neurosci. 19, 8560–8572.
Murray, S. O., Kersten, D., Olshausen, B. A., Schrater, P., and Woods, D. L. (2002). Shape perception reduces activity in human primary visual cortex. Proc. Natl. Acad. Sci. U.S.A. 99, 15164–15169.
Pruessmann, K. P., Weiger, M., Scheidegger, M. B., and Boesiger, P. (1999). SENSE: sensitivity encoding for fast MRI. Magn. Reson. Med. 42, 952–962.
Sasaki, Y., Hadjikhani, N., Fischl, B., Liu, A. K., Marret, S., Dale, A. M., Tootell, R. B. H. (2001). Local and global attention are mapped retinotopically in human occipital cortex. Proc. Natl. Acad. Sci. U.S.A. 98, 2077.
Sayres, R., and Grill-Spector, K. (2008). Relating retinotopic and object-selective responses in human lateral occipital cortex. J. Neurophysiol. 100, 249–267.
Schira, M. M., Fahle, M., Donner, T. H., Kraft, A., and Brandt, S. A. (2004). Differential contribution of early visual areas to the perceptual process of contour processing. J. Neurophysiol. 91, 1716–1721.
Schira, M. M., Tyler, C. W., Breakspear, M., and Spehar, B. (2009). The foveal confluence in human visual cortex. J. Neurosci. 29, 9050–9058.
Schira, M. M., Wade, A. R., and Tyler, C. W. (2007). Two-dimensional mapping of the central and parafoveal visual field to human visual cortex. J. Neurophysiol. 97, 4284–4295.
Sigman, M., Cecchi, G. A., Gilbert, C. D., and Magnasco, M. O. (2001). On a common circle: natural scenes and Gestalt rules. Proc. Natl. Acad. Sci. U.S.A. 98, 1935–1940.
Spehar, B. (2000). Degraded illusory contour formation with non-uniform inducers in Kanizsa configurations: the role of contrast polarity. Vision Res. 40, 2653–2659.
Spehar, B., and Clifford, C. W. (2003). When does illusory contour formation depend on contrast polarity? Vision Res. 43, 1915–1919.
Swisher, J. D., Halko, M. A., Merabet, L. B., McMains, S. A., and Somers, D. C. (2007). Visual topography of human intraparietal sulcus. J. Neurosci. 27, 5326–5337.
Triantafyllou, C., Hoge, R. D., and Wald, L. L. (2006). Effect of spatial smoothing on physiological noise in high-resolution fMRI. Neuroimage 32, 551–557.
Triantafyllou, C., Polimeni, J. R., and Wald, L. L. (2011). Physiological noise and signal-to-noise ratio in fMRI with multi-channel array coils. Neuroimage 55, 597–606.
Tyler, C. W., Likova, L. T., Kontsevich, L. L., Schira, M. M., and Wade, A. R. (2005). Enhanced concepts of occipital retinotopy. Curr. Med. Imaging Rev. 1, 319–331.
Wertheimer, M. (1958). “Principles of perceptual organization,” in Reading in Perception, eds D. C. Beardslee and M. Wertheimer (Princeton, NJ: Van Nostrand-Reinhold), 1089–1107.
Westheimer, G (2007). The ON-OFF dichotomy in visual processing: from receptors to perception. Prog. Retin. Eye Res. 26, 636–648.
Wilkinson, F., James, T. W., Wilson, H. R., Gati, J. S., Menon, R. S., and Goodale, M. A. (2000). An fMRI study of the selective activation of human extrastriate form vision areas by radial and concentric gratings. Curr. Biol. 10, 1455–1458.
Wilson, H. R., Wilkinson, F., and Asaad, W. (1997). Concentric orientation summation in human form vision. Vision Res. 37, 2325–2330.
Winawer, J., Horiguchi, H., Sayres, R. A., Amano, K., and Wandell, B. (2010). Mapping hV4 and ventral occipital cortex: the venous eclipse. J. Vis. 10, 10.
Keywords: contour perception, contrast polarity reversals, fMRI
Citation: Schira MM and Spehar B (2011) Differential effect of contrast polarity reversals in closed squares and open L-junctions. Front. Psychology 2:47. doi: 10.3389/fpsyg.2011.00047
Received: 06 December 2010;
Accepted: 11 March 2011;
Published online: 25 March 2011.
Edited by:
Frans Verstraten, Universiteit Utrecht, NetherlandsReviewed by:
Serge O. Dumoulin, Utrecht University, NetherlandsGijs Plomp, University of Geneva, Switzerland
Xiaomin Yue, Harvard Medical School, USA
Copyright: © 2011 Schira and Spehar. This is an open-access article subject to an exclusive license agreement between the authors and Frontiers Media SA, which permits unrestricted use, distribution, and reproduction in any medium, provided the original authors and source are credited.
*Correspondence: Mark M. Schira, Neuroscience Research Australia, PO Box 1165, Randwick NSW 2031, Australia. e-mail:bXNjaGlyYUB1bnN3LmVkdS5hdQ==