


- 1 Department of Psychology and Neuroscience, Duke University, Durham, NC, USA
- 2 Center for Cognitive Neuroscience, Duke University, Durham, NC, USA
- 3 Center for Interdisciplinary Decision Sciences, Duke University, Durham, NC, USA
- 4 Department of Neurobiology, Duke University, Durham, NC, USA
- 5 Brain Imaging and Analysis Center, Duke University, Durham, NC, USA
Adolescents often make risky and impulsive decisions. Such behavior has led to the common assumption that a dysfunction in risk-related decision-making peaks during this age. Differences in how risk has been defined across studies, however, make it difficult to draw conclusions about developmental changes in risky decision-making. Here, we developed a non-symbolic economic decision-making task that can be used across a wide age span and that uses coefficient of variation (CV) in reward as an index of risk. We found that young children showed the strongest preference for risky compared to sure bet options of equal expected value, adolescents were intermediate in their risk preference, and young adults showed the strongest risk aversion. Furthermore, children’s preference for the risky option increased for larger CVs, while adolescents and young adults showed the opposite pattern, favoring the sure bet more often as CV increased. Finally, when faced with two gambles in a risk–return tradeoff, all three age groups exhibited a greater preference for the option with the lower risk and return as the disparity in risk between the two options increased. These findings demonstrate clear age-related differences in economic risk preferences that vary with choice set and risk. Importantly, adolescence appears to represent an intermediate decision-making phenotype along the transition from childhood to adulthood, rather than an age of heightened preference for economic risk.
Introduction
Adolescence is often considered an age of heightened risk taking for many real-world behaviors: consumption of alcohol, drug use, unprotected sex, and driving while distracted (see for reviews Arnett, 1992; Steinberg, 2008). While it is becoming clear that contextual factors contribute to risk-taking behavior, it is unclear how risk parameters interact with the developmental trajectory of risk-taking behavior. Increases in risky behaviors in adolescence may reflect a heightened tendency toward risk seeking, or may instead be indicative of some other emerging changes, like openness to greater opportunities, changes in emotional context, or increases in exploratory behavior, rather than risk-seeking behavior per se (Casey et al., 2010).
Experimental studies of risk preference have generally found that children and adolescents are less risk-averse than adults (Harbaugh et al., 2002; Levin and Hart, 2003; Levin et al., 2007a; Burnett et al., 2010; Rakow and Rahim, 2010; for review see Boyer, 2006), but contextual differences sometimes elicit different age-related patterns (Figner et al., 2009). For example, in choosing between a sure bet and a gamble of equal expected value (EV), young children tend to select risky options more often than adults (Harbaugh et al., 2002; Levin and Hart, 2003). In the Columbia Card Task, in which successive card flips increase the probability of encountering a hazard card and threaten cumulative winnings, adolescents choose more risky options compared to adults (Figner et al., 2009). Burnett et al. (2010) used a two-spinner task in which both the probability and the payoff for winning were manipulated. They found that adolescents showed more willingness to make risky choices – defined as preference for the spinner with greater variance, distinct from EV – compared to pre-adolescent children (9-years-old and older) and young adults.
Yet, heightened preference for risky options amongst adolescents has not been demonstrated consistently across studies. When the Columbia Card task is modified so that participants preselect a number of cards to flip, adolescents made similar choices to adults (Figner et al., 2009). In another study, van Leijenhorst et al. (2010) presented participants aged 8- to 26-years-old with choices between a 66% chance of winning one Euro and a 33% chance of winning either 2, 4, 6, or 8 Euros. Risk preference decreased with age in the 2 Euro condition and did not vary with age in the other three conditions. Thus different studies have revealed either a developmental increase in risk aversion or a U-shaped trend in risk aversion. It is unclear which task parameters may be responsible for these two different age-related trends.
In the current study, we characterize the development of risk preference by systematically and independently manipulating risk and EV. A key feature of our approach that differs from prior work on this topic is that we use a non-symbolic task that was designed to avoid symbolic math knowledge and complex rule learning, which are both stumbling blocks for young children. This differs from most prior studies of adolescent choice, which typically use economic tasks (Reyna and Ellis, 1994; van Leijenhorst et al., 2006; Crone et al., 2008; Burnett et al., 2010; van Leijenhorst et al., 2010). Yet, even across laboratory studies, there is a lack of consistency in definitions of risk: a choice may be risky if it is suboptimal for maximizing gains in the long run, or it may be risky if it has greater variability in outcomes compared to alternatives. Thus we operationally define risk as the coefficient of variation (CV) in the potential outcomes of risky choice, while keeping CV and EV orthogonal over the course of the experiment. The CV is a dimensionless representation of risk per unit of return, affording comparisons across tasks that use different units. CV has been shown to outperform more traditional economic measures of risk (e.g., variance) in explaining choice behavior in a range of species (Weber et al., 2004). Finally, because of inconsistencies in the literature as to whether risk preference shows a decreasing trend over development or an inverted U-shaped trend (Weller et al., in press), we tested a wide age span with three age groups: young children (6- to 8-years-old), adolescents (15- to 16-years-old), and young adults (18- to 32-years-old).
Our task consisted of three different decision-making trial types, which are illustrated in Figure 1. Risk–Safe trials required a decision between a gamble and a sure bet where the two options had equal EV. Risk–Risk trials required a choice between two gambles. Finally, Safe–Safe trials offered a choice between two certain outcomes. Our results favor the idea that, at least for economic decisions, adolescents are not especially risk taking as a group, but express a decision-making phenotype intermediate in character between children’s preference for risk and young adults’ risk aversion.
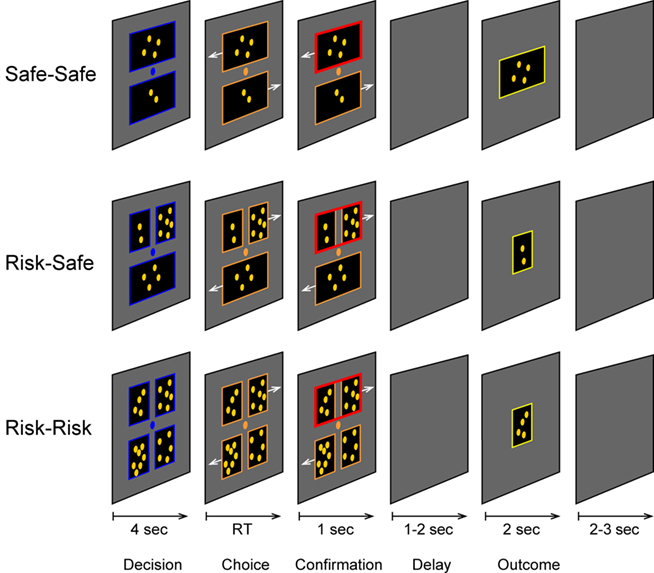
Figure 1. Experimental design. RT, response time. Trial types were psuedorandomized. Each trial consisted of a decision (blue frame), choice (salmon frame), confirmation (red frame), delay (no frame), and outcome (yellow frame) period. Safe–Safe trials offered the decision between two safe bet values, Risk–Safe trials offered the decision between a gamble and a safe bet, while Risk–Risk trials offered the decision between two gambles of different expected value and coefficient of variation.
Materials and Methods
Participants
Twenty-one children (10 female; M = 7.1 years) and 13 adolescents (6 female; M = 14.9 years) were recruited from the Raleigh–Durham–Chapel Hill area of North Carolina. Thirteen young adults (nine female; M = 21.6 years) were recruited from Duke University and the surrounding community. Duke IRB-approved informed consent was collected from adult participants and parents/legal guardians of minor participants, and written assent was obtained from minor participants.
Design and Stimuli
Participants were informed that they would be playing a game in which the choices they made would yield different numbers of coins, and that the coins could be traded for a toy prize (children) or a gift card value up to $10 (adolescents and adults) at the end of the session. Figure 1 illustrates the three trial types: Risk–Safe, Risk–Risk, and Safe–Safe. Risk–Safe trials consisted of a choice between a safe option and a gamble option that consisted of two possible outcomes with equal probability. We define Risk level here as the CV which is the SD/EV (Weber et al., 2004). The EV of the gamble option was always equivalent to the certain option (either four or eight coins), while the CV for the gamble option was varied (0.35, 0.71, 1.06, or 1.41) across the two levels of EV creating eight trial types. Risk–Risk trials consisted of a choice between two gamble options of differing EV and CV, but always such that the gamble option with the higher EV also had the higher CV. One gamble option with an EV of five coins was presented at two levels of CV (0.28, 0.57), while the other gamble option had an EV of six coins at three levels of CV (0.94, 1.18, and 1.41), creating six trial types. CV and EV were confounded on Risk–Risk trials to examine the risk–return tradeoff, in which a larger expected payout generally requires assuming a higher level of risk. This condition was only slightly more complex than deciding between a sure bet and a risky option because it added a second risk dimension that was contrasted with EV, but did not manipulate probability. To our knowledge the risk–return tradeoff has not been examined developmentally. Crossing two levels of the lower risk EV 5 option with three levels of the higher risk EV 6 option provided a multileveled measurement of the risk–return tradeoff, while controlling for EV. Safe–Safe trials consisted simply of a choice between two certain outcomes, the values for which were derived from the values used in Risk–Safe trials. Each participant was given 16 Safe–Safe, 48 Risk–Safe, and 36 Risk–Risk trials.
As shown in Figure 1, the two choice stimuli were presented above and below a central fixation point. Choices remained visible for 4 s followed by a recording of a female voice that said “pick one” and right and left arrows which indicated which hand should be used to make a given response. Choices were made with a button press using the left or right hand. A second button press with the right thumb was required to confirm the choice, thus minimizing impulsive responses. After the choice was confirmed, the frame of the selected alternative turned red and was displayed for one second, followed by a variable 1–2 s blank-screen delay period. The outcome was then presented for 2-s accompanied by a playback of a female voice saying “you get” and, if coins were received, a short (0.15–1.2 s) playback of coin sounds, proportional in duration to the number of coins won. Trial types were pseudorandomly distributed and presented in four blocks. Gamble options for trial types were counterbalanced for location and response hand. Each block concluded with an image of toy prizes and the cumulative coin winnings.
The task was designed as a pilot study with timing that matched a future fMRI study, which resulted in making the analysis of response time measurements unreliable. In particular, choice options were displayed for 4 s before the choice-selection button presses could be initiated.
Results
Safe–Safe Trials
All three age groups were highly accurate at choosing the larger value on Safe–Safe trials, with accuracy equal or greater than 98%, thus indicating that even the children understood the task and that all three age groups were highly motivated to maximize reward. There were no differences between age groups (p > 0.42).
Risk–Safe Trials
We found significant differences in risk preference as a function of age on Risk–Safe trials, F(2,44) = 12.69, p < 0.001, η2 = 0.37, indicating that children tended to gamble more often (70%) than both adolescents [56%; t(32) = 1.83, p = 0.077] and young adults [31%; t(32) = 4.74, p < 0.001], and adolescents gambled more often than young adults [t(24) = 3.32, p < 0.01]. A group by risk level interaction was also found, F(6,132) = 9.21, p < 0.001, η2 = 0.30, due to age-related patterns of risky choices as a function of risk level. As shown in Figure 2, children’s preference for the risky option increased as risk level (or CV) increased whereas adolescents and young adults showed the opposite pattern. These patterns were confirmed by significant linear trends of risk level (positive for children, negative for adolescents and young adults) for each group independently (all p < 0.05). Additionally, a significant quadratic trend was found for children, F(1,20) = 6.09, p < 0.05, η2 = 0.23, showing that although risk preference was correlated with risk level, risk preference declined slightly at the highest level of risk. Following up on the group by risk level interaction, groups were also compared pair-wise at each risk level. No between groups differences were found at the lowest level of risk (all p > 0.19). Children’s risk preference was significantly greater than that of young adults and adolescents for the two highest levels of risk, and significantly greater than young adults at Med-Low risk. For Adolescents risk preference was greater than that of young adults for the Med-Low and Med-High levels of risk, and marginally greater than young adults at the highest level of risk (p = 0.052).
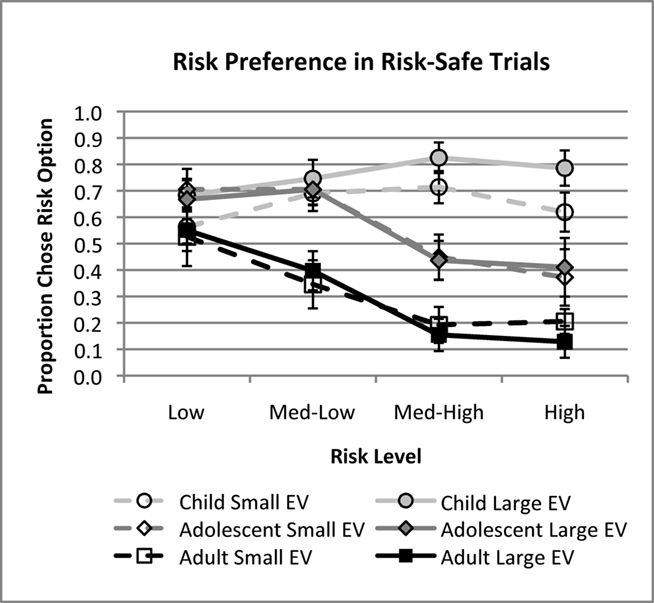
Figure 2. Risk preferences vary with age, risk level, and expected value (EV). Children show an increase in the proportion of gambles selected as risk level increases, while adults and adolescents tend to show a decrease in the proportion of gambles selected. Children also show greater preference for gambles when the EV was large than when it was small. Note: EV of the sure bet option was always equal to the EV of the gamble option.
Risk preference in children was also influenced by EV independent of risk level, however this was not true for the adolescents or young adults as indicated in a significant interaction between EV and age group, F(2,44) = 3.65, p < 0.05, η2 = 0.14. Children tended to select the gamble option more often for higher EV gambles (76%) than for lower EV gambles (65%), controlling for risk level, F(1,20) = 11.20, p < 0.01, η2 = 0.36. There were no effects of Block on risk preference or interactions between Block and Group (both p > 0.19), suggesting that risk preference did not change over the course of the test session.
Risk–Risk Trials
We define risk preference for Risk–Risk trials as the proportion of trials in which the option with the larger risk and return was selected. We first conducted an RM-ANOVA using two levels of risk for the EV 5 option, three levels of risk for the EV 6 option, and age group as a between-subjects factor. We found a significant main effect of age group on risk preference, F(2,44) = 9.97, p < 0.001, η2 = 0.31. As in the Risk–Safe Trials, children showed a higher risk preference (77%) than both adolescents [51%; t(32) = 3.42, p < 0.01] and young adults [47%; t(32) = 3.95, p < 0.001]. Adolescents and young adults did not differ from each other in their risk preference (p > 0.65). Main effects were also found for the risk levels EV 5 and EV 6: as risk level of EV 5 increased, risk preference increased (Figure 3A), F(1,44) = 20.834, p < 0.001, η2 = 0.32, but as the risk level of EV 6 increased, risk preference decreased (Figure 3B), F(2,88) = 18.33, p < 0.001, η2 = 0.29. Although these patterns in risk–return tradeoff were observed in the means for each age group, significant interactions between Group and EV 5 risk levels, as well as Group and EV 6 risk levels, were also found (both p < 0.05), suggesting that these effects were largest in the adult group.
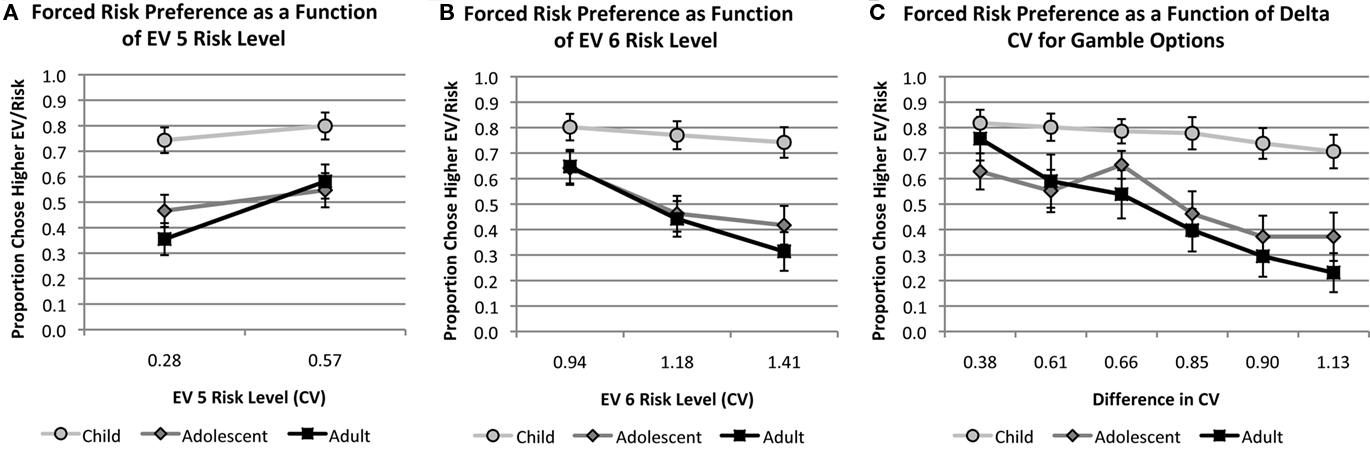
Figure 3. Risk preference varied as a function of the difference in CV in Risk–Risk trials. EV, expected value; CV, coefficient of variation. (A) Preference for the higher risk–return option increased with the CV of the EV 5 option, but (B) declined as EV 6 risk level increased. This pattern suggests that (C) preference for the higher risk–return option decreased linearly as the difference in risk level between the two risk–return options grew smaller.
This pattern of main effects for EV 5 and EV 6 is consistent with a linear relation between risk preference and the difference between gamble option risk levels. Specifically, as the difference between the CVs of gamble options decreased, participants were more likely to choose the higher risk–return option. This was tested by regressing risk preference in Risk–Risk trials on the difference between the coefficients of variation (delta CV) for each group separately using mixed model regression. Significant regression coefficients were found for delta CV in the adult choices (β = −0.74), t(64) = −5.31, p < 0.001, and in the adolescent choices (β = −0.41), t(64) = −3.28, p < 0.01, confirming that as the difference in CV between gamble options decreased, preference for the larger risk–return option increased (Figure 3C). Children showed a similar trend, although the coefficient for delta CV (β = −0.15) was only marginally significant (p = 0.09).
Relationship between Risk Preference on Risk–Safe and Risk–Risk Trials
To assess the stability of risk preferences within individuals we examined the relationship between risk preference on Risk–Safe trials and Risk–Risk trials. Children’s risk preferences were highly correlated across the two conditions (r = 0.88, p < 0.001), and the correlation between adult’s risk preferences was marginally significant (Figure 4; r = 0.54, p = 0.056). The correlation between adolescent’s preferences in the Risk–Safe and Risk–Risk conditions did not reach significance but showed the same positive trend (r = 0.41, p > 0.16).
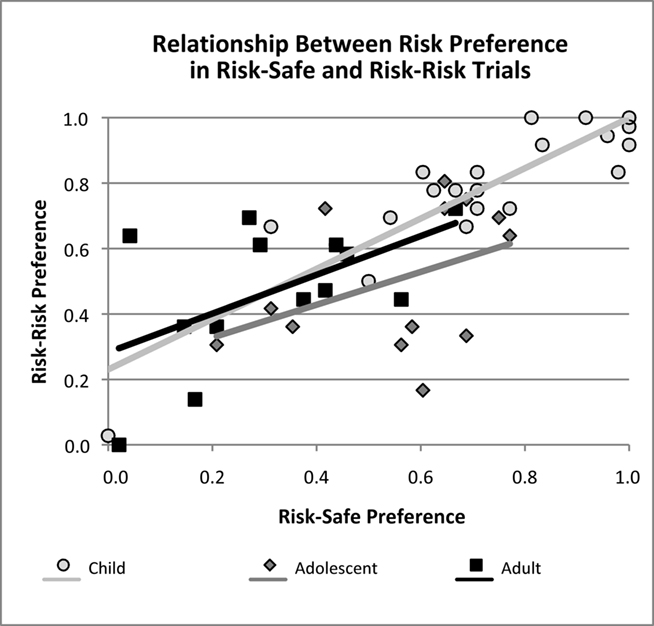
Figure 4. Age-related risk preferences are correlated across decision contexts. Preference for the higher risk/higher EV option in Risk–Risk trials is correlated with the probability of selecting the gamble option in Risk–Safe trials. These correlations were significant for children and adults, and marginally significant for adolescents.
Discussion
Our results demonstrate clear developmental changes in decision-making, with aversion to risk strengthening from childhood to adulthood. Children showed a heightened risk preference both when the choice was between a risky option and a sure bet and when the choice was between two gambles. Children also showed a greater tendency to select the risky option at higher levels of EV. When a gamble was offered in conjunction with a sure bet adolescents showed risk preferences intermediate between children and young adults. Adolescents and young adults did not differ in their preferences between two gamble options that varied in risk level and EV. These findings are consistent with previous reports that risk preference declines between childhood and adulthood (Harbaugh et al., 2002; Levin et al., 2007a,b; Weller et al., in press), and partially consistent with those of Burnett et al. (2010) in which both children and adolescents displayed a greater preference for risky options with greater variance of outcomes than young adults. Our findings are also partially consistent with Levin et al. (2007b) who found that children’s risk preference increased with EV. However, we did not find a U-shaped pattern in this developmental progression.
Our second and more novel finding was that when faced with a gamble and a sure bet, risk level affected decision-making differently in children compared to both adolescents and young adults. Adolescents and young adults showed a strong tendency to avoid the risky option as risk level increased. In contrast, children showed increasing preference for the risky option as risk level increased. It is also important to note that in our study absolute levels of risk preference only varied as a function of age at the highest levels of risk. This finding stands in contrast to van Leijenhorst et al. (2010) in which age-related declines in risk preference were apparent only at lower levels of risk, while at higher levels of risk individuals of all ages showed similar preferences for risk. Task differences between the two studies may be responsible for this discrepancy. Specifically, the EV of the high risk options was always greater than the low risk option in the van Leijenhorst et al. (2010) study, whereas in our study EV was equated across Risky–Safe options.
When selecting between two gamble options, all three age groups displayed a similar pattern of behavior. We found a linear relationship between the change in CV and choice behavior; participants tended to select the higher risk–return option as the difference in risk level between the two options decreased. Thus given a pair of gamble options with constant but unequal EV, choice behavior favored the lower risk–return option when risk levels were disparate, but the higher risk and return as risk levels grew similar. Although children generally selected the higher risk–return option more often than older participants, variations in risk level effected all three age groups similarly suggesting that at least some of the mechanisms for processing the economic balance between risk and return are adult-like by the age of six or seven.
Developing a task that can be used across a wide age range is always a challenging endeavor. Our task was designed to avoid complex contingencies and symbolically mediated mathematics that might contribute to measurement error in younger children. The stimuli and task design were identical across age ranges. However, to motivate participants across a wide age span we deemed it necessary to provide young adults and adolescents with gift cards and children with toys. While it is conceivable that this difference in reward structure led to differences in decision-making, we believe this unlikely. First, each age group showed clear changes in their patterns of risk taking as a function of risk level, suggesting that each increment in risk level was meaningful with respect to gains and therefore that gains were, as a whole, valuable. Second, the general pattern of decreasing risk preference with age is consistent with other studies that have used similar, dissimilar, or no economic incentives between groups (Harbaugh, et al., 2002; Levin and Hart, 2003; Rakow and Rahim, 2010).
Children’s preference for the risky option, across choice sets, could potentially be explained by either a myopic or a biased focus on the more numerous coin set in gamble options. If children are driven myopically to choose the option with the single highest value then they should in the extreme case choose the risky option 100% of the time, and at a minimum should increase risky option selection monotonically with CV. Children showed neither of these patterns. As shown in Figure 2, their choices in Risk–Safe trials varied as a function of CV at lower and intermediate levels of risk while reaching a plateau at the higher levels of risk. In Risk–Risk trials, children’s behavior showed a similar pattern to adolescents and adults, which was that risk preference decreased with increasing CV in the EV 6 option, further indicating that children do not uniformly select the option with the greatest possible winnings.
However, our data do support an age-related shift in the bias with which risk outcomes are weighed. Given the choices that participants made, gamble options appear to have had greater value than sure bets for children, whereas the sure bets had greater value for adults. Because children as young as 5-years-old have been shown to be capable of computing EV (Schlottmann, 2001; Schlottmann and Tring, 2005), these age-related differences in the value of gamble options is likely to be subjective, as opposed to computational errors with objective values. Individual variability in the value of gamble options has been explained, in prospect theory for example, by individual differences in the subjective weight that is applied to the combination of objective probabilities and values (Kahneman and Tversky, 1979).
One possibility is that children weigh the winning probability-by-outcome value in a gamble more heavily than the losing probability-by-outcome value, while adults do the opposite. Thus, for children, as the value of the larger outcome increases, the subjective value of the risky option rises above that of the sure bet option, increasing the probability of its selection. In adults, as value of the smaller outcome decreases, the subjective value of the risky option dips below that of the sure bet option. A further prediction of this hypothesis is that children and adults should differ more dramatically in their risk preferences at high levels of risk where both the high and low payoff are more dramatically different from each other and from the sure bet or EV, and less so at lower levels of risk where the high and low payoffs are more similar. Our data support this hypothesis in that group differences in behavior were found at the higher levels of risk, but not at the lowest level of risk where all groups were roughly indifferent to the two options.
Notably, some non-human primates also show increasing preference for a risky option over a sure bet as reward CV increases (McCoy and Platt, 2005). This apparent risk-seeking behavior has been linked to saliency of the jackpot (Hayden and Platt, 2007) and preference for variability itself (Hayden et al., 2008). Similar processes may contribute to increasing preference for the risky option with increasing reward CV in children prior to the emergence of strong symbolic math skills.
Conclusion
We developed a child-friendly economic decision-making task that minimized the need for memory or symbolic math skills. Despite the relatively small sample size, similarities and robust differences in risk-taking behavior were found across age groups, demonstrating the powerful effect of CV on choices in the presence of risk. Children showed stronger preferences for a risky gamble than either adolescents or young adults, and this age difference in risk preference was greatest at the highest risk levels. Our task revealed no evidence for an inverted U-shaped function in risk preference across age; instead adolescents were intermediate between children and young adults. Our findings endorse a view of development in which economic decision-making processes emerge gradually from childhood to adulthood, in direct contrast with the conventional notion of heightened risk-seeking in adolescence. Resolving the apparent discrepancies between laboratory measures of economic decision-making under risk – such as in our non-symbolic token economy task – and real-world risk taking will require further study.
Conflict of Interest Statement
The authors declare that the research was conducted in the absence of any commercial or financial relationships that could be construed as a potential conflict of interest.
Acknowledgments
This research was funded by an Incubator Award from the Duke Institute for Brain Sciences (Scott A. Huettel and Michael L. Platt), NIMH RC1-088680 (Scott A. Huettel and Elizabeth M. Brannon), and pre-doctoral NRSA F31-027266 from NIDA to David J. Paulsen.
References
Arnett, J. (1992). Reckless behavior in adolescence: a developmental perspective. Dev. Rev. 12, 339–373.
Boyer, T. (2006). The development of risk-taking: a multi-perspective review. Dev. Rev. 26, 291–345.
Burnett, S., Bault, N., Coricelli, G., and Blakemore, S.-J. (2010). Adolescents’ heightened risk-seeking in a probabilistic gambling task. Cogn. Dev. 1–14.
Casey, B. J., Duhoux, S., and Cohen, M. M. (2010). Adolescence: what do transmission, transition, and translation have to do with it? Neuron 67, 749–760.
Crone, E., Bullens, L., Van der Plas, E., Kijkuit, E., and Zelazo, P. (2008). Developmental changes and individual differences in risk and perspective taking in adolescence. Dev. Psychopathol. 20, 1213–1229.
Figner, B., Mackinlay, R., Wilkening, F., and Weber, E. (2009). Affective and deliberative processes in risky choice: age differences in risk taking in the Columbia card task. J. Exp. Psychol. Learn. Mem. Cogn. 35, 709–730.
Harbaugh, W., Krause, K., and Vesterlund, L. (2002). Risk attitudes of children and adults: choices over small and large probability gains and losses. Exp. Econ. 5, 53–84.
Hayden, B., Heilbronner, S., Nair, A., and Platt, M. (2008). Cognitive influences on risk-seeking by rhesus macaques. Judgm. Decis. Mak. 3, 389.
Hayden, B. Y., and Platt, M. L. (2007). Temporal discounting predicts risk sensitivity in rhesus macaques. Curr. Biol. 17, 49–53.
Kahneman, D., and Tversky, A. (1979). Prospect theory: an analysis of decision under risk. Econometrica 47, 263–291.
Levin, I., and Hart, S. (2003). Risk preferences in young children: early evidence of individual differences in reaction to potential gains and losses. J. Behav. Decis. Mak. 16, 397–413.
Levin, I., Hart, S., Weller, J., and Harshman, L. (2007a). Stability of choices in a risky decision-making task: a 3-year longitudinal study with children and adults. J. Behav. Decis. Mak. 20, 241–252.
Levin, I., Weller, J., Pederson, A., and Harshman, L. (2007b). Age-related differences in adaptive decision making: sensitivity to expected value in risky choice. Judgem. Decis. Mak. 2, 225–233.
McCoy, A., and Platt, M. (2005). Risk-sensitive neurons in macaque posterior cingulate cortex. Nat. Neurosci. 8, 1220–1227.
Rakow, T., and Rahim, S. B. (2010). Developmental insights into experience-based decision making. J. Behav. Decis. Mak. 23, 69–82.
Reyna, V., and Ellis, S. (1994). Fuzzy-trace theory and framing effects in children’s risky decision making. Psychol. Sci. 5, 275–279.
Schlottmann, A. (2001). Children’s Probability Intuitions: understanding the expected value of complex gambles. Child Dev. 72, 103–122.
Schlottmann, A., and Tring, J. (2005). How children reason about gains and losses: framing effects in judgement and choice. Swiss J. Psychol. 64, 153–171.
Steinberg, L. (2008). A social neuroscience perspective on adolescent risk-taking. Dev. Rev. 28, 78–106.
van Leijenhorst, L., Crone, E., and Bunge, S. (2006). Neural correlates of developmental differences in risk estimation and feedback processing. Neuropsychologia 44, 2158–2170.
van Leijenhorst, L., Moor, B., Op de Macks, Z., Rombouts, S., Westenberg, P., and Crone, E. (2010). Adolescent risky decision-making: neurocognitive development of reward and control regions. Neuroimage 51, 345–355.
Keywords: risk, decision-making, gambling, adolescence, risk taking, adolescence
Citation: Paulsen DJ, Platt ML, Huettel SA and Brannon EM (2011) Decision-making under risk in children, adolescents, and young adults. Front. Psychology 2:72. doi: 10.3389/fpsyg.2011.00072
Received: 04 January 2011; Accepted: 05 April 2011;
Published online: 18 April 2011.
Edited by:
Steven E. Mock, University of Waterloo, CanadaCopyright: © 2011 Paulsen, Platt, Huettel and Brannon. This is an open-access article subject to a non-exclusive license between the authors and Frontiers Media SA, which permits use, distribution and reproduction in other forums, provided the original authors and source are credited and other Frontiers conditions are complied with.
*Correspondence: David J. Paulsen, Center for Cognitive Neuroscience, Levine Science Research Center Building, Duke University, Room 204, Durham, NC 27708, USA. e-mail:ZGF2aWQucGF1bHNlbkBkdWtlLmVkdQ==