

- Laboratory for Adaptive Intelligence, RIKEN Brain Science Institute, Saitama, Japan
To survive, animals must be able to react appropriately (in temporal and behavioral terms) when facing a threat. One of the essential parameters considered by the defensive system is the distance of the threat, the “defensive distance.” In this study, we investigate the visual depth cues that could be considered as an alarm cue for the activation of the defensive system. For this purpose, we performed an active-escape pain task in a virtual three-dimensional environment. In two experiments, we manipulated the nature and consistency of different depth cues: vergence, linear perspective, and angular size. By measuring skin conductance responses, we characterized the situations that activated the defensive system. We show that the angular size of the predator was sufficient information to trigger responses from the defensive system, but we also demonstrate that vergence, which can delay the emotional response in inconsistent situations, is also a highly reliable cue for the activation of the defensive system.
Introduction
To survive in the wild, animals must be able to detect approaching danger and to react accordingly in a timely way. Blanchard and Blanchard (2008) described the defensive system as a group of adaptive responses to a threat stimulus or situation, which is not yet comprehensively understood, but which includes inter alia avoidance, flight, freezing, or defensive attack. Fanselow (1994) defined three modes of this defensive system based on a continuum of contact imminence with a predator: preencounter, postencounter, and circa-strike modes. He defined the first as the mode that is activated when the subject enters an area in which there is a potential threat; the second mode is activated when an actual threat has been detected; and the last mode, circa-strike, is activated when contact with the danger is imminent or inevitable. Each mode of the system elicits some specific and adaptive behaviors, from protective behaviors to defensive attacks.
Mobbs et al. (2007, 2009) and Low et al. (2008) have shown that when humans are close to danger, their brain activity is modified. Mobbs’ studies have identified a shift from the ventromedial prefrontal cortex to the periaqueductal gray, and Low observed an increase in the late positive event-related potentials in the central parietal area. These modifications in brain activity are accompanied by an increase in skin conductance (SC), which means that the event triggers an emotion, and could correspond to a switch to the circa-strike mode of the defensive system. The task of Mobbs et al. is video game, in which failure is punished by an aversive stimulus (an electric shock) that motivates the subjects and thus generates emotions. The subject must control the prey’s movements in a two-dimensional (2-D) maze, seen from above from a third-person perspective, to allow the prey to escape from a predator chasing it. Thus, the task is a “Pacman”-like game, and one can question the relevance, in terms of the involvement in the defensive system mechanisms, of a scene perceived from a third-person perspective. We believe that this type of view does not make the situation ecologically valid. Although Low et al. (2008) used a first-person view, presenting looming images, they still did not fulfill the conditions for ecologically valid situation in our opinion, because they worked with a 2-D display.
The adaptive defensive behavior when facing a threat depends on the defensive distance, i.e., the distance between the prey and the predator (Fanselow, 1994; Blanchard and Blanchard, 2008). In a natural environment, this defensive distance will be an absolute distance, i.e., the depth between the prey and the predator. So depth perception might be involved in the mechanisms of the defensive system. Billington et al. (2011) has shown that the superior colliculus is specifically activated when subjects perceive an approaching (looming) object. The superior colliculus is known to be involved in eye movements, in particular in vergence movements (Guitton, 1999; Chaturvedi and Van Gisbergen, 2000). Hypothetically, therefore, depth perception acting through vergence movement signals should trigger the activation of defensive behaviors. This hypothesis of the involvement of extra-retinal signals from vergence in the defensive system activation is in contradiction to the gibsonian theory of visual perception: the ecological approach. Indeed Gibson claims that invariants properties of the optic array is sufficient to specify all the structures and events in the environment directly, which means without internal representation or inferential process (Bruce and Green, 1985).
To test our hypothesis and to determine the depth cue(s) that is(are) the most strongly involved in these mechanisms when a human encounters an approaching threat, we performed a series of experiments in which the nature and the presence of the depth cues were manipulated. We used virtual reality devices to create a stimulus that could be perceived in depth and from a first-person view (which is, according to our definition, an ecologically valid situation), and varied the visual conditions to isolate the different depth cues.
Experimental Method
The available depths cues for each set of conditions in the two experiments are shown in Table 1. In experiment 1, three conditions were tested (see Figures 1A,B): the Full Visual Condition or F condition, where the vergence (driven by absolute disparity) and linear perspectives are both present; the Vergence Only Condition or VO condition, in which the linear perspective cue is suppressed; and the Linear Perspective Only Condition or PO condition, in which the vergence distance is constant (and is the screen distance). In experiment 2, the VO condition trials were mixed with conflict condition trials. In the conflict condition, designated the Expansion Condition or E condition, the distance indicated by the angular size expansion of the predator and the distance indicated by the eye vergence are contradictory, signifying an approaching predator and a static predator, respectively (see Figure 1C). In experiment 2, we designated the VO condition the Non-expansion Condition or NE condition, by analogy with the E condition (see Table 1). In both experiments, the subject’s task was to escape from an approaching predator by pressing keys on the keyboard. When they failed, i.e., when the predator caught them, they received an aversive stimulus as punishment.
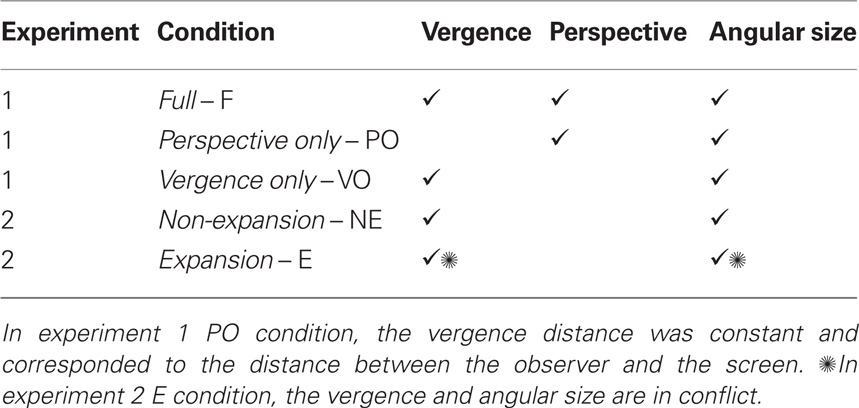
Table 1. Experimental conditions and available depths cues.
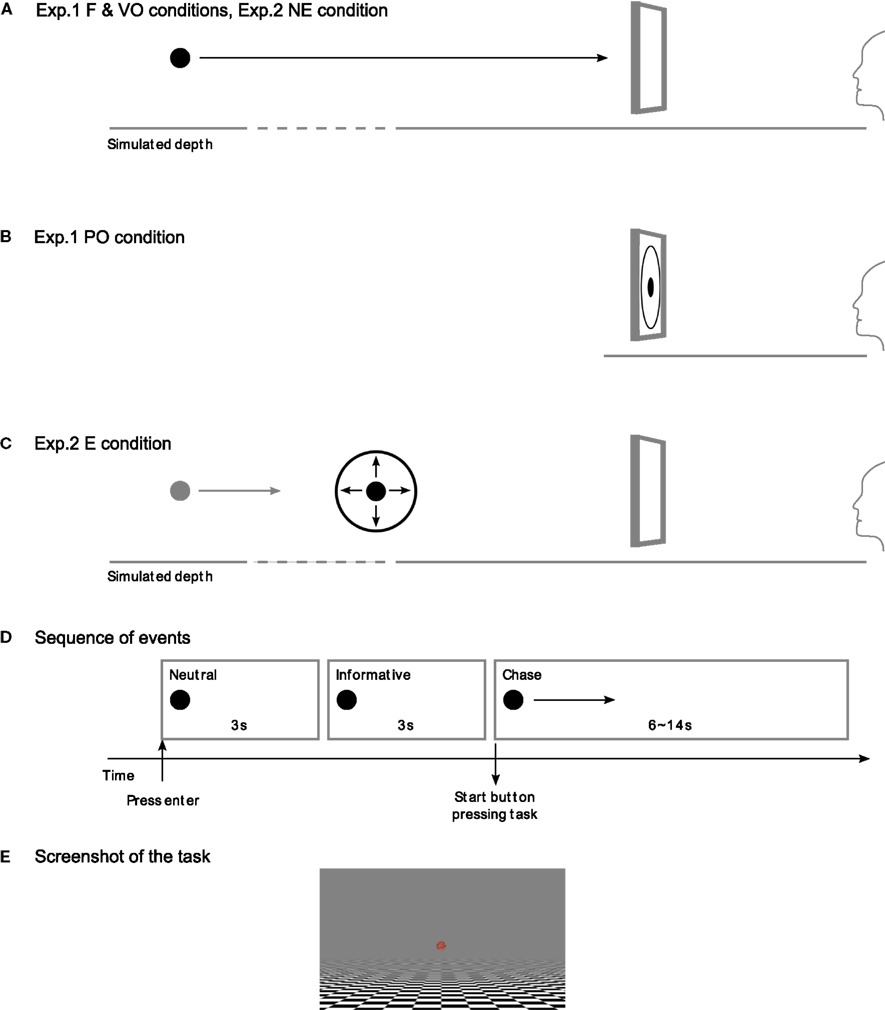
Figure 1. Schematic representation of the experimental conditions and sequence of events in the trial. In the F and VO conditions of experiment 1 and the NE condition of experiment 2, the predator appeared behind the screen, i.e., at a simulated depth (A). In the PO condition of experiment 1, the predator appeared constantly on the screen plane (B). In the E condition of experiment 2, the predator, which appeared in depth, stopped moving and expanded to simulate the same progress as in the NE condition (C). The sequence of events during the trial was started by the subject “pressing enter,” and was composed of a 3-s neutral phase followed by a 3-s informative phase, after which the chase commenced, lasting for 6–14 s, depending on the trial (D). A screenshot of the display during the task, with perspective cue (E).
The prey, whose speed was determined by the subject’s skill in the button-pressing task, escaped from the predator by moving backward (i.e., keeping its gaze on the predator). The subjects perceived the scene from the prey’s point of view. The predator, 3-D sphere, approached the prey in a line, at a constant speed, from a (simulated) distance of about 100 m from the prey until it reaches the prey (i.e., 0 m; see Figure 1E). Skin conductance responses (SCRs) were recorded throughout the experiments, and we analyzed the responses triggered by the anticipation of the punishment (and not those occurring after it). These anticipated SCRs were markers of the occurrence of an emotional event, and this increase in SC activity when the contact with the predator was imminent may be considered, as in Mobbs et al. (2007, 2009) and Low et al. (2008), as the switch to the circa-strike mode of the defensive system. By comparing the occurrence of SCRs in the F condition and those when the cues were isolated (VO and PO conditions) or in conflict (E condition), we determined the relative importance of the depth cues studied in the activation of the defensive system. Therefore, we investigated the visual information contained in an approaching danger that evokes an emotional response.
Visual Stimuli
The task of the subjects was to alternatively press the left arrow and right arrow keys of the keyboard to increase their speed and escape from the predator and from the aversive stimulus. The virtual environment we used respected the natural scale of the world, i.e., 1 m in the virtual world corresponded to 1 m in the real world. In experiments 1 and 2, the predator was a 3-D textured sphere of 0.5 m diameter. This 3-D object was initially positioned at one distance, chosen randomly, between 120 and 100 m from the prey (or between 90 and 70 m for two subjects who systematically escaped during a practice session of 10 trials). Therefore, the angular sizes (from the subject’s point of view) of the predator object varied from [14.32′, 17.18′] (or [24.5′, 19.09′] for the 90 to 70 m initial distances) to 53°. The predator approached the subjects along a line at their eye level, at a constant speed of 1.4 m/frame (frequency: 60 Hz). The prey was not represented because the subjects perceived the scene from the prey’s point of view. When the subjects did not press any keys, their point of view moved backward at a constant speed of 0.6 m/frame. When the subjects performed the key pressing task, they increased their speed up to a maximum speed of 1.38 m/frame (i.e., the predator’s speed minus 0.02 m/frame). Their speed depended on the speed with which the subjects performed the task – each correct alternative key press (left arrow – right arrow) increased the speed according to the function newspeed = speed + (speed × 0.5). The surrounding environment was gray, and the ground was textured (except in experiment 2 and in the VO condition of experiment 1, where the ground was not represented), with a black and white chessboard texture. The interocular distance was set at 6.5 cm, except for the PO condition, in which vergence was constant and the 3-D effect was turned off. Experiments 1 and 2 were developed entirely with Virtools™, Dassault Systems, Paris, France. The subjects’ heads were maintained in a constant position 53 cm from the screen with a chin rest.
The stimuli were displayed on a large screen (Acer 120 Hz LCD, 60 cm, 1980 × 1080) with a high frequency, which allowed us to display a stereoscopic scene – the frequency was divided by two in stereoscopic mode (i.e., 60 Hz) – in association with NVidia 3-D Vision shutter glasses.
Skin conductance was recorded with the ProComp Infinity (Thought Technology Ltd, Montreal, Canada). The electrodes of the system were positioned on the index finger and the middle finger of the unused hand.
Aversive Stimulus
The aversive stimulus in all experiments was a 2-ms electric shock of constant current, with a voltage of 200 V (if 200 V produced a substandard result because of the skin characteristics of the subjects, we set the stimulator to 300 V). The intensity of the current was set by the subject before the experiments. The values for these intensities were never revealed to the subjects. The experimenter asked the subjects to choose the intensity that was aversive, i.e., that they wished to avoid, but below their pain threshold. The subjects received the first electric shock (for all subjects, it started at 5 mA, which they ignored), and depending on their sensitivity, they were free to ask the experimenter to increase or reduce its intensity until it reached the intensity that complied with the instructions, but was below the maximal intensity of 20 mA.
The electric shocks were induced with a DS7A Stimulator for clinical use, produced by Digitimer Ltd, Hertfordshire, England. The bar electrode was positioned on the dorsal surface of the unused hand.
Participants
In all experiments, all the volunteers (aged from 25 to 50 years old) were naive and had normal or corrected-to-normal vision. All the participants also had a disparity threshold of at least 50 arc s at 40 cm (Randot stereotest, Stereo Optical Co., Chicago, IL, USA), and none of them suffered from diplopia during the experiments. Five volunteers (four women) took part in experiment 1, and four volunteers (one woman) took part in experiment 2 (one of whom took part in experiment 1). The study was approved by the RIKEN Ethical Committee (Wako #3 20-4(4)), and all subjects gave their informed consent to their participation.
Protocol
All the experiments took place in a room with no windows, in which the walls and ceiling were black. No light other than the light from the screen could be seen by the subjects during the experiments. The subjects set the intensity of the electric shock after all the electrodes had been installed (to record SC and deliver the electric shocks) and before the beginning of the experiment (in whatever experiment the subjects were participating).
They then performed two short tests (described in the Data Analysis section). Briefly, the first consisted of the presentation of visual stimuli associated with the aversive stimulus; in the second test, the stimuli were or were not associated with the aversive stimulus, and this was combined with a new type of visual stimulus. In these tests, the subjects had no task to complete, but simply looked at the screen. The task in the main experiment was then explained, and the subjects began with a practice session of 10 trials, the results of which were not included in the analysis.
Experiment 1 consisted of three conditions, and each condition contained 30 trials, one quarter of which were “fake.” Fake trials were defined as trials in which the subjects do not have to do the task; it is an automatic run trial. The subjects were informed that they would not receive an electric shock after a “fake” trial. The length of each trial varied between five values ranging from 6 to 14 s (in 2 s increments). The initial distance of the predator from the prey varied, with values chosen randomly from 120 to 100 m (or 90 to 70 m for two subjects for whom the initial 120 to 100 m distances were too easy). The variable lengths and initial distances were distributed randomly over the trials. Experiment 2 consisted of one session of 60 trials, in which two conditions (30 trials per condition) were randomly mixed and there were no “fake” trials.
Each trial started when the subjects pressed the “enter” key. After a neutral phase of 3 s, during which the predator appeared but remained still, information about the nature of the forthcoming trial was displayed (fake or real trial). Then after a delay of 3 s, the chase started, i.e., the predator started to move (see Figure 1D). If it was a “fake” trial (only in experiment 1), the subject was told to simply watch the screen, whereas if it was a “real” trial, the subject had to do the task. The trial ended either when the time was over or when the subject had been caught – a message indicated whether the subject had escaped or had been caught. In the latter case, an electric shock was triggered with a probability of 70%. Another trial started as soon as the subject pressed the “enter” key. The subjects were free to choose when they took breaks, simply by delaying pressing the key to start the trial. In experiment 1, the subjects also had a break in between each condition. The order of the conditions was counterbalanced among the subjects.
Data Analysis
All the subjects began their participation with two short tests to determine their individual SC dynamic, because we needed to know their SCR latency to analyze the results of the main experiments. These tests consisted of a short phase in which a small red square, displayed for 1 s, was not associated with the aversive stimulus, the electric shock (this phase was repeated five times), followed by a phase in which the red square was associated with the aversive stimulus. The delay between the stimulus and the aversive stimulus was chosen randomly, but with a maximum of 3 s. After the aversive stimulus was released, there was a delay of 15 s before a new stimulus was displayed. In the second test, stimuli associated with the aversive stimulus (with a probability of 60%, red squares), were randomly presented together with new stimuli (green squares), which were never associated with the aversive stimulus. In these two tests, the subjects were asked to fixate on a central fixation point. The latency was calculated from the mean delay between the stimulus presentation and the onset of the SC response (within a window of 1–4 s after the stimulus); see Figure 2.
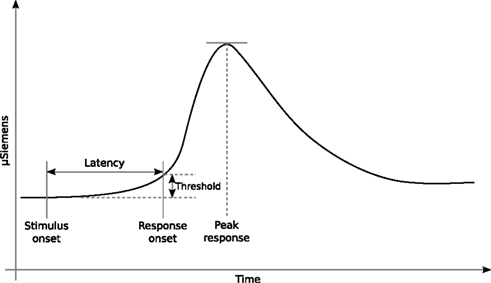
Figure 2. Schematic representation of a skin conductance response (SCR). The skin conductance level starts to increase after a few seconds following the stimulus onset, and this delay between the stimulus onset and the response onset is called the “latency.” From the results of two short tests taken at the beginning of the experiment, we extracted the value for the latency of each subject. In the data analysis for the main experiment, we calculated the stimulus onset time from the response onset detected and the known latency value.
Among our subjects, we measured a mean latency of 2.1 s (SD = 0.61). We consider this measure to be consistent with those of previous studies. Boucsein (1992, p. 188) noted, inter alia, mean latencies from 1.4 s (SD = 0.71) reported by Venables and Christie (1980), to 2.9 s (SD = 0.71) reported by Rachman (1960). SCR characteristics depend not only on the subject’s sudomotor system, but also on the temperature of the room and the recording site.
The idea of the analysis was to detect the SCR onset, and by knowing the SCR latency of each subject (from the two short tests described above), to characterize the predator–prey situation when SCR was triggered, i.e., at the stimulus onset. The analysis was performed on the filtered SC measurements (bandpass filtered with a first-order Butterworth filter and cutoff frequencies of 5 and 0.0159 Hz; Bach et al., 2009). The criterion to be counted as an SCR was an increase in SC that exceeded the threshold of 0.1 μ Siemens from one data point to another (i.e., in 15 ms, which means 1 frame at 60 Hz), and to have been triggered during a trial, which means before the aversive stimulus (when there was one). The SCRs were then characterized in a function involving the angular size of the predator at the stimulus onset. The range of angular sizes of the predator was decomposed into bins, and the number of SCRs per bin was counted and normalized to the number of occurrences of the bin value (throughout the whole condition). The distribution of angular sizes at the stimulus onset could be characterized by its maximum, and because we could calculate only one maximum per subject per condition, we used the bootstrap method (random resampling with replacement from the original dataset, and with a size equal to that of the original dataset) (Efron and Tibshirani, 1993) for each condition (before normalization). Using pairs of conditions, we used a t test to compare the means of the maxima of distributions obtained from 100 resamples.
Results
Experiment 1
In this experiment, we wanted to determine the depth cue(s) that is(are) most involved in the emotional reactions of the defensive system, by manipulating the availability and nature of the depth cues in the presentation of the stimuli. We used three conditions: the F condition, VO condition, and PO condition.
Figure 3A shows the angular size distribution at stimulus onset for each condition and each subject. Comparison of the three conditions with a two-samples t test did not show any significant difference between the conditions [F VO t(998) = −1.438, SD = 2.528, p = 0.151; F PO t = 0.358, SD = 3.531, p = 0.720; PO VO t = −1.511, SD = 3.242, p = 0.131] see Figure 3B. Contrary to our expectations, none of the cues manipulated in this experiment seemed to have played a particular role in the activation of the defensive system. Neither the vergence nor the linear perspective seemed to be the dominant cue involved in this mechanism. From these results, we cannot even affirm that vergence was actually used by the defensive system to trigger an adaptive behavior when the subject was faced with an approaching threat. The results we observed (a common pattern of responses across the conditions) were probably attributable to the action of the angular size cue, which was present in all of the F, VO, and PO conditions. The angular size cue seems to have been the dominant cue. To understand better the involvement of the angular size cue and to verify whether vergence was involved in the activation of the defensive system, we conducted experiment 2.
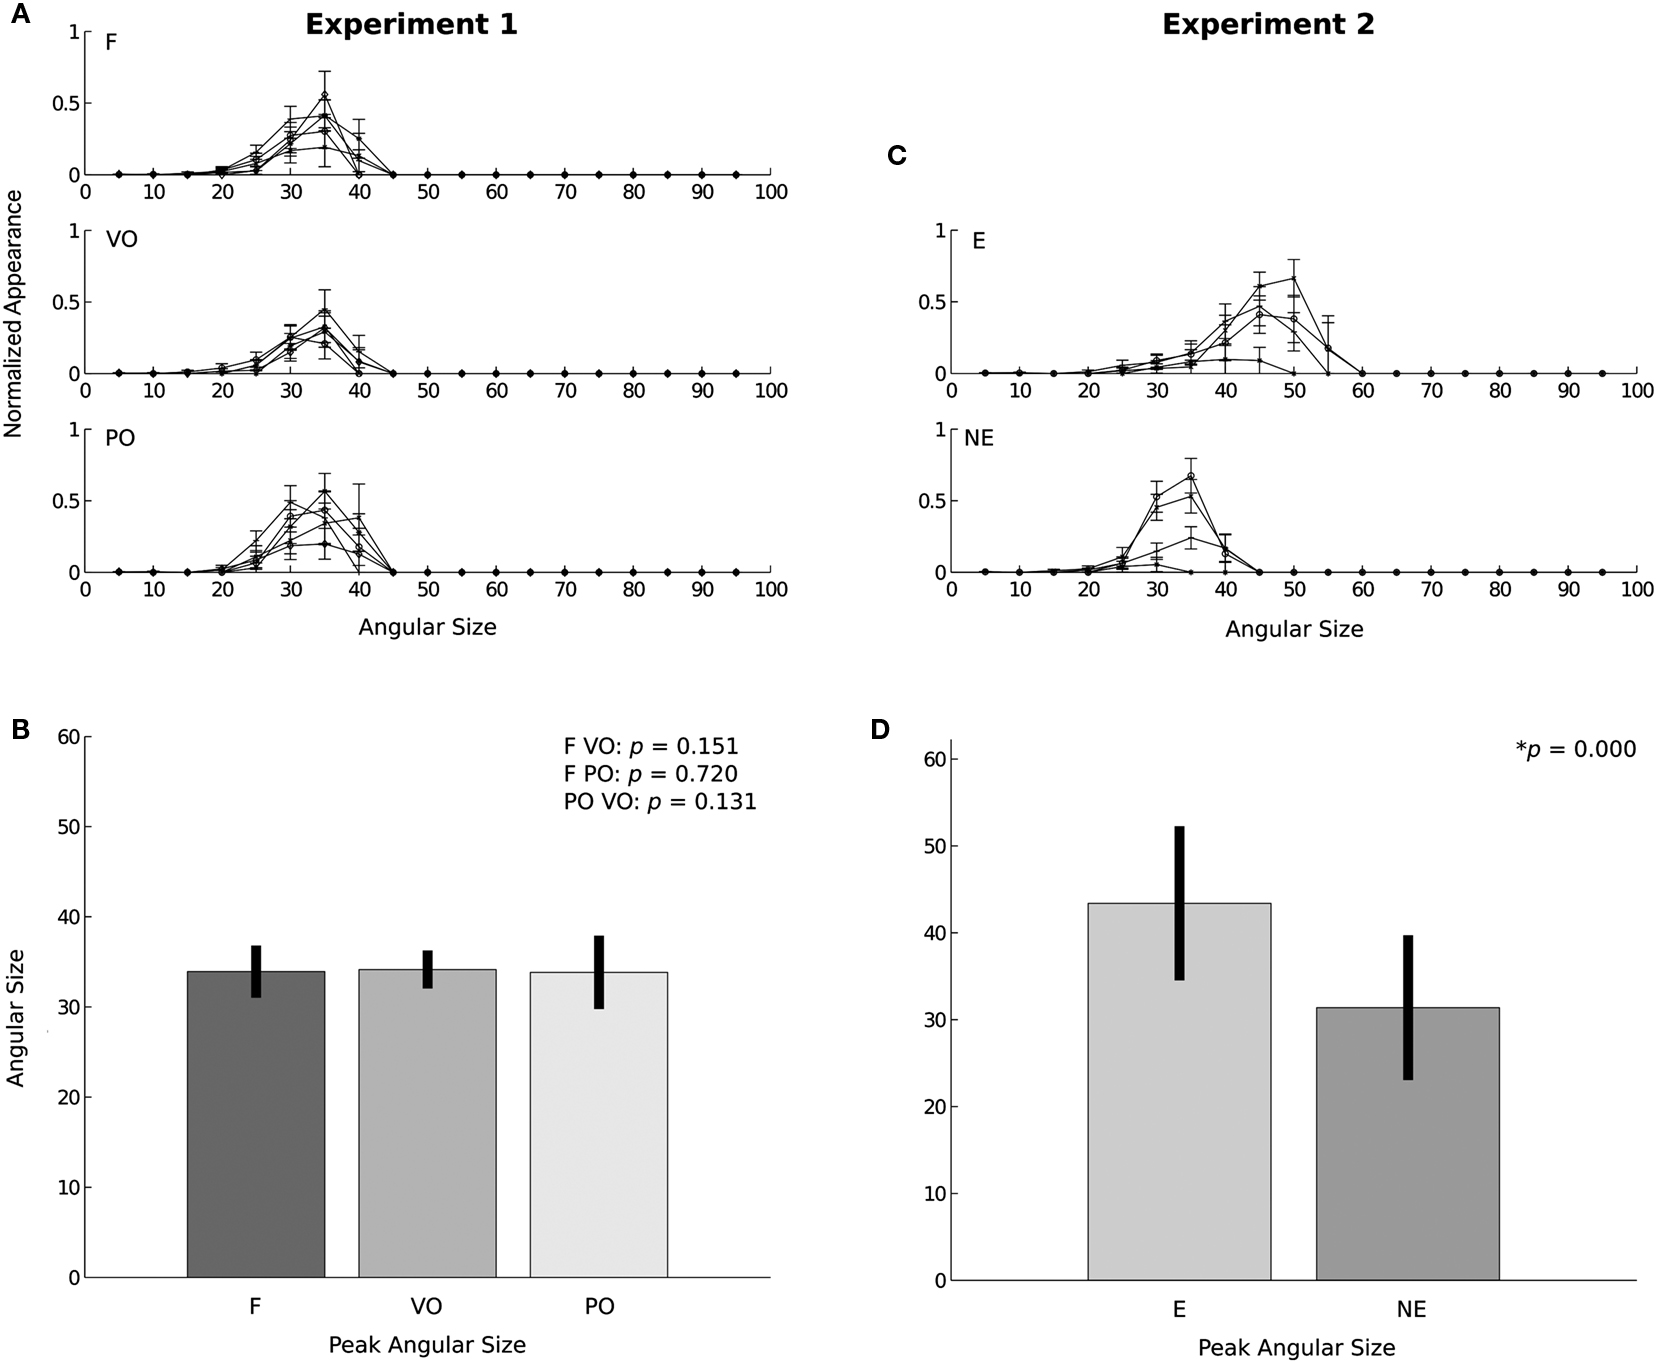
Figure 3. Results. (A,C) Distributions of the maxima obtained from the bootstrapped samples and the SD for each subject grouped according to the conditions applied, for experiment 1 and experiment 2, respectively. (B,D) Statistical differences in the means of the distributions of the maxima and SD for experiment 1 and experiment 2, respectively.
Experiment 2
The objective of the second experiment was to create a conflict between the oculomotor signal of absolute distance (the vergence) and the angular size cue. Therefore, we devised a condition in which the oculomotor signal indicated that the predator was static, i.e., a situation in which the imminence of contact with the danger was not increasing, and at the same time, the angular size expansion indicated that the predator was approaching, the E condition. Figure 3C shows the angular size distribution at stimulus onset for the NE and E conditions of experiment 2. The peak SCRs occurred at significantly larger angular size values in the E condition than in the NE condition [t(798) = 18.233, SD = 9.443, p = 0.00]; see Figure 3D (for one subject, the peaks were very low, but still followed the same pattern of responses). This clear effect of the conflict between the vergence and angular size cues indicates that the oculomotor signals from vergence were not ignored by the defensive system.
Discussion
In the two experiments, we observed that the perception of the defensive distance and the activation of the defensive system (defined by the switch to the circa-strike phase) depended more on the angular size of the predator’s shape than on the distance information derived from the vergence or the perspective. However, vergence is clearly involved in this activation, because when a conflict was introduced between the angular size and the vergence, the response pattern was altered. We chose to focus on the oculomotor signals (vergence) driven by the absolute disparity, but to complete our knowledge, the perspective cue (and others) should be tested in the conflict situation.
A 2-D preexperiment (in which the protocol of Mobbs et al. (2007, 2009) was reproduced, except for the functional magnetic resonance imaging part) showed us that even in two dimensions, there are more SCRs when the predator is near to the prey (this result is consistent with the result of Mobbs et al., 2009). However, in situations where the danger is imminent, the quantity of SCRs in the 2-D preexperiment was much lower than the quantity of SCRs triggered during condition F in experiment 1 (among 30 trials: 19.5 SCRs in 2-D and 47.5 SCRs in the F condition, on average). Therefore, we assumed that the 3-D situation triggers more emotion than the 2-D situation. We think this is because the 3-D situation is more ecological, or in other words, more realistic, at least emotionally, than the third-person view, and hypothetically, because of the absolute distance assessments. The last point is precisely what the present study intended to investigate: the role of different depth cues in the activation of the defensive system, and in particular, the involvement of the vergence signals.
We observed that the angular size cue was strongly involved in the activation of the defensive system, which is consistent with the study of De Cesarei and Codispoti (2006), who showed that the stimulus size affects the early process of emotional perception (although that study (De Cesarei and Codispoti, 2006) was not conducted in 3-D). Indeed, in our first experiment, regardless of the presence or absence of the linear perspective cue, and more surprisingly the vergence cue, the emotional responses of our subjects were always the same.
This similarity of results remind us of Gibson’s ecological theory of visual perception, which claims that the optical array (the optic flow) provides all the necessary information about the observer’s and object’s movements in the environment. Gibson (1958) described the flight from a predator as the minimization of the expansion of the contours of the predator’s shape, and when this expansion increases while the surrounding field contracts, the prey animal is about to be caught. Therefore, we can define our 3-D experimental conditions in terms of the contraction and expansion of the environment and of the predator. Condition F of experiment 1 can be redefined as the contraction of the environment and the expansion of the predator (the speed of this expansion is dependent on the ability of the subject in the motor task, and therefore on the relative speed and the absolute distance). The PO condition presents the same features as the F condition. However, the VO condition presents only the expansion characteristics of the predator shape, and the contraction of the environment is impossible to perceive because the ground is not represented and the rest of the environment is uniformly gray. According to Gibson’s definition of flight, the association between the expansion of the predator and the contraction of the environment seems to be necessary, whereas we observed the same results in the VO condition as in the F and PO conditions; so we propose that in our experimental context, the expansion of the predator shape is sufficient to elicit the adaptive behaviors during a chase. Therefore, based on this last point, we consider that this is comparable with the tau hypothesis in time-to-contact studies. Lee (1976) has demonstrated that the time-to-contact evaluation is based on optical variables (contained in the optical array), and in particular on the rate of dilatation of the retinal image of the obstacle, to which tau is inversely proportional. Lee bases his tau theory on optical variables, but he mentions the fact that additional information, such as eye movements and position, might also be used, although he assumes that they are not necessary, claiming that the optical variables are more efficient.
However, with experiment 2, we demonstrated that vergence is, as we expected, actually involved in the activation of the defensive system, because when this cue signaled that the predator was not approaching, it had the effect of delaying the emotional response. In this experiment, the expansion trials (E condition) presented the same expansion characteristics as the non-expansion trials (NE condition), so according to Gibson’s view of perception, the results should have been identical. Contrary to his prediction, we did not see equivalent results. The combination of the size information and the oculomotor signals (from vergence) resulted in a specific emotional response pattern, which suggests the existence of an internal process to combine the two types of information, and thus is opposite to the gibsonian approach. Nevertheless, we should also mentioned that our task interaction (key pressed and moving backward) contribute to reduce the ecological validity. However, the two criterions we mentioned in introduction, the first-person view and the possibility to perceived the depth of the scene, led to a situation as ecologically valid as possible with our system.
The optic flow information (in terms of size expansion) was not the only information that the visual system took into account in interacting with the surrounding environment: the optic flow information has been combine to the eye movement information to lead to a specific response pattern. We conclude that the extra-retinal information from vergence was involved in the defensive system mechanisms; in particular, the vergence signals were powerful enough to delay the responses when they indicated that the danger was not approaching, even when the angular size indicated the contrary situation. Therefore, vergence is a highly reliable absolute distance cue for the activation of the defensive system, which can be added to the angular size information to estimate the absolute distance of a predator.
Indeed our findings of this study are consistent with the study of Heuer (1993) in the time-to-contact field. Heuer showed that the perception of motion in depth and time-to-contact depend strongly on size variations, but also on variations in vergence. More precisely, Heuer’s study (Heuer, 1993) showed that when size information and vergence information are in conflict, the time-to-contact estimates are more influenced by the former information than by the latter information, but when both types of information are combined, the estimates are more precise. A previous study of Heuer (1987) focused on apparent motion in depth, and showed that size and vergence cues seem to be used in a summation model (as Regan and Beverley, 1979 described) when the information from these two cues is consistent or in only slight conflict. However, when the conflict between the size and vergence information increases, the information that is inconsistent with the movement is canceled. In our experiment, we had two conditions in which angular size and vergence were in conflict: the PO condition, in which the vergence distance was constant and corresponded to the distance between the observer and the screen, and the E condition, in which the vergence was first consistent with the movement and then became inconsistent with it. In the former condition, the vergence information may have been canceled if it were considered highly inconsistent, whereas the second condition may exemplify the summation of the two types of information, probably because the conflict was considered small or because at the beginning of the trial, the vergence was actually consistent with the movement, so it becomes difficult for the visual system to cancel the vergence information. This should also mean that if vergence information is unavailable (for example, in a stereoscopic device, if the subjects cannot merge the right and left images, as is the case in diplopia) or for objects that are not fixated by the observer, the defensive system alarm must rely only on the angular size information.
The induction of the somatic state of fear, which is involved in the activation of the defensive system, arises from retinal information about the angular size of the threat and from the extra-retinal information about the absolute distance from it, the vergence. The angular size information seems to dominate this activation, but vergence also plays a role if the information from that cue is consistent with the movement or has been consistent with it, or indicates only slight conflict. However, in situations in which the conflict is large, the vergence information seems to be canceled.
Conflict of Interest Statement
The authors declare that the research was conducted in the absence of any commercial or financial relationships that could be construed as a potential conflict of interest.
Acknowledgments
We would particularly like to thank Dr. Zenas C. Chaos for his very great help with the data analysis. This work was funded by Japan Society for the Promotion of Science grant FY09800 to the first author.
References
Bach, R., Flandin, G., Friston, K., and Dolan, R. (2009). Time-series analysis for rapid event-related skin conductance responses. J. Neurosci. Methods 184, 224–234.
Billington, J., Wilkie, R., Field, D., and Wann, J. P. (2011). Neural processing of imminent collision in humans. Proc. R. Soc. B 278, 1476–1481.
Blanchard, D. C., and Blanchard, R. J. (2008). “Defensive behaviors, fear, and anxiety,” in Handbook of Behavioral Neuroscience, Vol. 17, eds R. Blanchard, D. Blanchard, G. Griebel, and D. Nutt (Amsterdam: Elsevier), 63–79.
Bruce, V., and Green, P. (1985). Visual perception: physiology, psychology, and ecology. Hillsdale, NJ: L. Erbaum.
Chaturvedi, V., and Van Gisbergen, J. A. M. (2000). Stimulation in the rostral pole of monkey superior colliculus: effects on vergence eye movements. Exp. Brain Res. 132, 72–78.
De Cesarei, A., and Codispoti, M. (2006). When does size not matter? Effects of stimulus size on affective modulation. Psychophysiology 43, 207–215.
Efron, B., and Tibshirani, R. (1993). An Introduction to the Bootstrap. Boca Raton, FL: Chapman & Hall/CRC.
Fanselow, M. (1994). Neural organization of the defensive behavior system responsible for fear. Psychon. Bull. Rev. 1, 429–438.
Gibson, J. J. (1958). Visually controlled locomotion and visual orientation in animals. Br. J. Psychol. 49, 182.
Guitton, D. (1999). Gaze shifts in three-dimensional space: a closer look at the superior colliculus. J. Comp. Neurol. 413, 77–82.
Heuer, H. (1987). Apparent motion in depth resulting changing size and changing vergence. Perception 16, 337–350.
Heuer, H. (1993). Estimates of time to contact based on changing size and changing target vergence. Perception 22, 549–563.
Lee, D. N. (1976). A theory of visual control of braking based on information about time-to-collision. Perception 5, 437–459.
Low, A., Lang, P. J., Smith, J. C., and Bradley, M. M. (2008). Both predator and prey emotional arousal in threat and reward. Psychol. Sci. 19, 865–873.
Mobbs, D., Marchant, J. L., Hassabis, D., Seymour, B., Tan, G., Gray, M., Petrovic, P., Dolan, R. J., and Frith, C. D. (2009). From threat to fear: the neural organization of defensive fear systems in humans. J. Neurosci. 29, 12236–12243.
Mobbs, D., Petrovic, P., Marchant, J. L., Hassabis, D., Weiskopf, N., Seymour, B., Dolan, R. J., and Frith, C. D. (2007). When fear is near: threat imminence elicits prefrontal-periaqueductal gray shifts in humans. Science 317, 1079–1083.
Keywords: vision, depth perception, emotion, 3-D environment
Citation: Combe E and Fujii N (2011) Depth perception and defensive system activation in a 3-D environment. Front. Psychology 2:205. doi: 10.3389/fpsyg.2011.00205
Received: 20 May 2011; Accepted: 11 August 2011;
Published online: 31 August 2011.
Edited by:
Beatrice De Gelder, Donders Institute, NetherlandsCopyright: © 2011 Combe and Fujii. This is an open-access article subject to a non-exclusive license between the authors and Frontiers Media SA, which permits use, distribution and reproduction in other forums, provided the original authors and source are credited and other Frontiers conditions are complied with.
*Correspondence: Emmanuelle Combe, Laboratory for Adaptive Intelligence, 2-1 Hirosawa, Wako, Saitama 351-0198, Japan. e-mail:ZW1tYW51ZWxsZS5jb21iZUBnbWFpbC5jb20=